1. Introduction
According to the findings in the World Energy Outlook 2023 by the International Energy Agency (IEA) [
1], global energy demand has continued to rise steadily in recent decades, with a slight decline in 2020 attributed to the impacts of the COVID-19 pandemic. However, despite the ongoing effects of the pandemic, energy demand resumed its upward trajectory in 2021. Fossil fuels remain the primary source of energy production worldwide, a trend also reflected in the power generation sector, where approximately two-thirds of energy comes from fossil-fuel-based sources [
2].
This ongoing reliance on fossil fuels for energy generation presents significant concerns, particularly sustainability. The first major problem is the risk that fossil-fuel reserves will soon run out if current consumption patterns persist [
3]. The second concern involves environmental impacts, notably Greenhouse Gas (GHG) emissions [
2]. The widespread emission of pollutants, particularly greenhouse gases, is directly tied to the heavy reliance on fossil fuels, both as fuels for combustion and as raw materials for energy production [
4,
5].
These challenges emphasize the urgent need for renewable energy sources to replace or reduce dependence on fossil fuels [
5]. This is especially critical in the context of electricity generation. Failure to integrate renewable energies would make achieving ambitious CO
2 reduction targets impossible, particularly given the growing share of electricity in total energy consumption across nations [
6]. The proportion of electricity in overall energy demand is projected to exceed 30% in many countries in the near future [
1].
From both environmental and strategic perspectives, energy independence is a key consideration. In this context, adopting renewable energy systems offers a promising solution. Several studies, such as those conducted by Blanco et al. [
7] and Berna-Escriche et al. [
8], have focused on the potential for renewable energy in different regions. However, while renewable energy plays a central role in power generation, it also introduces challenges, primarily due to the inherent variability of these energy sources [
9,
10].
Solar Photovoltaic (PV) is one of the most promising renewable energy sources for meeting current energy demands and is characterized by significant fluctuations, including day–night solar cycles, seasonal cycles, and inclement weather. As a result, relying on this source requires the deployment of oversized systems and extensive storage capabilities to store surplus energy for later use. Despite these storage measures, some excess energy remains inevitable, though manageable within this context. Therefore, the optimal configuration for generation and storage must be determined based on economic factors, ensuring that power generation and storage capacities are appropriately sized to meet energy needs at the lowest possible cost. Additionally, the implementation of large-scale storage systems (e.g., pumped storage, mega-batteries) and widespread generation capacities (wind and/or solar PV) presents further challenges, particularly in island contexts where suitable sites for such installations are scarce [
3,
7].
1.1. Issues of Electric Vehicles
Among the various contributors to GHG emissions, the transportation sector is a prominent source, accounting for almost a quarter of global carbon dioxide emissions [
11]. Historically, transportation has been almost entirely dependent on fossil fuels, but transitioning to cleaner alternatives is fundamental to reducing emissions. The trend is moving towards electrification, particularly in light-duty vehicles, including private and public transport. Other sectors, such as heavy land and maritime transport, energy-intensive industries, and air travel, will likely transition towards electrification or alternative energy carriers like hydrogen [
12,
13]. Numerous studies have explored the potential for Electric Vehicles (EVs) to play a key role in this transition, with many highlighting the potential impact of widespread EV adoption on the electrical grid, creating new challenges [
14]. In response, recent research has suggested several approaches to mitigate the impact of EVs on grid stability [
15,
16]. As has been highlighted in several research studies [
17,
18,
19], several issues and challenges in the strong penetration of EVs are expected to occur, such as modeling charging infrastructures, optimizing aspects, load shifting, etc.
However, allowing EV charging to depend entirely on the unpredictable nature of consumer behavior poses significant risks, especially given the substantial increase in final demand that EVs represent [
20]. A worst-case scenario would occur if EVs were charged at random times throughout the day, particularly with the use of semi-fast or fast chargers. For example, if these chargers were made more affordable or the cost of charging at public stations was reduced, users could charge their vehicles at their convenience. This would exacerbate the difference between peak and off-peak demand periods and necessitate increased backup generation and substantial upgrades to transmission and distribution networks to accommodate these shifts in demand [
21]. Moreover, another likely scenario arises when consumers, without a charge management system, charge their vehicles during peak demand periods, such as when they return home from work.
A study by Mao et al. [
22] addresses the complexity of EV charging patterns, highlighting their randomness compared to traditional electrical load profiles. Given the relatively low contribution of EVs to total demand and their recent emergence, no specific measures have yet been implemented to regulate these charging activities. Unregulated charging could lead to significant overlaps between EV charging and peak load times, potentially resulting in dramatic increases in demand peaks over the coming years. To avoid such issues, scheduling strategies that prevent charging during these peak times and reduce the risk of grid overloads can be implemented [
20]. While there has been considerable research on the effects of EVs on the grid, fewer studies have focused explicitly on scheduling charging activities. For instance, a study conducted in New Zealand [
23] explores the hourly restrictions that should be applied to private and public EVs and electric buses. Another investigation by Limmer and Rodemann [
24] discusses reprogramming charging schedules based on dynamic pricing, with a case study conducted in Germany. Additionally, Shang et al. [
25] propose a Vehicle-To-Grid (V2G) system that integrates renewable energy and edge computing, with each charging point featuring computing and storage capabilities to handle sensitive EV data and optimize charging schedules. Their system is designed with an efficient algorithm that offers six charging modes, aiming to maximize photovoltaic self-consumption through EV charging and reduce demand peaks while filling load valleys.
Recent studies have underscored the importance of smart charging strategies to better integrate Photovoltaic (PV) systems and EVs into the broader energy system. One such study [
26] focuses on smart charging, emphasizing its potential to enhance the interaction between PV, EVs, and overall electricity consumption. The review outlines various configurations and algorithms for smart charging, from centralized to decentralized control approaches, tailored to different settings such as homes and workplaces. In a related study, Fachrizal et al. [
27] also present an optimal design framework for PV–EV systems tailored explicitly to workplace charging stations. The study introduces a novel metric called the Self-Consumption-Sufficiency Balance (SCSB), which evaluates the balance between Self-Consumption (SC) and Self-Sufficiency (SS) in PV–EV systems. By optimizing the sizing of PV–EV systems based on the SCSB, the study demonstrates the potential for better load matching, reducing peak loads, and alleviating grid stress.
1.2. Electric Vehicles: A Growing Challenge—Research Aims and Scope
The integration of solar PV energy to meet the growing demand for EV charging is a fundamental step toward decarbonizing transportation systems. While EV adoption can significantly reduce GHG emissions, this environmental benefit depends on charging with clean energy sources, particularly solar PV [
28]. A key challenge lies in the temporal mismatch between PV generation and typical EV charging behaviors, especially for residential users who charge overnight, when solar energy is unavailable. This mismatch creates the need for energy storage solutions and DSM strategies that can help better align consumption with renewable generation [
22,
29].
When analyzing the deployment of EVs, it is fundamental to consider the actual charging behaviors of drivers, as these behaviors will form the foundation of effective charging strategies. EVs exhibit diverse charging patterns, which add complexity to the design of the generation and storage infrastructure [
28,
30]. These behaviors can be classified into various types, with some variations depending on the sources. For instance, many users prefer to charge their vehicles overnight at home, a time when solar energy generation is non-existent. On the other hand, some individuals take advantage of charging points at their workplaces, aligning charging times with daytime solar generation. There are also profiles where users rely on fast-charging stations during peak usage times, which demand large amounts of energy within a short time frame.
Some recent studies have developed comprehensive and important analyses on the deployment of EVs, as well as on the performance and sizing of renewable self-consumption systems. Although they are focused on the analysis of fast charging stations, they have highlighted the importance of the use of stochastic techniques, as well as the importance of distributed generation and self-consumption in these types of installations. The optimal design and effective operation of EV charging stations integrated with renewable energy sources and energy storage systems are areas of research that are highly addressed. Studies like that by Yan and Ma [
31] employed a stochastic optimization for sizing a PV-battery system for charging stations, accounting for uncertainties in EV demand and PV generation to optimize component capacities and operational strategies. Such works highlight the value of stochastic modeling for system sizing in the presence of inherent variability. Complementary to planning, other research focuses on the real-time management and dispatch of power within existing charging station infrastructure. For example, Yin et al. [
32] proposed a decentralized power dispatch strategy for a single charging station utilizing game theory to manage the distribution of available power among EVs and other components in real-time, considering uncertainties in EV behavior and PV output. This approach focuses on operational decisions and ensuring a balanced solution between the charging station and individual EVs. Similarly, studies like Yan et al. [
33] have investigated distributed coordination mechanisms for multiple charging stations, focusing on characterizing aggregate EV power flexibility and optimizing energy trading. While these works address vital aspects such as real-time power distribution, coordination, and operational uncertainties within specified infrastructure capacities, they do not systematically evaluate how active DSM strategies influence the initial long-term planning and sizing requirements of the PV and battery storage systems themselves.
Additionally, with the development of smart charging systems, some users could adjust their charging patterns to better align with the availability of renewable energy. This variety of charging profiles necessitates a flexible and adaptable approach to effectively integrate solar generation with EV consumption. In contrast, most prior studies use a single user category, e.g., workplace commuters in Fachrizal et al. [
27], or simplified load profiles without temporal structure. In contrast, in this work, an aggregated hourly curve is obtained from the different types of user behavior mentioned above. These weighted hourly curves consider seasonal, inter-day, and intra-day variations, so that hourly curves are obtained for an entire year’s performance. All these analyses are performed using advanced statistical techniques. Therefore, it is possible to analyze the global behavior of a geographical area of any size without the need to perform an exhaustive analysis at the level of specific user behaviors or specific EV characteristics, but will rely instead on the statistical analysis of the aggregate behavior of users and their vehicles.
To meet the increasing electricity demand resulting from the widespread adoption of EVs, a substantial increase in installed PV capacity and energy storage systems will be required [
34,
35]. This increase in capacity is vital to ensure that renewable energy is available even during periods of low generation, such as at night. Additionally, storage is essential in compensating for the intermittency inherent in solar generation. Initial estimates suggest that, in order to supply a large-scale EV fleet, the installed PV generation capacity may need to be doubled or tripled, and high-capacity storage systems may need to be implemented [
36,
37]. Therefore, the importance of solar variability or, specifically, weather uncertainty should be considered. However, studies either rely on scenario-based PV profiles, such as Seddig et al. [
38], or do not include uncertainty at all.
A key factor in this context is the synchronization of generation and demand. It is essential to align EV charging with periods of high solar generation [
28]. This can be achieved through advanced load management systems that automatically adjust consumption based on generation levels and dynamic pricing strategies that incentivize charging during optimal energy periods. Moreover, developing distributed generation infrastructure and microgrids could help reduce transmission losses and enable a better match between energy production and consumption [
10,
34].
DSM is another key element for optimizing the electrical system [
28]. Strategies such as scheduled charging can shift demand to times of higher solar generation, thereby reducing the need for nighttime storage. Furthermore, the batteries in EVs could serve a dual role, acting as distributed storage that helps mitigate demand peaks and reduce dependence on stationary batteries [
29,
39]. Integrating artificial intelligence-based prediction technologies could also enable real-time adjustments of EV charging patterns based on anticipated solar generation, enhancing system efficiency [
21]. DSM is often embedded as a predefined “smart charging” algorithm or peak shaving, as proposed by Kumar et al. [
40], but it is rarely analyzed as a flexible, tunable strategy. By applying these DSM strategies, the overall capacity required to reliably meet demand can be reduced, leading to more efficient and cost-effective system designs. In this sense, Fernandez and Pérez [
41] use public-charger scheduling optimization to reduce demand peaks. Their approach emphasizes control logic but does not integrate generation or storage optimization.
In response to these challenges, this study proposes a comprehensive and cost-effective stochastic optimization framework designed to meet an average hourly unit demand for EV charging of 1 MWh, i.e., 8760 MWh/year. The demand curves include six distinct EV charging profiles (residential, workplace, fast-charging, hotel, commercial and regulated parking) and seasonal and weekday/weekend behavioral variations. Moreover, this study proposes the following:
A stochastic technique that utilizes the Best Estimate Plus Uncertainty (BEPU) approach, along with non-parametric methods such as Wilks’ method, is employed to model the variability and uncertainty of solar Photovoltaic (PV) generation. This process involves analyzing 22 years of hourly solar irradiance data to derive weekly Probability Density Functions (PDFs). Sampling these distributions allows the generation of synthetic hourly profiles that effectively capture intra-day, inter-day, seasonal, and interannual fluctuations.
The approach explicitly integrates and quantifies the impact of parametric DSM scenarios (simulating from 0% to 50% shift in EV charging towards daylight hours) on the required sizing of both solar PV capacity and battery storage capacity.
The framework optimizes, based on MATLAB R2023a, the sizing of multiple system components simultaneously within the stochastic context of uncertain weather conditions to minimize the total cost (CAPEX + OPEX). This includes exploring the optimal relationships between solar PV capacity and battery energy storage capacity, while also considering the impact of allowed levels of unmet demand and resulting electrical surpluses.
To achieve the aforementioned goals,
Section 2 outlines the methodology used for this analysis and the scenario of the above-mentioned generation scenario with unitary daily demand. Key findings from the study are presented in
Section 3, accompanied by detailed analysis and discussion. Finally,
Section 4 summarizes the study’s primary conclusions and suggests potential areas for future research.
2. Methodology
This study employs MATLAB to optimize a solar PV system with battery storage across various levels of allowed uncovered demand. The script aims to find the optimal balance between system cost and performance, providing insights into system sizing and economic feasibility.
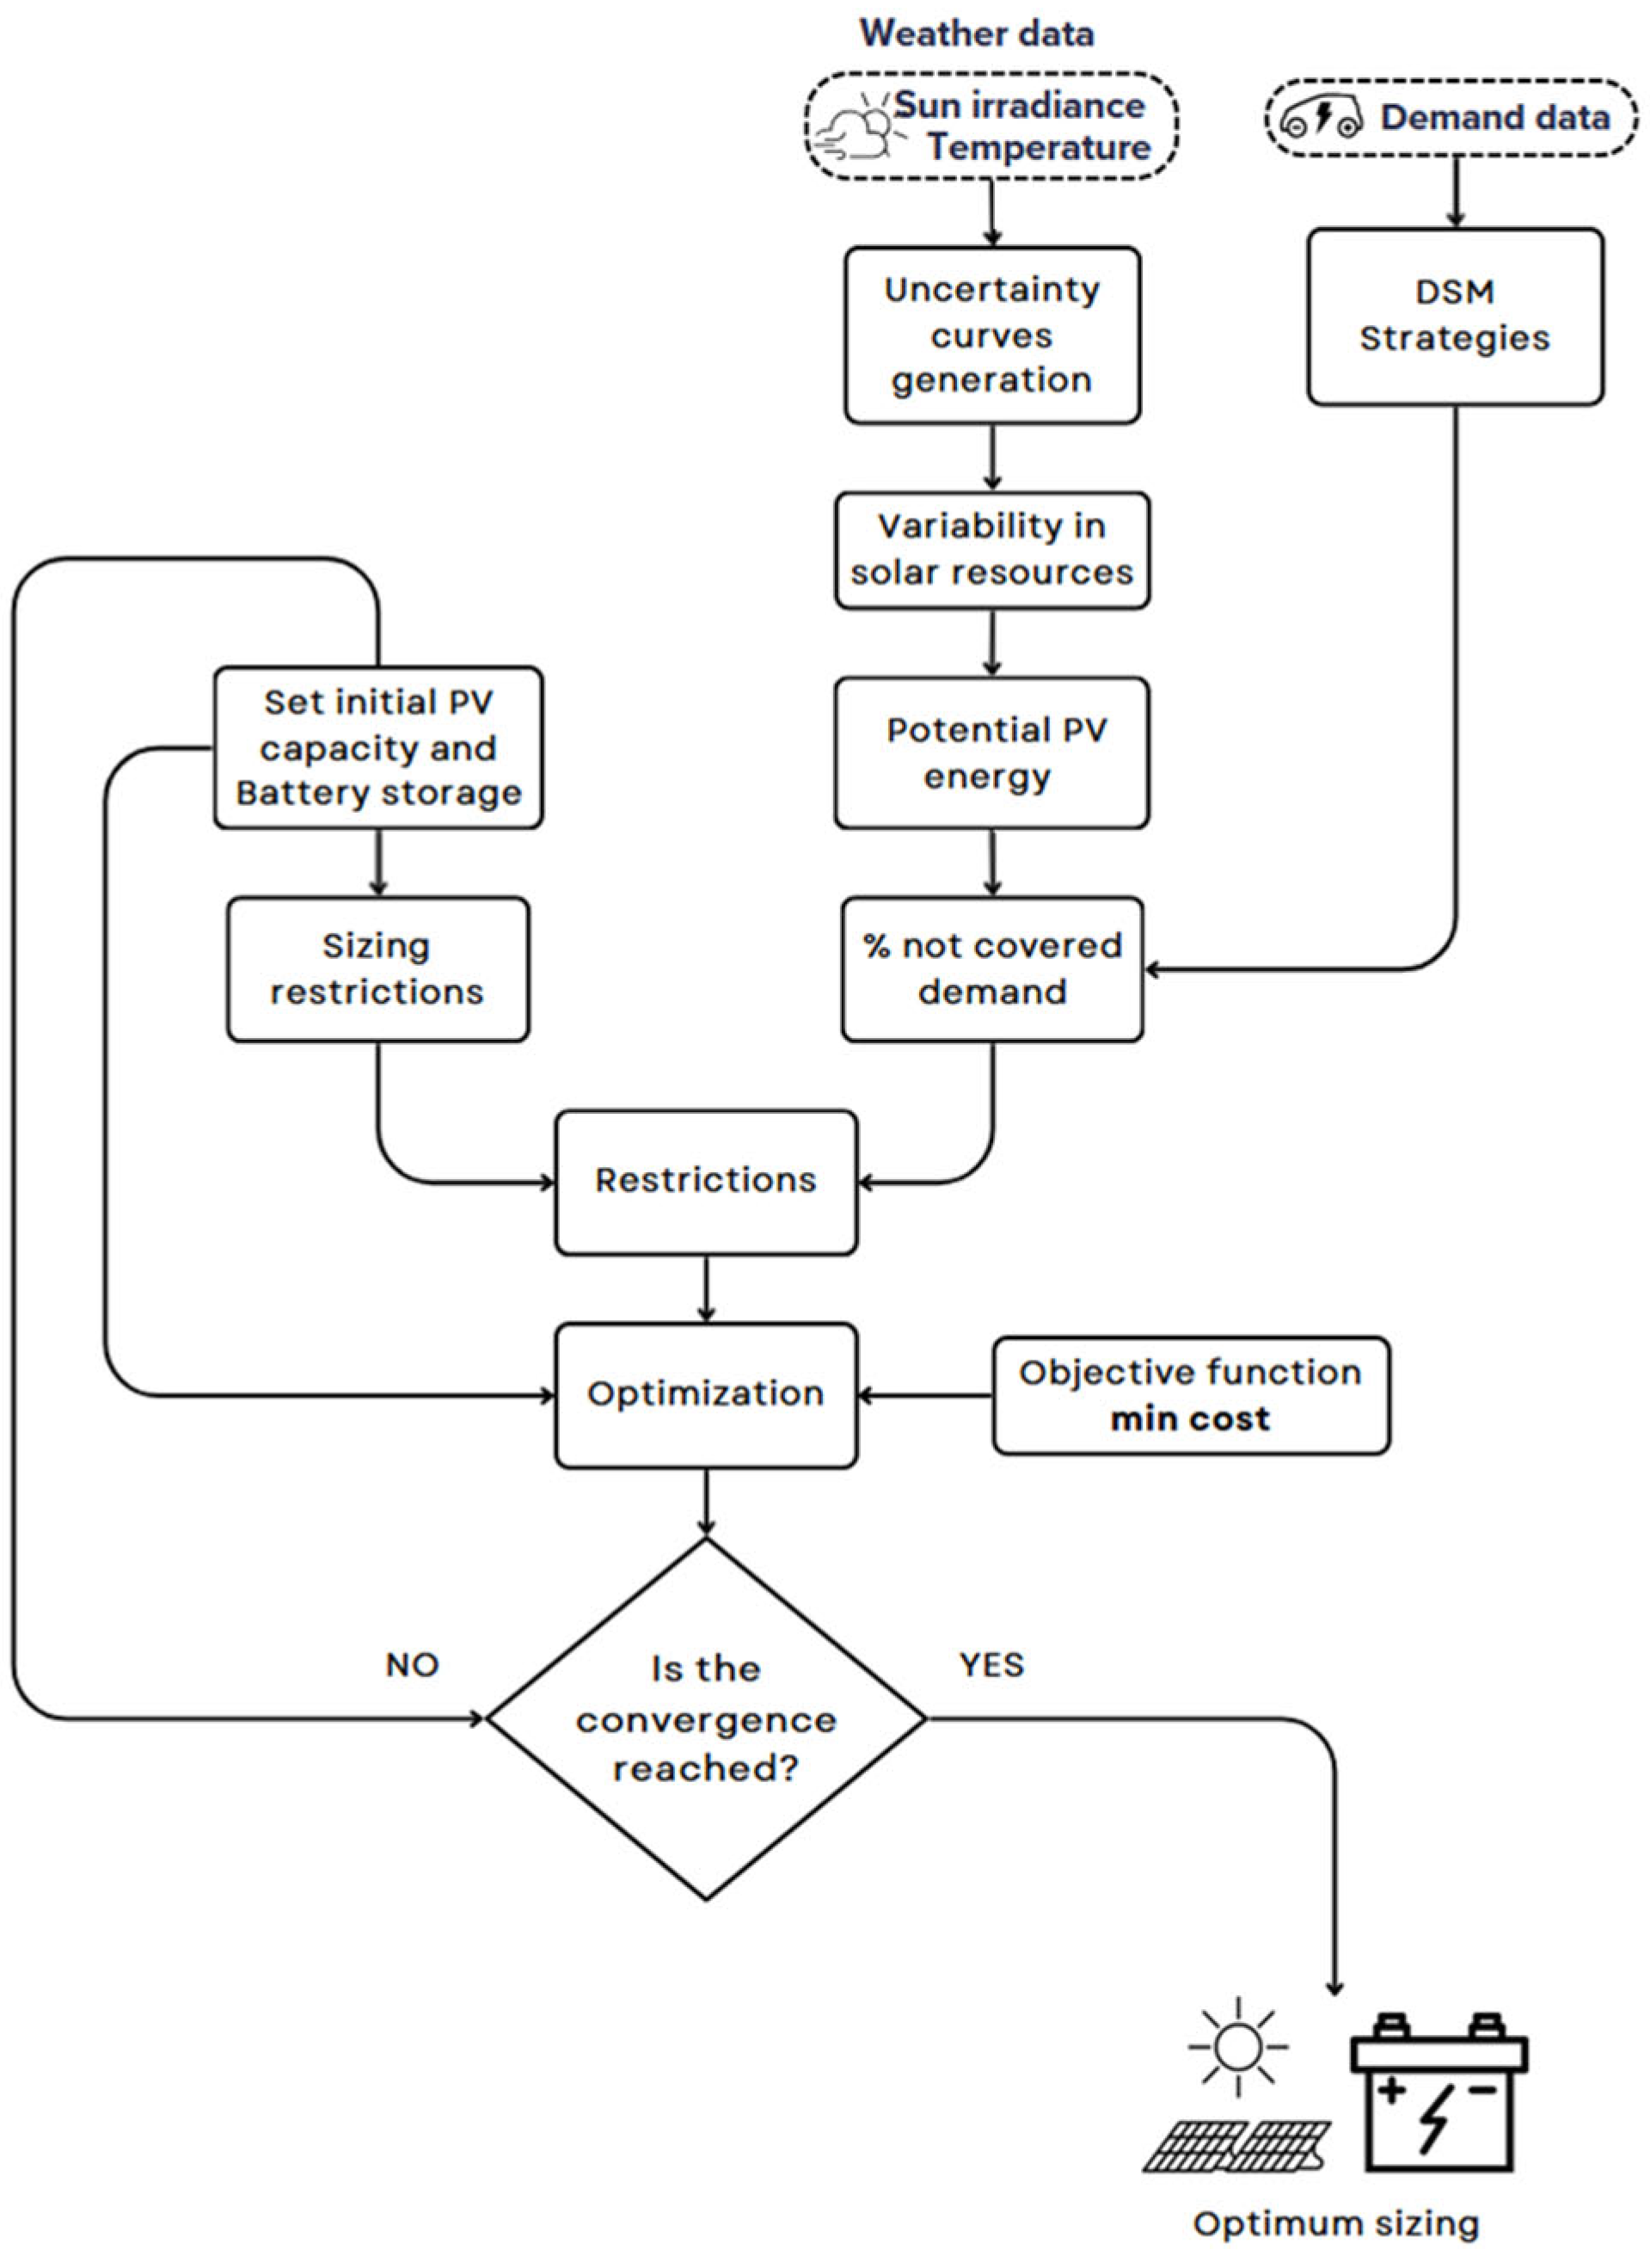
In line with the above, the methodology to be developed consists of the major points drawn in
Figure 1. First, it estimates solar generation capacity using statistical techniques to derive the solar resource’s Probability Density Functions (PDFs), ensuring robust estimations. This approach is framed within the critical need to meet the demand for EVs through solar generation, a key step in the decarbonization of the economy.
The study then considers the diverse charging profiles of EVs and how their widespread adoption alters current electricity demand patterns. This transformation underscores the importance of accurately sizing PV capacity and the required energy storage to ensure system stability.
Furthermore, the research highlights the relevance of aligning generation and demand through management systems, optimizing the use of solar energy. DSM measures and adjustments in PV and battery capacities are fundamental to maximizing efficiency and minimizing the costs associated with this energy transition.
2.1. Uncertainty About Solar Resources
The Best Estimate Plus Uncertainty (BEPU) approach estimates the evolution of output variables while accounting for uncertainty, initially applied in nuclear safety for licensing and assessments [
42]. BEPU integrates deterministic models, which produce fixed outputs under given conditions, and probabilistic models, which quantify uncertainty from system variability. Non-parametric methods, such as Monte Carlo sampling and Wilks’ method, address uncertainty without assuming specific probability distributions, making them useful for complex systems [
43].
Monte Carlo sampling determines output distributions by running numerous simulations with varied inputs, but it is computationally expensive. Wilks’ method offers a more efficient alternative, requiring fewer simulations to calculate tolerance intervals with specified confidence levels [
44,
45,
46]. For example, at 95% coverage and confidence, 59 simulations suffice for one-sided intervals and 93 for two-sided intervals. Despite its versatility, Wilks’ method depends on assumed parameter distributions, which may introduce limitations. Conservative estimates for uncertain variables can mitigate risks.
While Wilks’ method balances efficiency and reliability, higher confidence levels demand more simulations. Practical applications require contingency plans to address unexpected events, ensuring resilience. By integrating uncertainty analysis, BEPU enables a more comprehensive understanding of system behavior, supporting optimal decisions, such as determining the appropriate energy mix, compared to deterministic methods [
35,
47].
In the context of the aforementioned methodology, accounting for the PDFs of the various uncertain input parameters is essential. For weather-related uncertainties, historical solar irradiance data from 2001 to 2022 are obtained through NASA’s POWER Data Access Viewer [
48]. These datasets are generated based on historical data to meet the requirement of 93 datasets for the BEPU analysis. From these historical data, a weekly periodicity has been selected to characterize the solar resource’s annual behavior. Since this periodicity adequately captures the changes in the solar resource along the annual cycle, a weekly periodicity has been selected as an option to characterize the annual behavior of the solar resource [
35,
47].
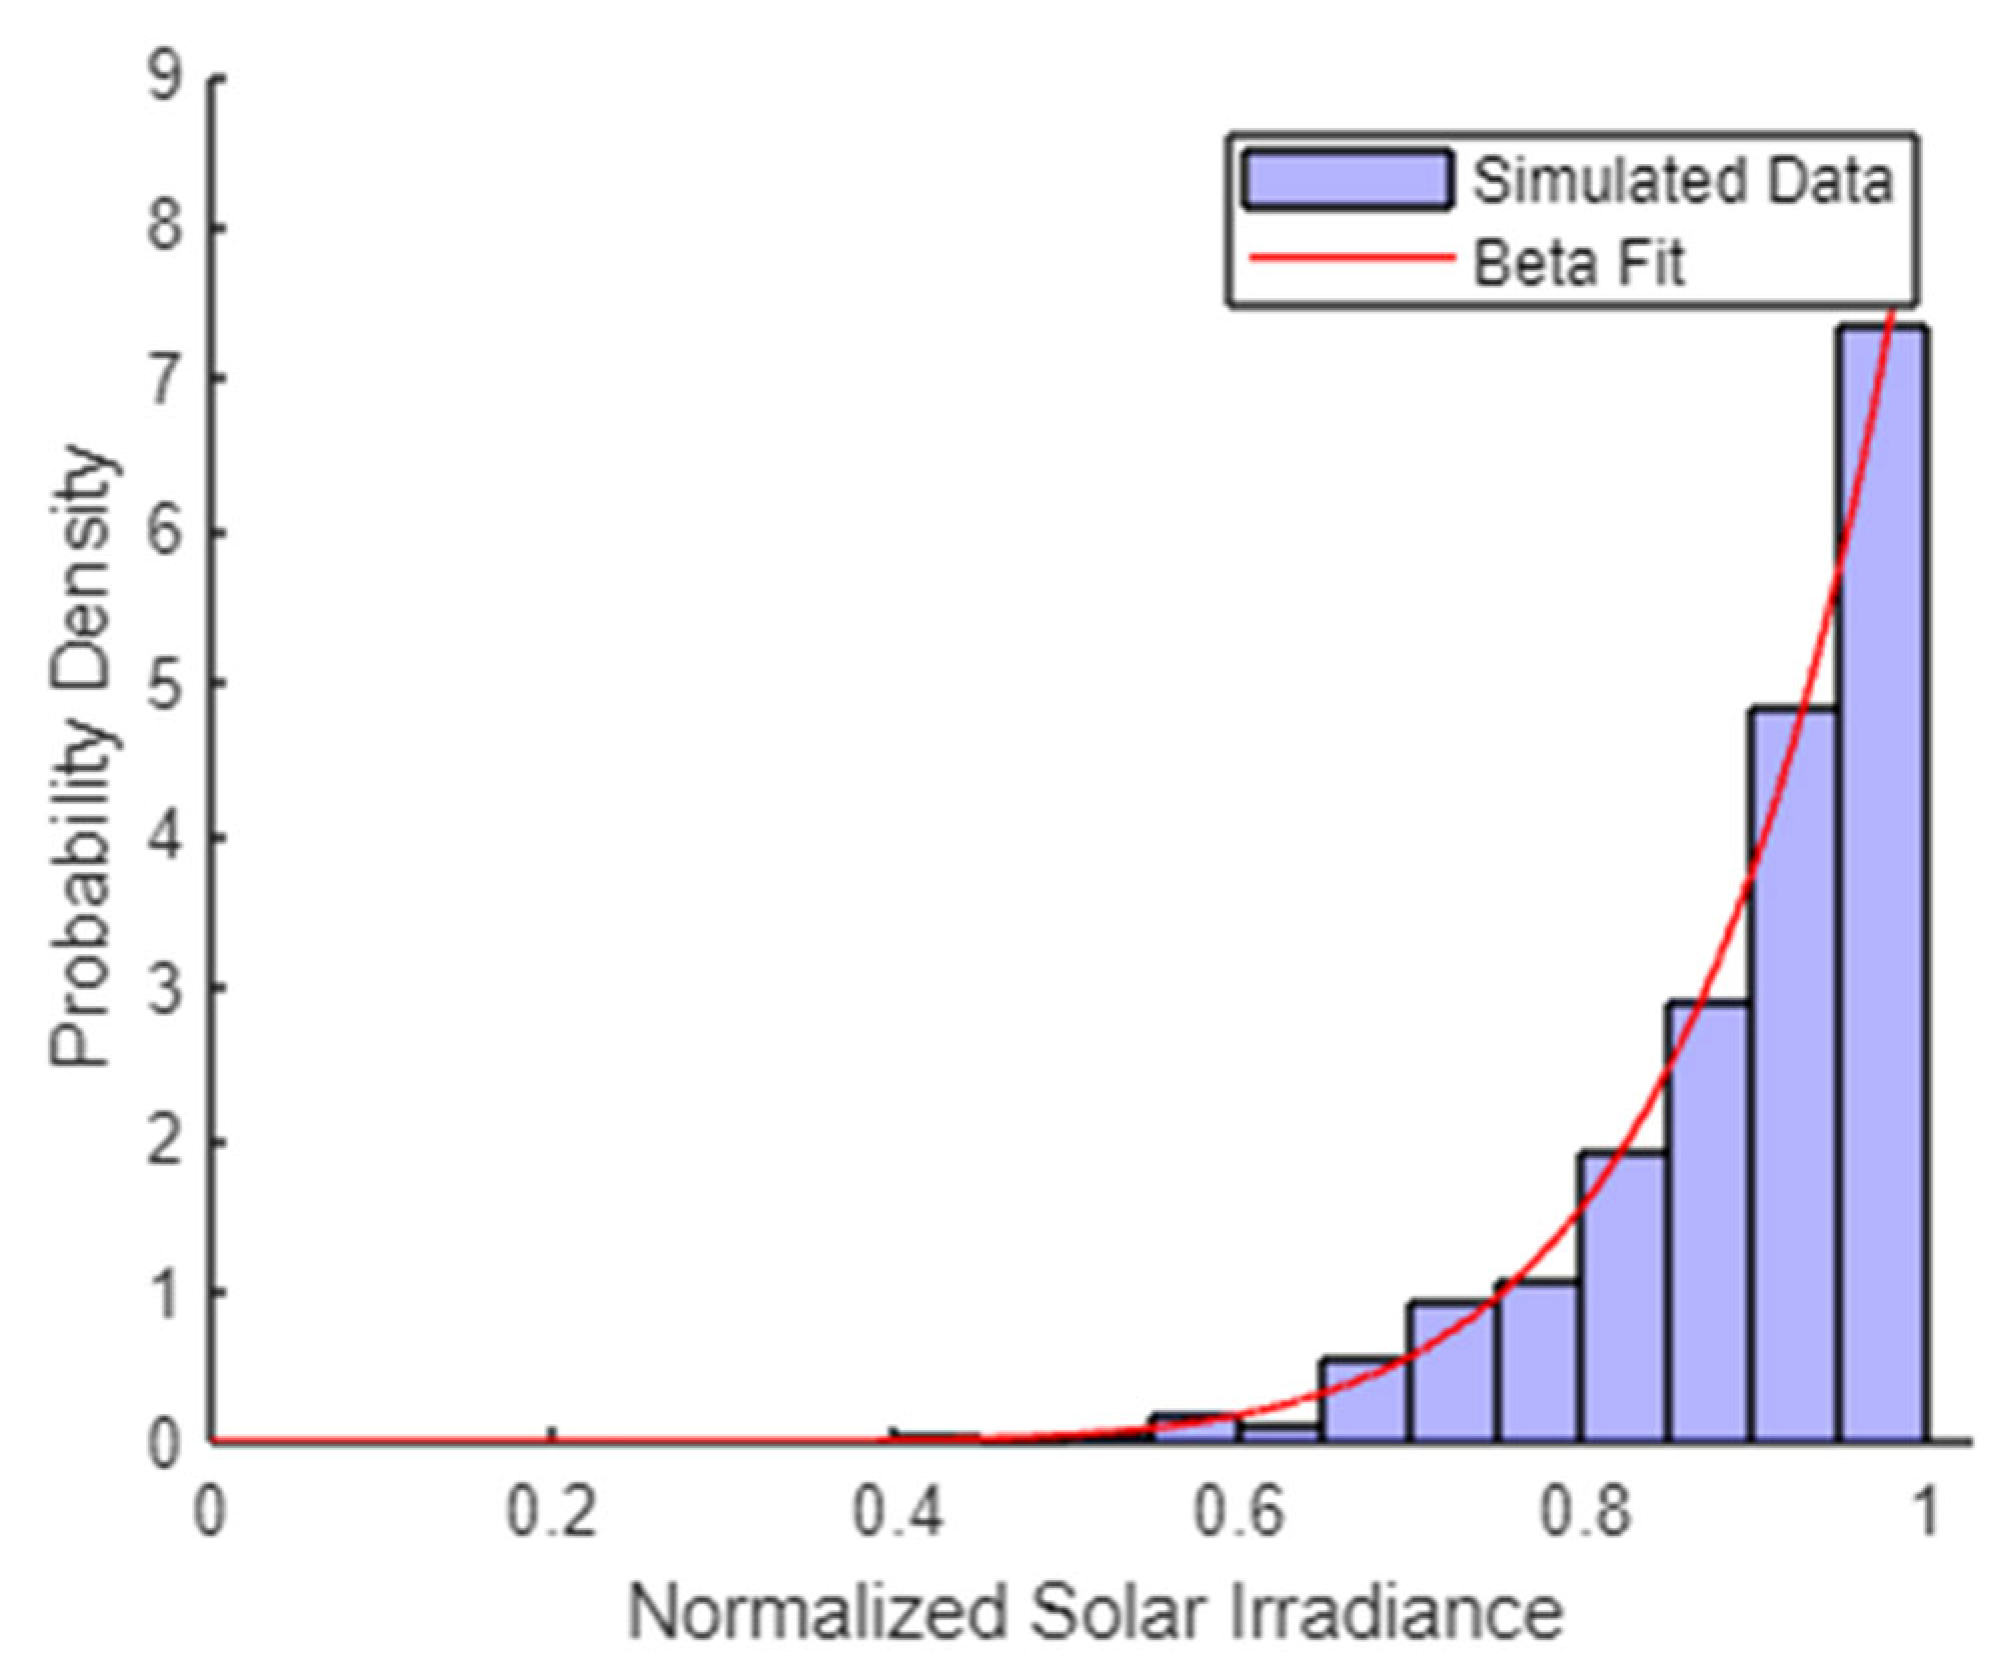
An auxiliary parameter is calculated for each week by normalizing hourly solar irradiance values against their respective maximum hourly values recorded over the 22 years for the same week (
Figure 2). Histograms are then created each week using these auxiliary parameters. The beta distribution is identified as the best fit for solar irradiance. Using these fitted distributions, datasets are generated to model the weekly probabilities of solar irradiance over a year.
By following this procedure, the hourly availability of solar irradiance can be constructed. After randomly selecting the auxiliary parameter from its PDF, it is multiplied by the maximum hourly value recorded during the corresponding week over the 22-year dataset. This produces synthetic hourly availability for renewable resources. Solar resources are sampled daily throughout the year, utilizing their weekly PDF to shape seven artificial days.
While this method captures intra-day variability, it does not explicitly account for transitions or correlations between consecutive hours within a day. The goal is to generate synthetic datasets that replicate solar irradiance’s variability and probability distributions. The resulting output provides an hourly representation of the availability of the renewable resource, incorporating historical data and associated uncertainties.
Table 1 provides a summary of the uncertainties and parameters associated with the solar distributions. The parameter ranges represent the Beta distribution parameters derived from historical datasets, corresponding to the 52 distinct distributions obtained (weekly solar irradiance PDFs based on historical data). The Beta distribution has been employed to model the variability of solar irradiance, effectively capturing the probability distribution of sunlight reaching a specific area over time.
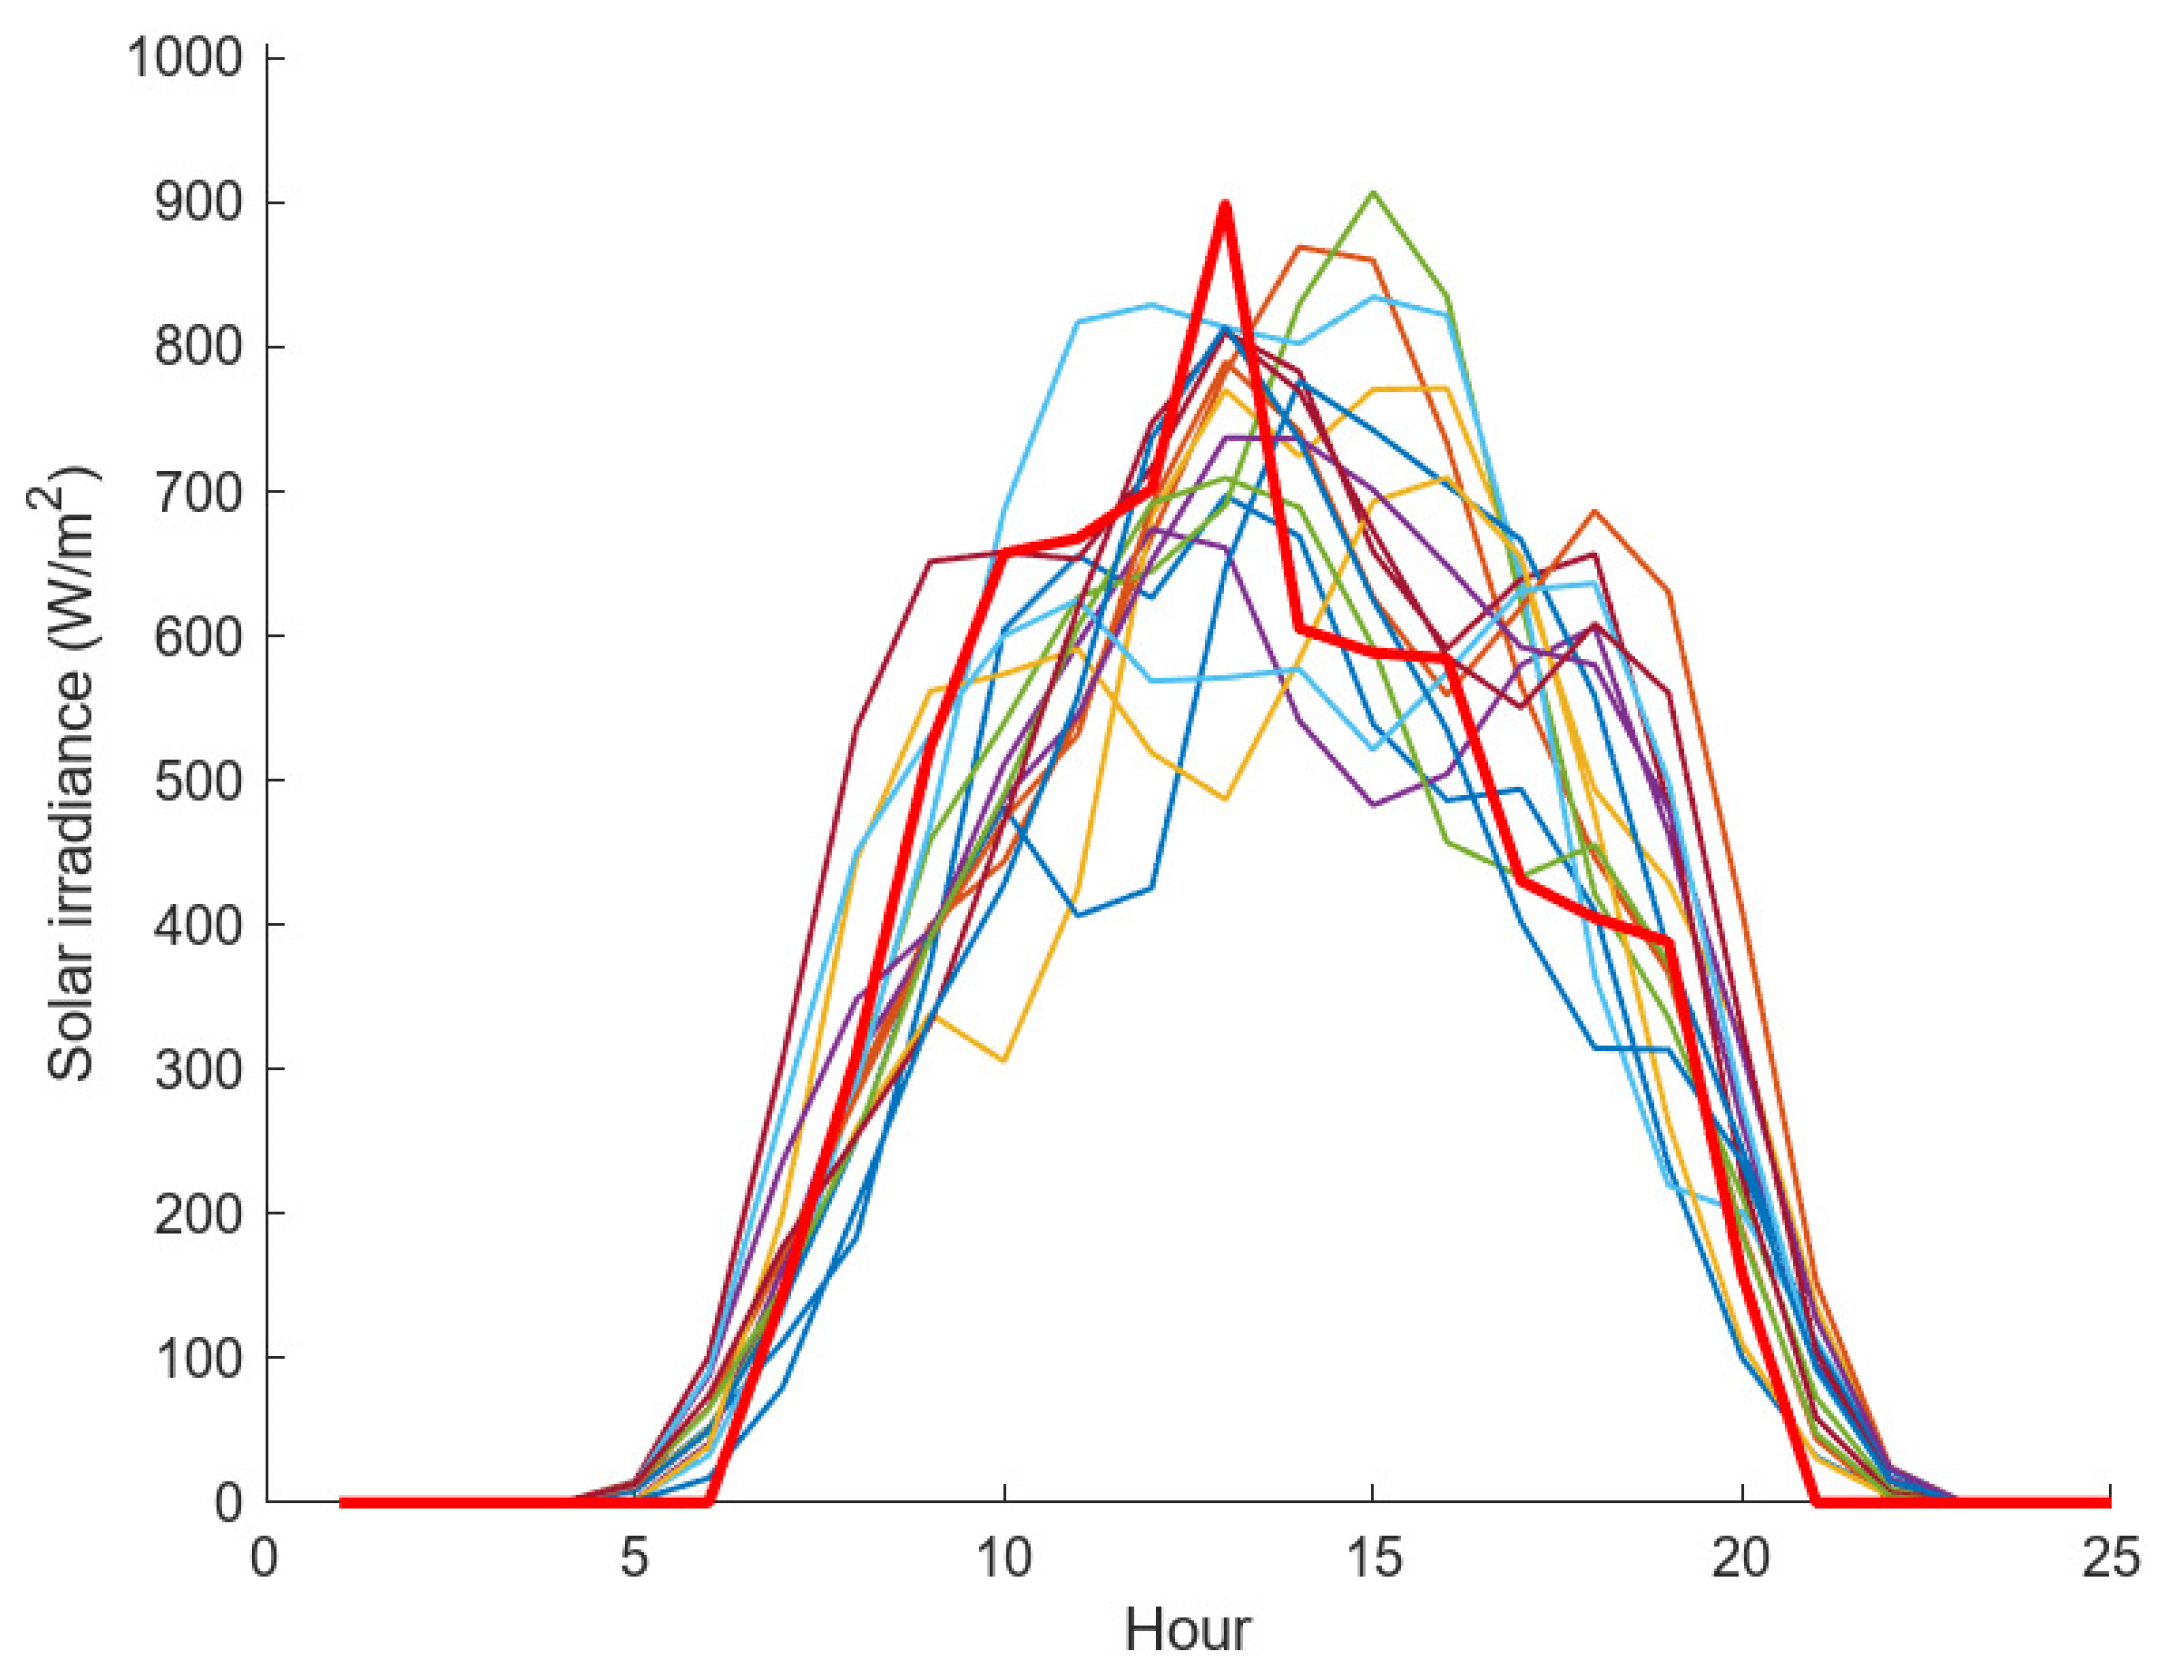
By means of the above procedure and according to its weekly PDF, it is possible to construct “the synthetic hourly curves” of solar irradiance over seven days. By repeating this process for the 52 weeks of the year, the seven hourly irradiance curves of each week of the year are constructed. This sampling process on the weekly PDFs is repeated 93 times to reach the 95 × 95% confidence and coverage levels. Thus, the estimated behavior of the annual solar irradiation is obtained, so that the effect it has on the variation of solar PV generation between different years can be estimated. As an example,
Figure 3 shows the solar irradiance values sampled for an actual day (red line).
2.2. PV Generation and Battery Storage
Solar generation systems have emerged as generation resources, but their random nature, variability, and intermittency complicate the analyses associated with their production capacities. Therefore, predicting the generation capacities becomes important once the existing resources are estimated. To this end, the main considerations taken for estimating the generation capacities of these systems are detailed below.
PV technology directly converts sunlight into electricity, but various environmental factors influence its performance, including solar radiation, wind speed, temperature, humidity, and dust. These factors affect PV panel efficiency, which is central to energy system reliability and economic viability. The non-deterministic relationship between PV production and environmental conditions makes power output prediction challenging [
44].
A predictive model based on experimental data and environmental conditions is necessary to model PV electrical production accurately. The model considers key input variables such as solar irradiation, ambient temperature, and module temperature. The generated power of a PV panel is given by:
A linear model is used as a simplified version of the proposed model by Duffie and Beckman [
45]. Solar panel performance relies on solar radiation and temperature. As Duffie and Beckman [
45] propose, cell efficiency depends on the temperature and the cell temperature depends on its efficiency. This iterative process is simplified by using a correction coefficient for the most common crystalline silicon-based applications [
46,
47]:
where
is the reference efficiency of the solar panel,
is the correction coefficient,
is the solar cell temperature, and
is the temperature of reference. The correction for temperature changes reflects how cell efficiency affects the overall panel performance.
The solar panel temperature,
, is determined by a linear formula that considers the ambient temperature and the solar irradiation by:
where
is the ambient temperature (°C),
is the nominal operating cell temperature (°C),
is the measured solar radiation intensity (W/m
2), and
is 800 W/m
2.
where
is the maximum rated power output power at standart conditions,
is the solar irradiance at standard conditions, and
is the actual solar irradiance.
Thus, the achieved electrical generation can be estimated based on Equation (4) and the data of the atmospheric data mentioned above (
Section 2.1). However, this approach extends beyond deterministic calculations. By analyzing the PDFs of the variables in Equation (4), it becomes possible to estimate ranges of generation rather than single-point values.
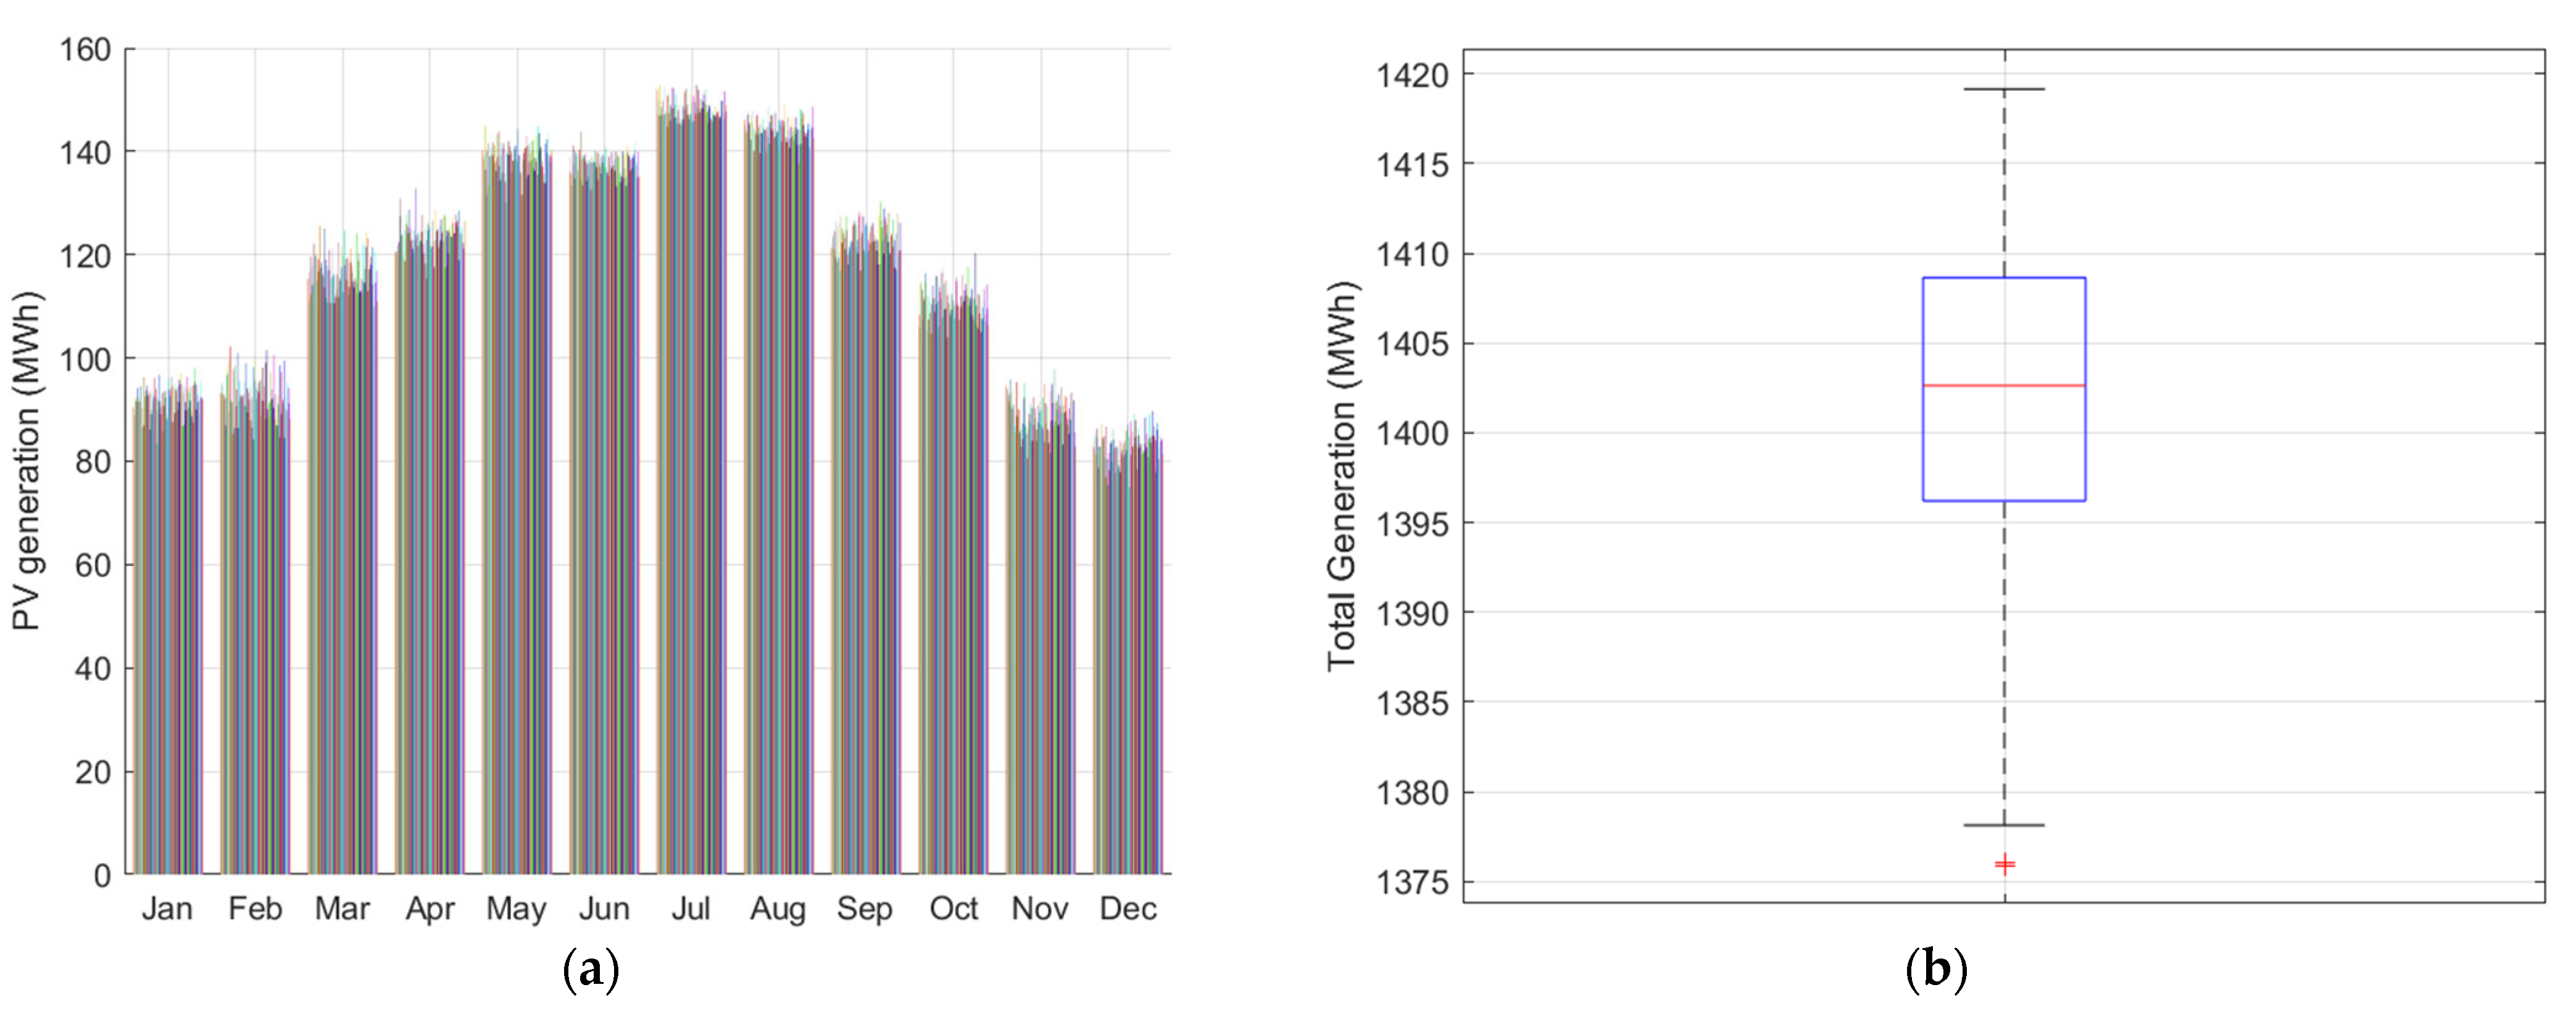
To present the behavior of the generation in more detail,
Figure 4 shows the monthly average generation (obtained from hourly data) of the sampling carried out using the Wilks methodology and the box-and-whisker diagram. Since this is a mid-latitude location with a temperate coastal climate, there is a clear differentiation between the seasons, with a significantly higher generation in summers than in winters and intermediate values in spring and autumn. There is an average value of about 1.4 GWh of annual generation for each MW of installed capacity, i.e., there is a solar generation system Capacity Factor (CF) of 16%. As for the variability in generation, as can be seen in
Figure 4, there is a low variability in both the annual values (
Figure 4b) and in the monthly average values (
Figure 4a). In fact, the 95% confidence interval for the current average generation is bounded by values between 1378 and 1418 MWh per year, which means a variation range below 3%.
The battery storage acts as a complement of the PV generation, which can be mathematically described as:
If
, then the battery charges with the excess of the generation but not more than its empty space. The actual charge is the minimum of these two values:
- 2.
Battery discharging
If
, then the battery discharges (notice the minus sign) and provides the needed extra, but no more than what it has. The actual discharge is the minimum of both (with a negative sign):
- 3.
Energy supplied
If PV and battery together cannot meet the full demand, the supplied energy is capped. This equation ensures you never supply more than is available and never exceed the actual demand.
- 4.
Constraints
This equation enforces the physical constraint of the battery. It cannot be overcharged or discharged below zero:
where
is PV power production (MWh) at time
,
is the EV demand (MWh) at time
,
is the battery storage (MWh) at time
, and
is the change in battery energy level at time
. Lastly,
is the maximum battery capacity (MWh) stated in the constraint. These equations govern battery operation by ensuring that the battery charges when PV production exceeds demand, discharges when demand surpasses PV generation, and remains within its storage capacity limits. The system aims to supply as much energy as possible to meet the demand, limited by the available PV generation and the energy stored in the battery. A detailed discussion of the EV demand profile,
D(
t), is presented in the following section.
2.3. Uncertainty of Electric Demand
The current work considers a unitary average hourly demand (1 MW) throughout the year, i.e., a total annual demand of 8760 MWh. In this case, a Mediterranean country has been selected as reference, but the same procedure would be applied for any other site [
48]. Thus, the same method described in the previous subsection has been followed to determine the shapes of the synthetic hourly demand curves over an entire year.
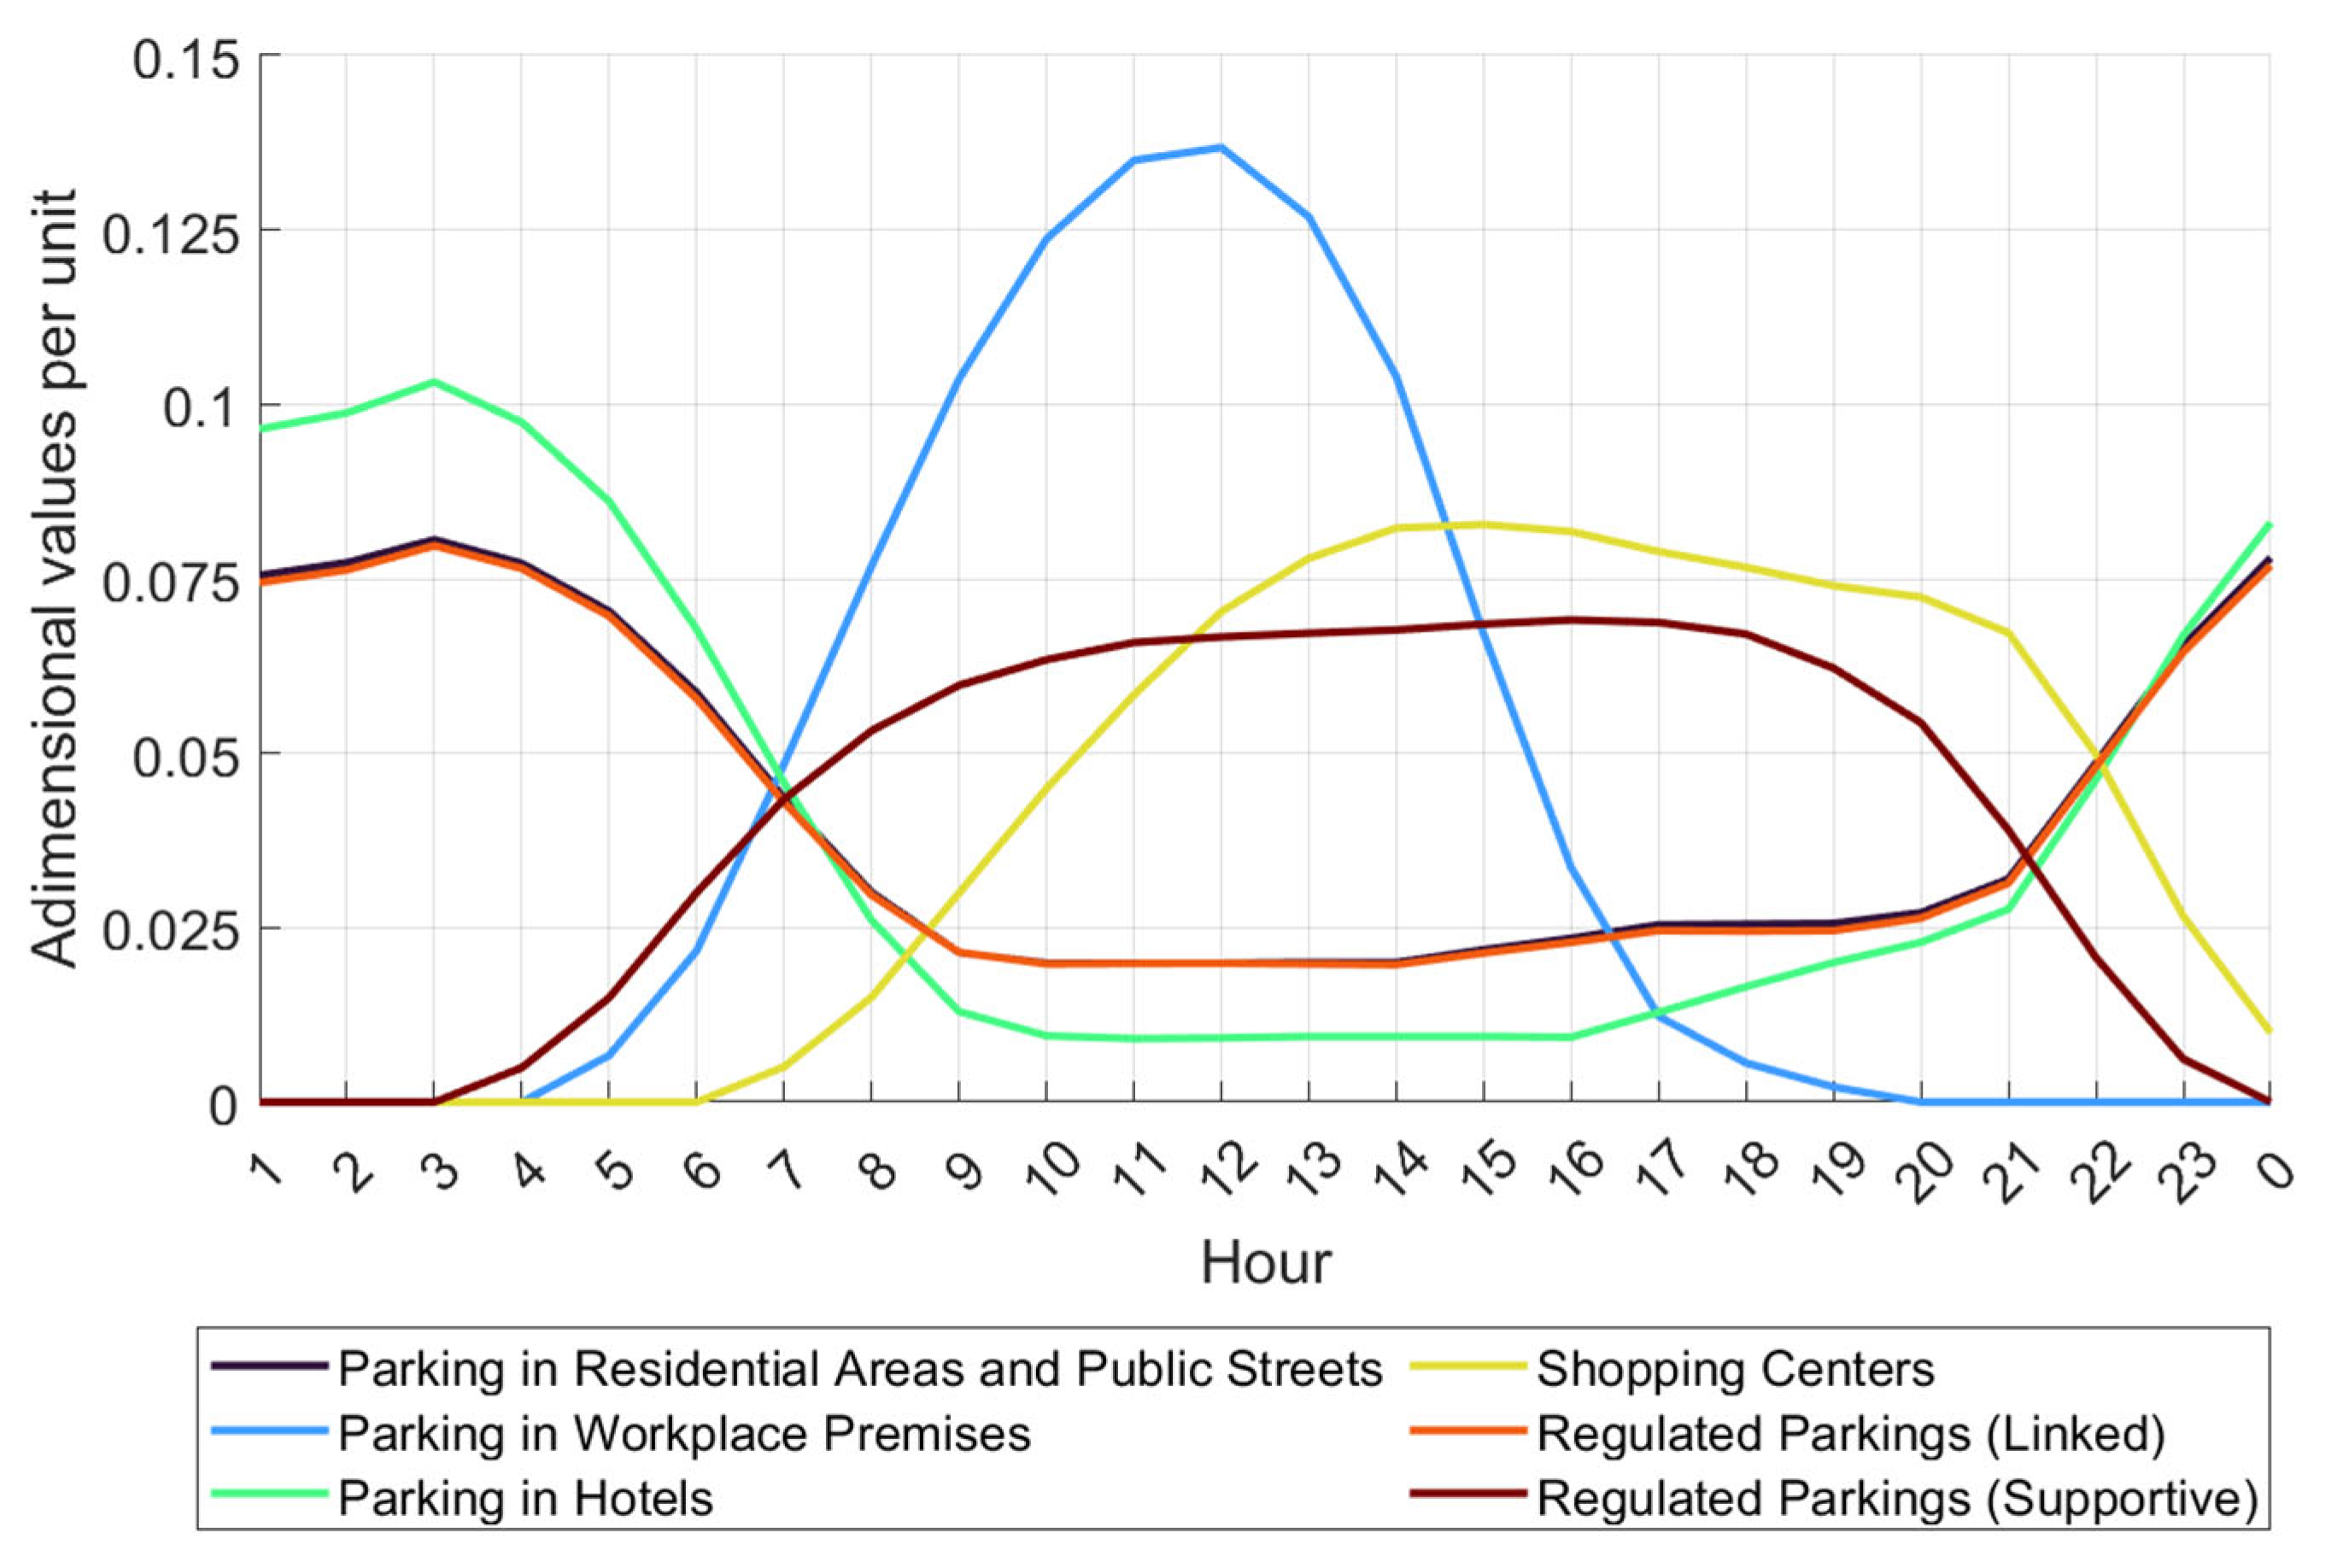
To estimate the base demand curve, charging patterns for EVs have to be determined. These arrangements differ based on type and location or recharge point. Residential and public parking areas see peak demand at night as vehicles are charged at home, while workplace charging peaks during the day, aligning well with solar energy generation. Hotels exhibit nighttime peaks similar to residential areas but with even lower daytime demand. Commercial centers have a stable demand from morning to late evening, making them compatible with solar energy systems. Regulated parking areas combine residential-like overnight charging with stable daytime demand from short-term users. Service stations focus on quick, emergency charging, with early morning and late afternoon peaks, matching traffic patterns. A summary of the main recharge patterns is displayed in
Figure 5.
These normalized profiles of average hourly recharging in
Figure 5 serve as the foundation for estimating the average hourly demand curve associated with EVs, incorporating the weighted contributions of each charging category. The total EV contribution is calculated by applying weights to the six charging profiles considered: households, workplaces, hotel parking lots, shopping malls, fast charging stations, and regulated charging points. With no DSM measures applied, the respective weights for these profiles are 83.9%, 2.2%, 3.7%, 7.3%, 2.2%, and 0.7% [
28,
49]. Finally,
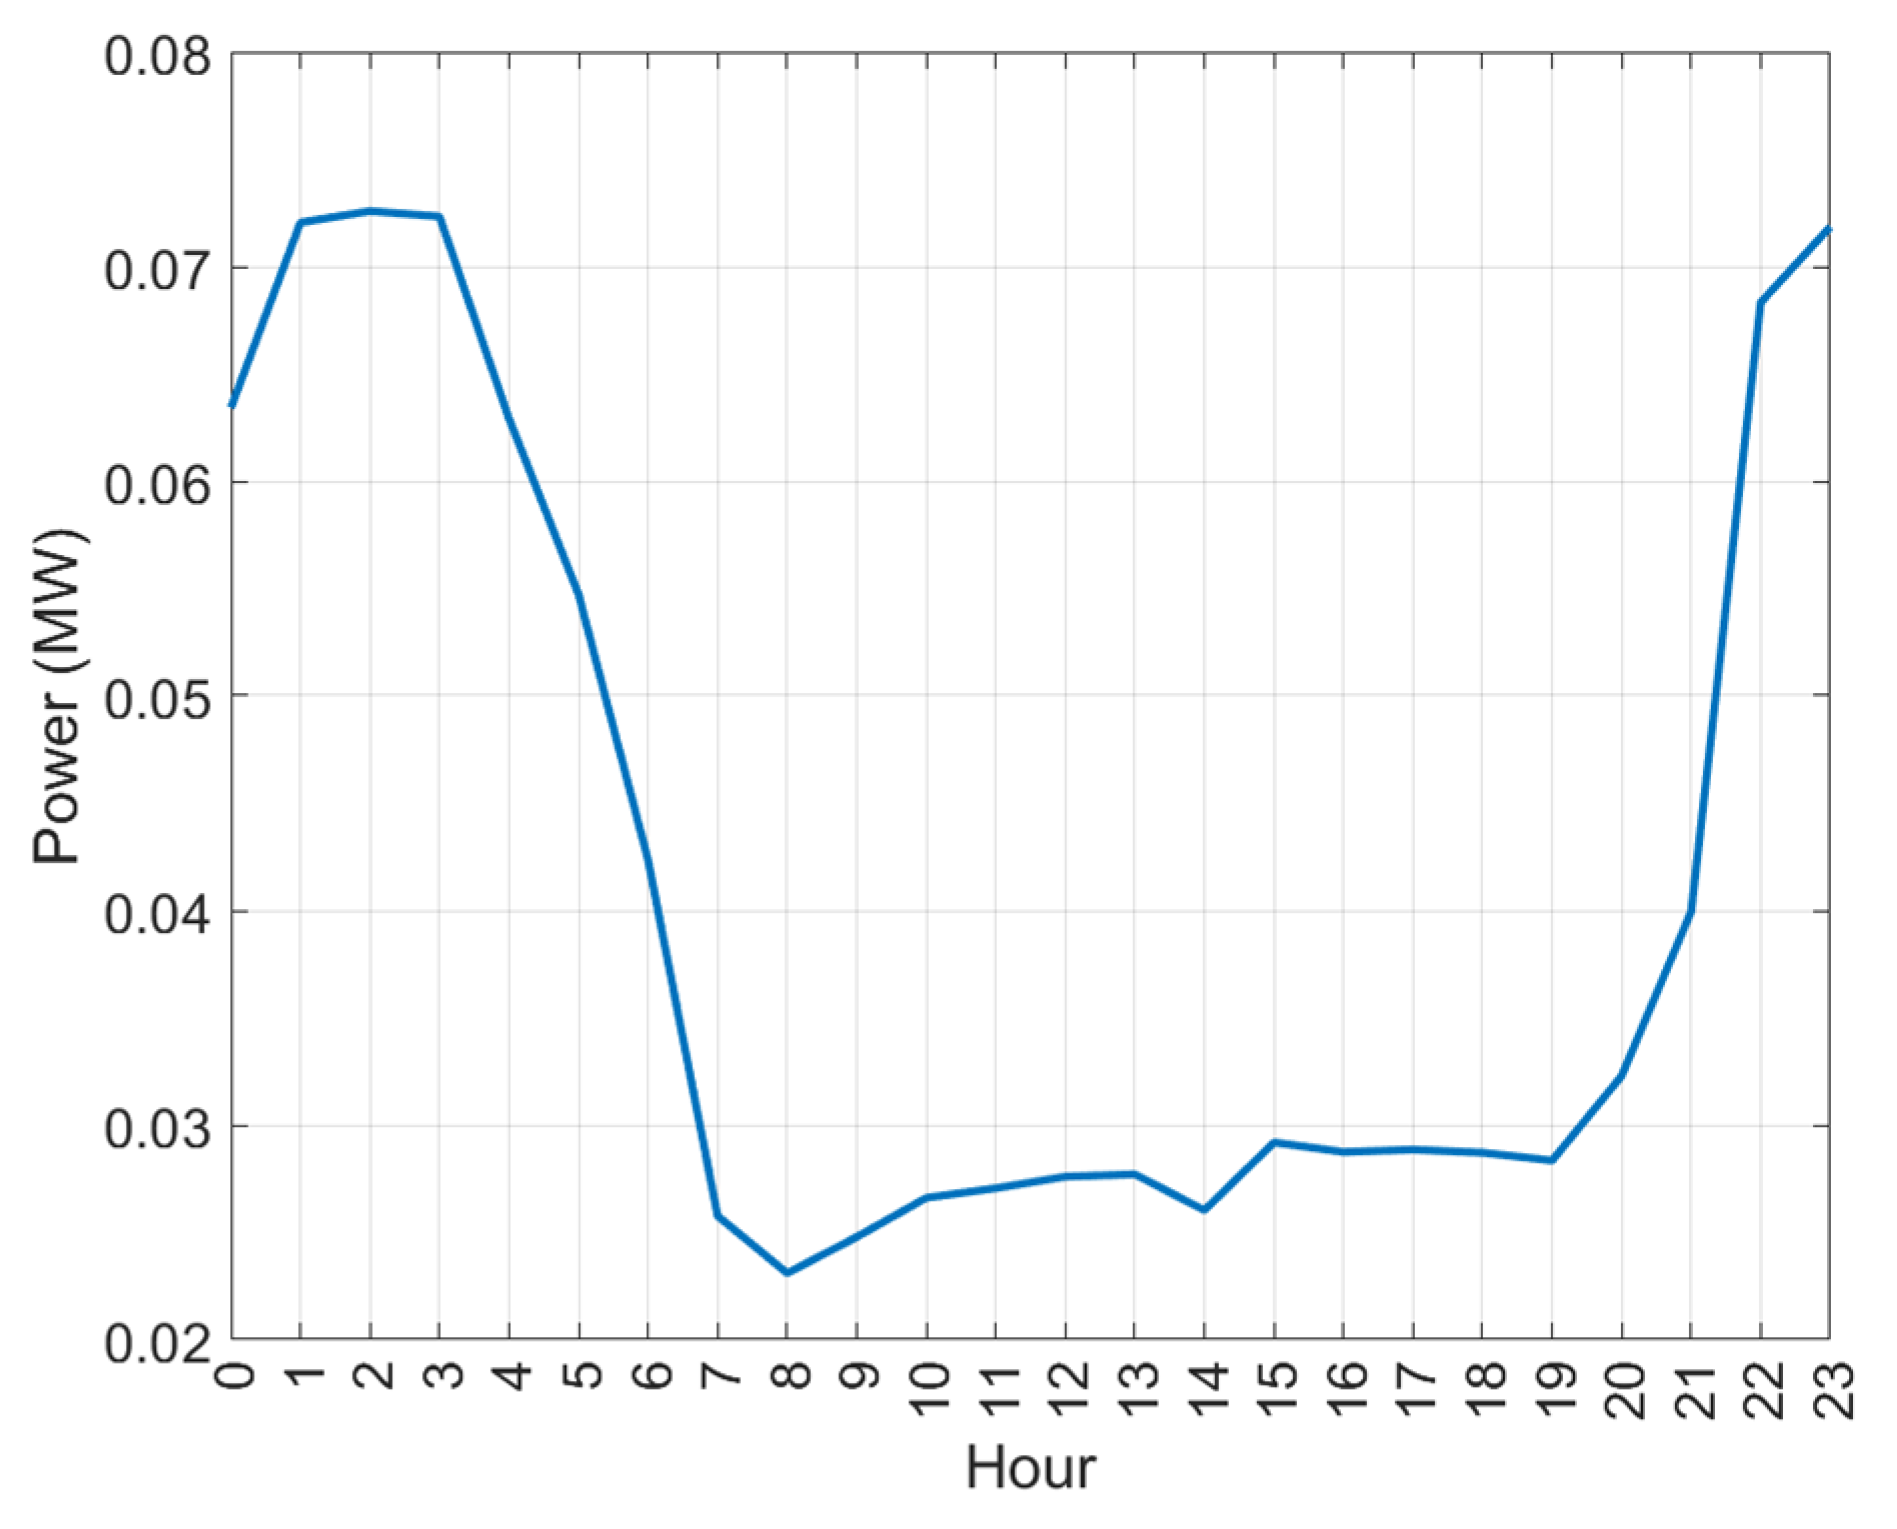
Figure 6 displays the weighted EV recharge curve.
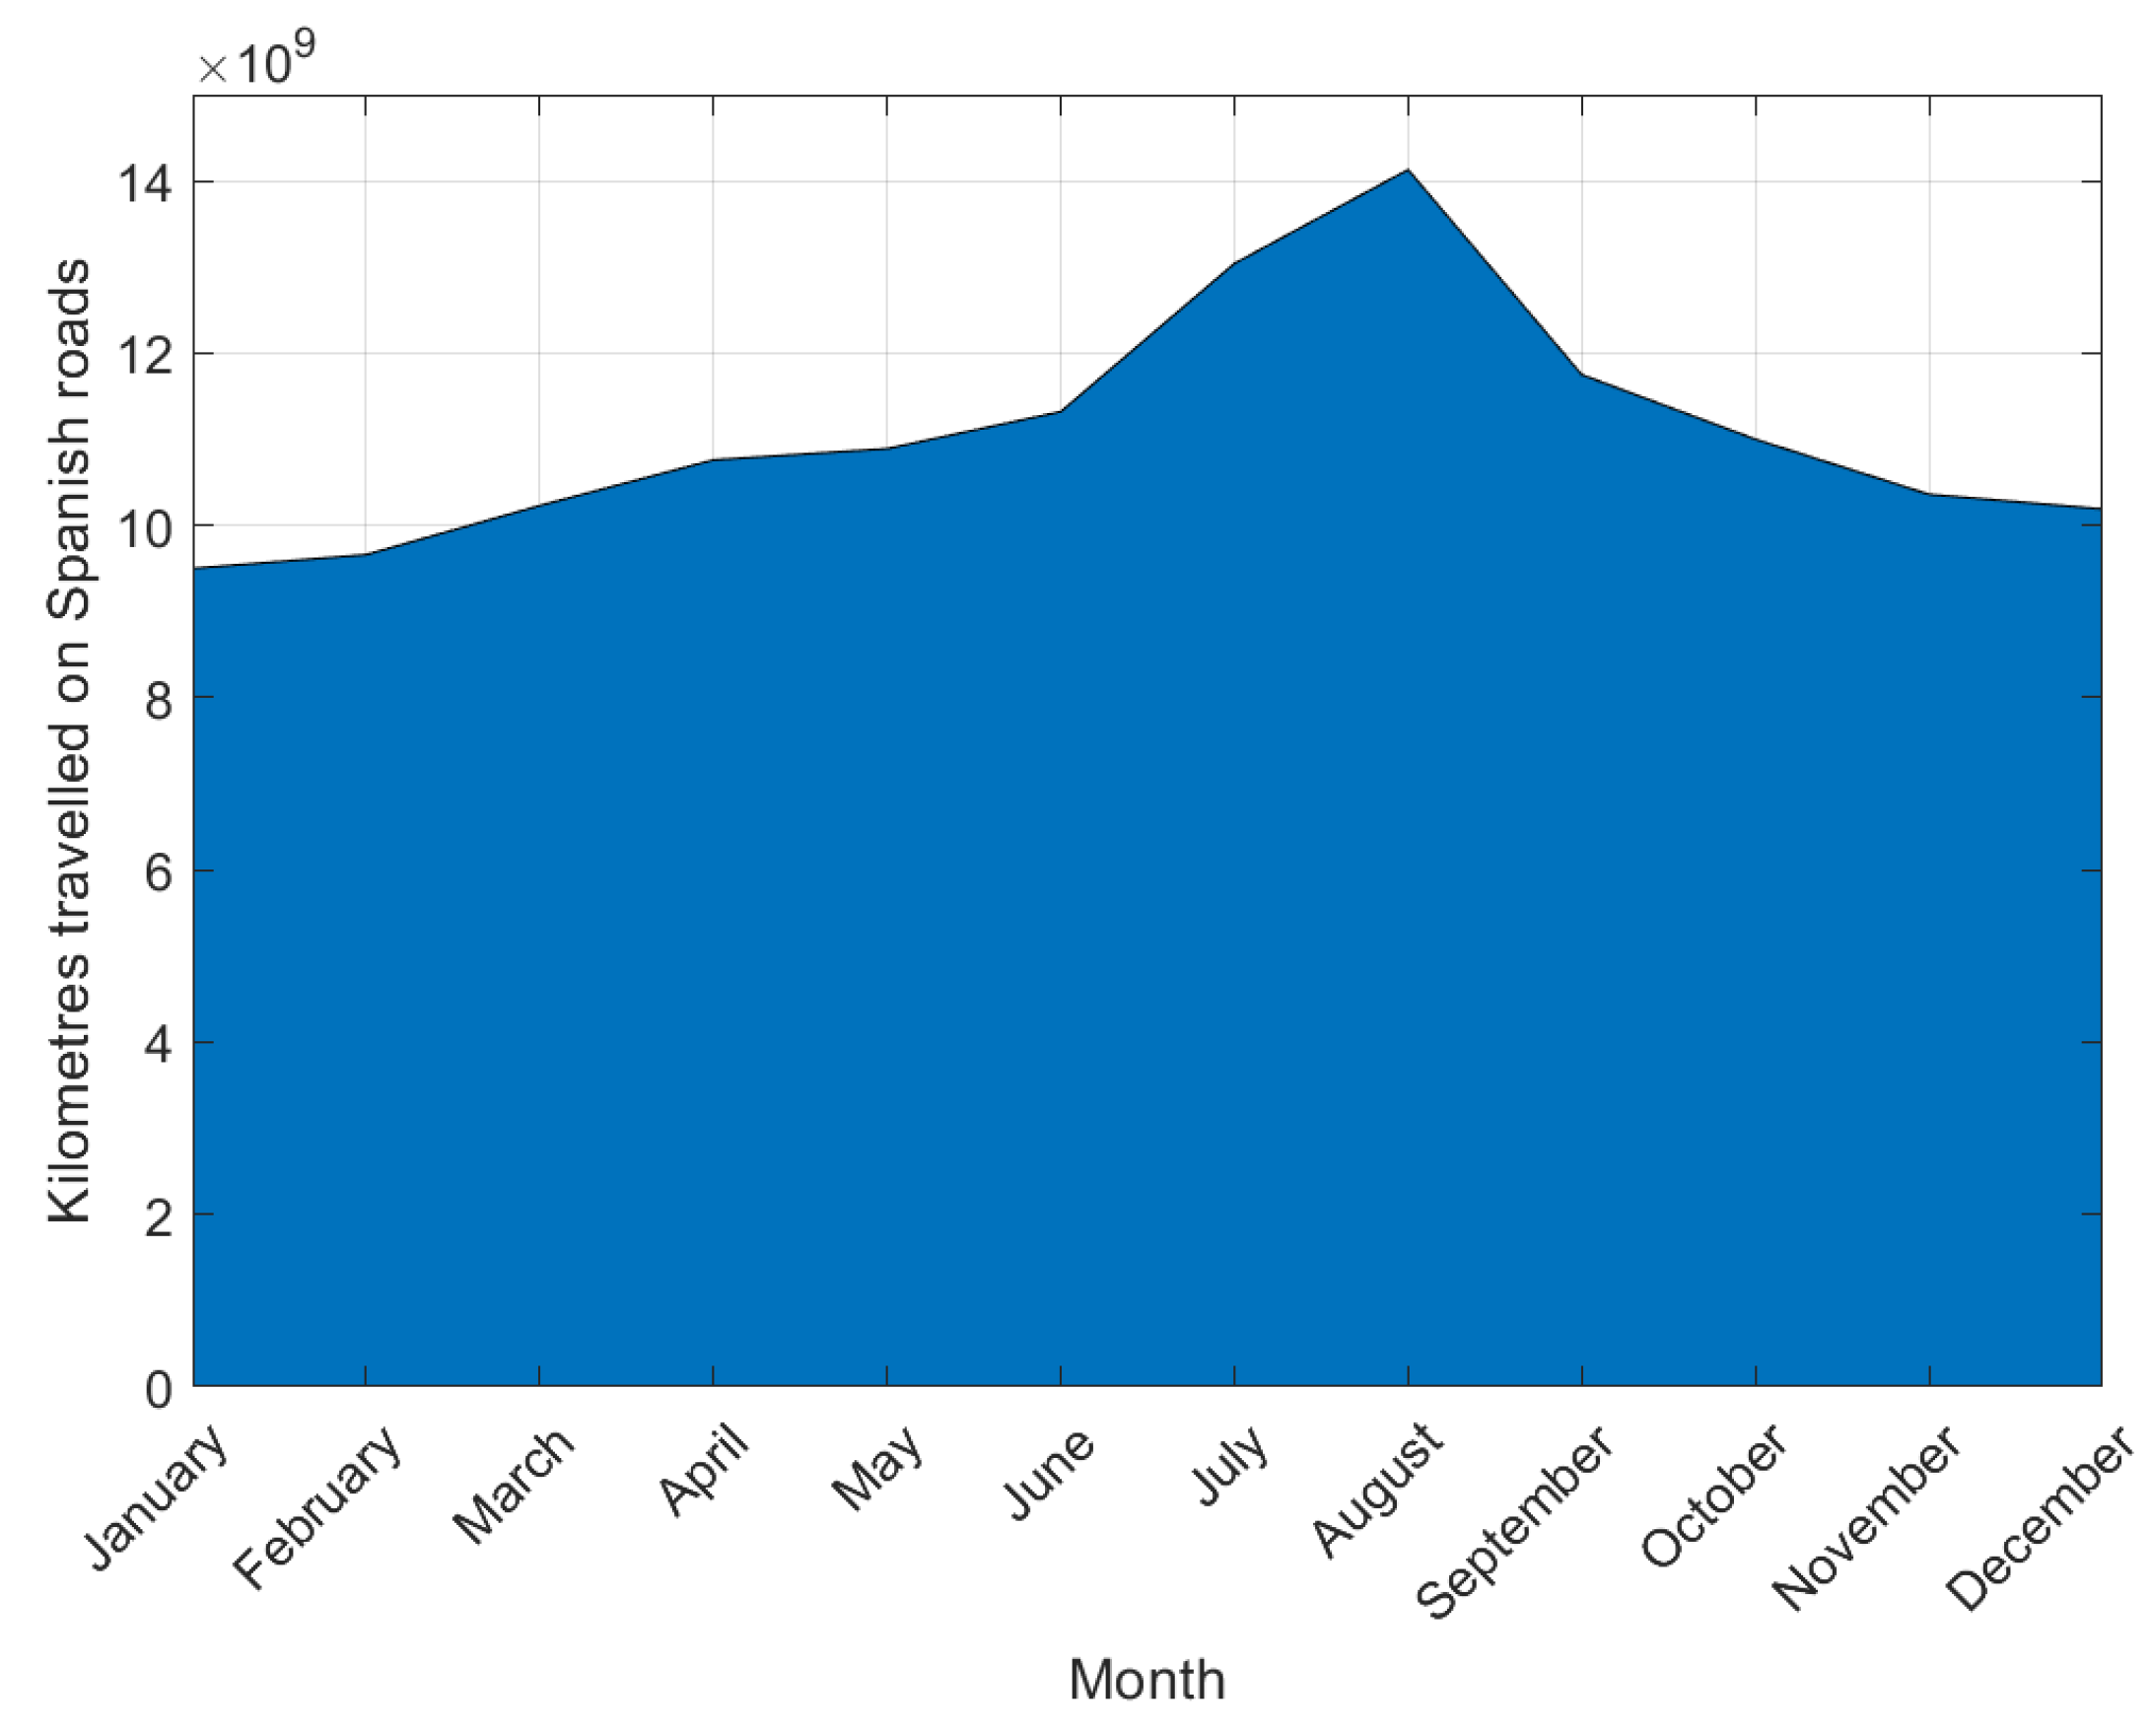
Charging behavior also varies with seasonal changes, with demand peaking in the summer months due to increased travel. Data from Spain’s General Directorate of Traffic (DGT) highlights a significant rise in traffic during the summer, as individuals travel to coastal areas, rural locations, or second homes [
50]. These seasonal fluctuations are vital for accurate annual demand forecasting and energy planning. The average monthly variations of 2021 are shown in
Figure 7.
Thus, the aggregated hourly curve is estimated from the summation of these two contributions, leading to the final energy demand curves.
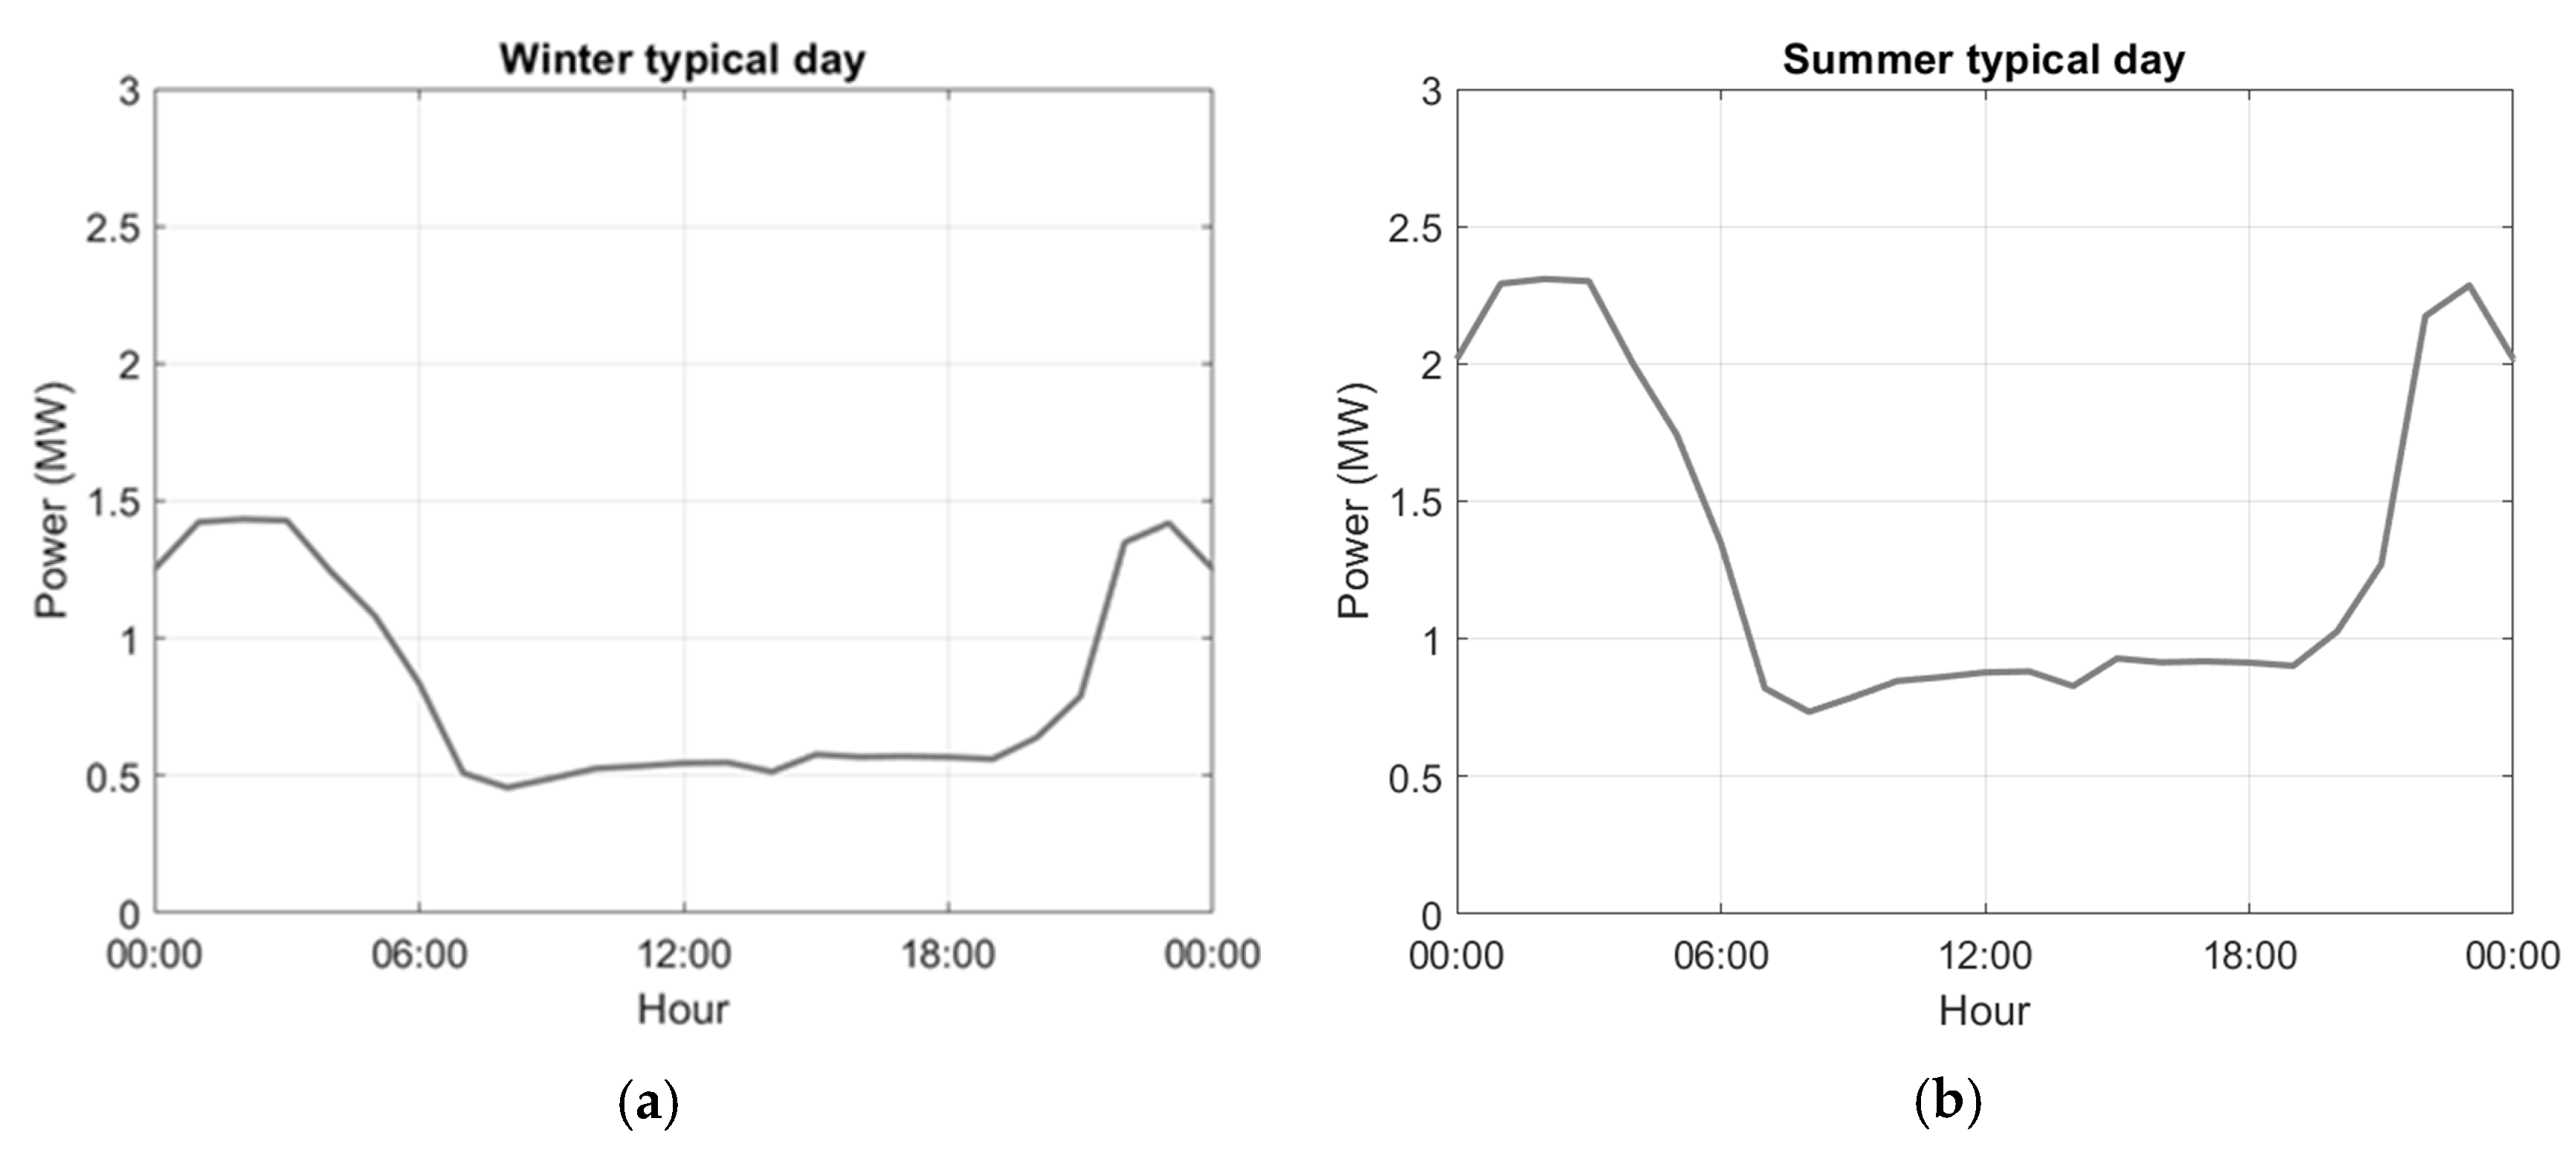
Figure 8 shows the final shape of the current and estimated demand curves for typical winter and summer days. Once the base hourly curves have been estimated with the two contributions mentioned, the hourly profile and the variation due to seasonality, the variability around them has been considered. But, despite having fairly stable electricity consumption associated with EVs, there will still be some variability. In the present work, and in line with the recommendations of other studies [
28], the approach taken is a uniform PDF with lower and upper limits of ±5%. In other words, similar to the sampling performed with the solar resource, sampling is done over the reference hourly demand profile.
The marked decoupling between the solar generation curves and those of EVs (
Figure 6) shows that the projected demand curves are notably flatter than the current ones. This situation is mainly due to the significant contribution of EVs, which, unless strong DSM measures are implemented, consumers will tend to charge during nighttime hours [
28]. In a traditional generation system, primarily reliant on baseload generation sources, this scenario of EV charging pattern would be highly favorable, as it tends to have EVs charging at night, when less demand of other loads is required. However, this situation is unfavorable in future scenarios with a strong contribution from non-dispatchable renewable energies, especially for those with strong contributions to solar power. In most cases, there is a significant decoupling between generation and demand, maximizing the need for. Then, DSM and/or storage technologies, together with the implementation of smart grids, will be unavoidable issues in managing these types of systems.
2.4. Demand-Side Management (DSM)
There are several ways to manage and shift electricity use, i.e., to implement DSM policies, and these policies could be applied at different degrees of aggressiveness to achieve changes in when and how people use power [
51]. The first level is at the individual user, where automated systems can help control non-essential devices based on price signals, allowing users to decide what is critical for them and minimizing inconvenience. The second level involves community energy management, where groups of users form energy communities to share renewable energy sources and storage, making it easier for people to participate directly and benefit from local energy resources. The third level is at the scale of the electricity grid, where these management strategies are applied by distribution and transmission networks to help balance supply and demand across the entire system. In short, effective electricity demand management requires coordination at the user, community, and grid levels.
Therefore, depending on the level and intensity of policy implementation, the implications will differ. In the current analysis, actions would mainly focus on changing users’ typical electricity consumption habits. Specifically, for EVs, consumption should shift to daytime hours, which means moving away from the current habit of charging at home or in private/community garages at night and instead charging at workplaces [
28]. From a regulatory perspective, this would reduce the need for major over-sizing of the grid that would be required if self-consumption systems and user habits were allowed to evolve freely, especially with the expected rise in electricity demand and distributed generation. To encourage this shift, users could be offered free or reduced-cost charging during specific hours, and smart charging systems should be implemented in parking areas to ensure charging happens in a way that maintains grid stability and avoids excessive peaks.
To achieve this, several actions should be taken before and during the rollout of DSM measures [
52]. These measures include informing and raising awareness among citizens about DSM, training users in Information and Communication Technologies (ICTs), ensuring that users have devices with robust connectivity and management capabilities, installing appropriate measurement and control equipment, and implementing essential DSM techniques by grid operators [
49]. Additionally, it involves establishing specific legislation for DSM and smart grids, regulating smart EV charging systems—including the potential use of Vehicle-to-Grid (V2G) strategies or Vehicle-to-Home (V2H) architectures, adopting Model Predictive Control (MPC), and developing effective real-time demand forecasting algorithms [
53]. When integrated in an organized manner, the deployment of EVs and DSM measures should not negatively impact the electricity system. However, improper implementation could lead to serious issues, such as grid instability, large demand peaks, node imbalances, or even blackouts.
When renewable energy sources play a significant role in the energy mix, a natural decoupling emerges between the generation curve, primarily shaped by solar PV output during midday, and the demand curve, which remains relatively stable over 24 h, particularly with the added load from EVs. This mismatch creates a challenge requiring either substantial storage capacity to absorb excess generation for later use or an oversized system to ensure continuous energy supply to meet demand. DSM is a critical tool for enhancing the performance of electrical systems, particularly during their current transition phase. Among the various strategies, managing domestic demand remains the most commonly employed approach to align energy consumption with generation [
34,
54].
In scenarios with significant solar production, it becomes critical to align demand with generation as closely as possible by shifting the demand curve toward daylight hours [
28]. A study by Deloitte Monitor also estimates that demand management measures can shift up to 30% of demand to midday hours [
6]. Similarly, a report by the Canarian government on smart grids and DSM presents sector-specific data indicating a comparable level of demand shiftability [
49,
55].
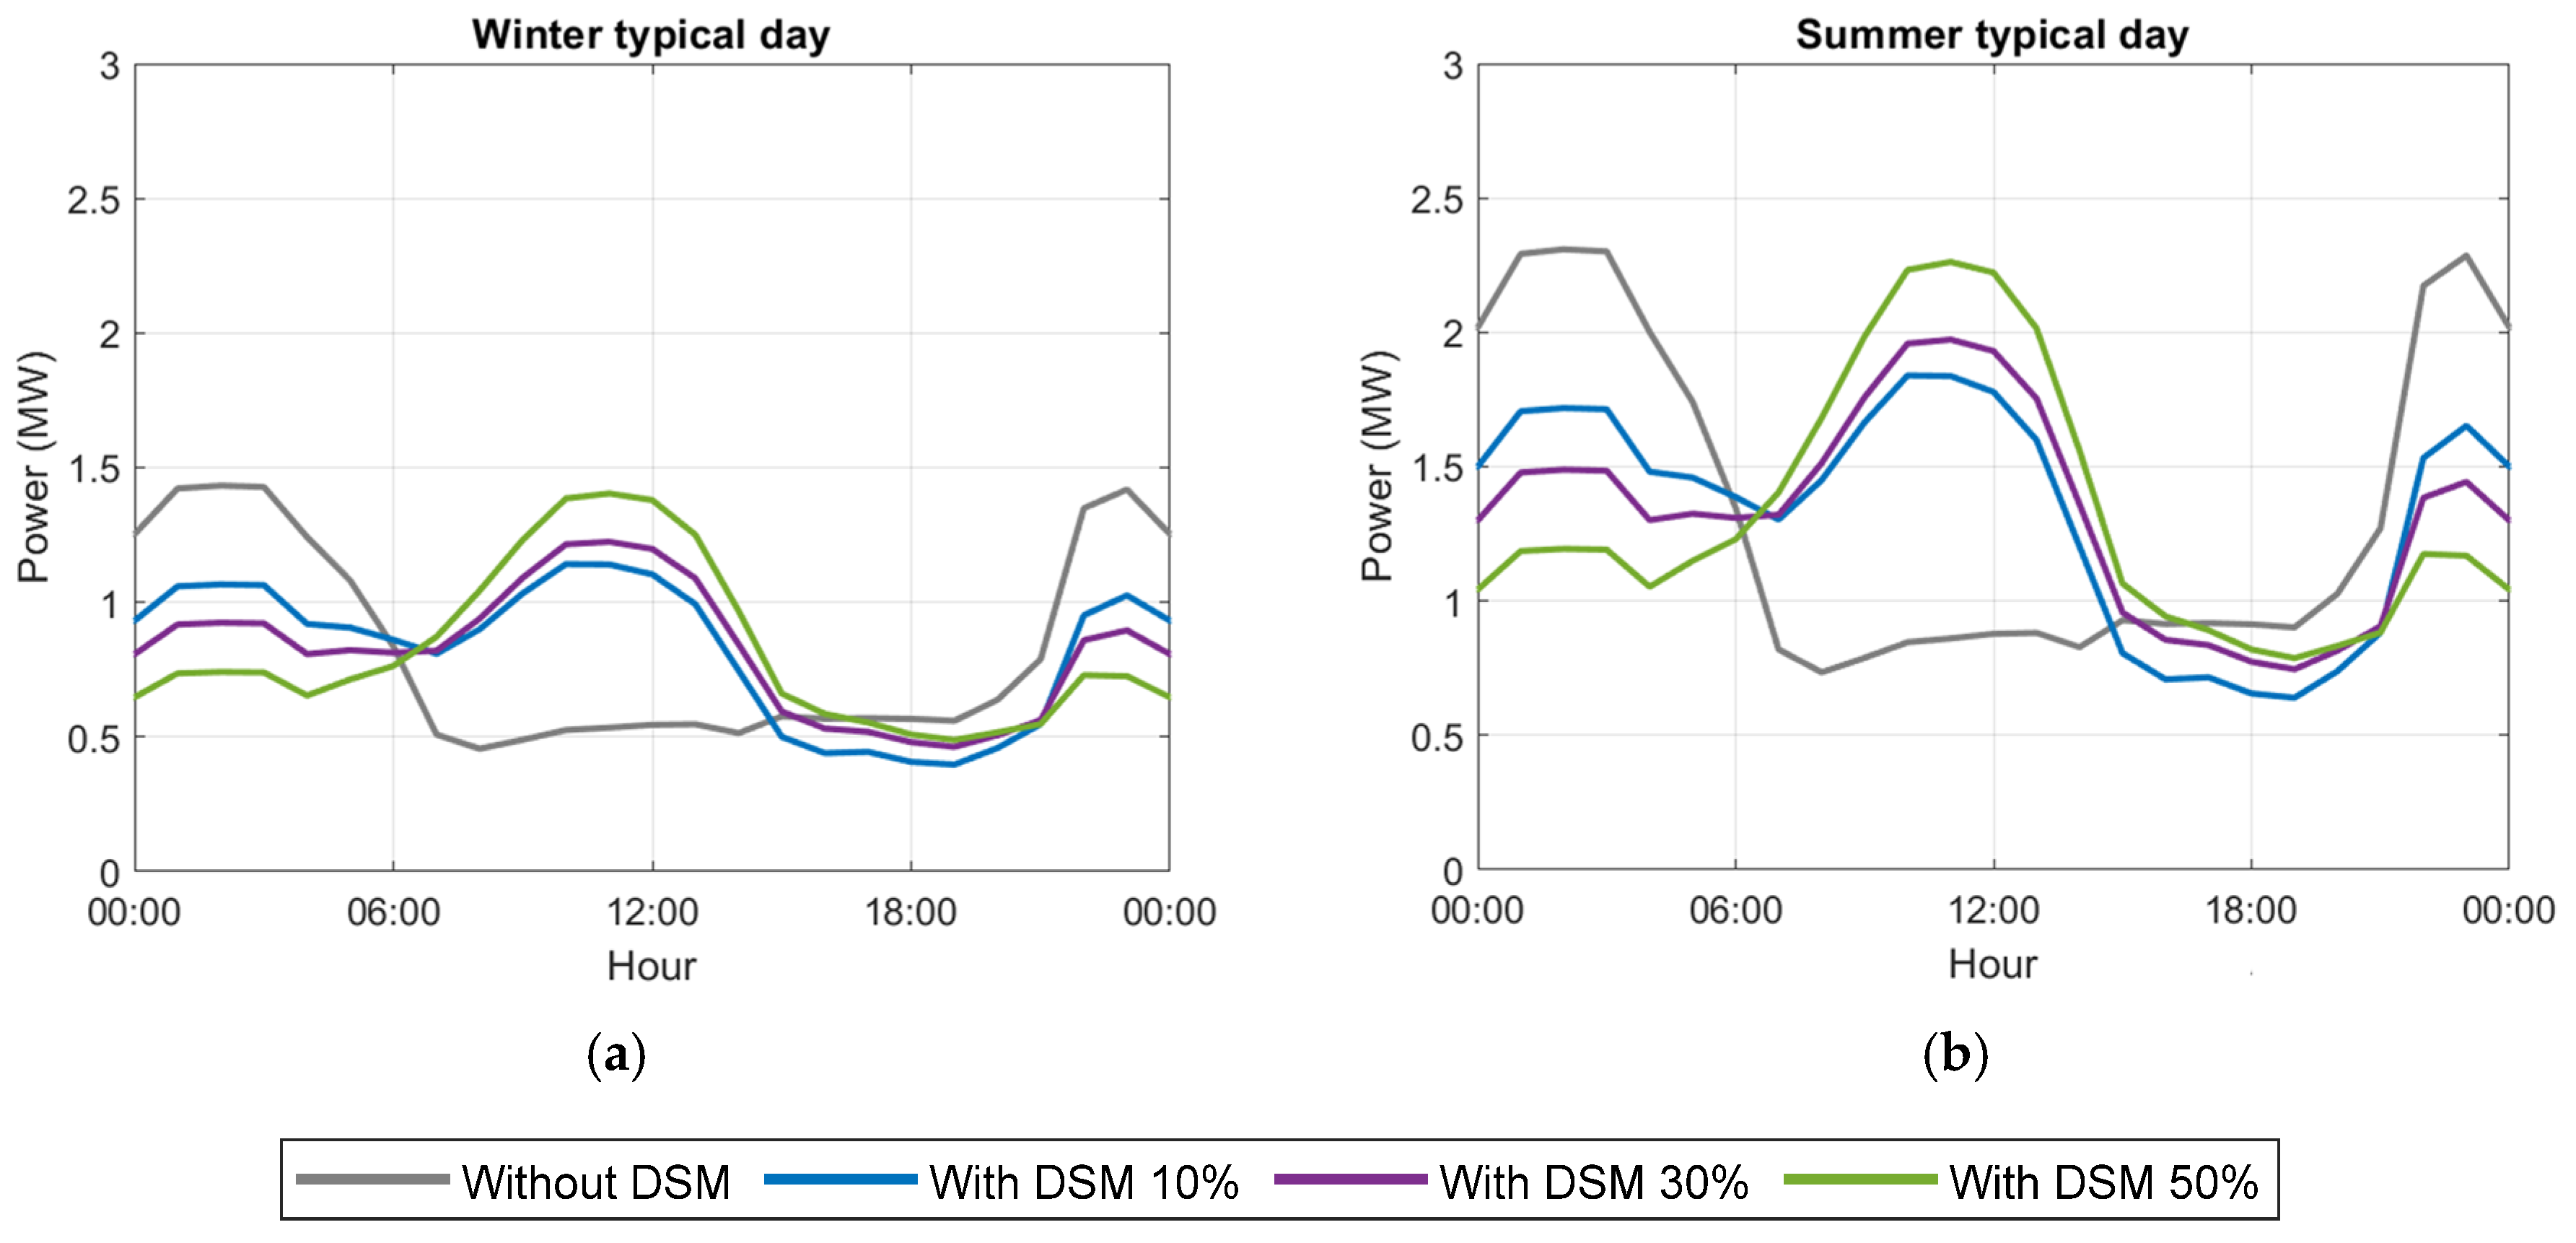
Figure 9 illustrates the resulting hourly demand curve after implementing demand management at its maximum feasible level, while keeping overall consumption unchanged. The analysis incorporates varying levels of DSM, ranging from no management (grey line in
Figure 9) to full implementation (green line in
Figure 9), assuming that a maximum of 50% of the total demand is manageable.
2.5. Optimization
In a general form, optimization problems with single objectives are formulated as follows [
56]:
where
is the objective function to minimize and
is the vector of
decision variables. The decision variables space is constrained by a Lower Bound (LB) and an Upper Bound (UB). It may have some inequality constraints of type
;
is considered feasible if it satisfies all constraints.
The optimization process utilizes MATLAB’s fmincon function to minimize the total system cost while meeting specified constraints. The script analyzes PV system performance across 93 simulations of solar irradiance and temperature data, considering the worst-case scenario for each configuration.
As inputs, the optimization problem incorporates EV hourly demand, solar irradiance, and ambient temperature. System parameters include PV efficiency, battery capacity limits, and cost factors for PV panels and batteries.
The objective function minimizes the system’s total investment cost, considering both Capital Expenditure (CAPEX) and Operational Expenditure (OPEX). This formulation assumes component replacement when their lifetime ends within the project horizon and a linear accumulation of O&M costs over time:
where
represents the installed PV power and
is the battery capacity.
and
are the price per MW of PV and the price per MWh for battery, respectively, while
is the projects lifetime and
and
are the PV solar panel and battery pack lifetimes, respectively.
and
represent the annual operation and maintenance costs, expressed as a percentage of the initial investment cost. The values used for these parameters are displayed in
Table 2.
The objective function, displayed in Equation (13), is subject to several constraints:
- 1.
Demand coverage constraint:
This ensures that the system meets the required demand coverage, considering the allowed uncovered demand,
. The energy supplied by the PV and battery system is discussed in
Section 2.2.
- 2.
Maximum PV capacity constraint:
This limits the PV capacity to a maximum value.
- 3.
Maximum battery capacity constraint:
This restricts the battery capacity to a maximum value.
- 4.
Non-negativity constraints:
These ensure that both PV capacity and battery capacity are non-negative.
By implementing this optimization framework, the study determines the optimal balance between solar PV generation variations and battery storage, considering economic feasibility, demand fluctuations, and the potential benefits of DSM strategies.
The modeling performed for both the batteries and the solar panels assumes ideal design conditions. For example, battery modeling does not consider degradation from cycling, possible thermal effects due to operating temperatures, which leads to an overestimation of lifespan and performance, nor battery behavior under power fluctuations [
58]. Similarly, no dynamic models are included that relate to Depth of Discharge (DoD), temperature, and degradation. In the same way, for solar panels, the degradation of cell materials, corrosion, or fragility of the connections that reduce efficiency, or losses in performance due to possible shading or obstacles, etc., are not considered [
59]. Consequently, if these factors are to be taken into account, the generation and storage performance values would need to be adjusted accordingly, but these calculations could in themselves constitute another possible line of future research.
3. Results
Aligning the charging of EVs with renewable energy is a significant aid in reducing surplus energy produced, thus maximizing resource utilization more sustainably. It is worth noting that the anticipated expansion of the EV fleet in the coming years will lead to substantial increases in demand, which will require large increases in generation capacities, with solar PV generation playing a key role. However, the significant variability of this generation, which is not constant throughout the day nor uniform throughout the year, needs further analysis. Winter months, for example, have shorter days and less sunlight than summer months, raising questions about the most appropriate power to install to ensure optimal performance of the installations throughout the year. Furthermore, the contribution of EVs to this demand and the partial flexibility in vehicle usage habits or commuting allows for the study of how shifting this demand can partially affect the performance of the installations.
However, shifting the entire charging load is not feasible. There will be loads and/or user behaviors that make it impossible to transfer this demand to generation fully. Despite this, the increased use of EVs offers an opportunity to implement DSM policies. Since EVs have variable charging profiles and significantly contribute to total electricity demand, it is possible to guide users toward specific charging habits by strategically deploying demand management measures. This will create a more sustainable and efficient transportation system. With this approach, the portion of the energy demand directed to EV charging that can be met by solar photovoltaic energy is analyzed. This analysis aims to identify strategies and dynamics to achieve this by comparing several scenarios: a reference scenario with no DSM, a scenario in which 10% load shifting between different profiles is considered, one where 30% shifting is considered, and a final scenario with 50% demand management of the EVs’ consumption. Specifically, this study shows the impact of shifting the demand to solar PV production hours. The following paragraphs summarize the main results of the scenarios. Each one will consider, analyze, and discuss the technical aspects related to the generation–demand coupling.
The analysis is based on the load profile distributions shown in
Figure 9. For the case without DSM, the weights assigned correspond to the weights of the different charging patterns described earlier (
Section 2.3). This primarily involves a concentration of charging activities during nighttime hours due to the need for vehicles to be available during the day and the convenience for vehicle owners, who usually park their vehicles at home overnight. The load-shifting profiles are applied similarly for the three DSM degrees, leading to the hourly demands shown in
Figure 9.
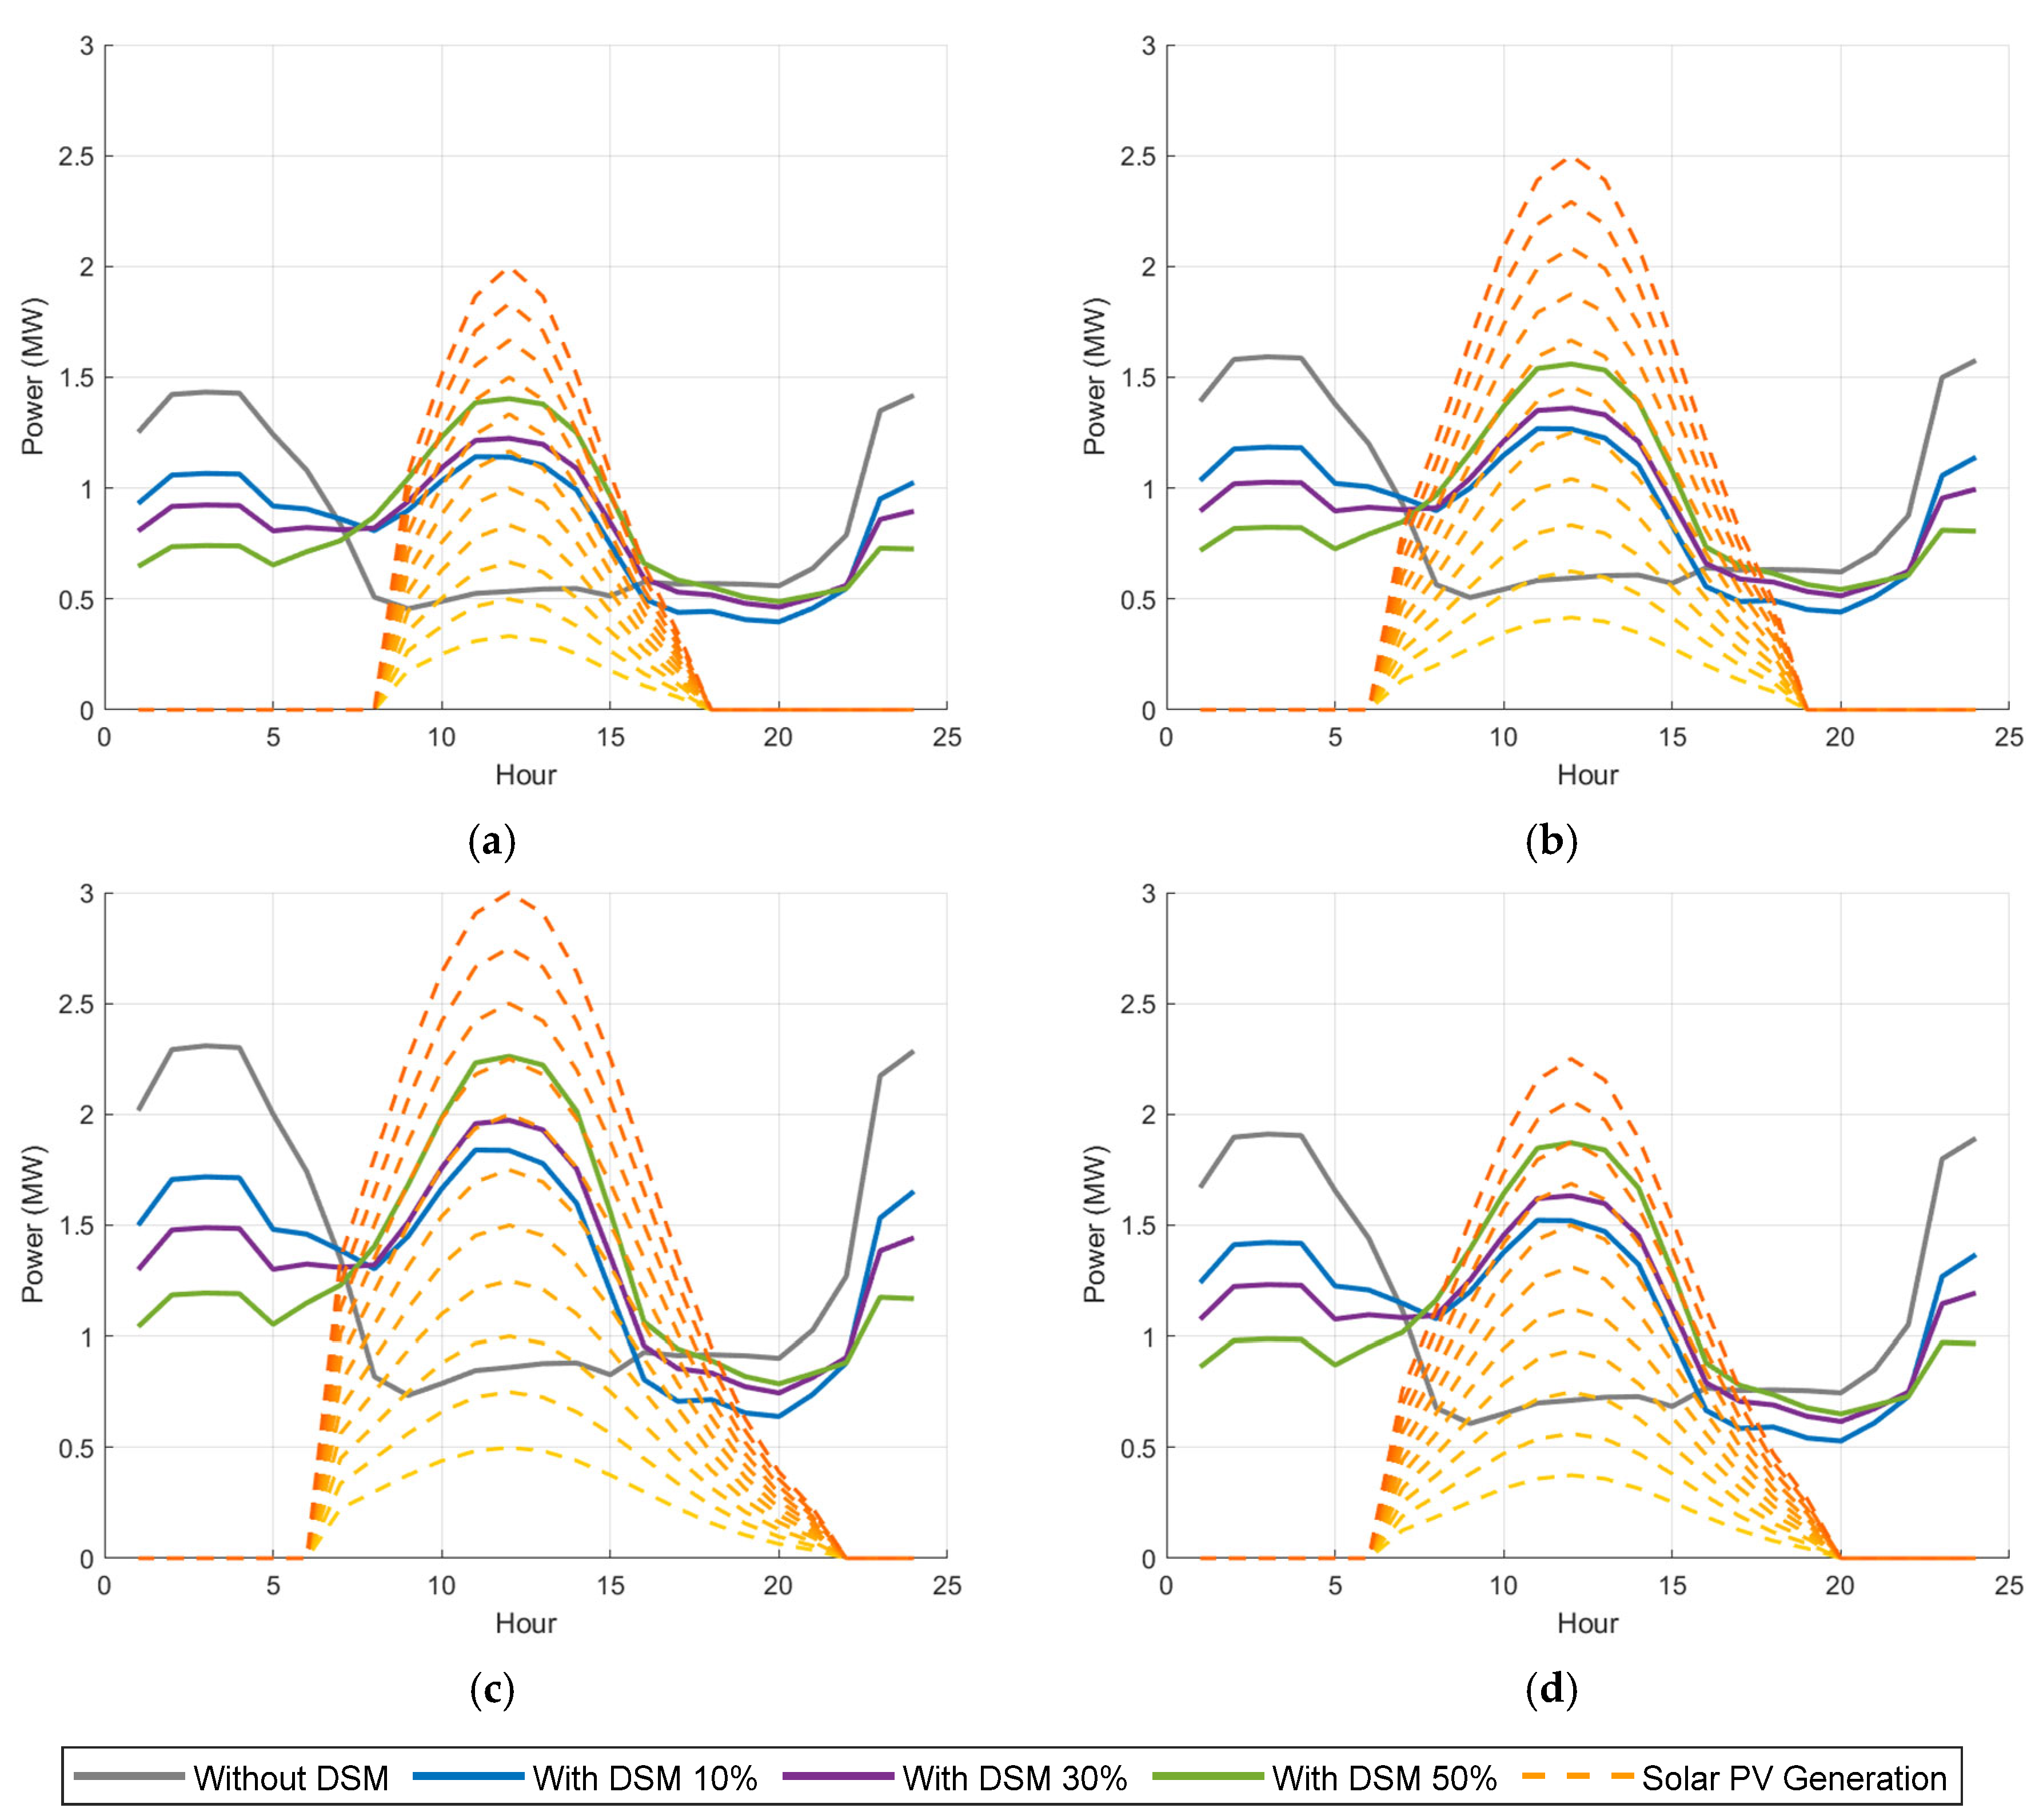
To provide a general understanding of the performance of the systems throughout the year,
Figure 10 presents the hourly electric demand for typical days of the four seasons of a year for the four DSM scenarios and a sweep of solar PV installation power levels. It is important to note that the figure assumes an idealized solar PV generation curve. Its primary purpose is to illustrate how progressively higher levels of DSM shift electricity demand toward midday hours, thereby improving the alignment between demand and the potential availability of solar energy. However, as previously mentioned, the hourly balances are made with the hourly curves of the solar resource obtained from the BEPU analysis carried out using 22 years of historical data.
From 0.5 to 3 MW, in steps of 0.25, in this range of solar powers for the four DSM levels, it is observed that, as demand shifts to the central hours of the day (increased DSM levels), there is a higher degree of coverage and, consequently, a greater need for generation capacity to meet this demand. Furthermore, there are noticeable differences in the performance of each scenario and during each season of the year. For example, in winter (
Figure 10a), there is lower demand (
Figure 7, seasonality of traffic) as well as lower generation, both in terms of peak power generation and the total number of generation hours. In contrast, during summer (
Figure 10c), there is higher demand due to seasonality, accompanied by a higher peak power of solar generation and more hours of generation and total solar hours, all of which lead to the need for higher installation capacities. In contrast, spring and autumn (
Figure 10b,d) exhibit moderate electricity demand levels and solar PV generation levels, falling between the extremes observed in summer and winter.
There are two opposing characteristics in the generation system’s needs, with extreme behaviors observed in summer and winter. On one hand, in summer, there is significantly higher generation over a greater number of hours than in winter due to the previously mentioned lower irradiance and fewer hours of sunlight, resulting in much lower demand coverage for the same system in winter. On the other hand, given the high seasonality of the EV loads (
Figure 7, with a more than 40% increase in kilometers traveled in summer compared to winter), the demand is appreciably reduced in winter, meaning that the power required for installation would be lower. As a result, the difference in the optimal system sizing based on its behavior throughout the year is not as large as might be expected in the absence of the discussed seasonality. However, these differences still need to be analyzed in order to determine the most appropriate system size. Therefore, in order to achieve the highest coverage with limited excesses, a compromise solution must be reached in terms of installed solar PV power so that its performance in the summer months reaches the maximum coverage possible while having controlled surpluses in the winter months, with good coverage and low overages for the autumn and spring months. To this end,
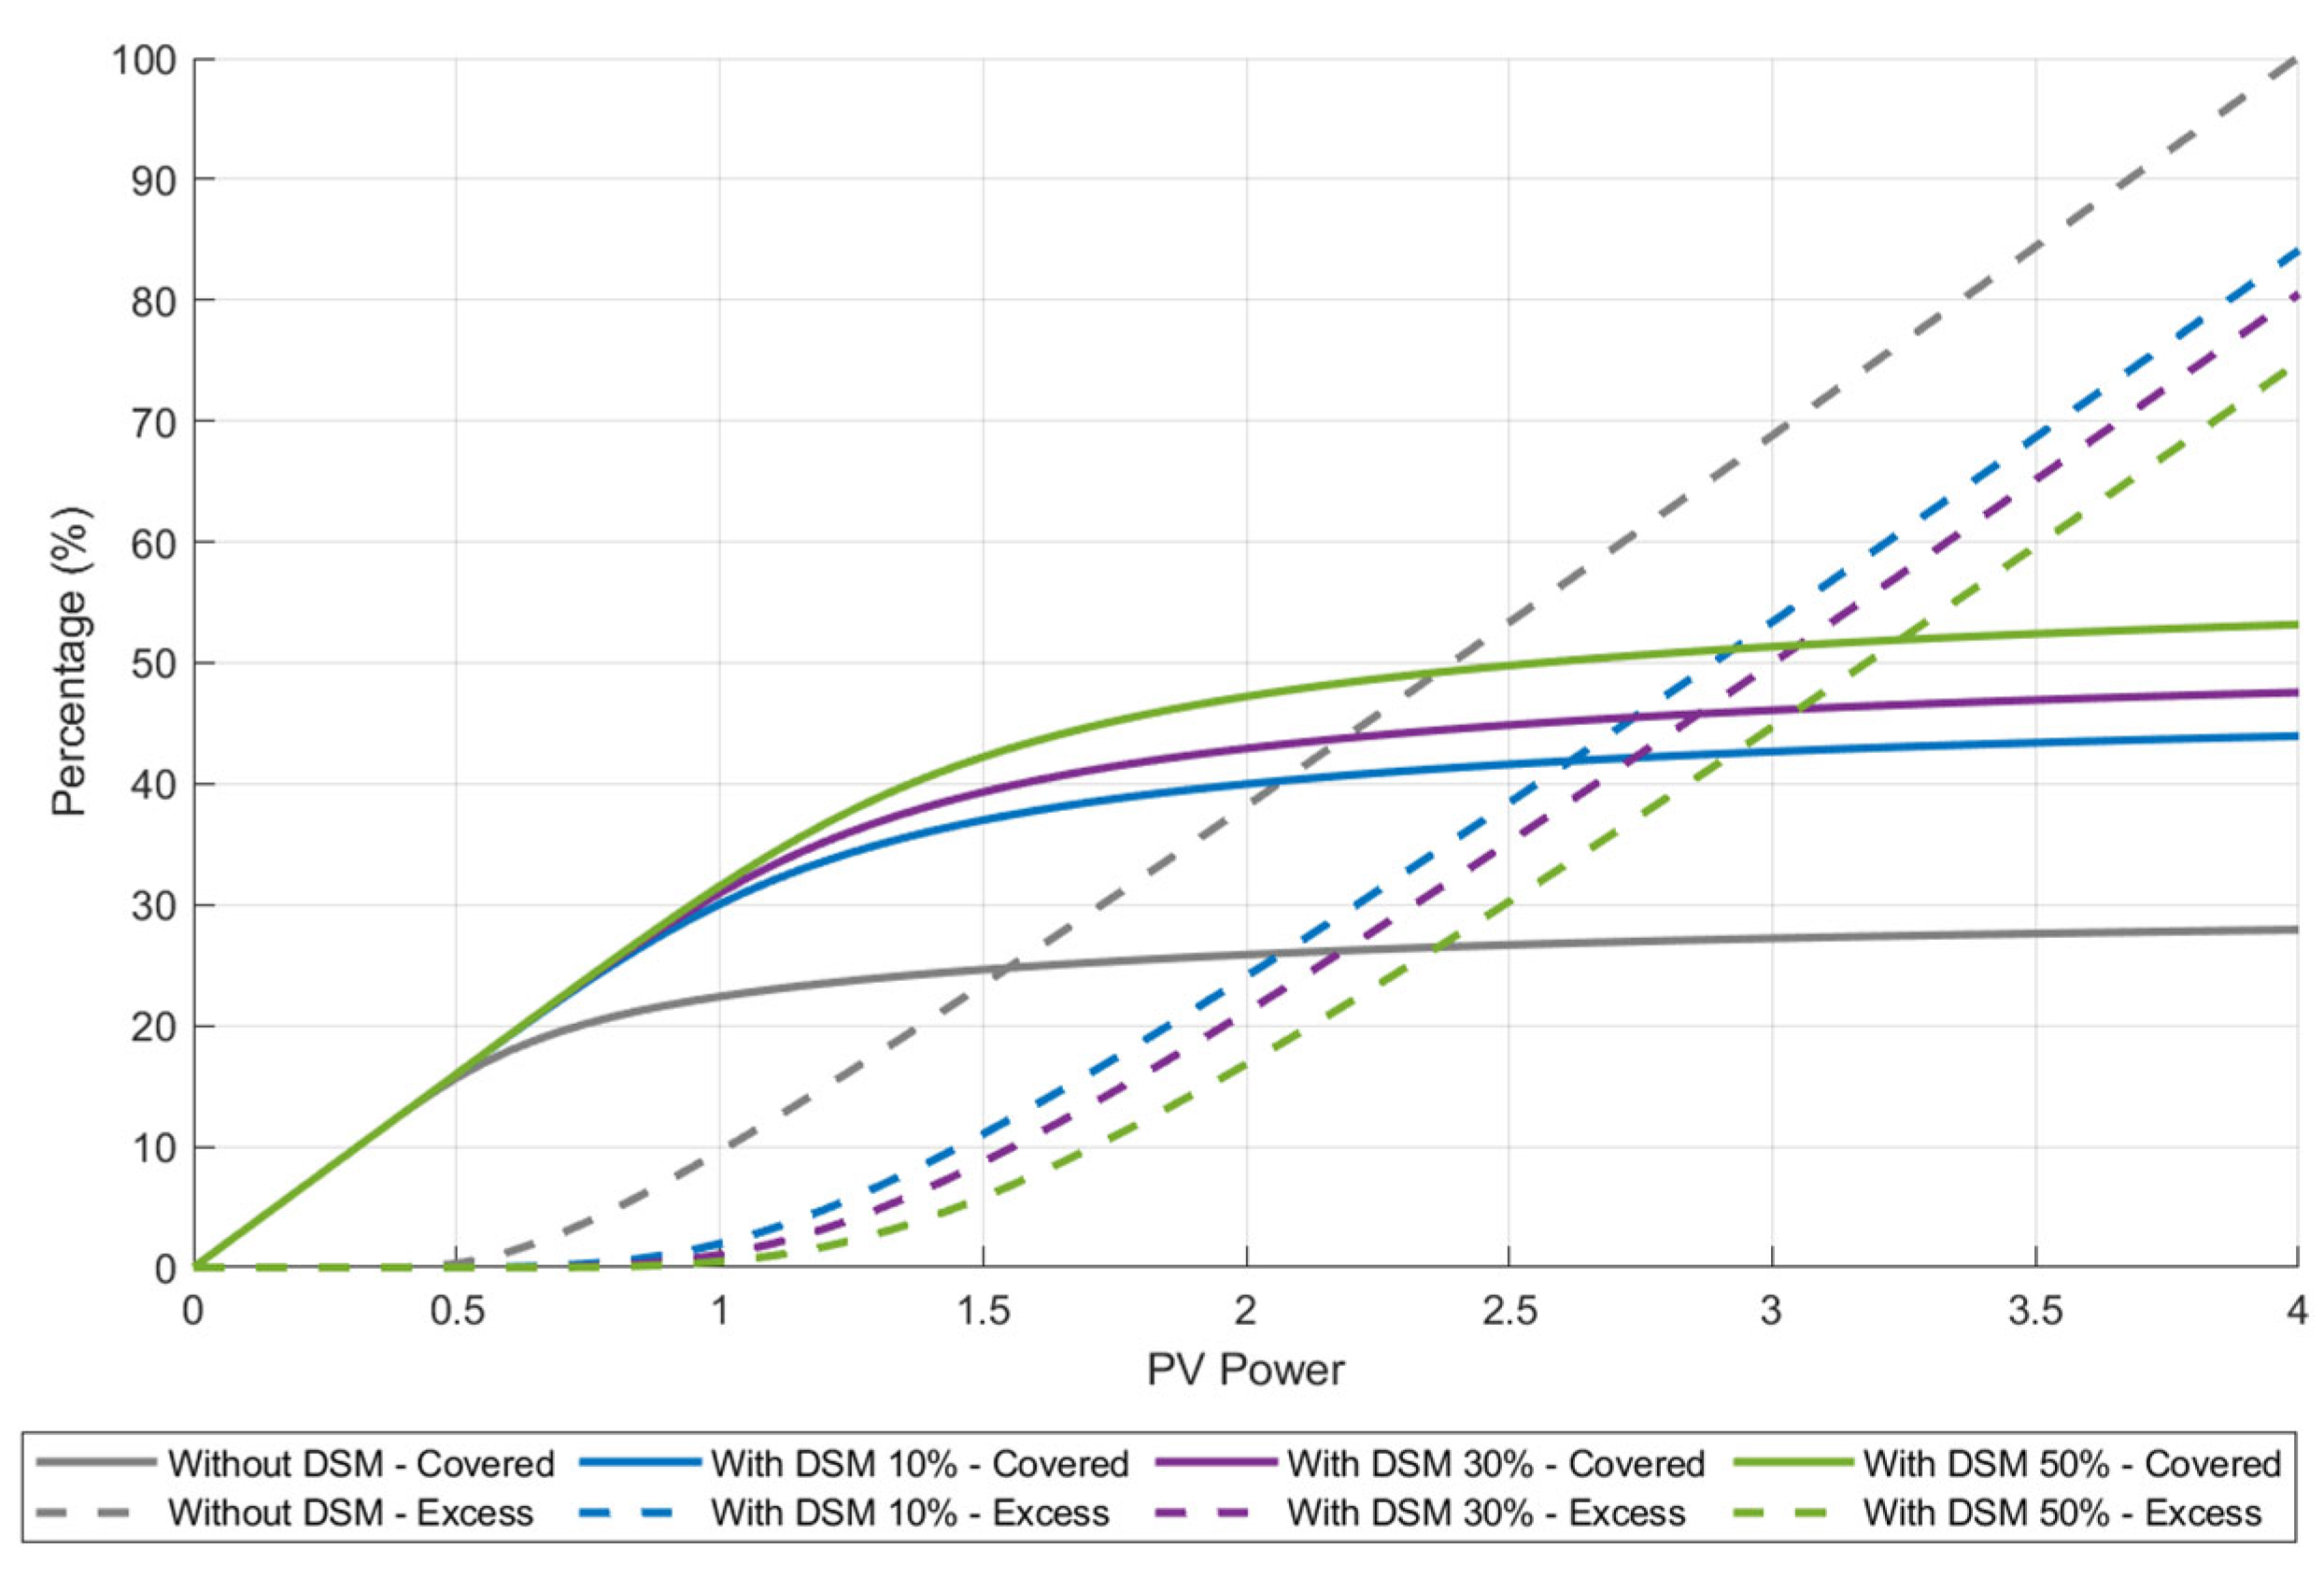
Figure 11 presents the installed renewable generation capacities versus the demand coverage and excesses for the annual hourly performance.
Based on the analyses in
Figure 10, a sweep of the behavior of solar generation has been made for different powers, all of them overlapping with the different degrees of DSM considered. That is, for an installed solar generation capacity, hourly balances are made between solar generation and hourly demand profiles for all the hours of the year, thus finding the demand coverage and possible excesses. If a sweep of the solar generation powers is made, and for each one of them the degree of coverage of the demand is calculated, the results shown in
Figure 11 will be obtained by representing these results in the curves of coverage and excesses. As seen in
Figure 11 for all four scenarios, with low installed solar PV powers, surpluses are zero, and there is a linear increase in coverage as the capacity increases (up to 0.5–1.0 MW approximately depending on the degree of DSM implementation). For intermediate powers (up to about 1.0–1.5 MW depending on the scenario), coverage increases more slowly, accompanied by an increase in surpluses. Beyond these capacities, there is a much higher increase in surpluses, while coverage tends to approach asymptotic values.
For the case without DSM, there is a linear increase between installed power and coverage, without excesses. A slightly less than 20% coverage is reached with 0.5 MW of PV power. From this point on, the linearly increasing slope with power reduces, with also reduced excesses. However, coverage is also increased when the installed power is increased to a greater extent. However, the increasing slope in coverage decreases, while the slope of the excess curve increases sharply. The optimal point would likely be around 0.5–1.0 MW. With PV powers around 0.5 MW, the coverage almost reaches 20%, with almost no excesses. If power is increased to 1 MW, then coverage is approximately 25%, but excesses are about 10%. From this point on, strong PV power increases only produce a huge increase of excesses while demand coverage approaches the asymptotic value of less than 30%. The performance change for the remaining three cases with different DSM levels is significant compared to the no-DSM case, but the values are still not very different from each other. For example, coverage is around 35–45%, with surpluses of about 10–15% when installing capacities of around 1.5 MW. The “asymptotic” coverage values range from 45 to 55% across all three cases, with higher coverage as the DSM capacity increases. For the scenarios with higher DSM, slightly better performance is obtained, with slightly higher coverage and lower surpluses.
Storage systems are essential in renewable energy systems, especially due to the inherent variability, discontinuity, and unpredictability of solar power generation. Since solar energy depends on sunlight, which fluctuates throughout the day and varies seasonally, it cannot always provide a constant and reliable power supply. This makes the integration of storage systems, such as batteries, critical for ensuring a stable and continuous electricity supply.
In the current case, the combined effect of installing batteries alongside solar generation has been studied to achieve high demand coverage values and analyze the system characteristics required to meet the desired objectives. Additionally, and as a very important aspect, the significance of DSM policies has been considered in terms of their impact on the performance and size of the systems needed to reach the desired milestones.
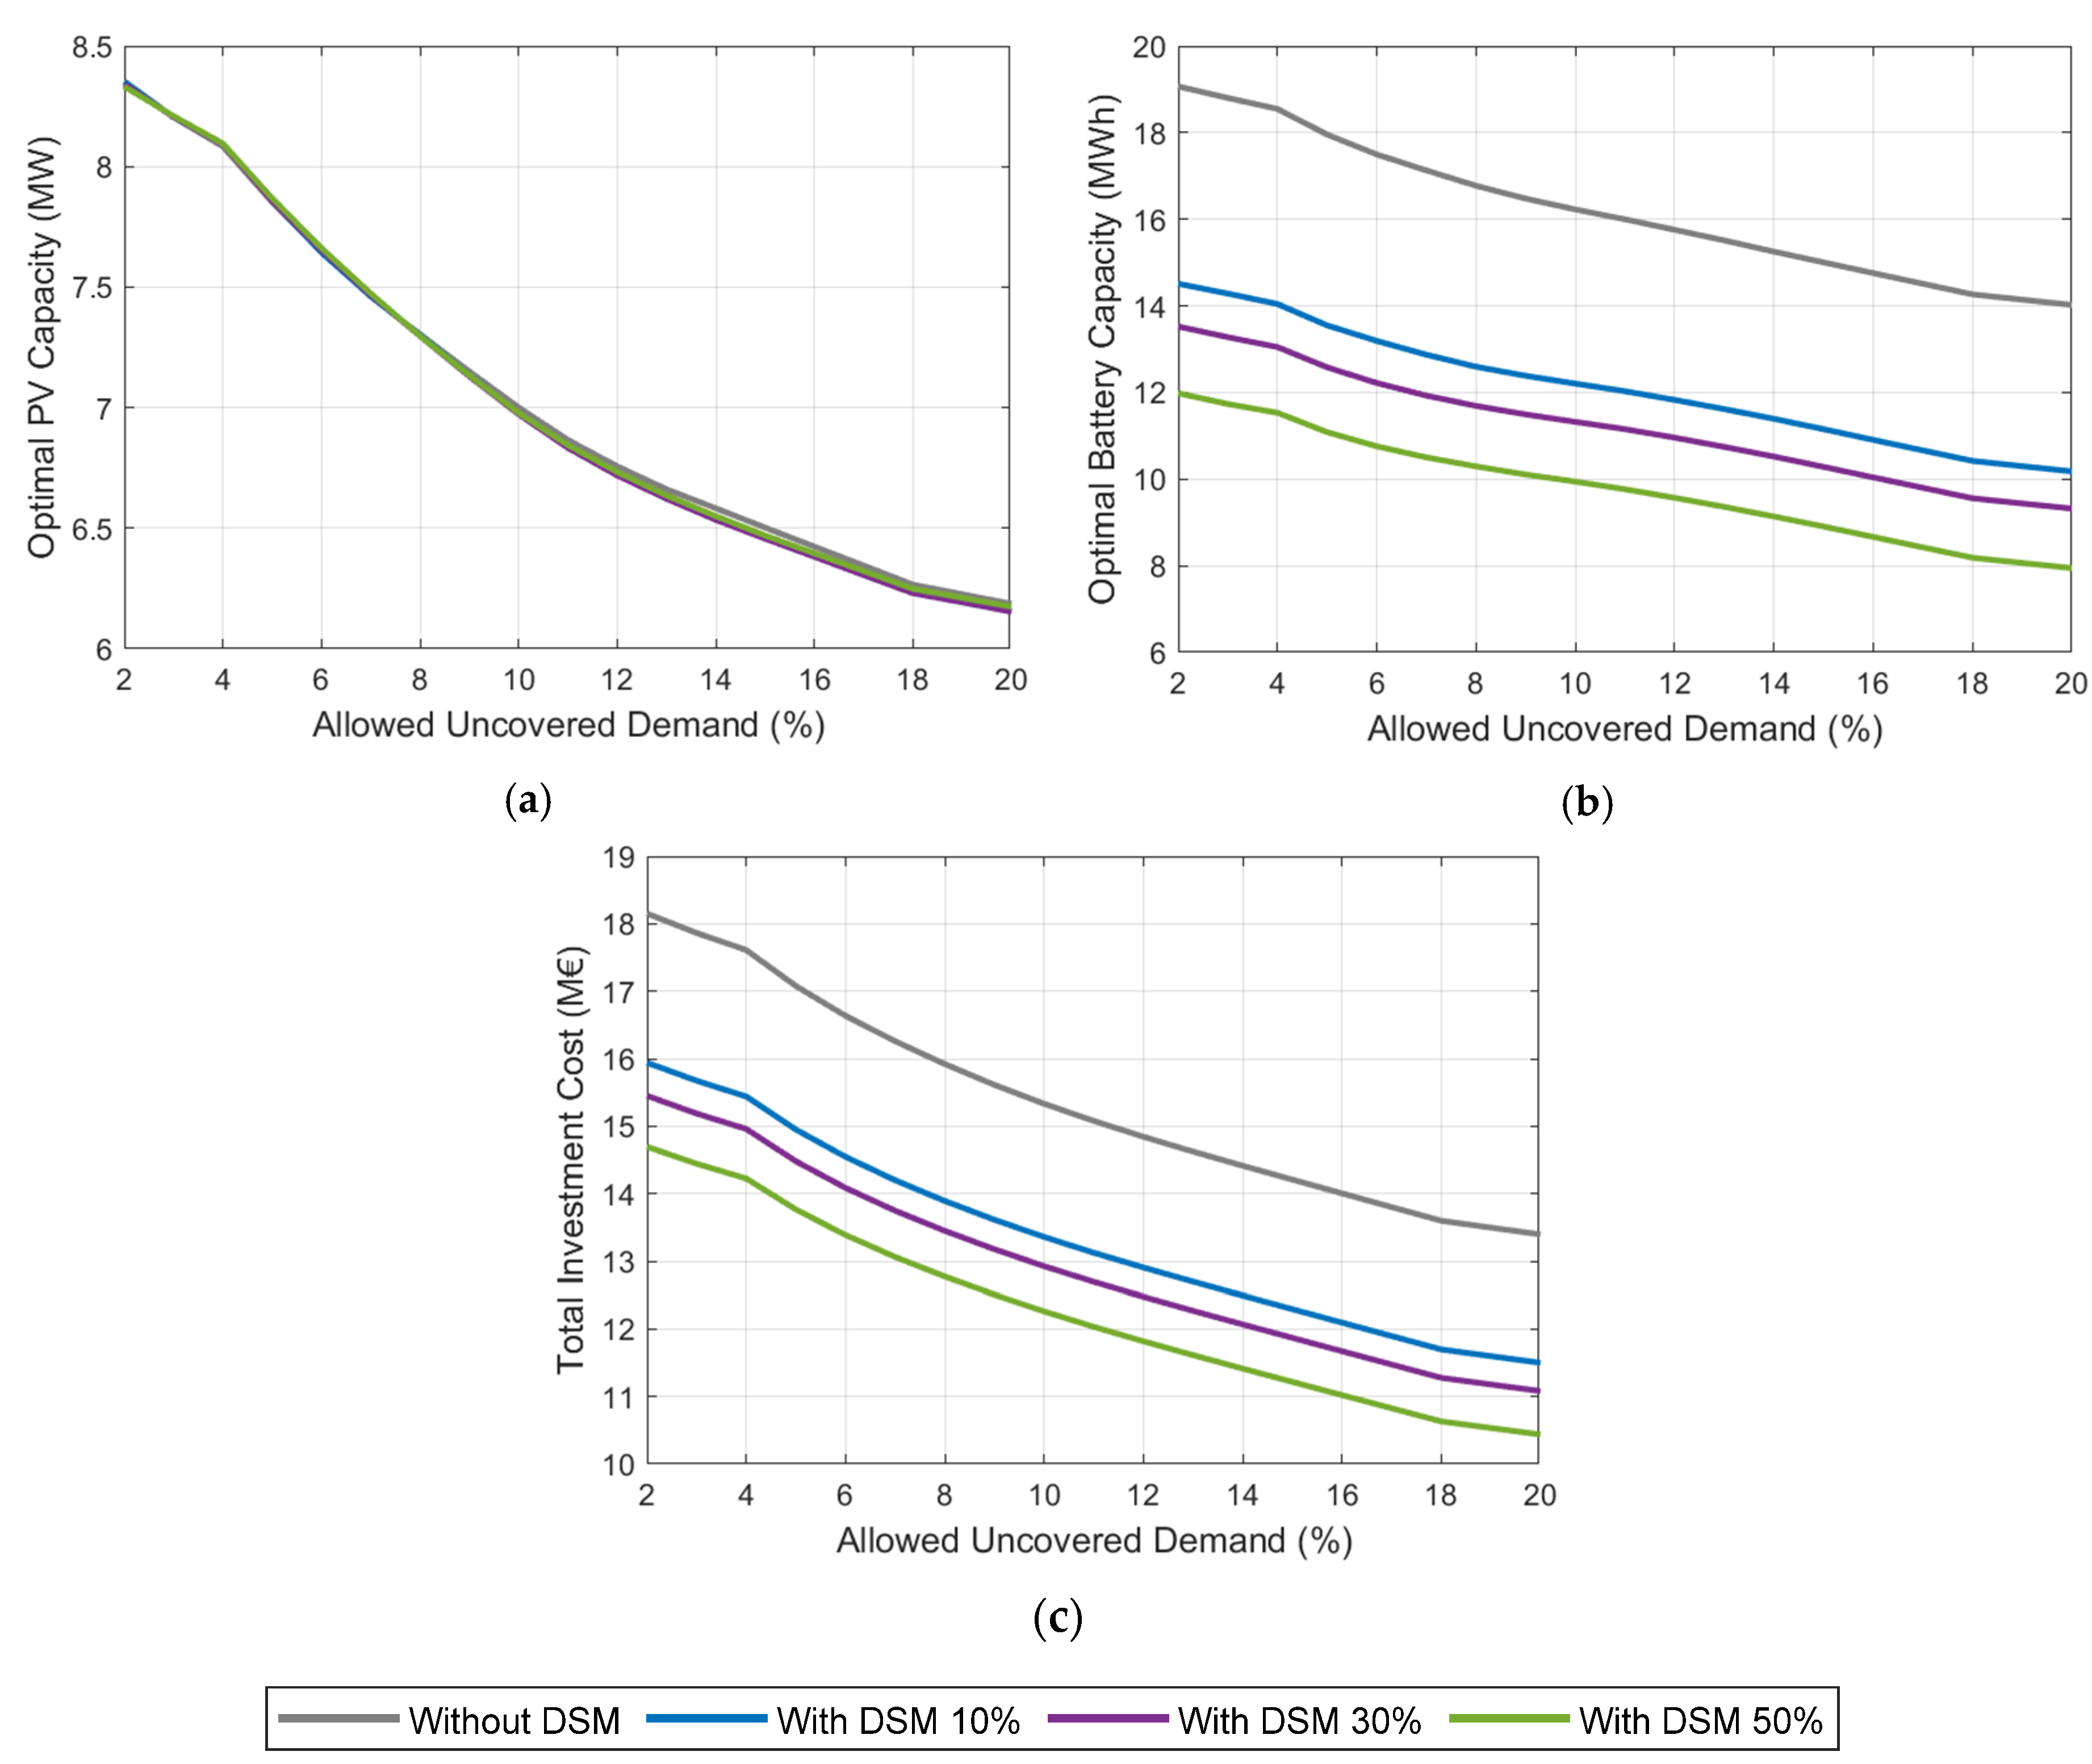
The optimization iterates through a range of allowed uncovered demand values,
, 2 to 20% to analyze system performance and cost sensitivity. It optimizes the solar PV and battery storage capacity for each iteration. For this, a seed value is selected for the solar generation power, which should produce throughout the year approximately the total demanded energy; from this value is determined the value of storage needed to achieve the desired demand coverage. A sweep of installed solar generation power is made and the storage necessary to reach the required coverage level is sized. With all these values of solar power and storage capacities, the minimum is sought according to Equation (13) of the document, i.e., the value of the minimum cost is taken. As seen in
Figure 12, as one might logically expect, there is a decrease in the installed power as the allowed non-coverage level increases, with this decrease leveling off as the allowed non-coverage percentage grows. Regarding the installed solar generation capacities, it is noteworthy that they are hardly affected by the level of DSM considered for the different non-coverage percentages. This holds true for all three DSM levels analyzed, although when no DSM is implemented, there is approximately 1–2% higher power requirement compared to the others. But all of them are between approximately 6.5 and 9 MW when 20 to 2% of unmet demand is admitted.
The situation changes significantly when considering the sizing of batteries to manage generation at different allowed non-coverage levels. There is also a reduction in the required capacity as the allowed non-coverage increases. In this case, there is a clear trend toward reducing the required battery size as the demand shift toward generation increases. Since, in reality, the load is the same in all scenarios, only the timing of when it occurs changes depending on the level of DSM considered; it is logical that there are no significant changes in the required solar generation capacities. This is because the battery system absorbs energy during high-generation periods to supply it during low-generation periods. As such, this system is heavily affected by the degree of DSM, especially when no DSM measures are applied, where the battery size ranges from just over 18 MWh to just under 14 MWh as the percentage of unmet demand increases from 2% to 20%. The changes in storage capacity are much smaller for the three DSM levels considered. For example, with a 10% load shifting, the battery size decreases from just under 14 MWh to about 10 MWh when the unmet demand increases from 2% to 20%. With 30% DSM, the battery capacity is reduced by just 1 MWh for each level of unmet demand compared to the 10% DSM case. This reduction is about 2 additional MWh across the entire range when 50% DSM is implemented.
The combined use of batteries and solar PV generation demonstrates that the DSM strategy has a minimal impact on the required solar PV installation capacity since, in reality, demand does not appreciably change; it only shifts towards generation. However, the most significant changes are observed in the battery storage capacities. When comparing no DSM with a 10% DSM shift, the storage capacity is reduced substantially by approximately 30% across the entire range of uncovered demand allowed (from 2 to 20%). The reductions in storage capacity are more modest in the other DSM scenarios but are still noteworthy, ranging between 10% and 20% for 30% and 50% DSM, respectively. Consequently, the battery size required with 50% load shifting is about 60% of what is needed without any DSM.
Regarding costs (
Figure 12c), since they are proportional to the installed power in the case of generation and to the storage capacity in the case of batteries (Equation (13)), as DSM increases (that is, there is greater alignment between generation and demand), the storage requirements decrease and, therefore, the cost is reduced. Similarly, for each DSM level, if the percentage of demand non-coverage is varied, the system size is reduced and, consequently, so is the cost. Therefore, as shown in the figure, costs continue to decrease as the degree of DSM increases, although this reduction is initially more pronounced and then progressively diminishes, asymptotically approaching the costs of the solar system. This is because, if a hypothetical case of total alignment between generation and demand were possible, the installation of storage would be unnecessary, representing the minimum possible cost for each level of demand non-coverage.
4. Discussion
This study investigates the performance of solar power generation systems in meeting the electricity demand of EVs. The analysis begins with the assumption of a unitary demand (1 MWh of hourly average demand), which allows examining systems behavior across any range of scales, from small, off-grid systems to large, grid-connected installations. The focus is on understanding how different power generation storage capacities and DSM policies affect the ability to cover EV charging demand, considering both the limitations of solar energy variability and storage systems.
The research shows that, while shifting the entire charging load is not feasible due to user behavior and other constraints, implementing DSM can improve system performance by guiding users toward specific charging habits. This, in turn, increases the portion of EV charging that can be met by solar PV energy. The analysis compares different scenarios of DSM implementation (0%, 10%, 30%, and 50% load shifting), showing how demand can be shifted to coincide with solar energy production hours.
The study concludes that, when storage use is not considered, the optimal solar generation capacity for EV charging without DSM is approximately 1.0 MW for an average hourly demand of 1 MW (8760 MWh per year), providing demand coverage close to 30%. When DSM strategies are applied, coverage increases, and a higher implementation of DSM results in better performance and lower surpluses, with demand coverage around 40% for installed capacities between 1.5 and 2.0 MW and DSM of 10 to 50%.
On the other hand, integrating batteries with solar generation helps manage surpluses and unmet demand, significantly increasing the coverage achieved and reducing the required storage capacities when DSM measures are implemented. The results highlight that DSM policies improve the efficiency of solar energy systems and reduce the need for large storage capacities, making the system more cost-effective and sustainable. Batteries play a decisive role in storing excess energy, while DSM helps align demand with solar generation, enhancing system performance and minimizing excesses or unmet demand.
The required solar PV powers are not significantly affected by the degree of DSM but are primarily influenced by the percentage of unmet demand allowed (solar PV installations between 8.7–8.8 MW and 6.5–6.6 MW for unmet demand between 2% and 20%). The shift from no DSM to a 10% load shifting results in approximately a 25% reduction in storage capacity for the analyzed range of unmet demand (from 18 to 14 MWh for 2% unmet demand without and with 10% DSM, and from 14 to 10 MWh for 20% unmet demand). The reduction reaches almost 40% in battery capacity when moving from no DSM to 50% load shifting (from 18 to 11.5 MWh for 2% unmet demand without and with 50% DSM, and from 14 to 7.5 MWh for 20% unmet demand).
The following considerations can be drawn to deepen the reflections on the results presented throughout the current research work:
The solar PV generation results obtained for the Western Mediterranean region are an average generation of 1.4 GWh/MW per year (CF = 16%) and an inter-annual variability with a confidence interval of less than 3%, indicating considerable stability in solar generation. This behavior, characterized by fluctuations of minimal significance, is likely extensible to other regions with medium to high irradiance, as solar generation in areas with good solar radiation, such as the Mediterranean, tends to be more constant and predictable, facilitating long-term energy planning.
Aligning EV charging with renewable energy helps reduce surplus energy and maximize resource use more sustainably. The expected growth in the EV fleet will increase energy demand significantly, requiring larger generation capacities, with solar PV power being a key source. However, solar PV generation varies throughout the day and year, especially in winter when sunlight is limited, raising concerns about optimal system sizing.
EVs contribute to demand variability and, although users’ usage habits can be partially modified, it is not feasible to fully modify their load. Nevertheless, the expected strong penetration of EVs in the near future presents an opportunity to apply DSM policies. In the context of this study, DSM focuses on shifting EV charging from nighttime (typically at home) to daytime (e.g., workplace charging), helping reduce the need for costly grid reinforcements. Incentives like free or discounted charging during solar hours and the installation of smart chargers are key enablers. As seen in
Figure 5, the profile most specifically aligned with solar generation is workplace charging, which should fundamentally favor this type of charging. Along these lines, several DSM scenarios (0%, 10%, 30%, and 50% demand displacement) are analyzed in the current document to assess the impact on solar PV generation and demand coverage.
The analysis shows that, as demand shifts toward midday (due to the application of DSM measures), demand coverage appreciably improves, requiring larger generation capacities to meet demand. Nevertheless, as DSM increases, generation and demand become better aligned, reducing the need for storage and, consequently, system costs. Similarly, allowing a higher percentage of demand non-coverage reduces system size and cost. However, while cost reductions are significant initially, they exhibit diminishing returns at higher DSM levels.
An optimal balance in system sizing needs to be achieved, where solar PV power is sized to maximize coverage in summer without creating excessive surpluses in winter. The analysis indicates that a system with about 0.5–1.0 MW of PV power offers the best balance between coverage (around 30%) and surplus (below 10%) without DSM for an average hourly load of 1 MW throughout the year. System performance improves notably with the implementation of DSM policies, reaching about 40–50% coverage with controlled surpluses (around 10%) for installed powers of about 1.5–2.0 MW.
Battery storage is essential to handle the variability of solar generation. Combining solar PV with storage systems ensures a stable power supply. The analysis shows that, as the allowed non-coverage level increases, the required installed solar power decreases, with DSM policies reducing battery size needs. A 10% DSM shift can reduce battery size by about 25% (differences between no DSM and 10% DSM from 18 to 14 MWh for 2% uncovered load and from 14 to 10 MWh for 20% of uncovered load), while further reductions are smaller, resulting in battery sizes roughly 60% of what is required without DSM (from 11.5 to 7.5 MWh for 2 to 20% of uncovered load for 50% DSM).
A key strength of the presented approach is its adaptability. Starting with this unitary average demand allows for examining system behavior across “any range of scales”, from small, off-grid systems to large grid-connected installations. By using statistical techniques like Best Estimate Plus Uncertainty (BEPU) to model the variability of local solar resources, the framework can be applied to “any other site” by simply obtaining the relevant historical data for that region. The optimization framework can be adapted to different site sizes, demand patterns, and regional solar conditions, making it suitable for both urban and rural deployments. This aligns with recent literature emphasizing the importance of flexible scenario-based planning.
There are no analyses that specifically address the problem described in the current research work, but it can be highlighted that the study by Yan and Ma [
31] also studies the planning and sizing of systems, but focuses on charging stations. It considers the uncertainties of electric vehicle demand and photovoltaic generation. They explicitly compare their stochastic planning model with a deterministic model using only mean profiles. Their findings indicate that uncertainties affect the optimal sizing results, which supports the value of using stochastic models such as the one used in this study. Both show the economic benefits of integrating renewable energies, such as photovoltaics, in the planning of the imminent massive irruption of EVs, in the case of the aforementioned paper, applied to charging stations. The results of the current and commented studies are consistent, as they propose power and storage capacities in similar orders of magnitude, although the current average unit demand is well above the considerations of Yan and Ma’s work, more than an order of magnitude below in the case of higher demand requirements.
A similar approach has been explored in Bastida-Molina et al. [
28], where DSM is also explored in charging EVs at a big-island scale. However, system sizing is based on demand coverage, and neither costs nor uncertainties were considered. The present study highlights the importance of finding the optimal balance between system cost and performance, providing insights into sizing and economic feasibility.
By providing a method for determining optimal system sizes (i.e., PV and battery capacity) under economic, realistic, and uncertain conditions, no inadequate system sizing is proposed. While approaches focusing on scheduling [
38] or real-time dispatch [
32], which optimizes the system’s operation, its effectiveness is constrained by the installed infrastructure. They cannot overcome fundamental limitations imposed by undersizing or inappropriate component selection that do not account for uncertainty.
5. Conclusions
Aligning electric vehicle charging with solar power generation improves resource utilization, but the variability of solar energy and demand complicates its exclusive use. Seasonal generation and demand variations affect system sizing, with lower solar generation in winter and greater surpluses in summer, and usually higher demands in summer than in winter. This study developed an optimization framework to balance PV generation, battery storage, and Demand-Side Management (DSM) strategies.
Without storage, installed power of about 1 MW of solar PV generation would cover close to 30% of an hourly average demand of 1 MWh over the entire year. However, DSM strategies can increase this coverage to 40–50% for installed capacities of 1.5–2.0 MW with DSM levels between 10% and 50%. The addition of battery storage allows renewable energy coverage to approach 100%. Still, the required system storage capacity is highly dependent on the implementation of DSM measures, dropping from 18 MWh when no DSM measures are implemented to approximately 10 MWh when they are implemented. The optimization results highlight the trade-offs between renewable generation, storage capacity, and demand flexibility, reinforcing the importance of coordinated energy management strategies. The influence of battery technology choices, considering both current and projected costs, would be a valuable contribution. However, in the context of the present work, cost parameters have been used solely to identify optimal system configurations based on existing technologies and market conditions.
Future research would explore hybrid generation systems combining solar and wind energy, evaluating the need for backup systems such as biomass, geothermal, or fossil-fuel options. Over-dimensioned storage systems combined with batteries will be considered, along with technologies like pumped hydro storage or Compressed Air Energy Storage (CAES) to stabilize energy supply during low generation periods. Another focus will be the analysis of DSM contributions across various sectors, aiming to optimize energy consumption and identify sector-specific strategies to align demand with renewable production. The potential of Vehicle-to-Grid (V2G) technology, allowing EVs to supply energy back to the grid, will also be explored to enhance energy storage and grid stabilization. Research will investigate the technical, economic, and regulatory challenges of V2G or Vehicle-to-Home (V2H) integration. Additionally, developing advanced Energy Management Systems (EMSs) using real-time data, intelligent algorithms, and machine learning will be pursued to optimize energy generation, storage, and consumption in hybrid renewable energy systems.


