Article

A Methodology for Characterizing Lithium-Ion Batteries Under Constant-Current Charging Based on Spectral Analysis

Faculty of Mechanical Engineering, University of Ljubljana, Aškerčeva 6, 1000 Ljubljana, Slovenia
*
Author to whom correspondence should be addressed.
World Electr. Veh. J. 2025, 16(6), 308; https://doi.org/10.3390/wevj16060308
Submission received: 28 March 2025 / Revised: 27 May 2025 / Accepted: 28 May 2025 / Published: 30 May 2025

Abstract

:
This study addresses the challenge of gaining a deeper understanding of charging and discharging mechanisms in lithium-ion batteries to enhance their reliability and safety, necessitating the development of novel modeling techniques. A comprehensive analytical model is introduced, capable of accurately reconstructing the voltage rise during constant-current charging. The novelty of this approach lies in its use of spectral analysis (similar to that employed in linear viscoelasticity) to describe the physical processes occurring during battery charging. The model’s effectiveness was validated using experimental data from a rechargeable lithium-ion battery with a nominal capacity of 25 Ah and a nominal voltage of 3.2 V. The results demonstrate that spectral characterization is a reliable tool for modeling battery response to constant-current charging, with the potential for application in battery lifespan prediction.

1. Introduction

Rechargeable batteries have become essential across numerous sectors, including energy, transportation, and consumer electronics, owing to their wide-ranging practical applications. The performance of these batteries is largely determined by factors such as their capacity, power output, and overall lifespan [1,2,3,4]. However, accurately predicting a battery’s lifetime prior to installation remains a complex challenge. This is due to the gradual chemical and mechanical degradation that occurs within the battery’s structure over time [5,6,7,8].
One key factor contributing to performance degradation is the distinct usage pattern associated with each user and application, which complicates predictions of battery lifespan. With advancements in technology, lithium-based rechargeable batteries are progressively replacing traditional chemistries like lead–acid, NiMH, and NiCd. Lithium-ion batteries (LIBs) offer several significant advantages, including a higher energy storage capacity, an improved weight-to-capacity ratio, greater versatility in applications, and enhanced electrical properties [9,10,11,12]. As a result, LIBs are now widely used in a variety of sectors, including household appliances, consumer electronics, electric vehicles (EVs), and large-scale grid energy storage systems.
Despite significant advancements in the design and application of LIBs, challenges remain, particularly with regard to their service lifetime (durability) and safety. These issues are especially critical in applications where the battery serves as the primary power source, such as in transportation vehicles or emergency power systems, where maintaining operational readiness is vital.
To reduce development costs and assess potential safety vulnerabilities, including estimating the battery’s cyclic lifetime, researchers have proposed a variety of numerical modeling approaches in the recent literature (e.g., [13,14,15,16]). These models address key factors such as battery efficiency, performance degradation, and structural integrity over time. Barré and colleagues [17] classified these approaches into the following categories:
  • Electrochemical models;
  • Equivalent circuit models;
  • Performance-based models;
  • Analytical models with empirical fitting;
  • Statistical approaches.
By leveraging these numerical modeling techniques, researchers seek to gain a deeper understanding of the charging and discharging mechanisms in batteries, with the goal of enhancing their overall reliability and safety.
Over the past decade, numerous researchers have focused on modeling LIBs (e.g., [18]), with one notable contribution being the introduction of parameter identification based on fractional-order theory. This paper offers a comprehensive overview of the current state of the art, while also advancing the conventional second-order RC integer equivalent circuit model. The authors conducted an in-depth analysis of LIBs using electrochemical impedance spectroscopy (EIS), revealing impedance elements with fractional orders, such as the constant phase element and the Warburg element. Additionally, they developed a fractional-order equivalent circuit model for LIBs, which demonstrates high accuracy in capturing the complex electrochemical processes within these batteries. This includes phenomena like charge transfer reactions, the double-layer effect, and the mass transfer and diffusion of lithium ions.
Interesting results are presented in paper [19], where the authors investigate the performance of different battery types in electric vehicles to support the selection of the most suitable battery. Their analysis considers operating temperature and discharge current, employing a thermoelectric model that effectively reflects battery safety and lifespan. Using MATLAB, Version: 8.1.0.604 (R2013a), the authors integrated data from multiple references into lookup tables, which dynamically influence parameter changes within the electrothermal model.
In recent years, artificial intelligence (AI) methods, particularly those employing neural network algorithms, have been widely used for numerical parameter estimation and comparative analysis of lithium-ion batteries (LIBs); see, e.g., [20,21,22,23,24,25]. Artificial intelligence algorithms have demonstrated strong potential in extracting valuable insights from multivariate time-series data. However, these algorithms generally require large volumes of training data, which are costly and time-consuming to obtain in the context of end-of-line battery testing. Meanwhile, these algorithms are capable of effectively modeling complex nonlinear relationships between battery parameters and states, allowing for accurate estimation of key metrics such as state of charge (SOC) and state of health (SOH).
The equivalent circuit model (ECM) is widely used in battery management systems (BMSs) for monitoring and regulating LIBs. The study by Tran et al. [26] highlights the complex compatibility between different ECMs and various LIB chemistries, which is a critical factor for real-world battery and BMS applications. By evaluating the performance of three commonly used ECMs—a first-order ECM, a second-order ECM, and a first-order ECM with hysteresis—under both dynamic and non-dynamic current profiles across four different battery chemistries, the study demonstrated their ability to accurately predict battery voltage with minimal error. In the context of electric vehicle (EV) applications, Han et al. [27] propose a simplified, physics-based LIB model specifically designed for BMS integration. Their work introduces an approximate approach to tackle challenges related to solid-phase diffusion and electrolyte concentration distribution. Additionally, several other researchers [28,29,30,31,32,33,34,35] have employed ECMs to investigate the behavior of LIBs during charging and discharging cycles, offering valuable insights into the operation and performance of these systems. As well, paper [36] presents a comparative study on parameter identification for an equivalent circuit model of a Li-ion battery based on various discharge tests. Interesting results on the parametric correlation analysis between the equivalent circuit model (ECM) and mechanistic model interpretations of battery internal aging were reported in [37]. Reference [38] proposes the application of a novel Spotted Hyena Optimizer to identify unknown parameters of a modified equivalent circuit model using manufacturer data sheets.
Determining battery states is a complex task. In recent years, a wide range of methods for battery state estimation have been proposed in the literature, including electrochemical models, ECMs, and neural network-based approaches. The ECM is widely used in many battery applications due to its fast execution time, simplicity, and relatively high accuracy [39]. However, the ECM has limitations, particularly when it comes to extrapolating performance under extreme operating conditions. When a battery is pushed to its operational limits—such as in high-current applications or under very low temperatures—the ECM’s accuracy diminishes, making it less suitable for these demanding scenarios [31,40].
The main goal of this paper is to establish a novel framework for analyzing the response of lithium-ion batteries to constant-current (CC) charging, in parallel with existing models such as the ECM and others. The important outcome of the work is a comprehensive analytical modeling technique that accurately reconstructs the voltage rise during CC charging of a battery. The newly developed model is based on the introduction of a retardation spectrum similar to that used in linear viscoelasticity, e.g., only a few model parameters, calculated on the basis of experimental data, allow the entire voltage curve to be represented. Another important innovation of the proposed approach is the introduction of a cut-off point on the voltage curve, which divides the entire voltage curve into two independent parts, namely the first part modeled using the retardation spectrum and the second part modeled using progressive terms in series. Such a division reflects the different physical and chemical processes that occur in the two modes of battery charging. The developed methodology not only enables the determination of battery states but is primarily aimed at characterizing the battery itself in the current operating cycle. Particular attention is paid to the stability of the numerical calculation scheme for determining the model parameters, which provides satisfactory accuracy for estimating the battery state.

2. The Methodology Based on Spectra Generation and the Experimental Setup

When charging a lithium-ion battery, the voltage response U(t) to an input current I(t), applied instantaneously as a step function, is measured (see Figure 1). The resulting curve exhibits a characteristic “inflection point”. This behavior is indicative of two distinct phases. In the first phase, prior to the inflection point, the gradient of the function U(t) decreases, forming what is referred to as the “primary curve”. This phase closely resembles the phenomenon of creep observed in linear viscoelasticity. In the second phase, after the inflection point, the gradient increases, and we call this a “secondary curve”.
At first glance, the curve U(t) resembles the creep response of polymeric materials subjected to an instantaneously applied stress. However, while conventional creep behavior in polymers typically involves a monotonic gradient in the creep compliance function, the behavior observed in the battery during charging differs. Unlike polymers, the battery exhibits a distinct “creep” response when charged fully to its maximum voltage. It is important to note that this study focuses on the battery’s response within a single cycle of full charge.
Therefore, the core idea of our methodology is as follows:
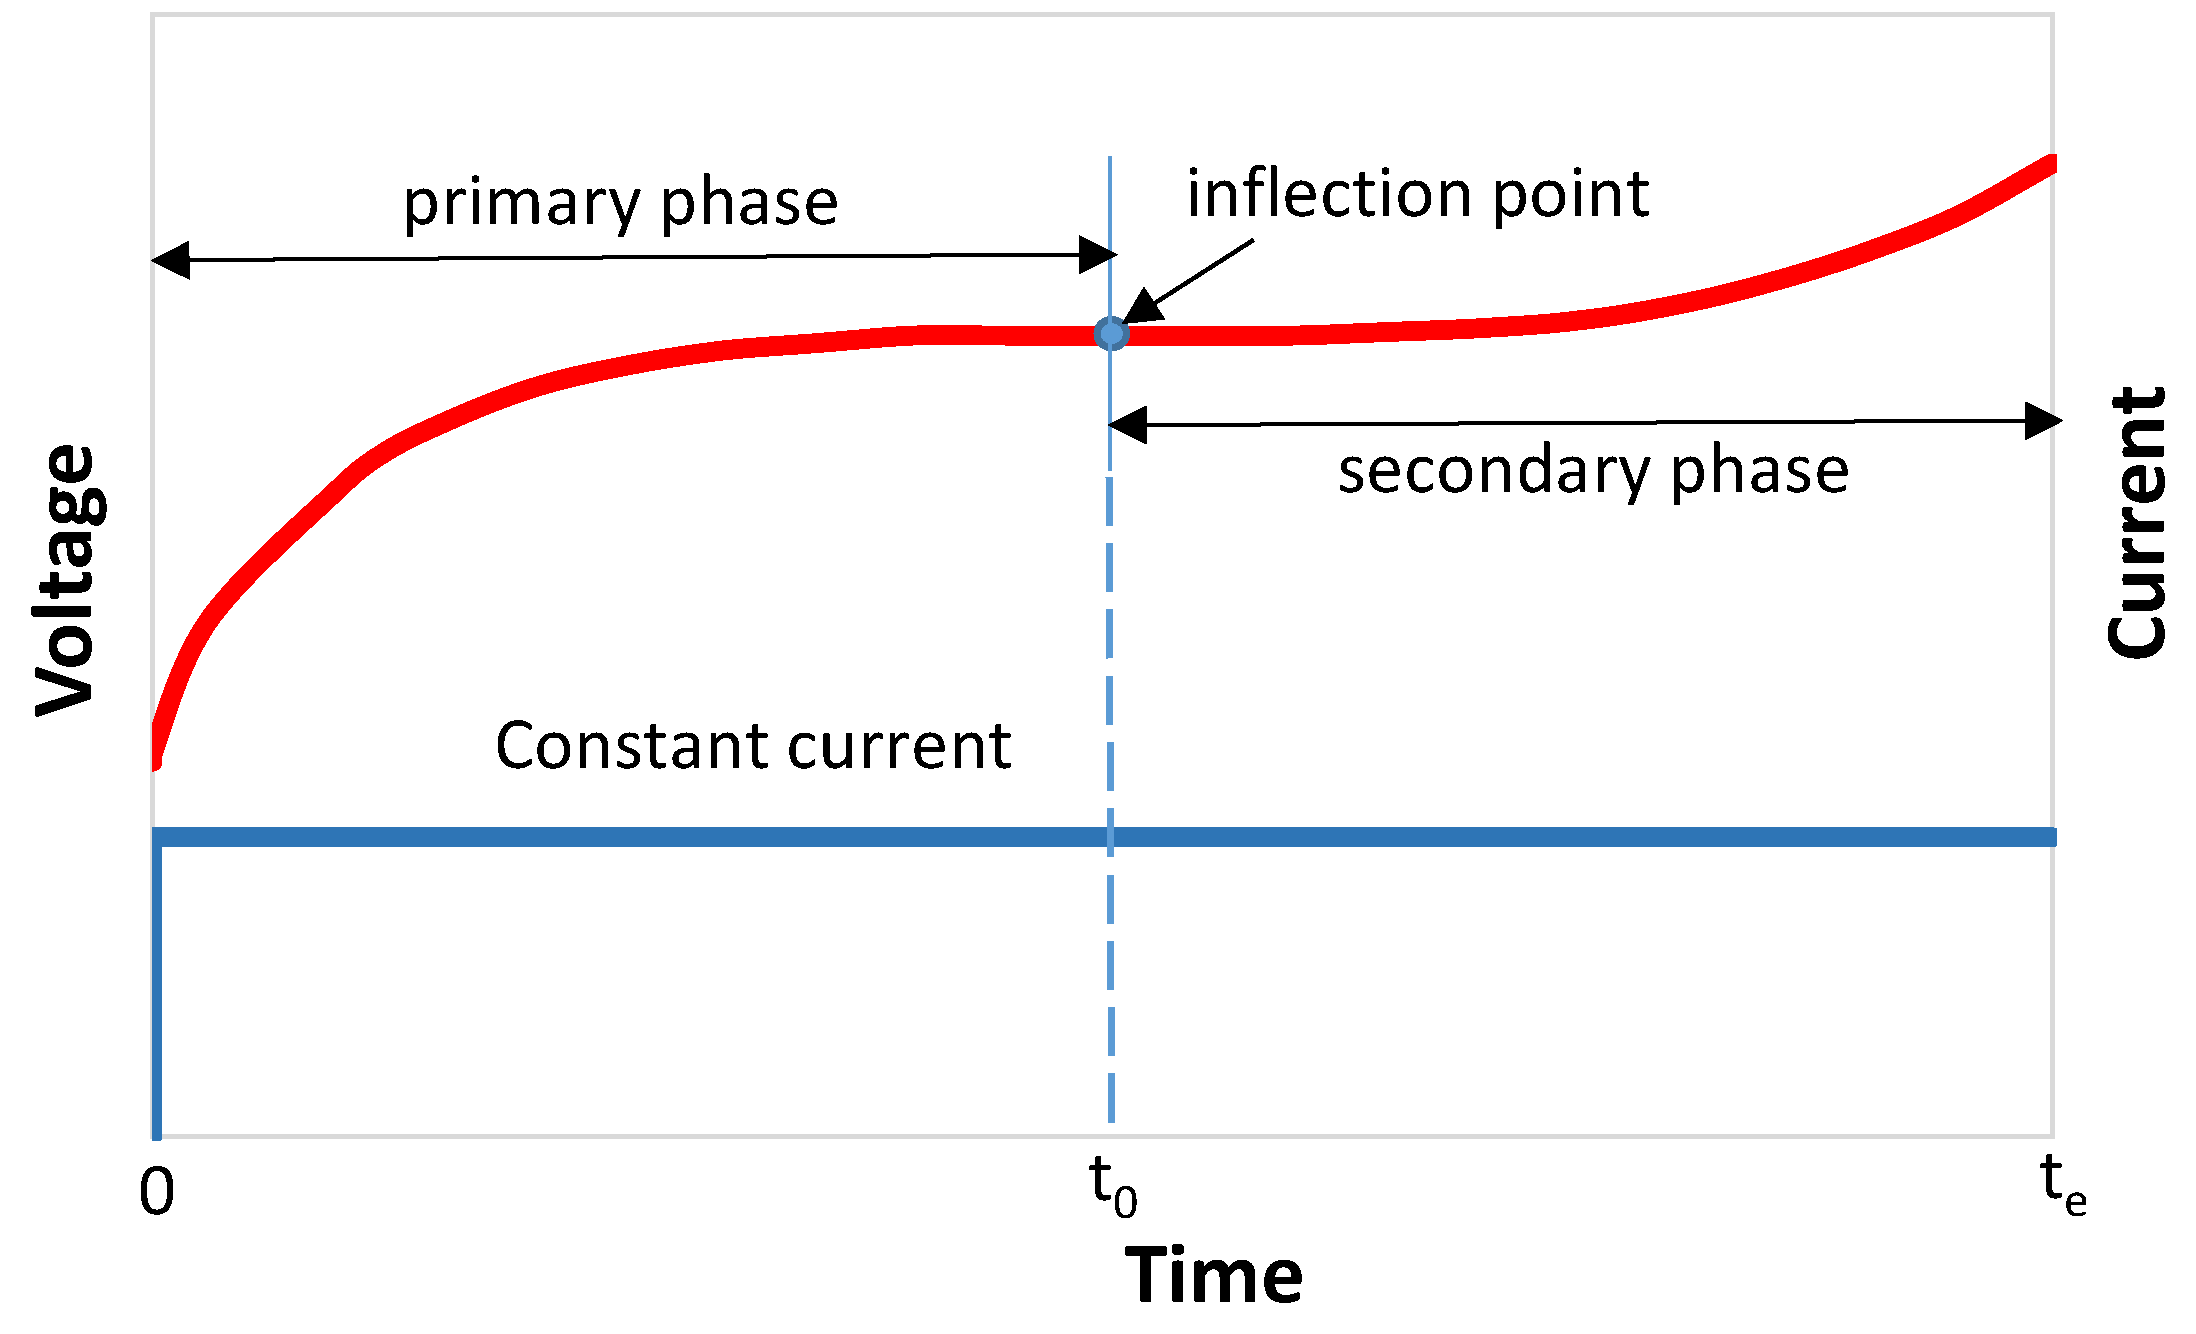
  • Divide the complete voltage curve U(t) into two distinct phases (see Figure 1). The first (primary) phase includes data from the starting point up to the inflection point, while the secondary phase covers the data from the inflection point to the endpoint.
  • Calculate the discrete spectrum using the experimental data from the first phase of the curve.
  • Subtract the theoretically modeled curve (approximated over the entire range, from the starting point to the endpoint) from the experimental curve. This results in a monotonically increasing curve that includes data from the time range between the inflection point and the endpoint. We refer to this as the secondary curve.
  • Calculate the discrete spectrum for the newly obtained curve.
To approximate the primary curve, we use the built-in nonlinear least-squares method in MATLAB, Version: 8.1.0.604 (R2013a), employing the Levenberg–Marquardt algorithm. The model itself is based on a standard linear solid connected in series with viscous elements, a framework commonly used for polymers. The primary phase is modeled using a six-element standard Voigt model, with an additional linear term. It is important to note that the discrete spectrum determined numerically is not unique, as is well known from the rheological analysis of polymeric materials.
Without loss of generality, we define the following terms clearly:
The primary phase is the time interval 0 to t 0 (see Figure 1) over which the voltage is accurately represented by an electrical creep function consisting of a linear term plus the sum of the Voigt elements:
V t = V 0 + t μ n + i = 1 n η i 1 e t / τ i .
where V(0) is the voltage value at the initial time, μ n is the analog of the factor related to the steady-flow viscosity used for viscoelastic materials, and η i and τ i are parameters defining the behavior of the primary curve, referred to as the discrete retardation spectrum. In particular, τ i denotes the time constant of a single response, which is a parameter of the optimization process. η i is the steady-state value of that same response and is also an optimization parameter. The sum of several such responses describes the overall characteristic of the battery in the first part.
In general, for each type of excitation applied to a system, a corresponding transfer function can be identified. In the case of a battery subjected to a constant current, this transfer function is represented by the retardation spectrum, defined by pairs ( η i , τ i ). The retardation spectrum models the time-dependent structural rearrangements within the battery, which arise due to chemical reactions induced by the current. These rearrangements manifest as a gradual increase in voltage over time.
Analogous to the viscoelastic spectrum used for polymeric materials, the retardation spectrum characterizes the temporal distribution of a battery’s responses when exposed to a constant current. The retardation line spectrum consists of a discrete set of voltage–retardation time pairs, ( η i , τ i ), where the time intervals τi may be equally or unequally spaced along the response time axis.
The secondary phase is the time interval t 0 to t e (see Figure 2) over which the voltage increases above the value of U ( t 0 ) . The voltage reaches it maximum safe value at time t e . The terminal time t e is defined by U max = U t e , a safe maximum value.
In the first phase, we observe an analogy with linear viscoelasticity, where modeling the primary phase using a Kelvin–Voigt series is similar to an RC network. The derivative of the electrical creep compliance in this phase is completely monotonic.
In the secondary phase, changes in the electrochemical processes disrupt the monotonicity, causing the linear viscoelastic analogy to break down. Despite this, spectral characterization remains feasible, as it will be shown in the next section.

Experimental Setup

The real response of the voltage U(t) resulting from the current I(t), applied instantaneously as a step function, which is the basis for further numerical analysis, was experimentally obtained using the commercial experimental setup and the employed lithium-ion battery. This included the high-precision battery tester LBT21 Series, produced by Arbin Instruments, USA (see Figure 2a). The battery tester has eight independent test channels, each capable of supplying up to ±60 A DC current and 0 to 5 V DC voltage to the connected batteries. Both electric current and voltage have a 24-bit measuring resolution and accuracy below ±0.02% of the full scale. A control tower PC with Arbin’s propriety software was used to control the experiment and to assemble electric and temperature (voltage) readings. The rechargeable battery under investigation was a LiFePO4-type pouch cell with a nominal capacity of 25 Ah and 3.2 V nominal voltage (see Figure 2b). The operating voltage range is between 2.50 V and 3.65 V. The cell allows a 1C charging rate for up to 40 min and up to 2C discharging rates. The rated life is about 2000 working cycles.
The experiment was conducted at room temperature, while the actual temperature of the cell’s surface was also continuously measured and recorded. The cell was first completely discharged to set the base line; afterwards, the cell was charged with 1C rate, equivalent to 25 A electric current, for 3340 s.

3. Numerical Calculations and Error Analysis

According to the methodology presented above, we divide the complete curve into two phases, i.e., the primary phase is from the initial point until time t 0 , and the secondary phase is from time t 0 until the last point, i.e., time t e . Therefore, the complete curve U ( t ) is modeled by the following equation:
U ( t ) = V ( t ) + H ( t t 0 ) W ( t ) .
where V ( t ) is the voltage of the primary phase represented by Equation (1) and W ( t ) is the voltage of the secondary phase of the complete voltage curve. Note that H(.) denotes the Heaviside unit step function.

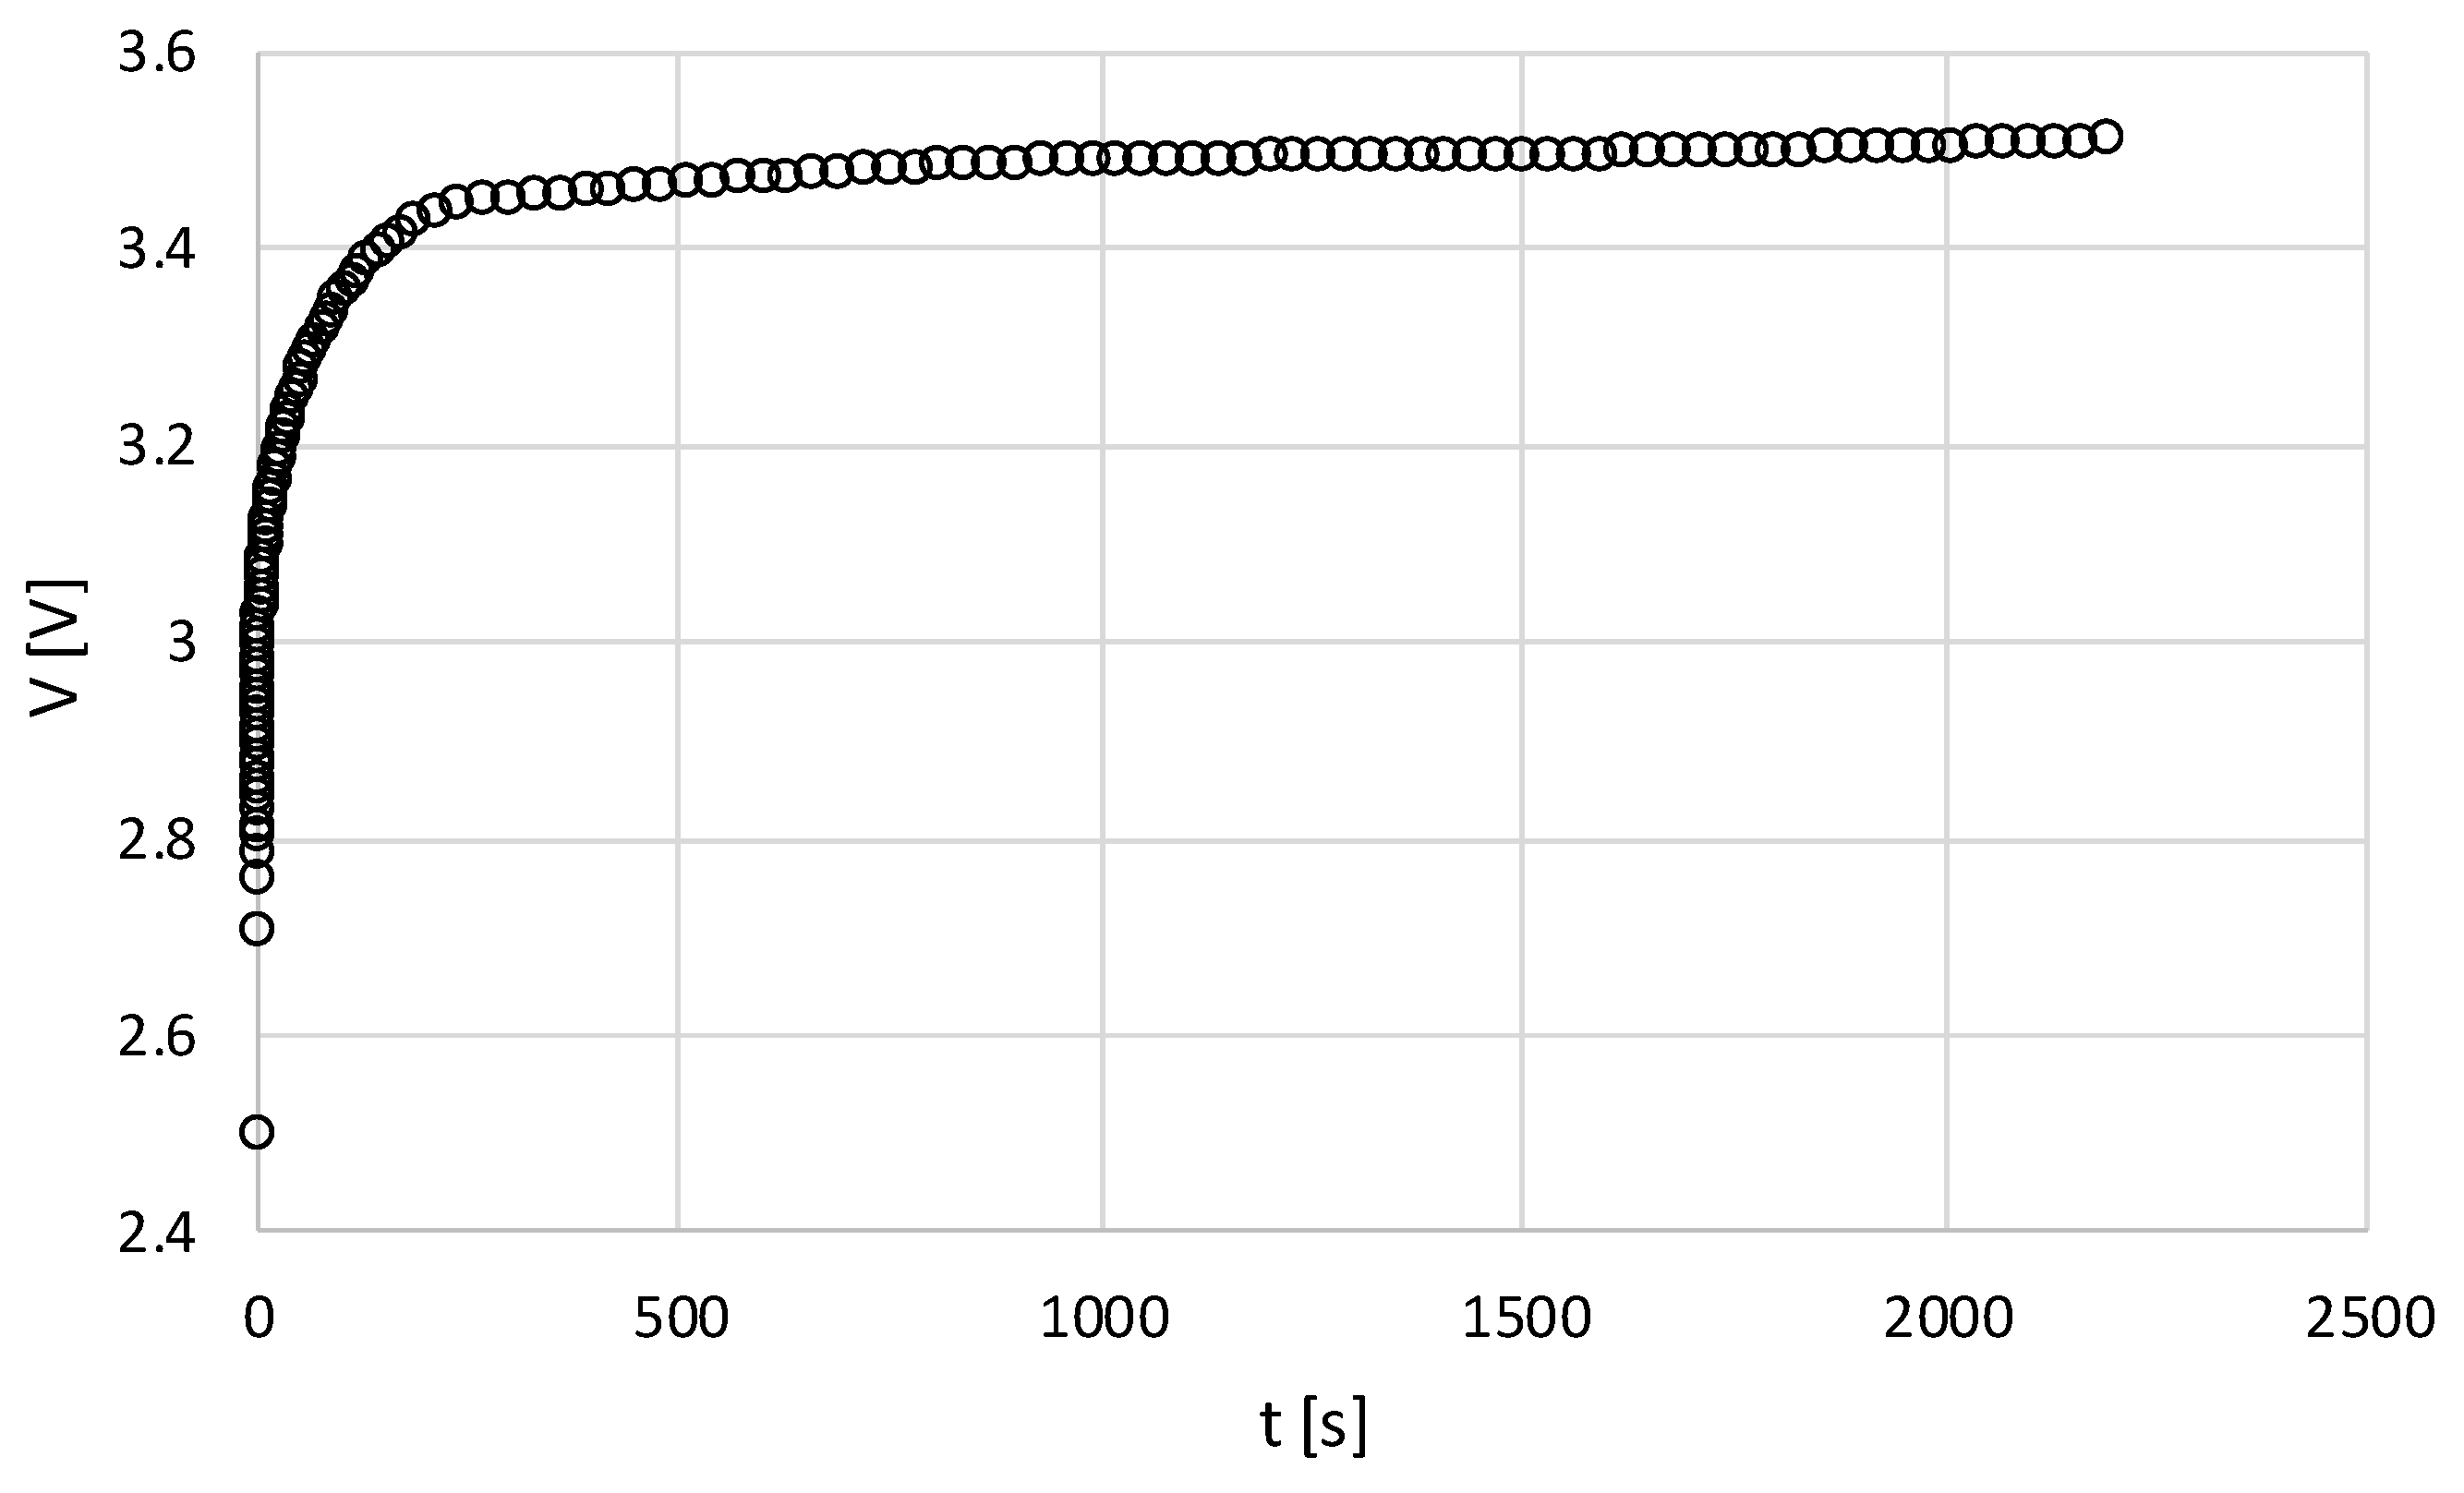
3.1. Fitting the Primary Phase of the Voltage Curve

The experimental data within the primary phase are shown in Figure 3. Note that, according to the definition provided in Section 2, the primary phase consists of the experimental data preceding the inflection point, which divides the overall experimental window into two distinct phases: primary and secondary. Mathematically, the inflection point is defined as the point on the voltage curve V(t) where the second derivative of the function changes sign from negative to positive.
The primary phase can be modeled using the so-called “discrete retardation spectrum” ( η i ,   τ i ) , related to the rheological behavior of polymeric materials; see Equation (1). The parameters in Equation (1) were determined using two numerical approaches: (i) a generic algorithm and (ii) the Levenberg–Marquardt method.
The package GA (19 October 2022) was used for calculating model parameters. This versatile and adaptable toolbox is designed to implement genetic algorithms (GAs) for stochastic optimization. It offers support for three different types of representations, binary, real-valued, and permutation, allowing users to optimize their fitness functions in alignment with their specific objectives. The toolbox provides a range of genetic operators that can be seamlessly combined to explore optimal settings for the task at hand. Furthermore, users have the flexibility to define and evaluate their custom genetic operators, making it a powerful and customizable tool. To further enhance optimization, the toolbox includes the option for stochastic local search, utilizing general-purpose optimization algorithms to exploit promising regions of the search space. GAs can be executed sequentially or in parallel, with options for explicit master–slave parallelization or a coarse-grain islands approach. This flexibility ensures that the toolbox can efficiently adapt to a wide range of optimization tasks.
The second approach for spectrum calculation was based on the Levenberg–Marquardt method implemented in the Matlab environment. In the realm of mathematics and computing, the Levenberg–Marquardt algorithm, commonly abbreviated as LMA or simply LM, is renowned as a damped least-squares (DLS) method. This method plays a pivotal role in tackling minimization problems, particularly in the context of least-squares curve fitting. LMA operates as an intermediary, bridging the gap between the Gauss–Newton algorithm (GNA) and the gradient descent method. Notably, LMA exhibits greater robustness than GNA, making it capable of converging to a solution even when initiated at a substantial distance from the ultimate minimum. Originally conceived for nonlinear parameter estimation challenges, the Levenberg–Marquardt method has also proven its utility in addressing ill-conditioned linear problems. One of its distinctive features is its ability to circumvent the challenges posed by inverting a nearly singular matrix. This is achieved by systematically enhancing the values of each diagonal element in the matrix, essentially imparting regularization to the Gauss–Newton method. In essence, the approach shares similarities with Tikhonov regularization but distinguishes itself by employing a gradually diminishing regularization parameter. This numerical method can also be successfully applied to battery modeling and parameter identification; see, e.g., [41].
As a result of the numerical calculations, the model parameters, e.g., the retardation spectra, were calculated and presented in the following. The initial value of the voltage in Equation (1) is V 0 = 2.499922 V, whereas the parameters in the series are presented as follows in Table 1.
The deviations from the data were estimated by calculating the sum squared errors (SSE) and are also shown in Table 1. Comparing errors of the discrete retardation spectrum calculated by applying both numerical approaches, we may conclude that the Levenberg–Marquardt method gives slightly more satisfactory results when providing coefficients for Equation (1) to model the primary phase of the voltage curve. The sixth element in both spectra displays a retardation time of well over 1 h, which is greater than the time needed to charge the battery fully.
It is well known from the viscoelasticity of polymers that the retardation spectrum is not unique. Choosing the number of elements in the series (2) is always a challenge. For this reason, we selected the proper number of Voigt elements by increasing the number n in series (1) from n = 2 to n = 6 and compared the approximation errors of the resulting voltage V(t). Three types of error estimation were used in the analysis, i.e., (1) sum squared error (SSE), which measures the total deviation of the response values from the fit to the response values; (2) R-square, which measures how successful the fit is in explaining the variation in the data; and (3) root mean squared error (RMSE), which is also known as the fit standard error and the standard error of the regression. The results of the error estimation are shown in Table 2.
The results presented in Table 2 show that all three types of errors decrease as the number of Voigt elements increases.
The above series approximates the experimental curve well, until the time t 0   = 2278.7 s. The result of approximation is shown in Figure 4, where the dotted curve presents the experimental data, and the continuous line is the result of modeling.
After subtracting the theoretical prediction from the experimental data, we obtain the following function related to the secondary phase of the curve, as shown in Figure 5.
The initial part of the curve presented in Figure 5, i.e., until time t 0 = 2278.7 s, should be equal to zero. Deviation of the function W t from the value zero, which is observed on the graph within the time interval 0     t     2278.7 s, is caused by errors of approximation of the primary curve (see Figure 3). In the further fitting procedure of the secondary phase of the voltage curve, we neglect these deviations.

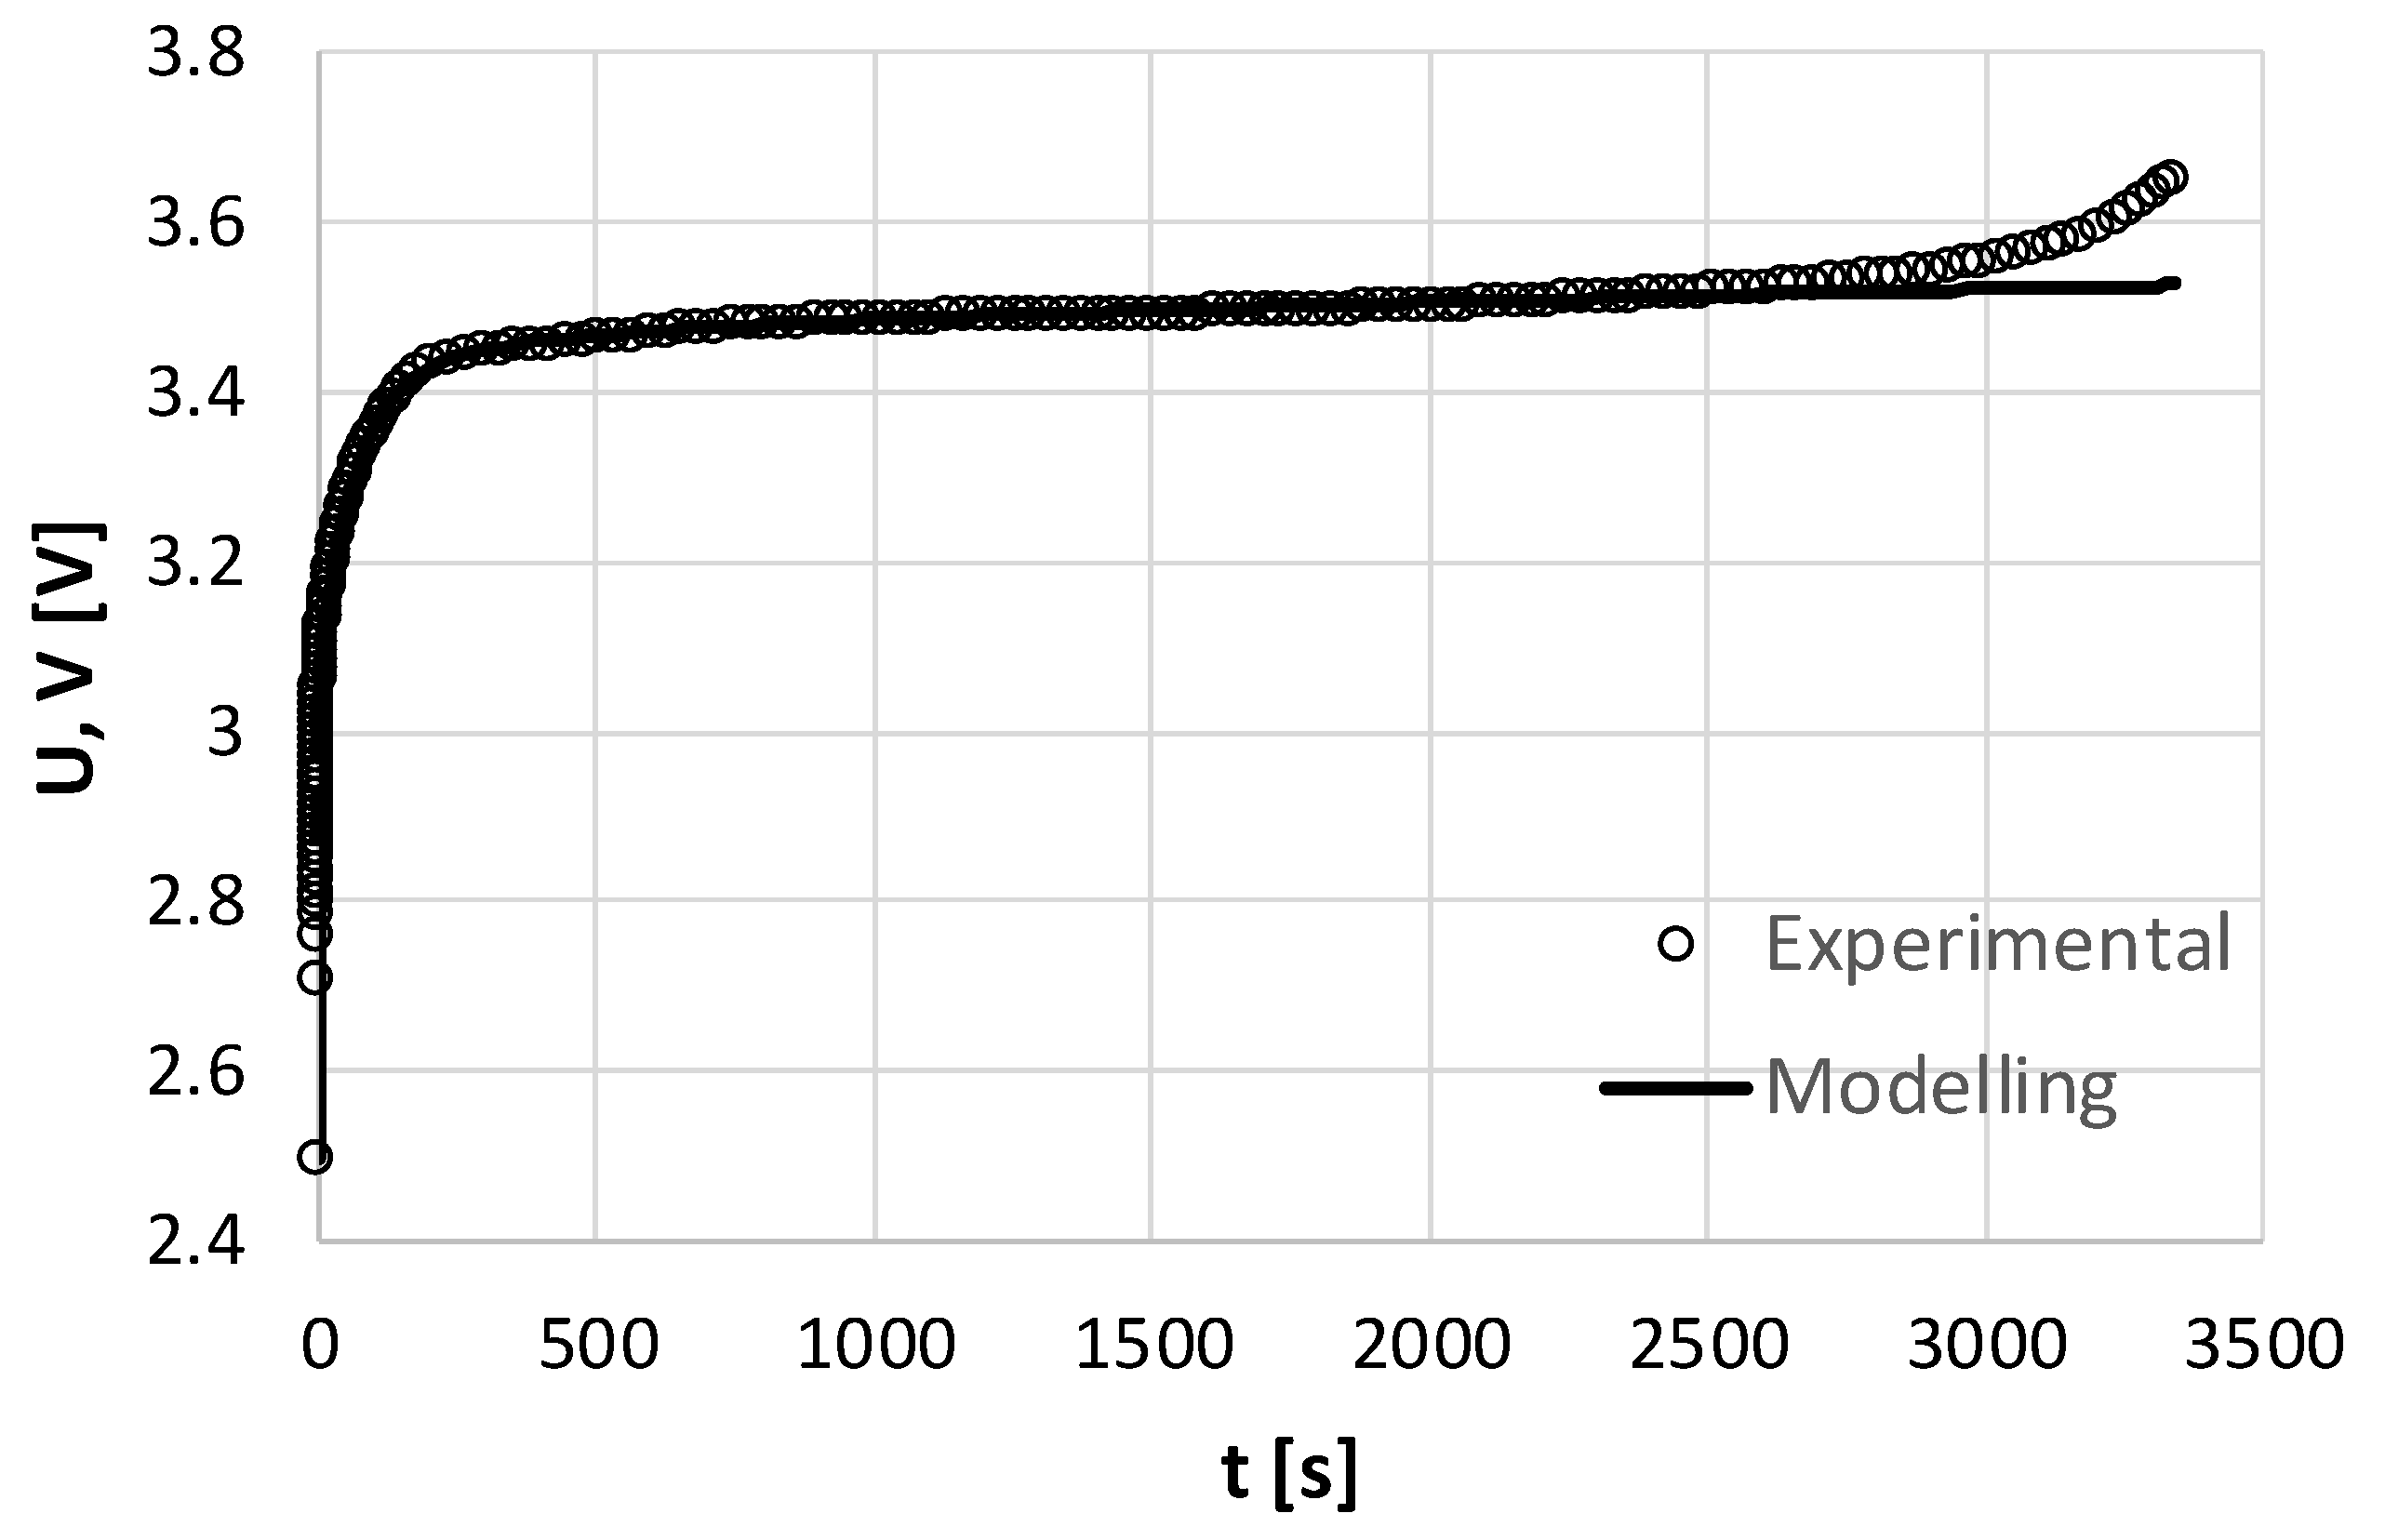
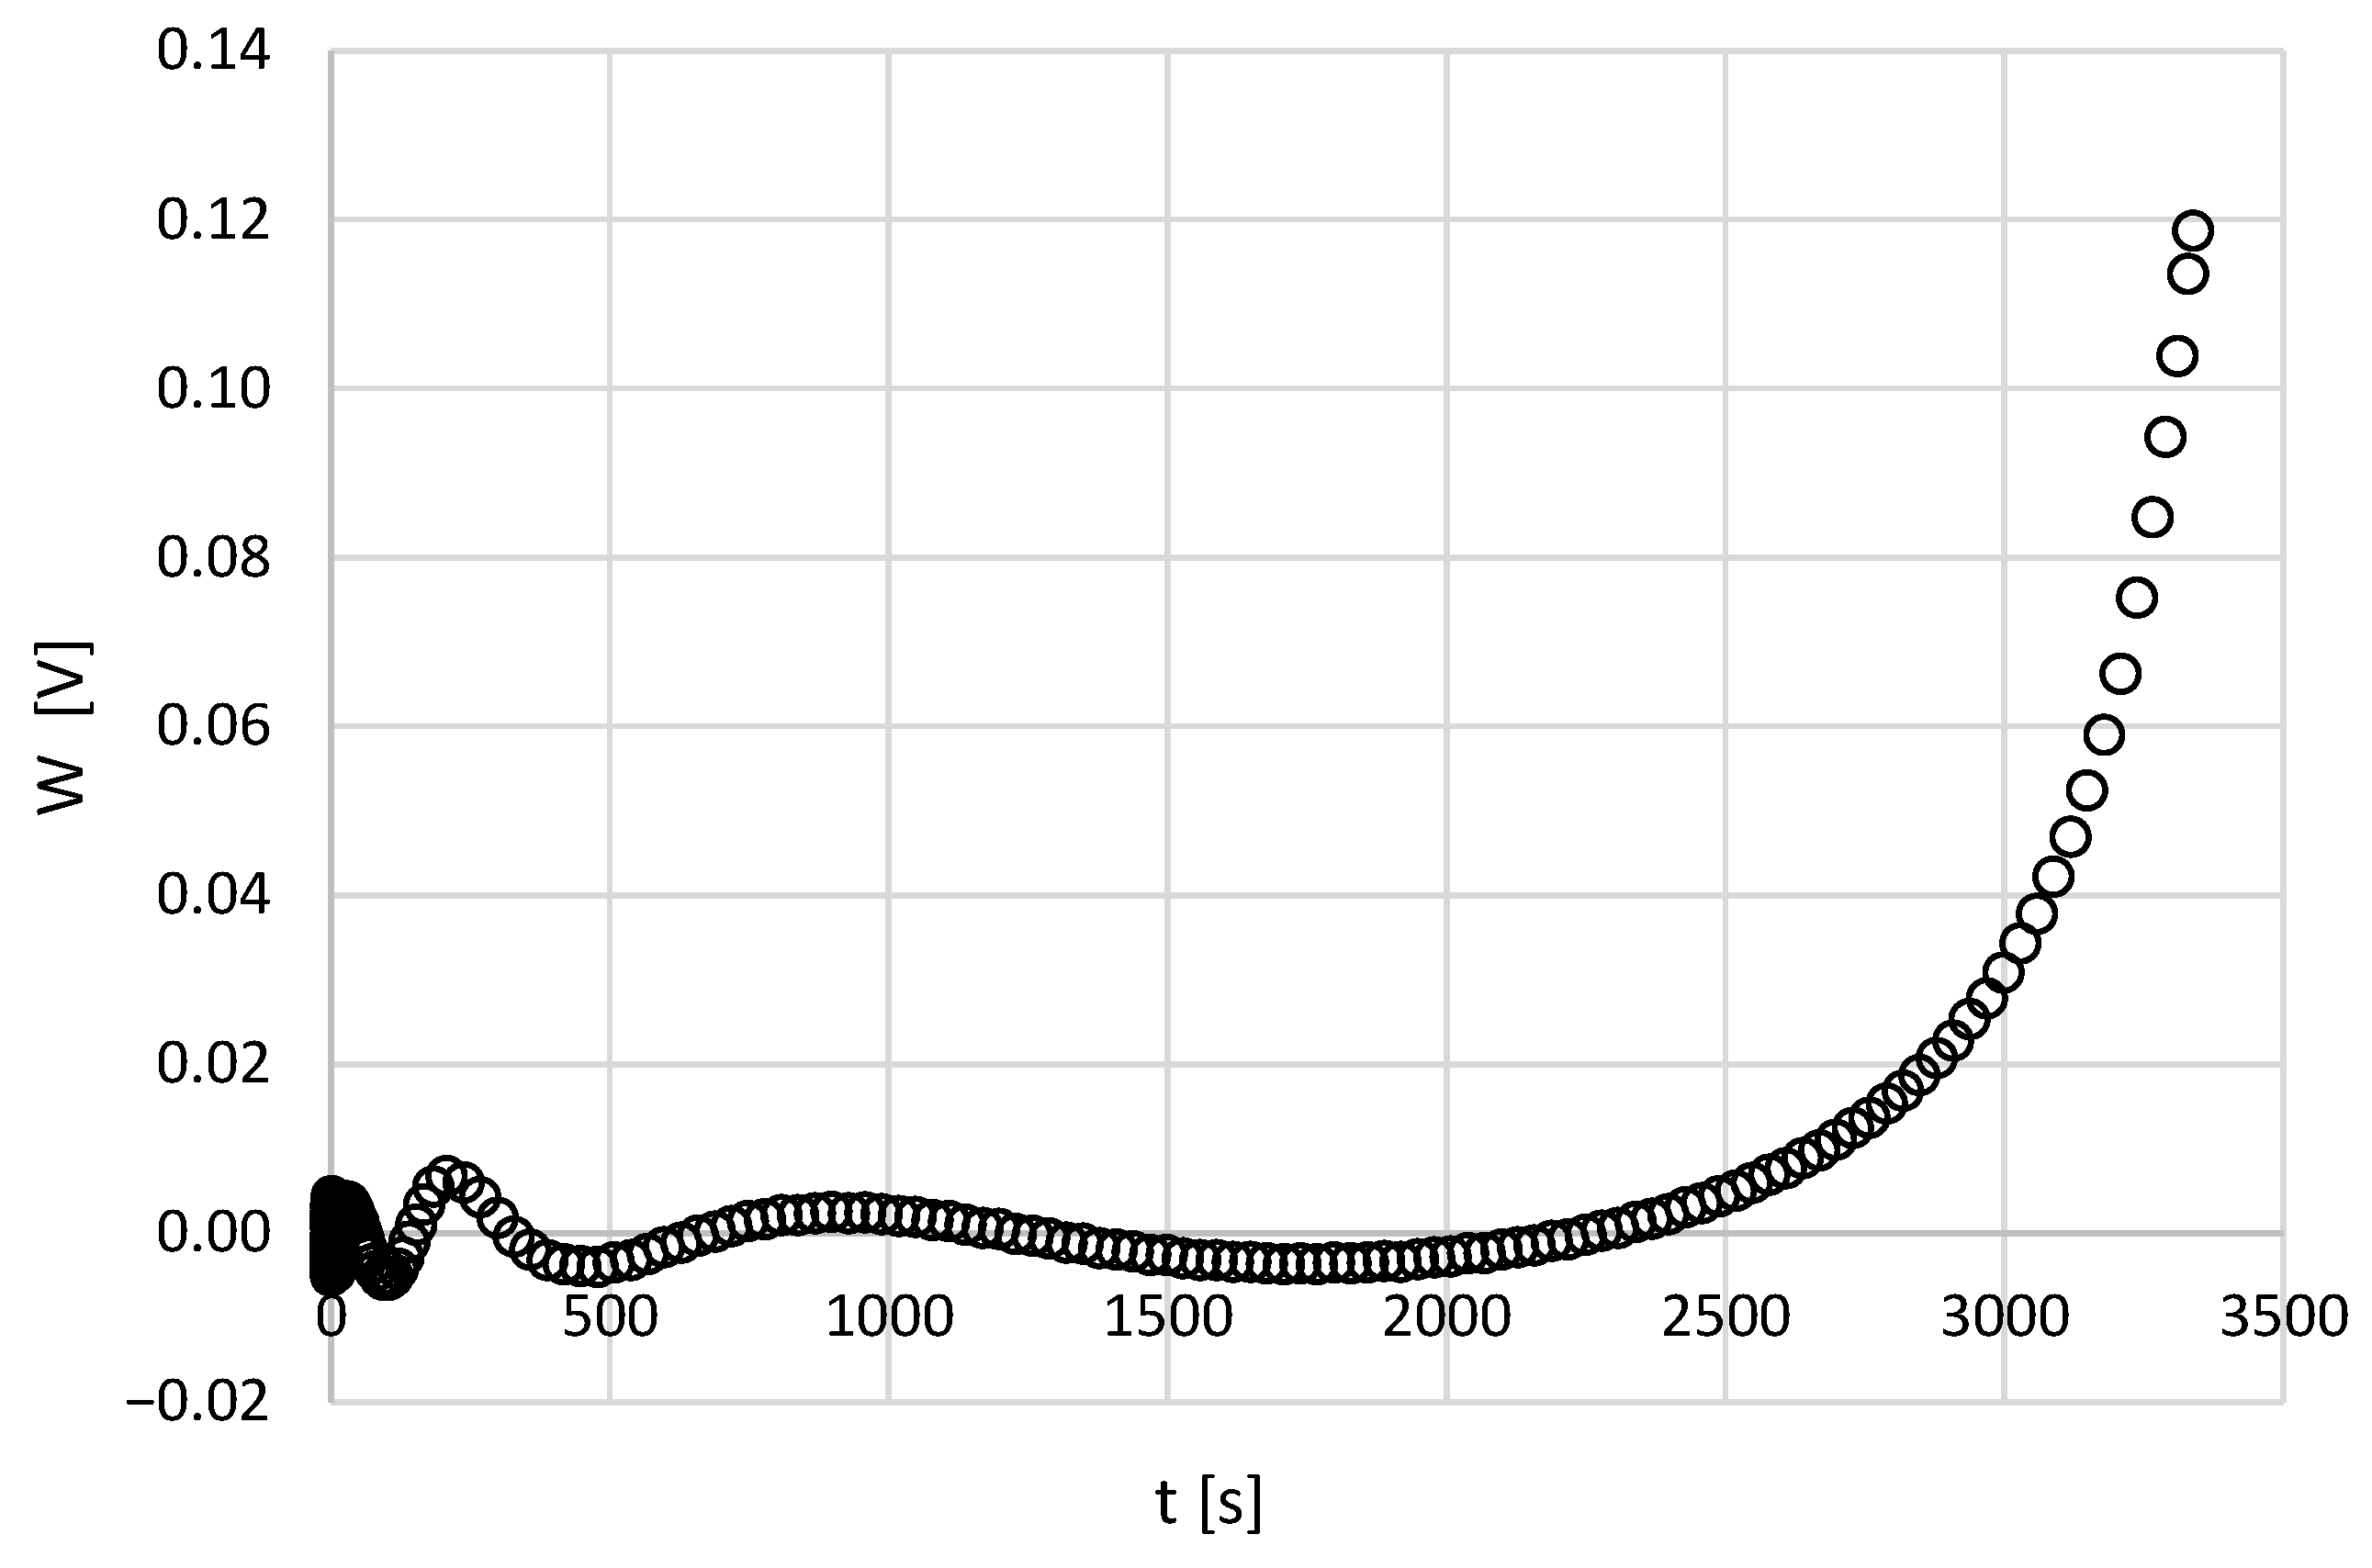
3.2. Fitting Secondary Phase of the Voltage Curve

For fitting secondary phase of the voltage curve, the model of progressive terms is used. Therefore, the secondary curve will be approximated using the following series:
W ( t ) = i = 1 m θ i e t / λ i 1 .
where the discrete spectrum ( θ i , λ i ) is related to the behavior of the voltage curve in the secondary phase. The parameters in Equation (3) were determined numerically using the Levenberg–Marquardt method, which shows reliable results for the approximation of the primary curve. As a result of the numerical calculations, the model parameters are shown in Table 3.
The above series presented by Equation (3) approximates the experimental curve well, until the time t e = 3338.75 s. The result of approximation is shown in Figure 6, where the dotted curve shows the part of the curve presented in Figure 5 within the time interval 2278.7 ≤ t ≤ 3338.75 s, and the continuous line is the result of modeling.
This curve, which results from the intermediate calculations with the progressive terms model, should be added to the voltage curve; see the continuous black line in Figure 4, which is an approximate of the experimental stress curve within the time interval 2278.7 ≤ t ≤ 3338.75 s.

4. Final Results of the Modeling

The total approximation is the sum of the two phases according to Equation (2). Therefore, the entire curve is well fitted with the proposed two-stage approach (see Figure 7). The fitting error is also shown in Figure 8.
From the diagram in Figure 8, we can conclude that the absolute error of approximation to the experimental voltage curve is within approximately ±0.005 V over the entire range of constant-current charging of the lithium-ion battery. The maximum relative error of approximation is therefore approximately 0.6% in the initial part of the curve and 0.7% in the final part of the curve, which is almost negligible. This shows that the method of progressive terms for the secondary phase of the charging process analyzed in Section 3.2 in combination with the classical spectral characterization for the primary phase analyzed in Section 3.1 is a suitable approach for the spectral characterization of the voltage rise in lithium-ion batteries under constant-current charging.

5. Conclusions

In this paper, we explore analogies between phenomenological viscoelastic modeling and circuit theory. During the initial stages of constant-current charging, the voltage response resembles electrical creep compliance, highlighting a strong phenomenological connection between linear viscoelasticity and linear RC network theory. However, at higher charging stages, a significant secondary voltage increase occurs, rendering the classical spectral characterization approach insufficient. Therefore, the voltage behavior under constant-current charging was divided into two distinct phases: the primary phase, which occurs before the inflection point, and the secondary phase, which follows after the inflection point. We demonstrate that combining the method of progressive terms for the secondary phase with the classical spectral characterization for the primary phase is a suitable approach for the spectral characterization of the voltage rise in lithium-ion batteries under constant-current charging within an entire time range.
The results confirm previous findings that a strong analogy exists between linear electric circuit theory and linear viscoelasticity. This analogy is particularly evident in the primary phase, where a direct correspondence with linear viscoelasticity is observed. However, in the secondary phase, complete monotonicity breaks down. Nevertheless, we show that the rate of voltage rise in this phase can be expressed as the difference between two completely monotonic functions.
Therefore, we present a theoretical framework for the spectral characterization of lithium-ion batteries (LIBs) under a CC charging scheme. We demonstrate that the proposed spectral model is stable and produces results that adhere to the voltage growth constraint within an acceptable tolerance across both the primary and secondary phases of charging.
It has also been shown that careful consideration is required when calculating the coefficients of the creep function composed of Voigt elements, as well as the coefficients of the progressive term’s series. Numerical errors can be significantly reduced by appropriately selecting retardation times and choosing suitable initial guess values.
This approach offers a viable alternative to the widely used ECMs and other existing methods. The mathematical framework developed in this work can serve as a foundational theory for characterizing various types of batteries and different charging modes.
Based on the experimental and computational analysis performed, as well as the results obtained, we conclude that the spectral characterization approach developed in this work is a reliable tool for modeling the battery response to CC charging of lithium-ion batteries (LIBs) across the entire charge range. Therefore, it can be effectively utilized for accurate battery state determination by leveraging analogies between phenomenological viscoelastic modeling and circuit theory.

Author Contributions

Conceptualization, A.N., M.N. and J.K.; methodology, A.N.; software, A.N. and M.N.; validation, A.N., M.N. and J.K.; formal analysis, A.N., M.N. and J.K.; investigation, A.N., M.N. and J.K.; data curation, A.N. and M.N.; writing—original draft preparation, A.N.; writing—review and editing, A.N., M.N. and J.K.; visualization, A.N., M.N. and J.K.; supervision, A.N.; project administration, A.N.; funding acquisition, M.N. and J.K. All authors have read and agreed to the published version of the manuscript.

Funding

The authors acknowledge financial support from The Slovenian Research and Innovation Agency: P2-0182.

Institutional Review Board Statement

Not applicable.

Informed Consent Statement

Not applicable.

Data Availability Statement

Data are contained within the article.

Conflicts of Interest

The authors declare that they have no known competing financial interests or personal relationships that could have appeared to influence the work reported in this paper.

References

  1. Bayoumi, E.H.E.; De Santis, M.; Awad, H. A Brief Overview of Modeling Estimation of State of Health for an Electric Vehicle’s Li-Ion Batteries. World Electr. Veh. J. 2025, 16, 73. [Google Scholar] [CrossRef]
  2. Pisani Orta, M.A.; Garcia Elvira, D.; Valderrama Blavi, H. Review of State-of-Charge Estimation Methods for Electric Vehicle Applications. World Electr. Veh. J. 2025, 16, 87. [Google Scholar] [CrossRef]
  3. Peng, J.; Gao, Y.; Cai, L.; Zhang, M.; Sun, C.; Liu, H. State of Health Estimation for Lithium-Ion Batteries Using Electrochemical Impedance Spectroscopy and a Multi-Scale Kernel Extreme Learning Machine. World Electr. Veh. J. 2025, 16, 224. [Google Scholar] [CrossRef]
  4. Gu, S.; Qian, K.; Yang, Y. Optimization of Electric Vehicle Charging and Discharging Strategies Considering Battery Health State: A Safe Reinforcement Learning Approach. World Electr. Veh. J. 2025, 16, 286. [Google Scholar] [CrossRef]
  5. Mukhopadhyay, A.; Sheldon, B.W. Deformation and stress in electrode materials for Li-ion batteries. Prog. Mater. Sci. 2014, 63, 58–116. [Google Scholar] [CrossRef]
  6. Purewal, J.; Wang, J.; Graetz, J.; Soukiazian, S.; Tataria, H.; Verbrugge, M.W. Degradation of lithium ion batteries employing graphite negatives and nickel-cobalt-manganese oxide + spinel manganese oxide positives: Part 2, chemical-mechanical degradation model. J. Power Sources 2014, 272, 1154–1161. [Google Scholar] [CrossRef]
  7. Dubarry, M.; Qin, N.; Brooker, P. Calendar aging of commercial Li-ion cells of different chemistries—A review. Curr. Opin. Electrochem. 2018, 9, 106–113. [Google Scholar] [CrossRef]
  8. Han, X.; Lu, L.M.; Zheng, Y.; Feng, X.; Li, Z.; Li, J.; Ouyang, M. A review on the key issues of the lithium ion battery degradation among the whole life cycle. eTransportation 2019, 1, 100005. [Google Scholar] [CrossRef]
  9. Moser, F.; Fourgeot, F.; Rouget, R.; Crosnier, O.; Brousse, T. In situ X-ray diffraction investigation of zinc based electrode in NieZn secondary batteries. Electrochim. Acta 2013, 109, 110–116. [Google Scholar] [CrossRef]
  10. Jaiswal, A.; Chalasani, S.C. The role of carbon in the negative plate of the lead-acid battery. J. Energy Storage 2015, 1, 15–21. [Google Scholar] [CrossRef]
  11. Hazotte, C.; Leclerc, N.; Meux, E.; Lapicque, F. Direct recovery of cadmium and nickel from Ni-Cd spent batteries by electroassisted leaching and electrodeposition in a single-cell process. Hydrometallurgy 2016, 162, 94–103. [Google Scholar] [CrossRef]
  12. Zhao, R.; Liu, J.; Gu, J. A comprehensive study on Li-ion battery nail penetrations and the possible solutions. Energy 2017, 123, 392–401. [Google Scholar] [CrossRef]
  13. Zhang, J.; Lee, J. A review on prognostics and health monitoring of Li-ion battery. J. Power Sources 2011, 196, 6007–6014. [Google Scholar] [CrossRef]
  14. Tao, L.; Ma, J.; Cheng, Y.; Noktehdan, A.; Chong, J.; Lu, C. A review of stochastic battery models and health management. Renew. Sust. Energ. Rev. 2017, 80, 716–732. [Google Scholar] [CrossRef]
  15. Hossain Lipua, M.S.; Hannanc, M.A.; Hussaina, A.; Hoqued, M.M.; Kerc, P.J.; Saada, M.H.M.; Ayob, A. A review of state of health and remaining useful life estimation methods for lithium-ion battery in electric vehicles: Challenges and recommendations. J. Clean Prod. 2018, 205, 115–133. [Google Scholar] [CrossRef]
  16. Šeruga, D.; Gosar, A.; Sweeney, C.A.; Jaguemont, J.; Van Mierlo, J.; Nagode, M. Continuous modelling of cyclic ageing for lithium-ion batteries. Energy 2021, 215, 119079. [Google Scholar] [CrossRef]
  17. Barré, A.; Deguilhem, B.; Grolleau, S.; Gérard, M.; Suard, F.; Riu, D. A review on lithium-ion battery ageing mechanisms and estimations for automotive applications. J. Power Sources 2013, 241, 680–689. [Google Scholar] [CrossRef]
  18. Hu, M.; Li, Y.; Li, S.; Fu, C.; Qin, D.; Li, Z. Lithium-ion battery modelling and parameter identification based on fractional theory. Energy 2018, 165, 153–163. [Google Scholar] [CrossRef]
  19. Assi, M.; Amer, M. A Comparative Analysis of Lithium-Ion Batteries Using a Proposed Electrothermal Model Based on Numerical Simulation. World Electr. Veh. J. 2025, 16, 60. [Google Scholar] [CrossRef]
  20. Krause, T.; Nusko, D.; Rittmann, J.; Pitta Bauermann, L.; Kroll, M.; Holly, C. Synthetic Data Generation for AI-Informed End-of-Line Testing for Lithium-Ion Battery Production. World Electr. Veh. J. 2025, 16, 75. [Google Scholar] [CrossRef]
  21. Jaguemont, J.; Darwiche, A.; Barde, F. Model Predictive Control Using an Artificial Neural Network for Fast-Charging Lithium-Ion Batteries. World Electr. Veh. J. 2025, 16, 231. [Google Scholar] [CrossRef]
  22. Zhang, H.; Lai, Y.-H. Improving State-of-Health Estimation for Lithium-Ion Batteries Based on a Generative Adversarial Network and Partial Discharge Profiles. World Electr. Veh. J. 2025, 16, 277. [Google Scholar] [CrossRef]
  23. Painter, R.; Parthasarathy, R.; Li, L.; Embry, I.; Sharpe, L.; Hargrove, S.K. An Artificial Neural Network-Based Battery Management System for LiFePO4 Batteries. World Electr. Veh. J. 2025, 16, 282. [Google Scholar] [CrossRef]
  24. de Anda-Suarez, J.; Perez-Zuniga, G.; Lopez-Ramirez, J.L.; Herrera Perez, G.; Zeferino Gonzalez, I.; Verde Gomez, J.Y.; on behalf of the TecNM Energy Production and Storage Network. Lithium Battery Enhancement Through Electrical Characterization and Optimization Using Deep Learning. World Electr. Veh. J. 2025, 16, 167. [Google Scholar] [CrossRef]
  25. Zhou, Y.; Zhang, C.; Zhang, X.; Zhou, Z. Lithium-Ion Battery SOH Estimation Method Based on Multi-Feature and CNN-BiLSTM-MHA. World Electr. Veh. J. 2024, 15, 280. [Google Scholar] [CrossRef]
  26. Tran, M.K.; DaCosta, A.; Mevawalla, A.; Panchal, S.; Fowler, M. Comparative study of equivalent circuit models performance in four common lithium-ion batteries: LFP NMC, LMO, NCA. Batteries 2021, 7, 51. [Google Scholar] [CrossRef]
  27. Han, X.; Ouyang, M.; Lu, L.; Li, J. Simplification of physics-based electrochemical model for lithium ion battery on electric vehicle. Part I: Diffusion simplification and single particle model. J. Power Sources 2015, 278, 802–813. [Google Scholar] [CrossRef]
  28. Hariharan, K.S.; Kumar, V.S. A nonlinear equivalent circuit model for lithium ion cells. J. Power Sources 2013, 222, 210–217. [Google Scholar] [CrossRef]
  29. Grandjean, T.R.B.; McGordon, A.; Jennings, P.A. Structural identifiability of equivalent circuit models for Li-Ion batteries. Energies 2017, 10, 90. [Google Scholar] [CrossRef]
  30. Wang, S.L.; Fernandez, C.; Zou, C.Y.; Yu, C.M.; Li, X.X.; Pei, S.J.; Xie, W. Open circuit voltage and state of charge relationship functional optimization for the working state monitoring of the aerial lithium-ion battery pack. J. Clean Prod. 2018, 198, 1090–1104. [Google Scholar] [CrossRef]
  31. Li, Y.; Vilathgamuwa, M.; Farrell, T.; Choi, S.S.; Tran, N.T.; Teague, J. A Physics-Based Distributed-Parameter Equivalent Circuit Model for Lithium-Ion Batteries. Electrochim. Acta 2019, 299, 451–469. [Google Scholar] [CrossRef]
  32. Chen, Z.; Yang, L.; Zhao, X.; Wang, Y.; He, Z. Online state of charge estimation of Li-ion battery based on an improved unscented Kalman filter approach. Appl. Math. Model. 2019, 70, 532–544. [Google Scholar] [CrossRef]
  33. Zhang, Q.; Shang, Y.; Li, Y.; Cui, N.; Duan, B.; Zhang, C. A novel fractional variable-order equivalent circuit model and parameter identification of electric vehicle Li-ion batteries. ISA Trans. 2020, 97, 448–457. [Google Scholar] [CrossRef]
  34. Chen, D.; Xiao, L.; Yana, W.; Guoa, Y. A novel hybrid equivalent circuit model for lithium-ion battery considering nonlinear capacity effects. Energy Rep. 2021, 7, 320–329. [Google Scholar] [CrossRef]
  35. Biju, N.; Fang, H. BattX: An equivalent circuit model for lithium-ion batteries over broad current ranges. Appl. Energy 2023, 339, 120905. [Google Scholar] [CrossRef]
  36. Poopanya, P.; Sivalertporn, K.; Phophongviwat, T. A Comparative Study on the Parameter Identification of an Equivalent Circuit Model for an Li-ion Battery Based on Different Discharge Tests. World Electr. Veh. J. 2022, 13, 50. [Google Scholar] [CrossRef]
  37. Velasco-Arellano, H.; Castillo-Magallanes, N.; Visairo-Cruz, N.; Nunez-Gutierrez, C.A.; Lazaro, I. Parametric Correlation Analysis between Equivalent Electric Circuit Model and Mechanistic Model Interpretation for Battery Internal Aging. World Electr. Veh. J. 2024, 15, 291. [Google Scholar] [CrossRef]
  38. Sankarkumar, R.S.; Rajasekar, N. A Novel Spotted Hyena Optimizer for the Estimation of Equivalent Circuit Model Parameters in Li-Ion Batteries. World Electr. Veh. J. 2024, 15, 431. [Google Scholar] [CrossRef]
  39. Tran, M.K.; Mathew, M.; Janhunen, S.; Panchal, S.; Raahemifar, K.; Fraser, R.; Fowler, M. A comprehensive equivalent circuit model for lithium-ion batteries, incorporating the effects of state of health state of charge, and temperature on model parameters. J. Energy Storage 2021, 43, 103252. [Google Scholar] [CrossRef]
  40. Nagode, M.; Gosar, A.; Sweeney, C.A.; Jaguemont, J.; Van Mierlo, J.; Šeruga, D. Mechanistic modelling of cyclic voltage-capacity response for lithium-ion batteries. Energy 2019, 186, 115791. [Google Scholar] [CrossRef]
  41. Alshawabkeh, A.; Matar, M.; Almutairy, F. Parameters Identification for Lithium-Ion Battery Models Using the Levenberg—Marquardt Algorithm. World Electr. Veh. J. 2024, 15, 406. [Google Scholar] [CrossRef]
Figure 1. Schematic representation of charging the battery using the CC charging scheme.
Wevj 16 00308 g001
Figure 2. Measuring setup: (a) high-precision battery tester LBT21 Series, and (b) rechargeable battery.
Wevj 16 00308 g002
Figure 3. Experimental data within the primary phase of the voltage curve.
Wevj 16 00308 g003
Figure 4. Approximation of the experimental voltage curve considering fitting of only the primary phase of the curve.
Wevj 16 00308 g004
Figure 5. Difference between experimental values and extended curve V ( t ) within the complete time range.
Wevj 16 00308 g005
Figure 6. Approximation of the secondary phase of the voltage curve.
Wevj 16 00308 g006
Figure 7. Approximation of the voltage curve within the complete time range.
Wevj 16 00308 g007
Figure 8. Error of approximation within the complete time range.
Wevj 16 00308 g008
Table 1. Values of discrete retardation spectrum for n = 6 .
Genetic AlgorithmLevenberg–Marquardt
μ 71,914.9 [s/V]505,370 [s/V]
i τ i [s] h i [V] τ i [s] h i [V]
18.913004 × 10−33.033364 × 10−19.000 × 10−33.134 × 10−1
28.461603 × 10−27.481855 × 10−21.769 × 10−17.540 × 10−2
32.566468 × 1001.743974 × 10−13.074 × 1001.765 × 10−1
44.409065 × 1012.054043 × 10−16.371 × 1013.442 × 10−1
51.173434 × 1022.032495 × 10−12.810 × 1025.520 × 10−2
64.526886 × 1034.813059 × 10−25.088 × 1031.141 × 10−1
SSE6.8 × 10−42.0 × 10⁻⁴
Table 2. Approximation errors for different numbers of Voigt elements.
Error Estimation Number   of   Elements ,   n
2 3 4 5 6
SSE0.11320.00480.00340.00070.0002
R-square0.98590.99940.99960.99991.0000
RMSE0.02950.00610.00520.00240.0013
Table 3. Values of discrete spectrum with progressive terms (secondary phase) for m = 5.
i λ i [s] θ i [V]
1239.51.103 × 10−3
219993.369 × 10−3
325971.4610 × 10−2
430972.585 × 10−3
535971.475 × 10−2
SSE8.585 × 10−5
R-square0.9982
RMSE1.721 × 10−3
Disclaimer/Publisher’s Note: The statements, opinions and data contained in all publications are solely those of the individual author(s) and contributor(s) and not of MDPI and/or the editor(s). MDPI and/or the editor(s) disclaim responsibility for any injury to people or property resulting from any ideas, methods, instructions or products referred to in the content.

