Abstract
How to use efficient and accurate methods to estimate the capacity of lithium batteries has always been an important research topic. Traditional capacity estimation methods are time-consuming and require strict experimental conditions, making them unsuitable for real-time applications. This article introduces the concept of the inflection point of the charge/discharge curve in the SOC-V curve and proposes a fast estimation method for battery capacity by combining the advantages of the IC curve peak and SOC inflection point methods. By analyzing the charge and discharge data of grouped batteries, it was found that there is a certain correspondence between the inflection point of the SOC-V curve and the peak point of the IC curve. This relationship remains stable during battery aging and can provide a reliable basis for battery SOH evaluation, further improving the estimation accuracy of SOH. This method significantly reduces experimental time, is more suitable for practical applications, and provided an efficient and practical technical means for battery performance evaluation.
1. Introduction
Lithium batteries are widely used in many fields such as electronic equipment, electric vehicles, and energy storage systems due to their high energy density, long cycle life, and environmental friendliness [1]. With the popularity of lithium batteries in various application scenarios, accurate evaluation of their performance has become particularly important, especially rapid estimation of battery capacity [2]. The capacity of a lithium battery refers to the maximum amount of electricity that the battery can store and release under certain conditions, which directly affects the battery life and performance of the device [3]. Therefore, how to use efficient and accurate methods to estimate lithium battery capacity has become an important research topic.
Traditional capacity estimation methods include direct measurement methods, mathematical modeling methods, and data-driven methods [4]. The direct measurement method obtains the battery capacity through actual discharge experiments. Although it has high accuracy, it takes a long time and requires strict experimental conditions and is not suitable for real-time applications. Mathematical modeling methods establish a physical or chemical model of the battery and estimate the capacity based on parameters such as voltage, current, and temperature of the battery. These methods require complex parameter identification and model correction and have high computational complexity [5]. The data-driven method is based on historical data and machine learning algorithms and predicts battery capacity through training models. It has good real-time adaptability, but it requires high data quality and quantity [6]. Black-box adaptive or data-driven models with estimators and observers tend to be implemented for state of charge (SOC) and state-of-health (SOH) tracking [7].
However, these methods still face certain challenges when processing data under different operating conditions. As an effective battery capacity estimation method, differential capacity analysis has attracted widespread attention in recent years [8,9,10]. The incremental capacity (IC) curve is obtained by differentiating the changes in voltage and capacity during charge and discharge [11,12]. This method can reveal the details of the internal reaction of the battery, thus providing new ideas for capacity estimation. Matthieu Dubarry et al. present best practices for incremental capacity analysis (ICA), a technique that has been gaining increasing popularity due to its effectiveness in identifying battery degradation modes for both diagnostic and prognostic purposes [13]. The IC curve presents different characteristics at different cycle life stages of the battery. By analyzing these characteristics, a rapid estimation of the battery capacity can be achieved [14]. This method can monitor battery capacity changes in real time during use and provide timely data support for the battery management system. In addition, IC curves can not only be used for new lithium battery capacity estimates but also provide reliable capacity assessments during battery aging [15]. Experiments have found that with the use of batteries, the shape and peak position of the IC curve will change significantly, and these changes have a good correlation with the attenuation of battery capacity. Therefore, by analyzing the change law of the IC curve, the capacity of the aging battery can be quickly estimated. The popularity of incremental capacity analysis is growing [16,17]. The SOC estimation is of extreme importance for the reliability and safety of battery operation [18]. The battery state of the charge-V curve also plays an important role in battery capacity estimation. The shape and slope of the SOC-V curve will change at different life stages of the battery, and these changes are closely related to the actual capacity of the battery.
However, although the IC curve method can reveal the details of the internal reaction of the battery, it is highly sensitive to noise. In particular, under low current conditions, the IC curve may be significantly affected, resulting in a decrease in the accuracy of capacity estimation [19,20]. At the same time, the SOC-V curve method may also increase the estimation error due to the drift of model parameters during battery aging [21,22].
The purpose of this study is to combine the advantages of IC curve and SOC-V curve methods to propose a comprehensive rapid estimation method of battery capacity. By combining the peak point analysis of the IC curve with the model prediction of the inflection point of the SOC-V curve, the shortcomings of a single method can be overcome, and a faster estimation of battery capacity can be achieved.
2. Lithium Battery Testing and Data Selection
2.1. Test Objects and Test Steps
The test object used in this paper is a lithium iron phosphate battery, which consists of a battery pack consisting of 12 sets of batteries. The factory capacity is 60 Ah. It is currently in a hierarchical utilization state after being scrapped. The charge and discharge cutoff voltages of the single battery are 3.65 V and 2.8 V, respectively. During the test, the battery performance was evaluated using the CDS series product testing system produced by Rui Neng Company, which provides programmable charge/discharge cycling (0–100 V, 0–100 A), while monitoring temperature and other safety parameters. The test steps were as follows:
- (1)
- Conduct a complete charge and discharge test on the battery at a rate of 0.1 C-rate (C), record the voltage data of each group of batteries, and conduct capacity calibration.
- (2)
- Let stand for 5 min.
- (3)
- Charge the battery pack at a constant current rate of 0.25 C until any single unit reaches the charging cutoff voltage of 3.65 V, let it stand for 1 h, and record the voltage of each single unit once/s during the charging process.
- (4)
- Discharge the battery pack at a constant current rate of 1 C until any single cell reaches the discharge cutoff voltage of 2.8 V, let it stand for 1 h, and record the voltage of each single cell once/s during the discharge process.
- (5)
- Repeat steps (2)–(4) until significant capacity attenuation occurs.
2.2. Test Data Selection
During the analysis, in order to highlight the performance comparison of the battery in the new state and the aging state, corresponding data were selected for comparison in the first three and last three charge and discharge tests. The charge and discharge data of the first three cycles represent the performance of the battery under the new state. These data usually reflect the characteristics of the battery’s capacity, voltage changes, and internal electrochemical reactions under the optimal state. These data are helpful to understand the initial performance parameters of the battery, including initial capacity, initial internal resistance, etc. The charge and discharge data for the last three cycles represent the aging state of the battery after a period of use. These data can reveal the decline of the battery during use, including capacity degradation, increase in internal resistance, and changes in electrochemical reaction characteristics. By comparing the charge and discharge data of the first three times and the last three times, we can intuitively see the performance change trend of the battery during cycling.
3. Analysis of Lithium Battery Capacity Increase
IC Curve of Lithium Battery
The battery capacity increment analysis method is based on the voltage and capacity changes in the battery during charging and discharging and obtains the capacity increment by differentiating these changes. The IC curve represents the relationship between the battery’s capacity increment and voltage during charging and discharging. The IC curve is obtained by differentiating the voltage and capacity changes during charging and discharging of the battery [23]. The specific calculation formula is as follows:
where represents the capacity increment, represents the capacity of the battery, and represents the voltage of the battery.
The lithium battery capacity increment analysis method is an important method to study the decay mechanism of lithium batteries and the consistency of each monomer in the battery pack. The main research object of this method is the capacity increment curve of lithium batteries.
During the charging process, the battery voltage will gradually increase, but at a certain stage, the internal reaction of the battery reaches a balanced state, and the voltage change becomes slow, forming a voltage platform. During this period, most of the battery’s capacity is charged. The capacity increment curve is obtained by processing the original charge and discharge data, calculating the dQ/dV data, and drawing a V-dQ/dV curve based on the voltage data. IC curves usually show multiple characteristic peaks, which correspond to different chemical reaction stages within the battery. During the charging process of a lithium battery, the battery voltage gradually increases, but at a certain stage, as the internal reaction of the battery reaches a balanced state, the voltage change becomes slow, forming a so-called “voltage plateau”. At this point, most of the capacity is charged into the battery. The existence of a voltage plateau in the charging curve is shown in Figure 1, and the time period between the two dashed lines is the voltage plateau.
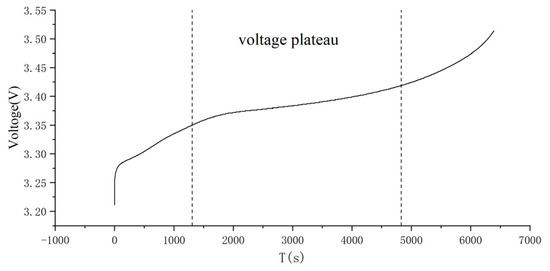
Figure 1.
Battery charging process.
The characteristic peaks in the IC curve reflect the slight changes during this voltage plateau. The unique advantage of the characteristic peak of the IC curve is that it can reflect the violent chemical reactions occurring inside the lithium battery during charging on the dQ/dV characteristic peak on the capacity increase curve. This characteristic peak can show small changes that are not easily observed in the voltage plateau on the IC curve, thus facilitating the observation and analysis of the battery state. During the charging and discharging process of lithium batteries, the identification of characteristic peaks can help analyze the health status and aging process of the battery. Each characteristic peak corresponds to a specific chemical reaction within the battery. By studying the location, shape, and area of these characteristic peaks, the health status, internal reactivity, and aging degree of the battery can be inferred. In order to more intuitively reflect the relationship between dQ/dV and SOC, the abscissa of the IC curve is changed to SOC here. Taking a lithium iron phosphate battery as an example, in order to denoise and smooth the data, a five points cubic smoothing filtering method was adopted, which selects two data points before and after the smoothing filtering position, for a total of five data points. A third-order polynomial is used for fitting, and the smoothed filtered values are obtained. After smoothing the curve, its charging IC curve is shown in Figure 2.
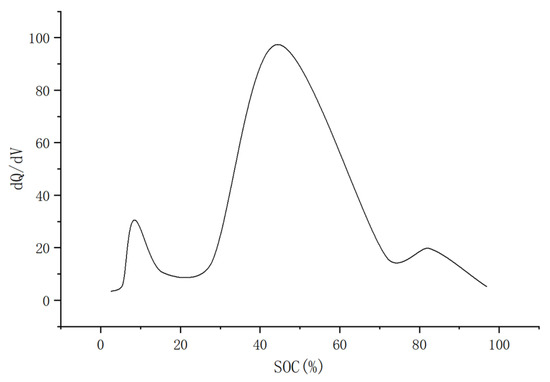
Figure 2.
IC curve with SOC as abscissa.
4. Analysis of SOC Inflection Point of Lithium Battery
4.1. Curve of SOC-V
The SOC-V curve refers to the relationship between the battery’s state of charge and voltage. SOC is a key indicator of the remaining capacity of a battery and is usually expressed as a percentage, ranging from 0% (fully discharged) to 100% (fully charged). Voltage is the potential difference in a battery under different states of charge, and it reflects the electrochemical state inside the battery. The SOC-V curve plots the relationship between voltage and state of charge by measuring the battery voltage at different SOC points. The drawing of the SOC-V curve requires accurate measurement of the battery voltage under different states of charge [24]. First charge the battery to fully charged (100% SOC) and then gradually discharge it. During the discharge process, the voltage and corresponding SOC value are recorded at certain time intervals or electricity intervals. After the discharge is completed, the charging process is carried out again, and the voltage and SOC values are also recorded. During charge and discharge, record the battery voltage value and corresponding SOC value.
where is the initial SOC, is the rated capacity of the battery, and is the current at time .
In order to ensure the accuracy of the data, it is usually necessary to make multiple measurements in a constant temperature environment and take the average value. Smooth the collected voltage data to reduce noise and errors during the measurement process. The processed voltage data and corresponding SOC values are plotted in the same coordinate system to form a SOC-V curve, as shown in Figure 3.
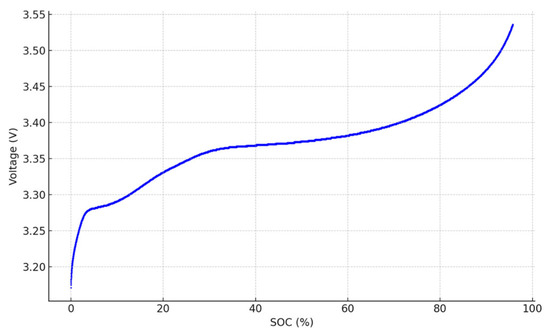
Figure 3.
Curve of SOC-V.
It can be seen from the figure that when the SOC is close to 0% and 100%, the voltage changes are large, while the voltage changes are gentle in the middle section. This nonlinear relationship reflects the complex electrochemical reactions within the battery.
4.2. Analysis of Voltage Curvature Change
Curvature is the rate of rotation of the tangential angle at a point on the curve to the arc length. It is defined by differentiation and indicates the degree to which the curve deviates from a straight line. On the SOC-V curve, due to the particularity of lithium batteries, their charging and discharging voltage curvature has obvious characteristics.
For a curve on a two-dimensional plane, the curvature can be defined as follows [25]:
where and are the parametric equations of the curve.
In the SOC-V curve, SOC is used as the independent variable and voltage is used as the dependent variable, and the curvature change in the curve can be obtained:
Taking the discharge period from SOC = 0% to SOC = 100% as an example, the voltage curvature shows the following obvious characteristics:
Rising period: When the SOC is close to 0%, that is, the voltage is between 2.8 V and 3.1 V, the voltage curvature increases rapidly and decreases rapidly after reaching a certain value. The change in curvature in this section indicates that the battery voltage changes significantly at low SOC.
Smooth section: In the middle section of the SOC, that is, the voltage is between 3.1 V and 3.4 V, the voltage curvature remains at an overall low level, reflecting the stability of the battery’s electrochemical reaction at this stage.
Rising stage again: When the SOC is close to 100%, that is, the voltage is between 3.4 V and 3.6 V, the voltage curvature increases rapidly, reaches its peak, and then drops rapidly. This curvature change indicates that the battery voltage changes significantly at low SOC.
4.3. The Choice and Significance of Inflection Point
The point at which the curvature is greatest at both ends of the capacity/voltage SOC-V curve during constant current charging of a lithium-ion battery is called the curvature inflection point [26]. When determining the inflection point of curvature, a mathematical model is established based on the charge and discharge data of the target battery during actual use, the actual capacity/voltage curve is obtained by using least squares polynomial fitting, and the curvature of each point on both ends of the curve is obtained, among which the area at both ends is approximately set to the SOC value of 80% or more and below 20%. According to the curvature of each point on the curve, it can be seen that the degree of curvature near the end point of the voltage plateau during charging and discharging fluctuates, so the point with the largest curvature is defined as the curvature inflection point.
Curvature inflection points are widely used in battery management and capacity calculation [27]. By determining the inflection point of curvature, the actual capacity of the battery can be more accurately estimated and the performance of the battery management system can be improved. By determining the inflection point of the curvature of the voltage curve during charging, the actual capacity of the battery can be calculated more accurately, thereby improving the accuracy of SOH estimation. At the same time, the curvature inflection point of the voltage curve reflects the state of the electrochemical reaction inside the battery and monitoring the change in the curvature inflection point can predict the remaining life of the battery. According to the position of the curvature inflection point, the battery’s charge and discharge strategy can be optimized to avoid rapid charge and discharge in high-curvature changes, thereby extending battery life.
5. Combined Analysis of IC Curve Peak Point and SOC-V Curve Curvature Inflection Point
According to the test in Step 1 in Section 2.1, the data of 12 sets of batteries is shown in Figure 4. According to the ampere hour integration method, the total capacity at this time can be calculated to be 45.6 Ah.
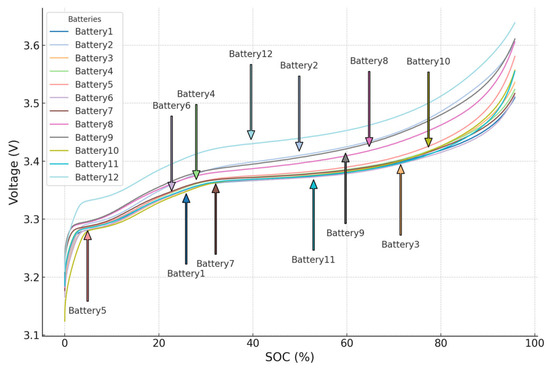
Figure 4.
Curves of SOC-V of each group of batteries.
Taking the third group of batteries with better battery status as an example, comparing the IC curves of this group of batteries before and after testing, it can be found that the overall trend has not changed significantly. As shown in Figure 5, the peak value of curve II is 44.40% and 43.51%, respectively.
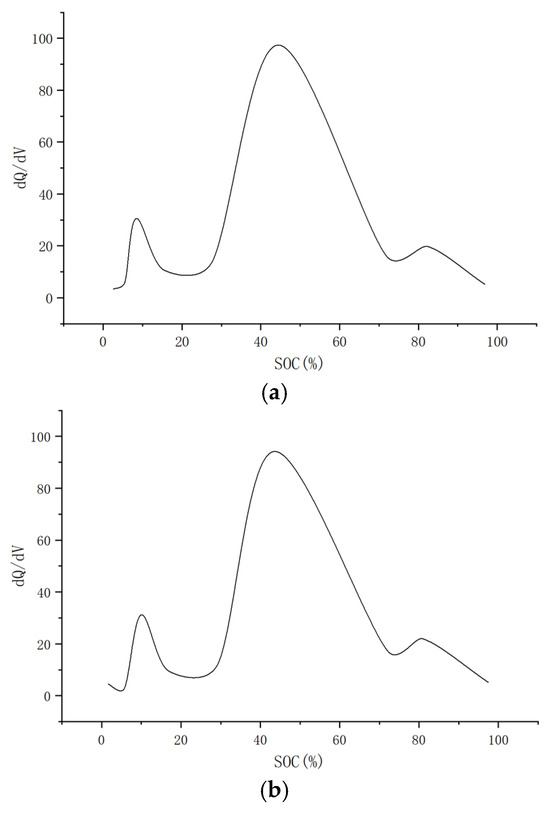
Figure 5.
(a) Charged IC curve before start of cycle test. (b) Charged IC curve after end of cycle test.
When establishing the model, the SOC-V curve is fitted by selecting different fitting orders, the residual error is calculated for each fitting model, and its mean square error is calculated. The corresponding order when the mean square error is minimum is selected. The fitting orders selected when using the model in this paper range from 1 to 10, and the best fitting order is determined to be 8. An eighth-order polynomial fit was performed on the SOC-V curves of Group 3 before and after testing, as shown in Figure 6. The blue curve in the figure represents the original data, and the red curve represents the fitted curve.
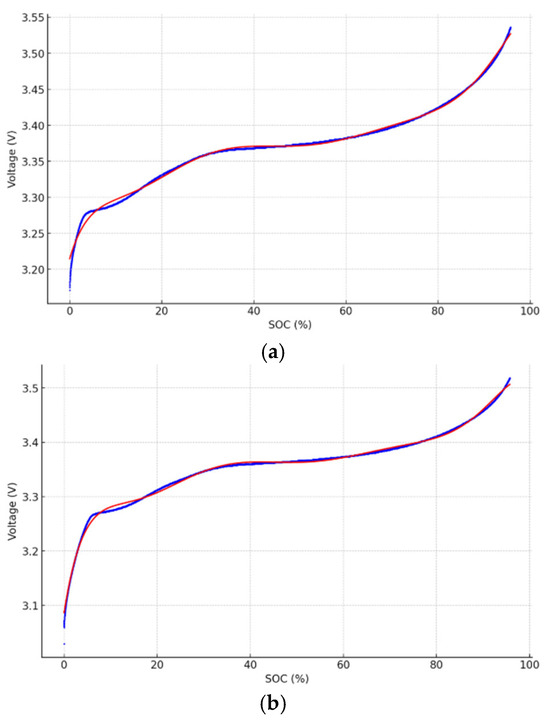
Figure 6.
(a) Eighth-order fitting of the SOC-V curve before the start of the cyclic test. (b) Eighth-order fitting of the SOC-V curve after the end of the cyclic test.
Calculate the curve rate for the part with obvious curvature changes, that is, the SOC value is in the range of 70–95%, and make their curvature plots, respectively. At this time, the SOC values at the maximum curvature value were 88.88% and 87.85%, respectively, as shown in Figure 7.
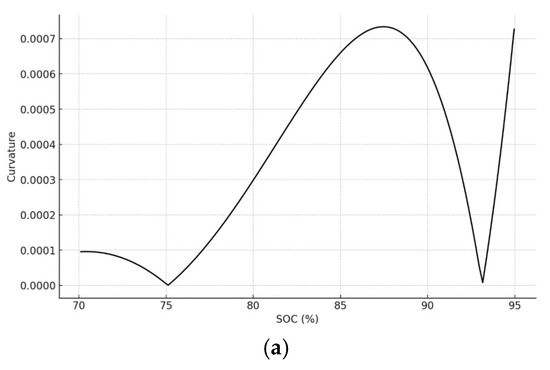
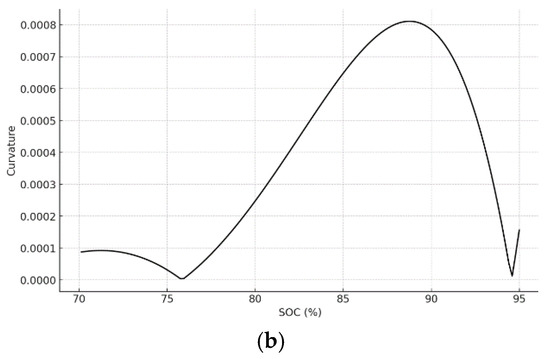
Figure 7.
(a) Curvature of charging SOC-V curve before starting cycle test. (b) Curvature of charging SOC-V curve after cycle test.
Through a series of experimental comparisons, it can be found that although the remaining life of the battery is gradually decreasing and each curve has different changes in shape and characteristics, in the same battery charging experiment, the front inflection point of the SOC-V curve and the IC curve has only a small change.
To ensure the statistical robustness of capacity trend analysis, new single cells were used for relevant experiments. The experimental object is the A123APR18650M1A battery produced by Lishen Company, APR and M1A are the product models, the 0 in 18,650 means that this is a cylindrical battery, 18 means that its cylinder diameter is 18 mm, and 65 means that its height is 65 mm. The experimental results are shown in Table 1.

Table 1.
SOC variation at two points of single cell.
Among them, is the initial inflection point SOC value. The difference between the SOC values of the two points does not show a significant change.
Therefore, the current battery capacity can be quickly estimated through some charging data (peak point to inflection point) based on only the calibration of the inflection point SOC value and the peak SOC value of IC curve II when the battery is shipped from the factory. The formula is as follows:
where is the capacity, is the battery charge from the SOC of peak II to inflection point SOC, is the initial inflection point SOC value, and is the SOC value of the initial peak II.
To verify the complete charging data during the cyclic test, the SOC-V curve diagram of the constant current charging process is shown in Figure 8. Since the range taken is the constant current charging stage, the time T is proportional to the SOC, so the SOC is changed to the time T curve trend, which has no change, as shown in Figure 9. During this charging process, the total capacity of the third group of batteries is 3.565 Ah, and the charging capacity between the inflection point and peak II is 1.585 Ah. By bringing this into the formula, it can be calculated that = 1.585/(88.88% − 44.40%) = 3.566 Ah. The difference from the current battery capacity is less than 1%, and the current battery capacity can be estimated.
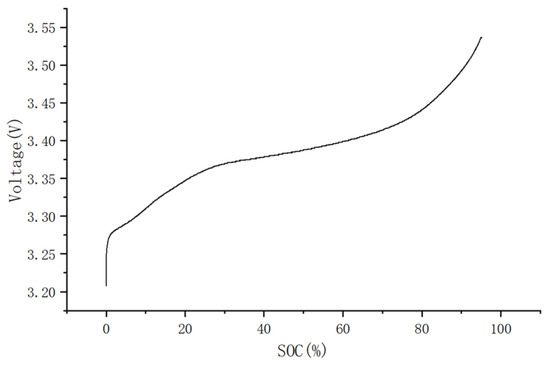
Figure 8.
SOC-V curve diagram of a certain cycle of charging.
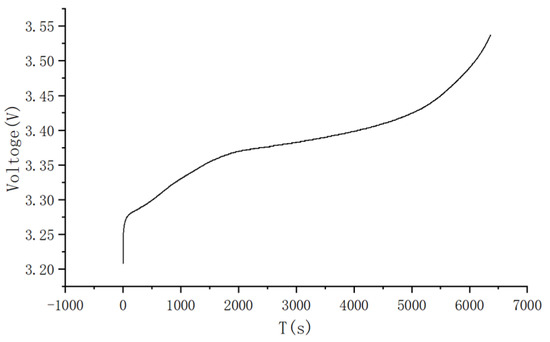
Figure 9.
T-V curve diagram of a certain cycle of charging.
This phenomenon shows that although the battery will experience significant aging and performance degradation during use, the performance of its internal electrochemical reactions under a specific state of charge still maintains a certain degree of consistency. This observation can be explained by the electrochemical reaction mechanism of the battery. The SOC inflection point of a battery usually corresponds to the conversion range of the main active substances within the battery, while the peak point of the IC curve reflects the violent reaction areas during these conversion processes. Even though the battery’s capacity decays and internal resistance increases during aging, its main reaction mechanism under a specific state of charge has not fundamentally changed. Therefore, the relationship between the SOC inflection point and the peak point of the IC curve remains stable. By monitoring the SOC inflection point and the peak point of the IC curve, a reliable basis can be provided for battery SOH evaluation. In practical applications, such as in electric vehicles, the difference can be recalibrated after one year of use to reduce errors. In practical applications, such as in electric vehicles, the difference can be recalibrated after two years of use to reduce errors.
6. Conclusions
This paper proposes a rapid estimation method for lithium battery capacity based on the curvature inflection point of IC curve and SOC curve. By differentiating the changes in battery voltage and capacity during charge and discharge, combining the peak point analysis of IC curve and the prediction of curvature inflection point of SOC curve, rapid estimation of battery capacity can be achieved.
In the experiment, by analyzing the charge and discharge data of the third group of 12 batteries, it was found that although the batteries would experience aging and performance degradation during use, the performance of their internal electrochemical reactions under a specific state of charge remained consistent. This observation result shows that by monitoring the SOC inflection point and the peak value of the IC curve, a reliable basis can be provided for the evaluation of battery SOH. Through experimental comparison, it can be found that there is only a small change in the percentage difference between the SOC inflection point and the peak point of the IC curve. Therefore, the IC curve II peak SOC value and the inflection point SOC value can be calibrated based on the battery’s data when it is shipped from the factory. After using the battery multiple times, the current battery capacity can be quickly estimated without requiring a complete charge and having high estimation accuracy.
This method has strong real-time characteristics, can effectively overcome the shortcomings of a single method, and shows wide prospects in practical applications, especially for the case that ordinary family cars rarely run out of battery power before charging. It can also be used to optimize battery charging and discharging strategies to avoid rapid charging and discharging in high-curvature changes, thereby extending battery life. While this study focused on lithium iron phosphate batteries, the proposed method could potentially be applicable to other lithium battery chemistries. However, key considerations—such as inconsistencies in charge curves—may require system-specific optimizations. Future work should validate this approach for ternary lithium batteries and explore necessary adjustments for broader applicability. Future research can further optimize data processing algorithms, improve noise immunity, and ensure reliability and stability under different working conditions. At the same time, more application scenarios can be explored, such as applications in electric vehicles and energy storage systems, to verify their effectiveness and feasibility in actual use.
Author Contributions
Writing—original draft preparation, Z.D.; methodology, B.H.; writing—review and project administration, X.L.; Data curation, D.L. All authors have read and agreed to the published version of the manuscript.
Funding
This research received no external funding.
Data Availability Statement
The original contributions presented in this study are included in the article. Further inquiries can be directed to the corresponding authors.
Acknowledgments
This work is supported by Class III Peak Discipline of Shanghai-Materials Science and Engineering (High-Energy Beam Intelligent Processing and Green Manufacturing).
Conflicts of Interest
The authors declare no conflicts of interest.
Correction Statement
This article has been republished with a minor correction to the existing affiliation information. This change does not affect the scientific content of the article.
References
- Hu, X.; Li, E.S.; Yang, Y. Advanced Machine Learning Approach for Lithium-Ion Battery State Estimation in Electric Vehicles. IEEE Trans. Transp. Electrif. 2016, 2, 140–149. [Google Scholar] [CrossRef]
- Zhao, L.; Wang, Z.; Ma, Z.; Li, Y. An On-line SOH estimation method for power battery under low sampling rate. J. Energy Storage 2024, 83, 110695. [Google Scholar] [CrossRef]
- Zhu, J.; Wang, Y.; Huang, Y.; Gopaluni, R.B.; Cao, Y.; Heere, M.; Mühlbauer, M.J.; Mereacre, L.; Dai, H.; Liu, X.; et al. Data-driven capacity estimation of commercial lithium-ion batteries from voltage relaxation. Nat. Commun. 2022, 13, 2261. [Google Scholar] [CrossRef] [PubMed]
- Li, C.; Yang, L.; Li, Q.; Zhang, Q.; Zhou, Z.; Meng, Y.; Zhao, X.; Wang, L.; Zhang, S.; Li, Y.; et al. SOH estimation method for lithium-ion batteries based on an improved equivalent circuit model via electrochemical impedance spectroscopy. J. Energy Storage 2024, 86, 111167. [Google Scholar] [CrossRef]
- Wang, J.; Liu, P.; Hicks-Garner, J.; Sherman, E.; Soukiazian, S.; Verbrugge, M.; Tataria, H.; Musser, J.; Finamore, P. Cycle-life model for graphite-LiFePO 4 cells. J. Power Sources 2010, 196, 3942–3948. [Google Scholar] [CrossRef]
- Ma, Y.; Wu, L.; Guan, Y.; Peng, Z. The capacity estimation and cycle life prediction of lithium-ion batteries using a new broad extreme learning machine approach. J. Power Sources 2020, 476, 228581. [Google Scholar] [CrossRef]
- Matthieu, D.; George, B.; David, A. Perspective on State-of-Health Determination in Lithium-Ion Batteries. J. Electrochem. Energy Convers. Storage 2020, 17, 044701. [Google Scholar]
- Wang, H.; Li, Y.F.; Zhang, Y. Bioinspired spiking spatiotemporal attention framework for lithium-ion batteries state-of-health estimation. Renew. Sustain. Energy Rev. 2023, 188, 113728. [Google Scholar] [CrossRef]
- Hu, X.; Li, S.; Peng, H. A comparative study of equivalent circuit models for Li-ion batteries. J. Power Sources 2011, 198, 359–367. [Google Scholar] [CrossRef]
- Chen, S.Z.; Liang, Z.; Yuan, H.; Yang, L.; Xu, F.; Fan, Y. A novel state of health estimation method for lithium-ion batteries based on constant-voltage charging partial data and convolutional neural network. Energy 2023, 283, 129103. [Google Scholar] [CrossRef]
- Qu, S.; Kang, Y.; Gu, P.; Zhang, C.; Duan, B. A Fast Online State of Health Estimation Method for Lithium-Ion Batteries Based on Incremental Capacity Analysis. Energies 2019, 12, 3333. [Google Scholar] [CrossRef]
- Sun, Q.; Cui, F.; Shi, M. Capacity estimation of lithium-ion battery with multi-task autoencoder and empirical mode decomposition. Measurement 2024, 236, 115146. [Google Scholar] [CrossRef]
- Matthieu, D.; David, A. Best practices for incremental capacity analysis. Front. Energy Res. 2022, 10, 3333. [Google Scholar]
- Piao, C.; Sun, R.; Chen, J.; Liu, M.; Wang, Z. A feature extraction approach for state-of-health estimation of lithium-ion battery. J. Energy Storage 2023, 73, 108871. [Google Scholar] [CrossRef]
- Yang, N.; Song, Z.; Hofmann, H.; Sun, J. Robust State of Health estimation of lithium-ion batteries using convolutional neural network and random forest. J. Energy Storage 2022, 48, 103857. [Google Scholar] [CrossRef]
- Lyu, Z.; Tang, Y.; Wu, Z.; Wu, L.; Qiang, X. Online state of health estimation for Li-ion batteries in EVs through a data-fusion-model method. J. Energy Storage 2024, 100, 113588. [Google Scholar] [CrossRef]
- Matthieu, D.; David, B. Analysis of Synthetic Voltage vs. Capacity Datasets for Big Data Li-ion Diagnosis and Prognosis. Energies 2021, 14, 2371. [Google Scholar] [CrossRef]
- Matthieu, D.; Arnaud, D.; Yann, B.L. Two-Point State-of-Charge Determination in Lithium-Ion Battery Packs. Meet. Abstr. 2015, MA2015-01, 698. [Google Scholar]
- Tran, N.; Khan, B.A.; Choi, W. State of Charge and State of Health Estimation of AGM VRLA Batteries by Employing a Dual Extended Kalman Filter and an ARX Model for Online Parameter Estimation. Energies 2017, 10, 137. [Google Scholar] [CrossRef]
- Jiang, B.; Dai, H.; Wei, X. Incremental capacity analysis based adaptive capacity estimation for lithium-ion battery considering charging condition. Appl. Energy 2020, 269, 115074. [Google Scholar] [CrossRef]
- Li, Q.; Lu, T.; Lai, C.; Li, J.; Pan, L.; Ma, C.; Zhu, Y.; Xie, J. Lithium-ion battery capacity estimation based on fragment charging data using deep residual shrinkage networks and uncertainty evaluation. Energy 2024, 290, 130208. [Google Scholar] [CrossRef]
- Zuo, H.; Liang, J.; Zhang, B.; Wei, K.; Zhu, H.; Tan, J. Intelligent estimation on state of health of lithium-ion power batteries based on failure feature extraction. Energy 2023, 282, 128794. [Google Scholar] [CrossRef]
- Zhang, X.; Huang, Y.; Zhang, Z.; Lin, H.; Zeng, Y.; Gao, M. A Hybrid Method for State-of-Charge Estimation for Lithium-Ion Batteries Using a Long Short-Term Memory Network Combined with Attention and a Kalman Filter. Energies 2022, 15, 6745. [Google Scholar] [CrossRef]
- Dai, H.; Lai, Y.; Huang, Y.; Yu, H.; Yang, Y.; Zhu, L. State-of-health estimation of lithium-ion batteries using multiple correlation analysis-based feature screening and optimizing echo state networks with the weighted mean of vectors. J. Power Sources 2024, 623, 235482. [Google Scholar] [CrossRef]
- Goldman, R. Curvature formulas for implicit curves and surfaces. Comput. Aided Geom. Des. 2005, 22, 632–658. [Google Scholar] [CrossRef]
- Li, X.; Fan, D.; Liu, X.; Xu, S.; Huang, B. State of health estimation for lithium-ion batteries based on improved bat algorithm optimization kernel extreme learning machine. J. Energy Storage 2024, 101, 113756. [Google Scholar] [CrossRef]
- Nakano, K.; Vögler, S.; Tanaka, K. Advancing state of health estimation for electric vehicles: Transformer-based approach leveraging real-world data. Adv. Appl. Energy 2024, 16, 100188. [Google Scholar] [CrossRef]
Disclaimer/Publisher’s Note: The statements, opinions and data contained in all publications are solely those of the individual author(s) and contributor(s) and not of MDPI and/or the editor(s). MDPI and/or the editor(s) disclaim responsibility for any injury to people or property resulting from any ideas, methods, instructions or products referred to in the content. |
© 2025 by the authors. Published by MDPI on behalf of the World Electric Vehicle Association. Licensee MDPI, Basel, Switzerland. This article is an open access article distributed under the terms and conditions of the Creative Commons Attribution (CC BY) license (https://creativecommons.org/licenses/by/4.0/).