1. Introduction
With the continuous aggravation of environmental pollution and energy crises, the hybrid electric–diesel tractor, which combines the advantages of both electric and traditional fuel-powered tractors, has become the primary choice in agricultural production. It is also a key research direction for agricultural machinery equipment development toward ecology, energy conservation, and environmental protection [
1,
2,
3]. As one of the critical components of the tractor, the battery’s performance directly determines the safety, reliability, and operational efficiency of agricultural tasks performed by the tractor [
4]. BMS is required to provide the driver with accurate battery status information in real-time, such as SOC and State of Health (SOH), to ensure the battery operates safely and reliably while the tractor performs agricultural work efficiently. Battery SOC estimation is one of the core functions of the power battery management system. Accurate SOC estimation can optimize the power battery system, effectively ensuring the efficient and safe operation of the battery system, and provides essential information for the energy management and safety management of hybrid tractors [
5,
6]. Existing studies mainly focus on optimizing SOC estimation algorithms, often neglecting the high sensitivity of batteries to temperature, which leads to significant errors in battery model parameter identification and SOC estimation results. Therefore, conducting SOC estimation of hybrid tractor onboard batteries with temperature considerations can effectively enhance BMS performance as well as fuel economy and work efficiency, which is of significant importance for the ecological, energy-saving, and environmentally friendly development of agricultural machinery [
7].
SOC refers to the ratio of the current remaining charge to the total capacity of the battery. It cannot be directly measured by sensors and can only be indirectly obtained through parameters such as current, voltage, and temperature. To better study the charge-discharge characteristics of batteries and design reliable SOC estimation methods for optimizing the energy management system of hybrid tractors, accurate battery modeling is essential [
8]. Common power battery models include electrochemical models, equivalent circuit models (ECMs), fractional-order models, and multi-model fusion. Pramanik et al. [
9] established a 1-D electrochemical model based on the internal reaction mechanisms of batteries and proposed a new charging strategy for lithium-ion batteries based on the Pontryagin principle. This strategy effectively shortens the charging time within safe limits and improves battery durability. Xin Lai et al. [
10] focused on lithium nickel–cobalt–manganese oxide batteries and established 11 equivalent circuit models. In-depth comparative analysis of these models showed that the first-order equivalent circuit model has good reliability, while the second-order RC (Resistor–Capacitor, RC) equivalent circuit model provides higher accuracy. The other models increased the RC order, but the identification process involved numerous unknown variables, which can lead to overfitting and decreased reliability. Rui Xiong et al. [
11] developed a fractional-order model that considers the Butler–Volmer kinetic equation based on battery impedance spectroscopy, optimizing lithium-ion battery parameter identification by combining least squares and genetic algorithms. Simulation results showed that, under a wide temperature range and aging conditions, the battery SOC estimation accuracy exceeded that of traditional models. Wu Yizhou et al. [
12] applied the forgetting factor recursive least squares method for online parameter identification and established a dynamic stress-induced battery capacity degradation model based on battery aging experimental data. They also used multi-model fusion for SOC estimation, but this approach is computationally intensive, requires high hardware demands, and is difficult to implement on tractors at this stage. Liu Fang et al. [
13] proposed a novel multi-state online joint estimation method for lithium-ion batteries based on a new electro-thermal coupling model. By employing a dual filtering algorithm to simultaneously address thermal state estimation and battery state estimation, this approach significantly improves the accuracy of state monitoring. Studies indicate that the equivalent circuit model does not consider the internal chemical reactions of the battery but describes the voltage response of lithium-ion batteries using ideal electrical components. A constant voltage source characterizes the static voltage characteristics, while an RC network is used to represent dynamic voltage characteristics such as polarization and hysteresis, with a simple structure, concentrated parameters, and clear physical meaning. On the other hand, temperature directly affects the open-circuit voltage and capacity of the power battery, thereby impacting the accuracy of SOC estimation. Therefore, it is crucial to consider the impact of temperature on battery performance during the modeling process [
14,
15]. Considering the complex load variation and temperature effects in tractor operation, it is more reasonable to use a second-order RC equivalent circuit model for lithium-ion battery modeling in the research process, which accounts for the temperature influence.
The agricultural operations of tractors involve random and complex loads with significant fluctuations, making it challenging to obtain precise SOC values during operations. Currently, the commonly used battery SOC estimation methods include ampere-hour integration, parameter-based methods, model-based methods, and data-driven methods. Fengyan Yi et al. [
16] proposed a matrix-based long short-term memory (LSTM) network approach to predict the lifespan of proton exchange membrane fuel cells (PEMFCs), thereby enhancing the operational safety of fuel cell vehicles. Chunchun Jia [
17] developed a high-precision aging model for power batteries and introduced a learning-based model predictive approach, effectively reducing the total operating costs of electric vehicles. Xin Zhang et al. [
18] proposed an improved ampere-hour integration method based on a long short-term memory (LSTM) network model for battery capacity estimation. Simulation results showed that the modified ampere-hour integration method reduced SOC estimation errors to less than 10%. Liu Su-Zhen et al. [
19] applied a particle swarm optimization algorithm combined with an acoustic homogenization model to accurately estimate the mechanical characteristic parameters of lithium-ion batteries, establishing a relationship between mechanical characteristics and SOC. The average absolute error (MAE) of SOC estimation under dynamic conditions was 1.68%, and the root mean square error (RMSE) was 1.92%. Jinhao Meng et al. [
20] developed a dynamic linear battery model capable of automatic parameter updates and used linear Kalman filtering to estimate the SOC of lithium iron phosphate batteries. The simulation results effectively indicated that this modeling method offers faster response and higher SOC estimation accuracy. Zhang Zhi et al. [
21] applied a data-driven method to estimate the SOC of lithium-ion batteries, enhancing SOC estimation accuracy by adding a gating mechanism to a recurrent neural network and combining the unscented Kalman filter (UKF) method. Yu Zhilong et al. [
22] integrated neural networks with extended Kalman filtering (EKF), using EKF to update the neural network model’s thresholds in real-time. The errors in SOC estimation under both hybrid pulse power characteristic (HPPC) and urban dynamometer driving schedule (UDDS) conditions were both under 4%. Li Hongpei et al. [
23] improved the unscented Kalman filter algorithm with a forgetting factor for internal battery parameter identification and used a WOA-BP (Whale Optimization Algorithm, Back Propagation Neural Network) neural network algorithm to estimate the SOC of lithium-ion batteries. Compared to the traditional BP algorithm, the SOC estimation MAE decreased by 1.9%, and the RMSE decreased by 4.1%. Research shows that data-driven methods are less dependent on mathematical models and rely on historical charging and discharging data for SOC estimation. These methods offer high estimation accuracy, excel at handling nonlinear issues, and can effectively optimize SOC estimation accuracy using neural network algorithms. Therefore, data-driven SOC estimation based on neural network algorithms has promising applications for hybrid tractors.
In conclusion, the second-order RC equivalent circuit model considering temperature effects can accurately describe the battery’s charge–discharge characteristics. Using neural network algorithms to optimize data-driven models can effectively improve SOC estimation accuracy. In this study, we select lithium iron phosphate (LiFePO4) batteries commonly used in tractors as the research object. We establish a second-order RC equivalent circuit model for LiFePO4 batteries under the influence of temperature based on experimental data. Furthermore, we use a snowballing algorithm combined with the long short-term memory network (SAO-LSTM) to estimate the SOC of the LiFePO4 battery.
The main research content of this paper is as follows:
Section 2, based on real-time measurement data (current, voltage, temperature) of lithium iron phosphate batteries from the University of Maryland, completes battery parameter identification using the Forgetting Factor Recursive Least Squares (FFRLS) method. A Simulink model of the second-order RC equivalent circuit, considering temperature effects, is established in MATLAB/Simulink.
Section 3 employs the SAO-LSTM model to estimate the SOC of the LiFePO
4 battery, effectively improving SOC estimation accuracy. Simulation analysis of the SOC estimation of the LiFePO
4 battery under the tractor plowing conditions is performed based on the whole-machine dynamic model in MATLAB/Simulink, and the results are compared with those from the conventional ampere-hour integration method.
Section 4 and
Section 5 discuss and summarize the research findings and experimental results of this paper.
2. Model Construction and Parameter Identification
As one of the primary power sources for tractor drive systems, power batteries directly impact the overall operational performance of the machinery. Currently, the mainstream power batteries used in vehicles include lead-acid batteries, lithium-ion batteries, LiFePO
4 batteries, and nickel–metal hydride batteries. A comparative analysis of their key performance characteristics is summarized in
Table 1.
In hybrid tractors, the power battery serves as an auxiliary energy source that provides supplemental power during engine power shortages and vehicle startup. This application demands rapid energy response capability from the battery to meet the vehicle’s overall dynamic performance requirements. Consequently, LiFePO4 batteries have been selected as the focus of this study.
Existing research on the estimation of the SOC of batteries mainly focuses on the room temperature (25 °C). However, the actual working environment temperature of batteries varies. Under different temperature environments, the performance and relevant parameters of the battery will change, especially in extreme temperature environments. These changes not only affect the use of the battery and the estimation accuracy of the SOC but also influence the reliability of the BMS and the normal operation of the hybrid tractor. Therefore, taking the ambient temperature into account, this paper establishes a second-order RC model of lithium iron phosphate batteries based on the battery charging and discharging test data at different temperatures to conduct the research.
2.1. Equivalent Circuit Model
The common equivalent circuit models of power batteries mainly include the Rint model, the RC model, and PNGV model, GNL (General Nonlinear, GNL) model. The performance comparison of the equivalent circuit model is shown in
Table 2.
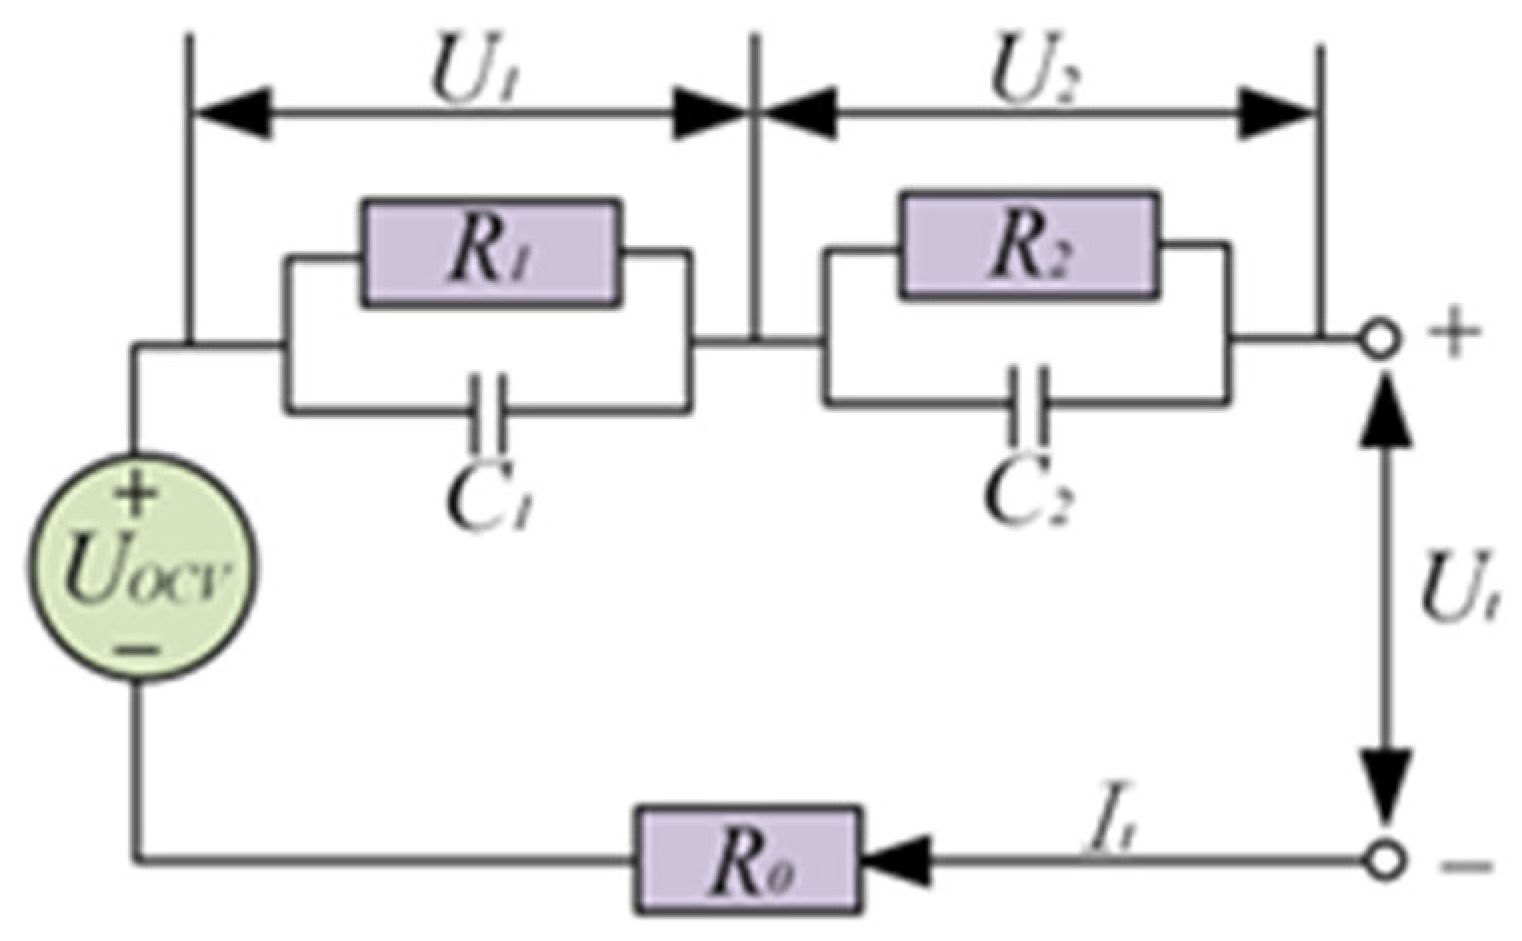
Therefore, in this paper, a second-order RC model is adopted to establish the physical model of the lithium-ion battery [
24]. The equivalent circuit model is shown in
Figure 1.
This model is composed of an ideal voltage source , an ohmic internal resistance , and two RC parallel circuits. is the open-circuit voltage of the battery; is the circuit current; is the internal resistance of electrochemical polarization; is the capacitance of electrochemical polarization; is the internal resistance of concentration polarization; is the capacitance of concentration polarization; is the ohmic internal resistance; is the load voltage.
According to Kirchhoff’s voltage law and Kirchhoff’s current law, the dynamic equations of the second-order RC model are shown in Equations (1) and (2) as follows:
In these equations, represents the open-circuit voltage, and is a function of the SOC; t is the time.
2.2. OCV–SOC Characteristics at Different Temperatures
As one of the important decision-making factors for energy management, SOC plays a crucial role in the overall vehicle energy management, improving the capacity and energy utilization rate of power batteries, preventing overcharging and over-discharging of power batteries, and ensuring the safety of power battery usage. Among them, the SOC refers to the state of charge of the power battery, representing the ratio of the current power of the power battery to its total capacity:
In the formula, is the current electric capacity of the power battery, with the unit ; is the total capacity of the power battery, with the unit .
The dynamic change of SOC of the power battery is as follows:
In the formula, represents the discharging process, represents the charging process; is the coulombic efficiency of the power battery, which refers to the ratio of the discharged capacity to the charged capacity of the power battery within one cycle.
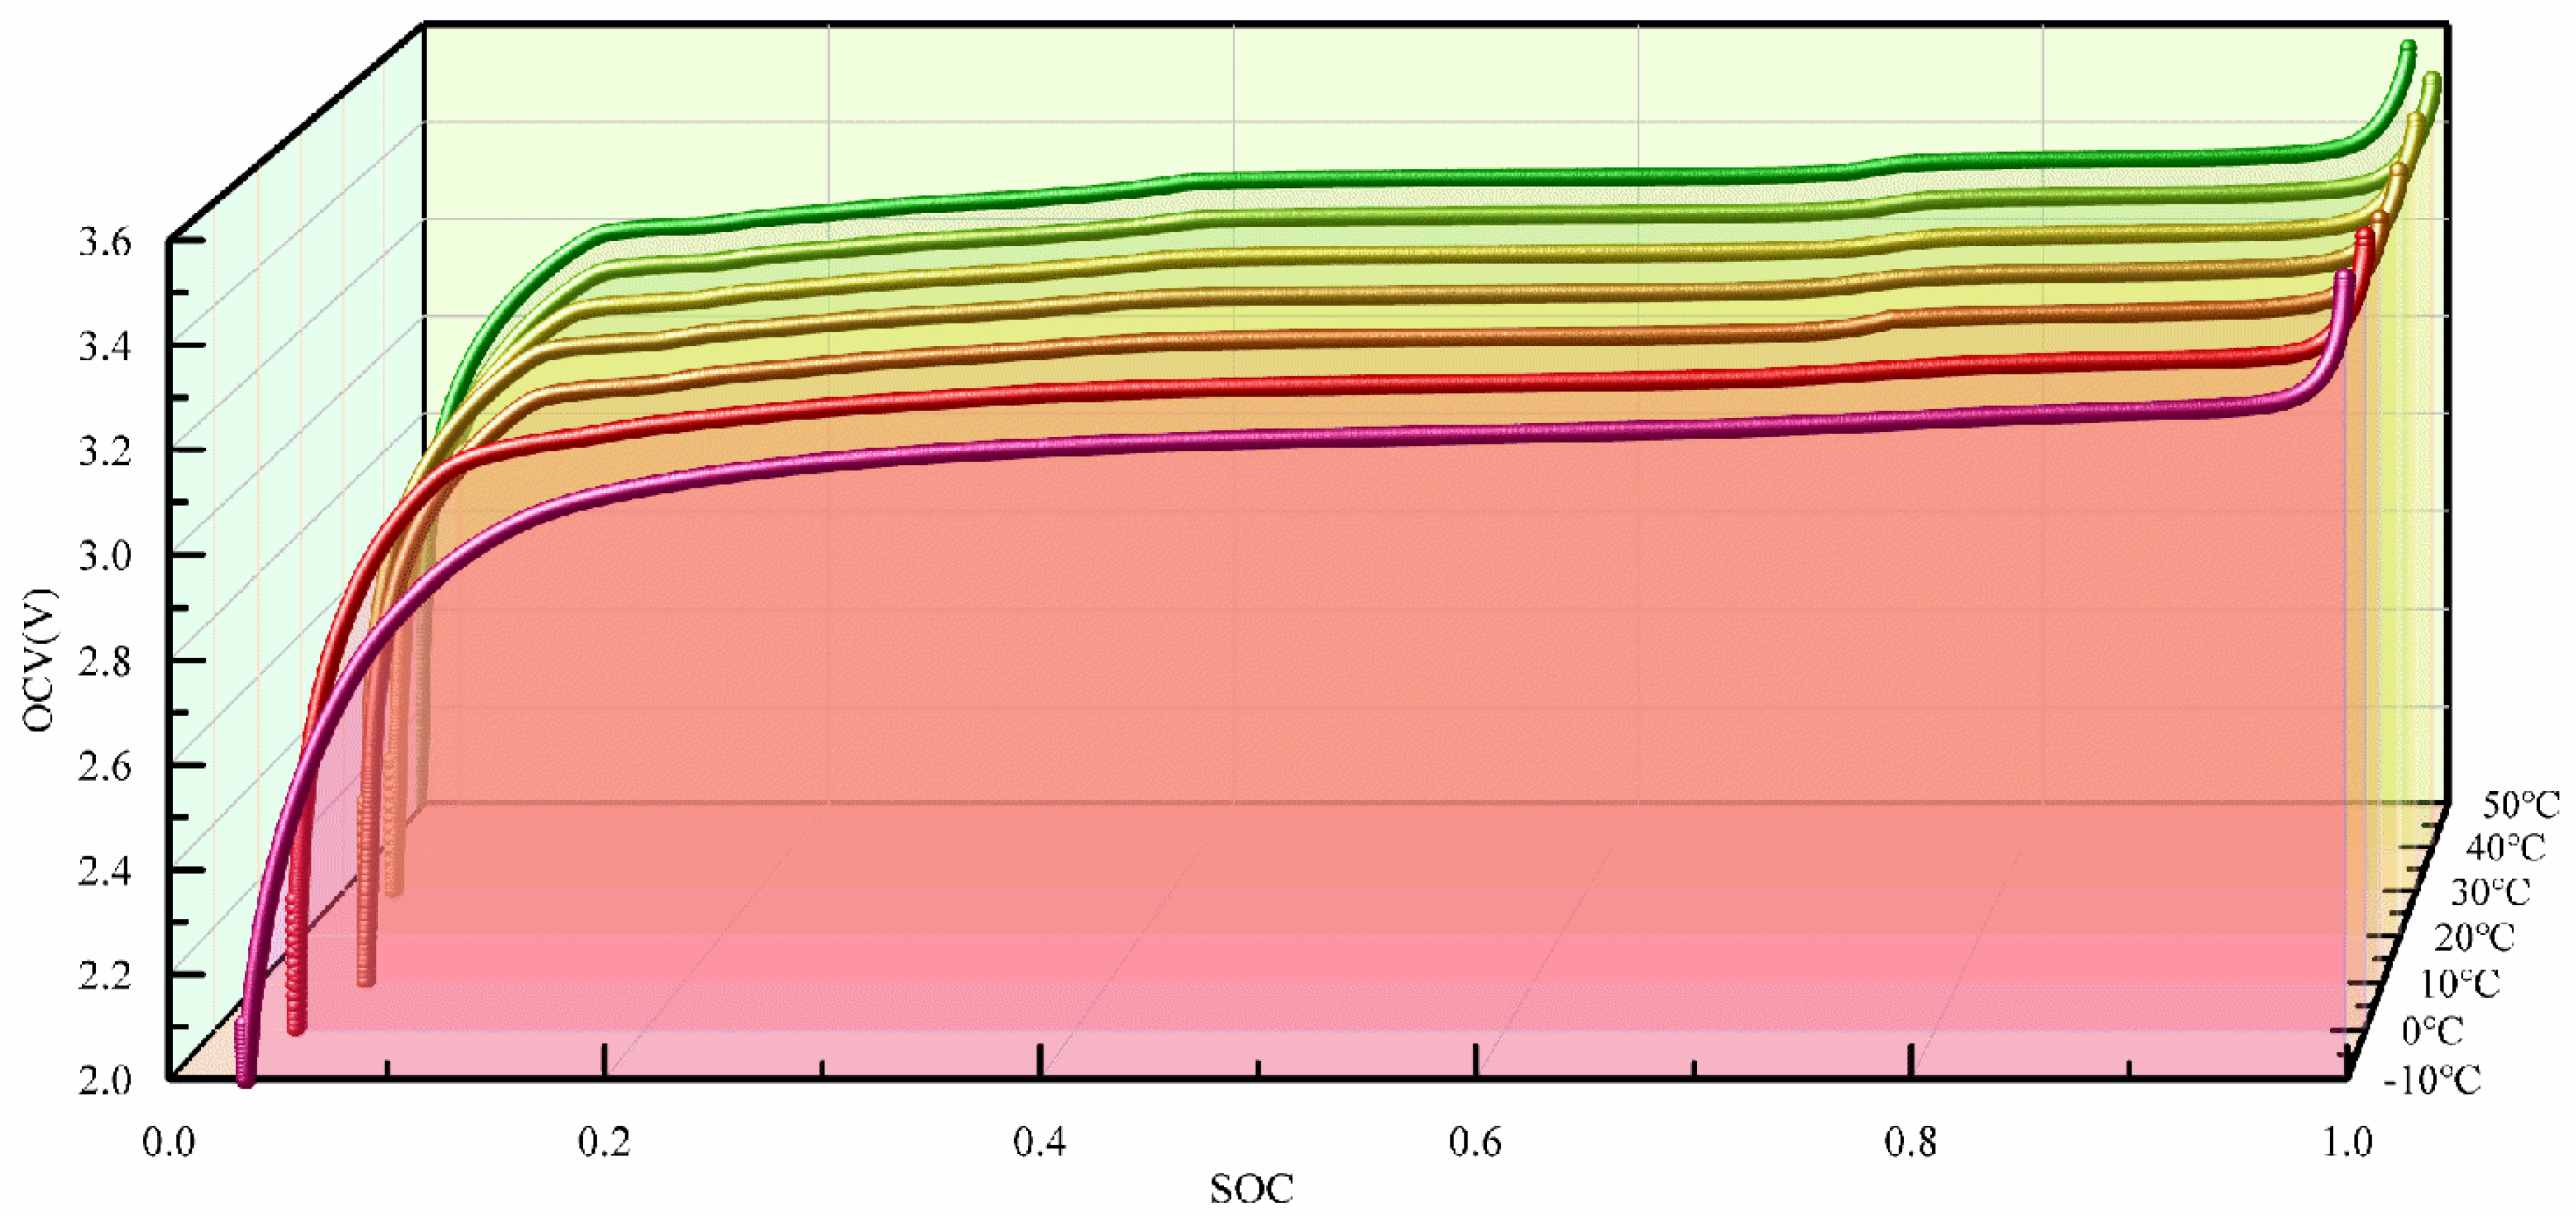
This paper conducts research by referring to the performance test data set of lithium iron phosphate batteries from the Advanced Life Cycle Engineering Center of the University of Maryland. Taking the influence of temperature into account, it models the LiFePO
4 battery, aiming to better estimate the SOC of the battery, optimize the monitoring and control of the battery by BMS, and improve the overall performance of the hybrid tractor [
25]. This data set conducts tests on lithium iron phosphate batteries in seven temperature environments of −10 °C, 0 °C, 10 °C, 20 °C, 30 °C, 40 °C, and 50 °C. The battery OCV—SOC—T curve is shown in
Figure 2.
The relevant data show that, when the battery capacity is high, the correlation decreases. Under different temperatures, there are significant differences in the charging and discharging curves of the battery. The temperature characteristics can affect the accuracy of battery modeling and the estimation of SOC. Therefore, the influence of temperature must be fully considered during the development of the algorithms for BMS.
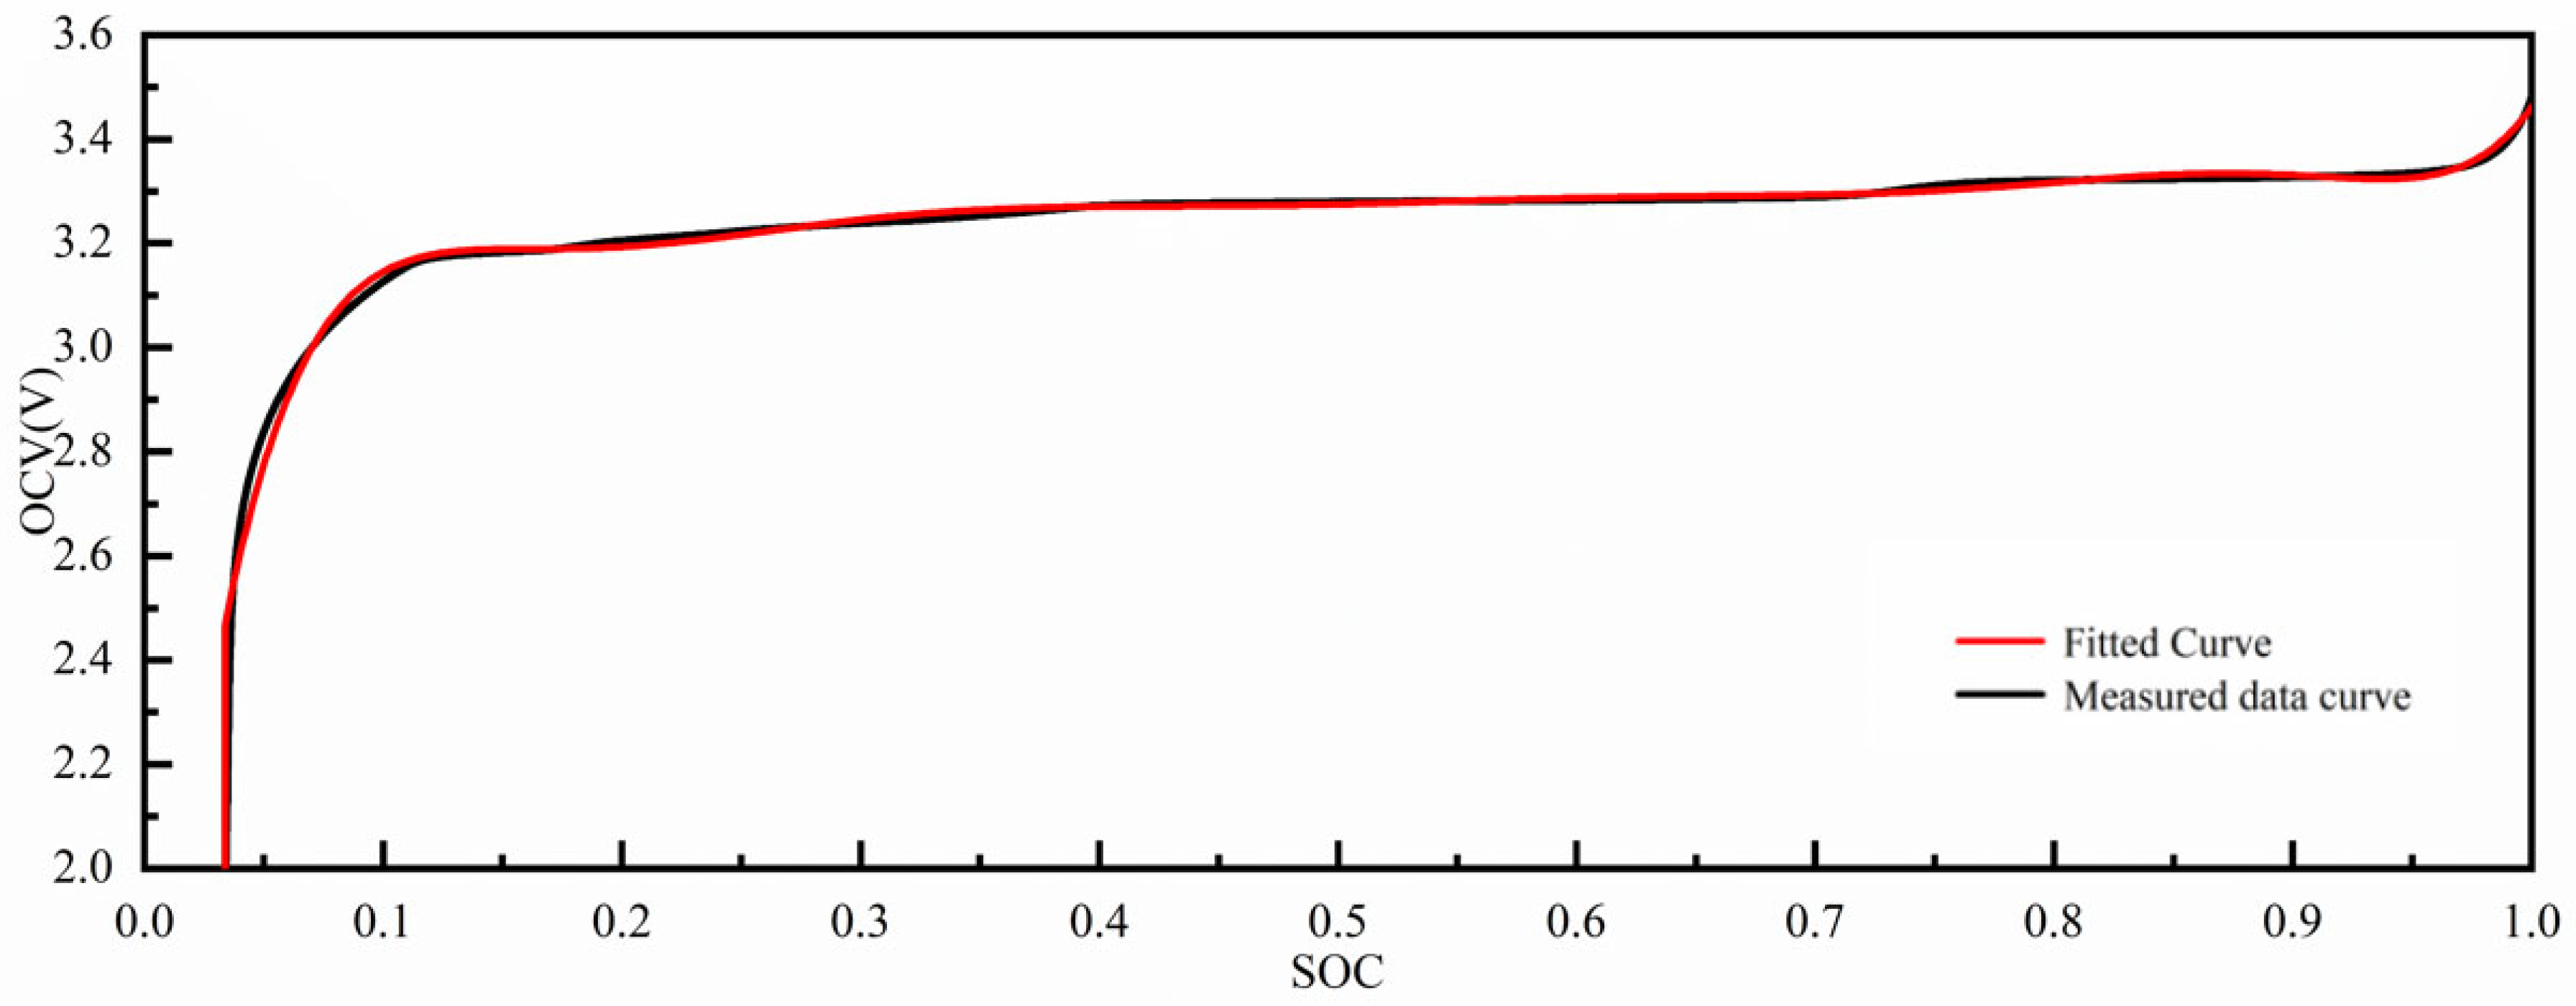
To reduce the errors caused by the hysteresis characteristics, taking the room temperature environment of 25 °C as an example, the Curve Fitting toolbox in MATLAB is used to perform a ninth-degree polynomial fitting on the average value of OCV in the charging and discharging experiments. The fitting curve is shown in
Figure 3, and the obtained polynomial function is shown in Equation (5).
The SOC–OCV curves in seven temperature environments of −10 °C, 0 °C, 10 °C, 20 °C, 30 °C, 40 °C, and 50 °C are successively fitted using this method, which is convenient for subsequent calculations.
2.3. Parameter Identification of LiFePO4 Batteries Based on FFRLS
In this paper, the parameters of the power battery are identified by using data such as the real-time measured current, voltage, and temperature of the power battery based on the least squares method with a forgetting factor. The recursive least squares method is a recursive algorithm improved based on the least squares method. The recursive least squares method with a forgetting factor introduces the forgetting factor on the basis of the recursive least squares method, which effectively reduces the influence of old data in the variance matrix and can obtain more accurate identification results, so as to realize the online update of the model parameters.
The main steps of FFRLS are as follows:
- (1)
Perform the Laplace transform on the battery model according to Equations (1) and (2), and then we have the following:
In the formula, is the Laplace operator in the complex frequency domain.
- (2)
Use the bilinear transformation to convert it from the continuous domain to the discrete domain, and then we have the following:
In the formula, is the sampling period, in seconds; is the domain value operator of the discrete system.
Let the following be true:
In the formula, is the internal voltage drop of the battery, ; is the operating moment.
- (3)
Inverse Laplace transformation:
The difference equation corresponding to Equation (9) in the discrete domain can be expressed as follows:
In the formula, () are the coefficients related to the model parameters.
Define the data matrix and parameter matrix of the system as follows:
Then, we have the following:
- (4)
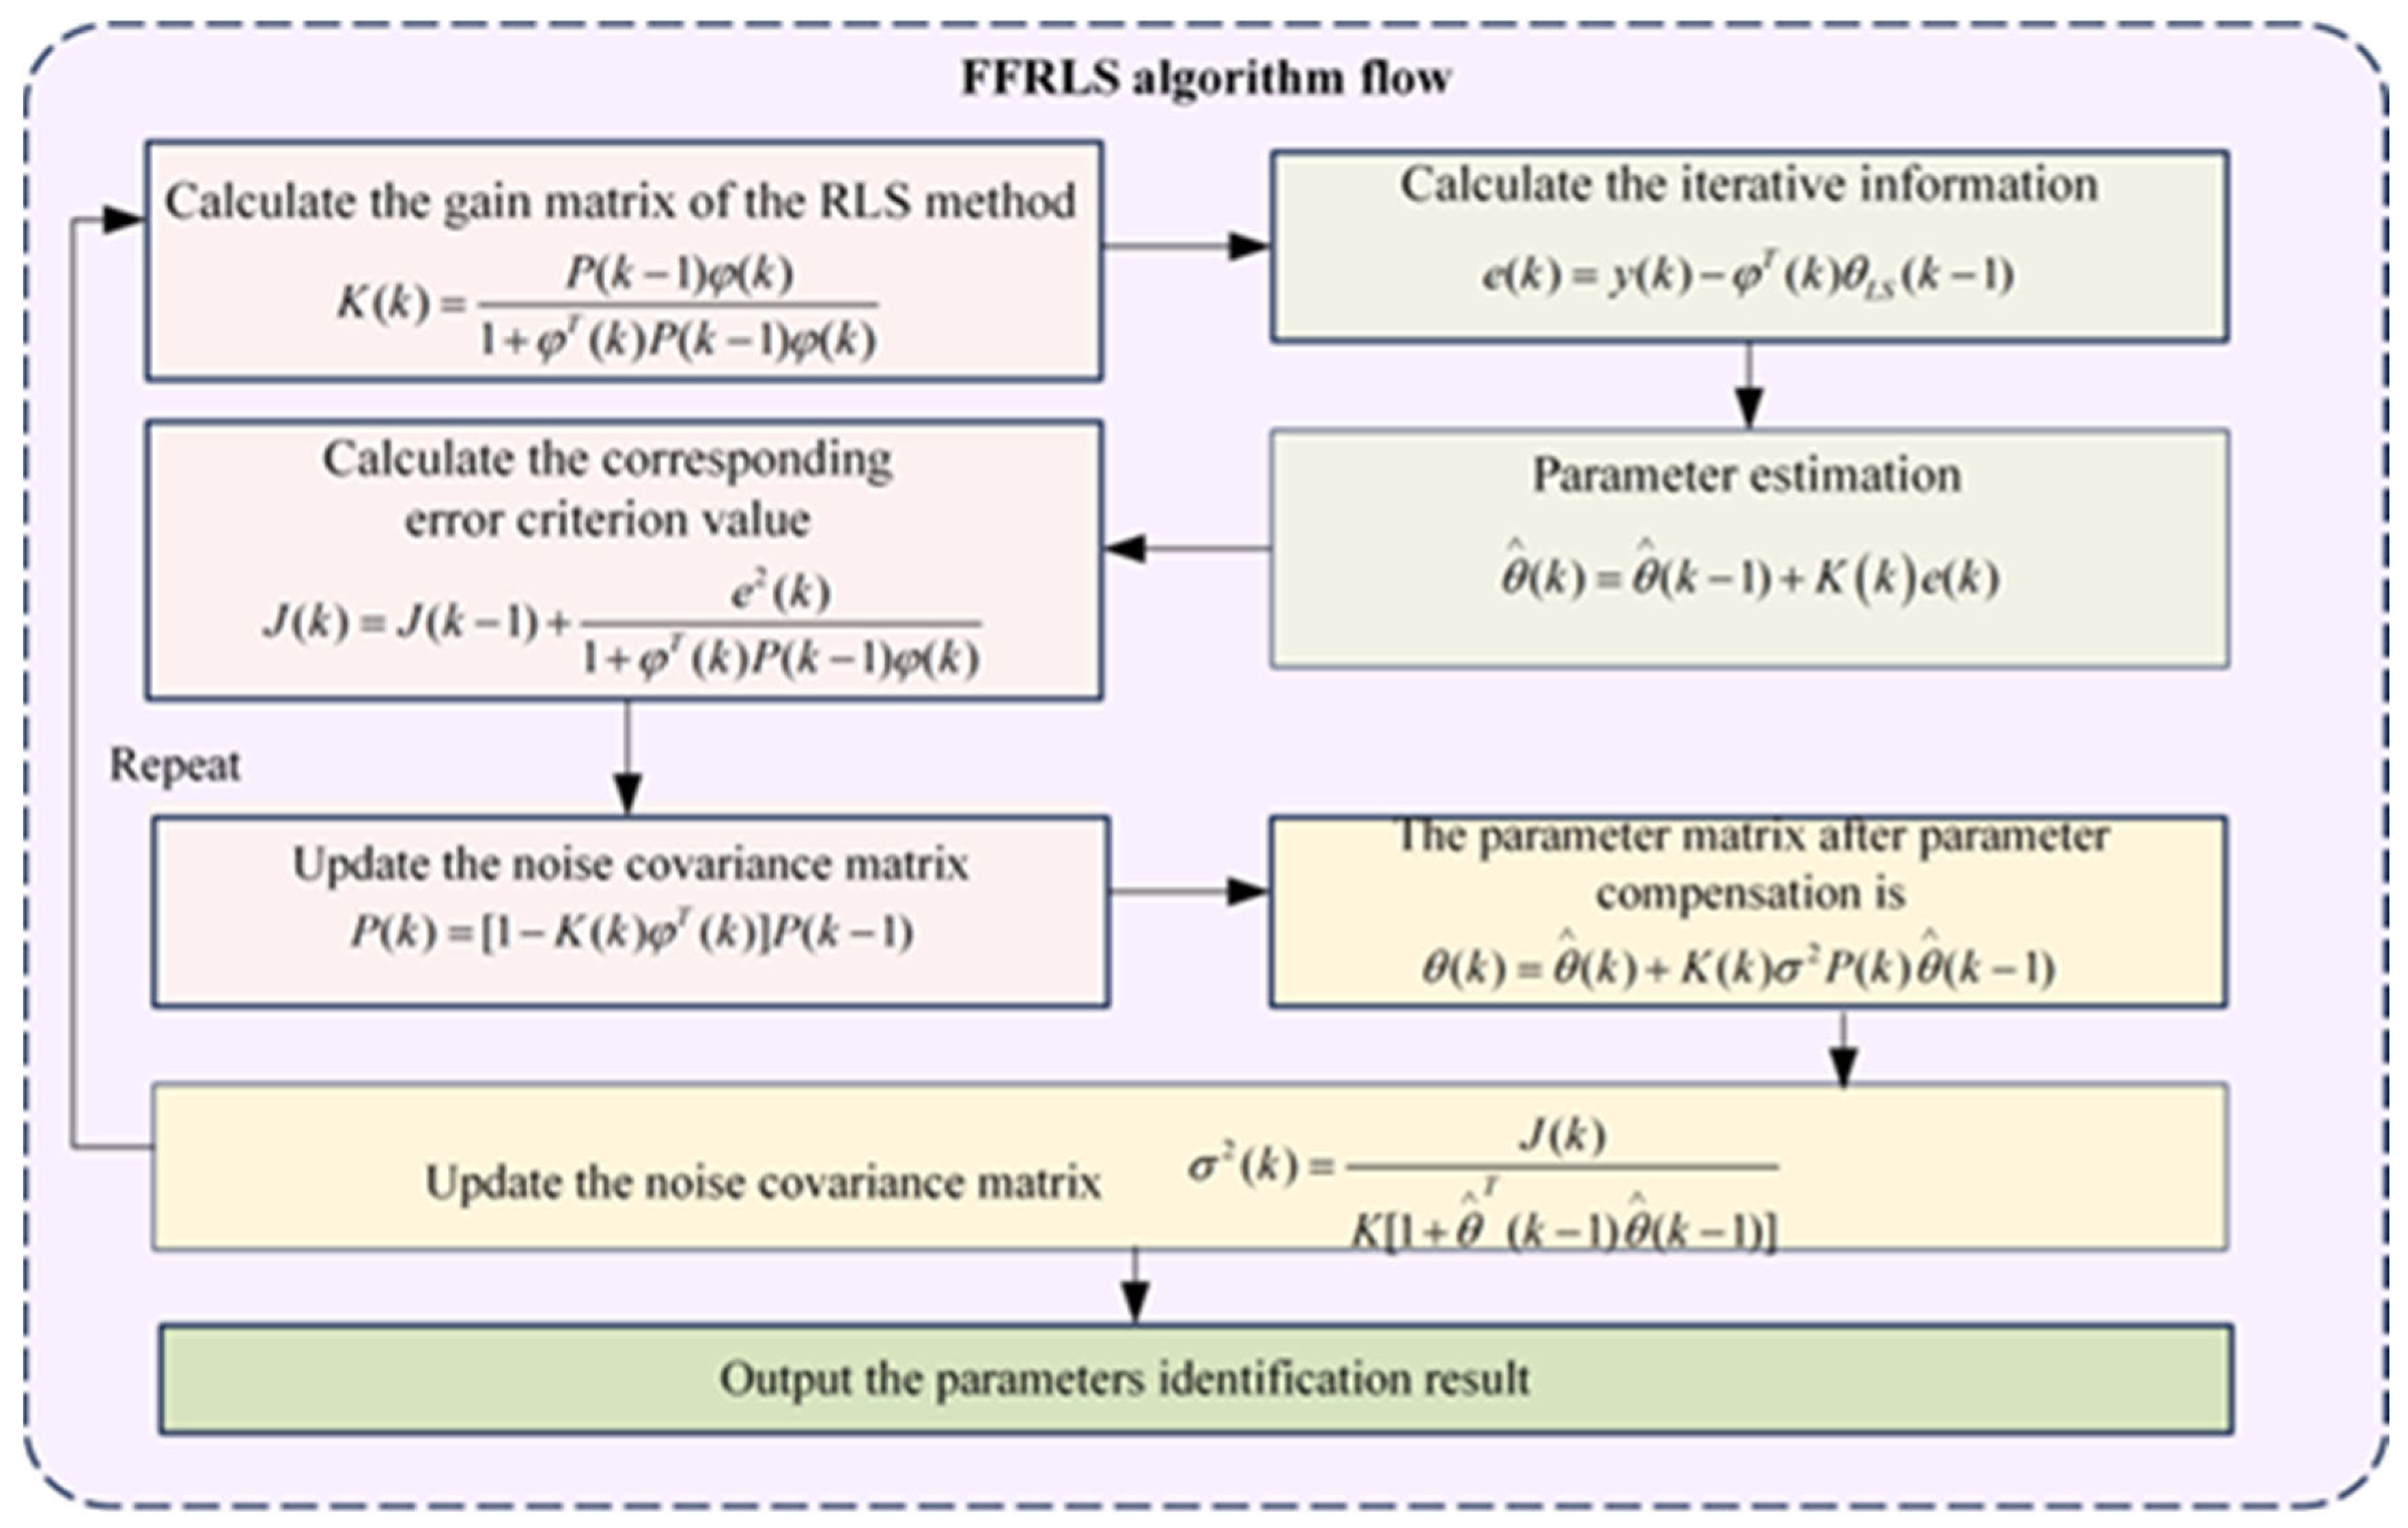
After arrangement, the recursive formula of the FFRLS algorithm is obtained as follows:
In the formula, is the gain matrix of the algorithm; is the covariance matrix; is the system observation matrix at the moment; is the corresponding parameter matrix; is the forgetting factor, and in this paper, .
The calculation flow chart of the FFRLS algorithm is shown in
Figure 4 as follows:
2.4. LiFePO4 Batteries Modeling
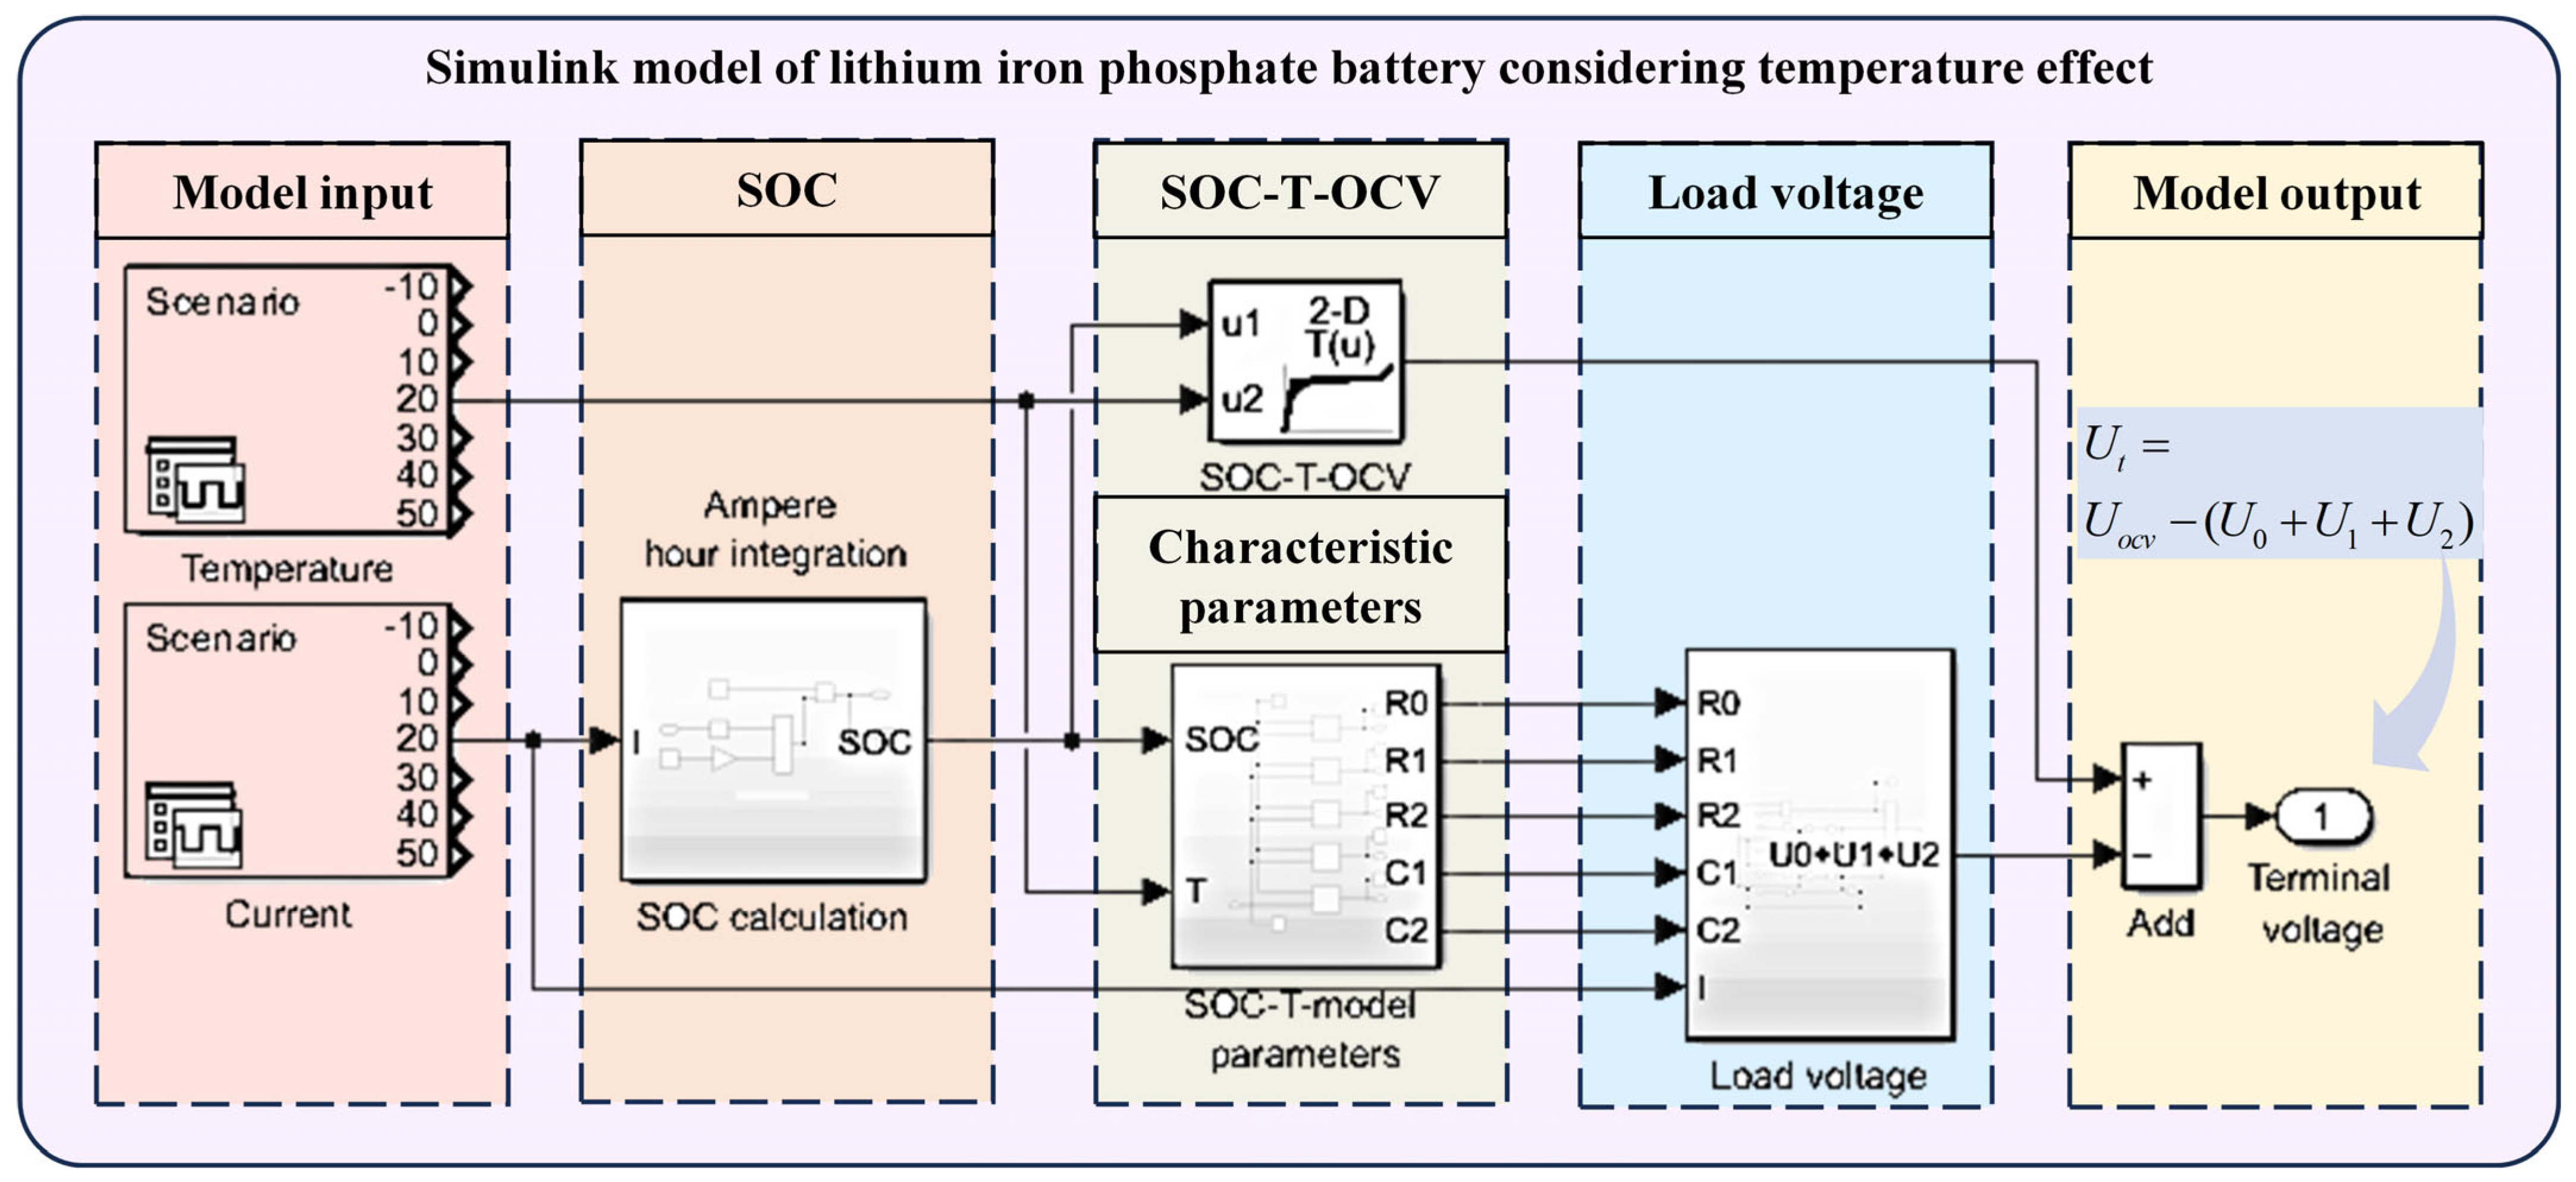
According to the identified parameters, a Simulink model of the LiFePO
4 battery is established in MATLAB/Simulink using the second-order RC equivalent circuit model, as shown in
Figure 5. This model is only used for voltage simulation verification and does not calculate the battery SOC.
4. Discussion
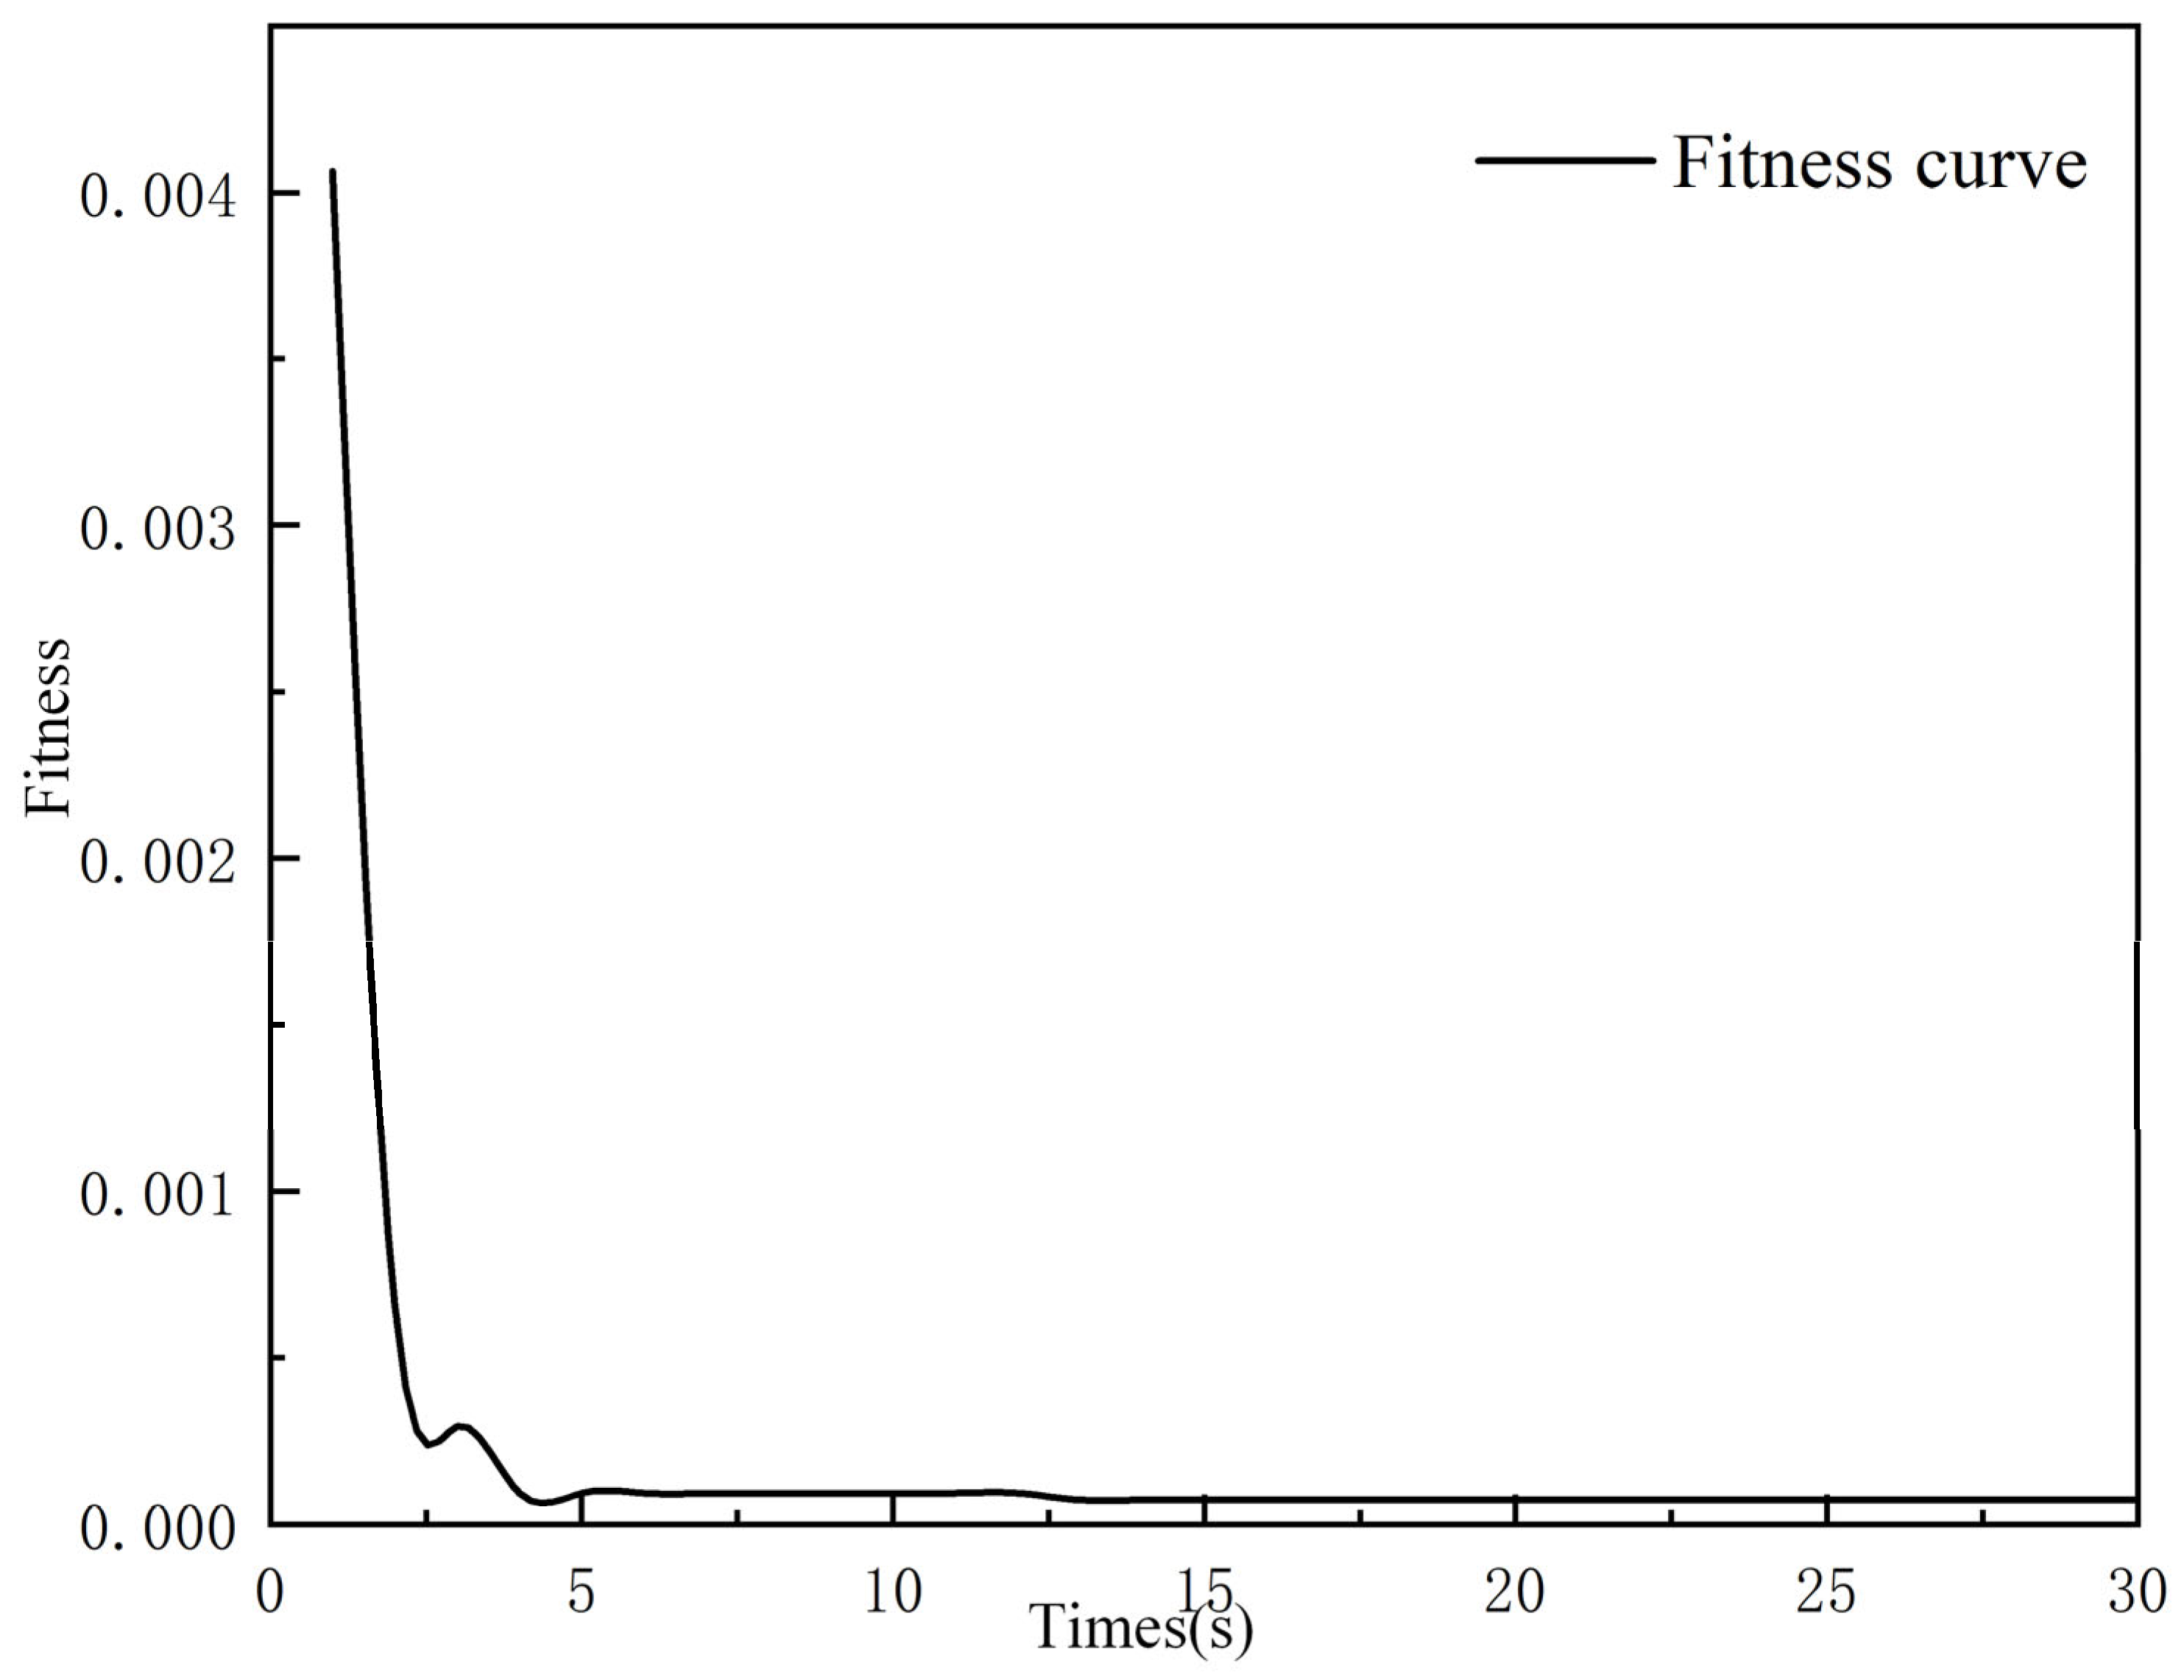
As can be seen from
Figure 9, during the iterative process of the SAO-LSTM algorithm, the fitness value iterates from the initial
to
. The SAO-LSTM reduces the model error by 98.23%, indicating that this algorithm has a significant effect on improving the accuracy of SOC estimation for lithium iron phosphate batteries in hybrid tractors.
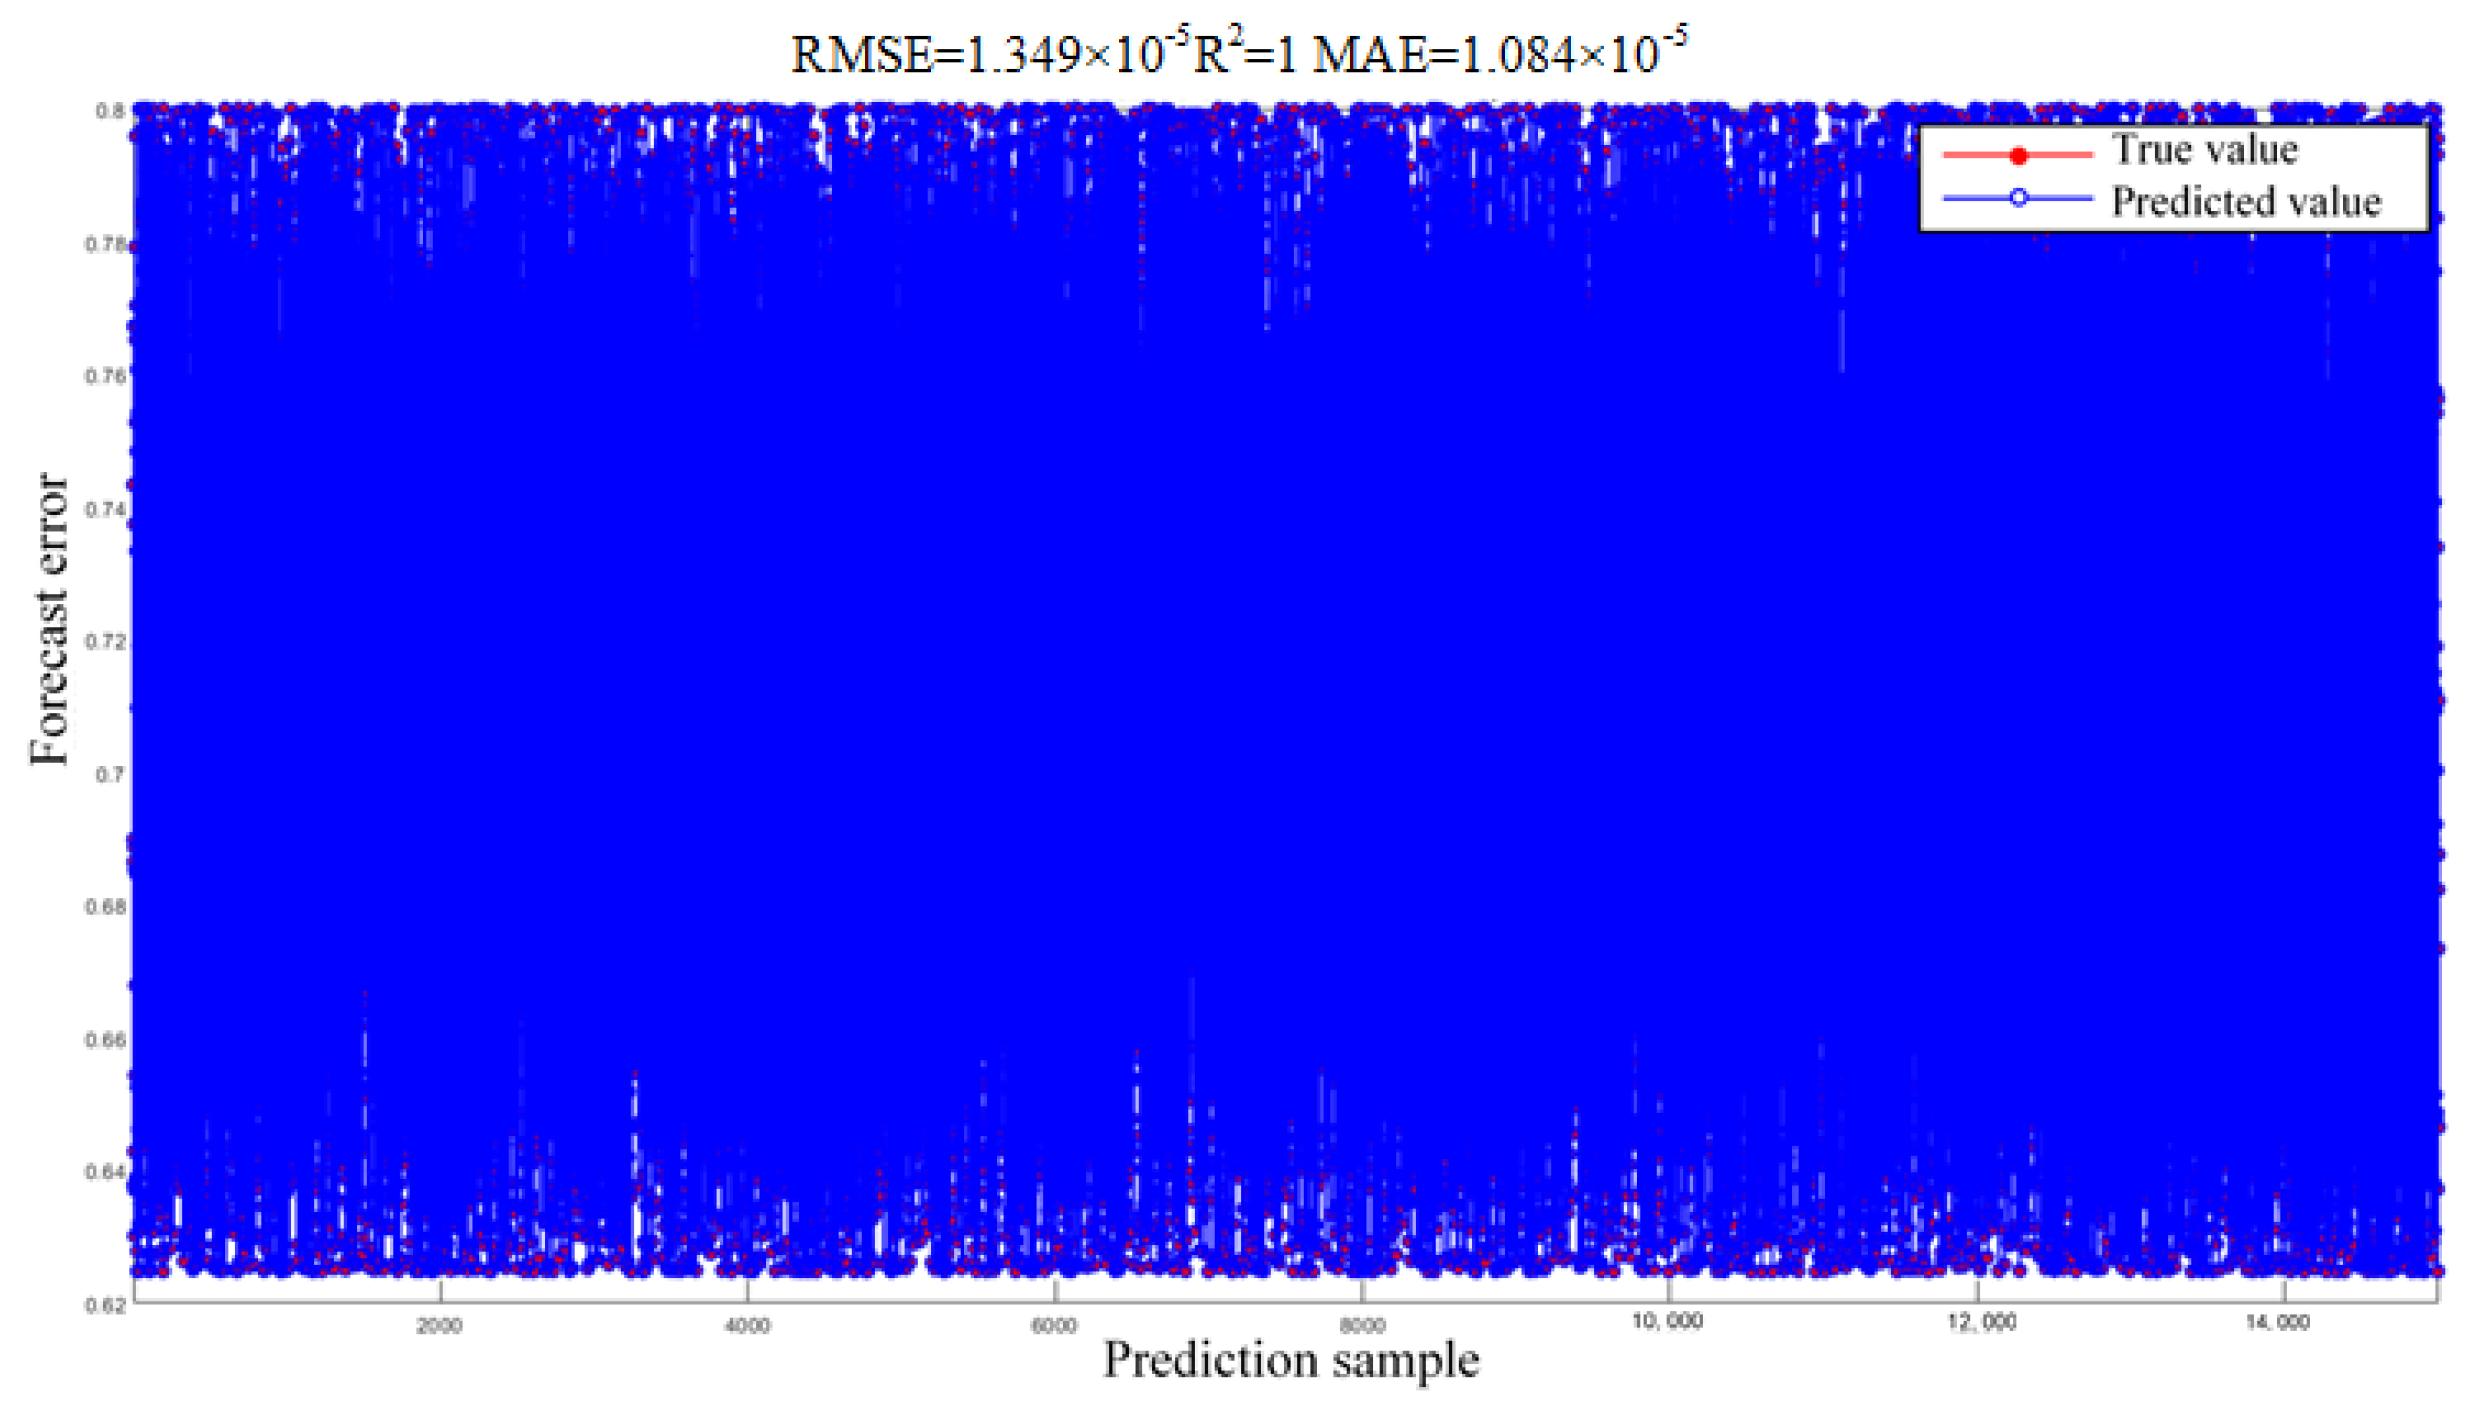
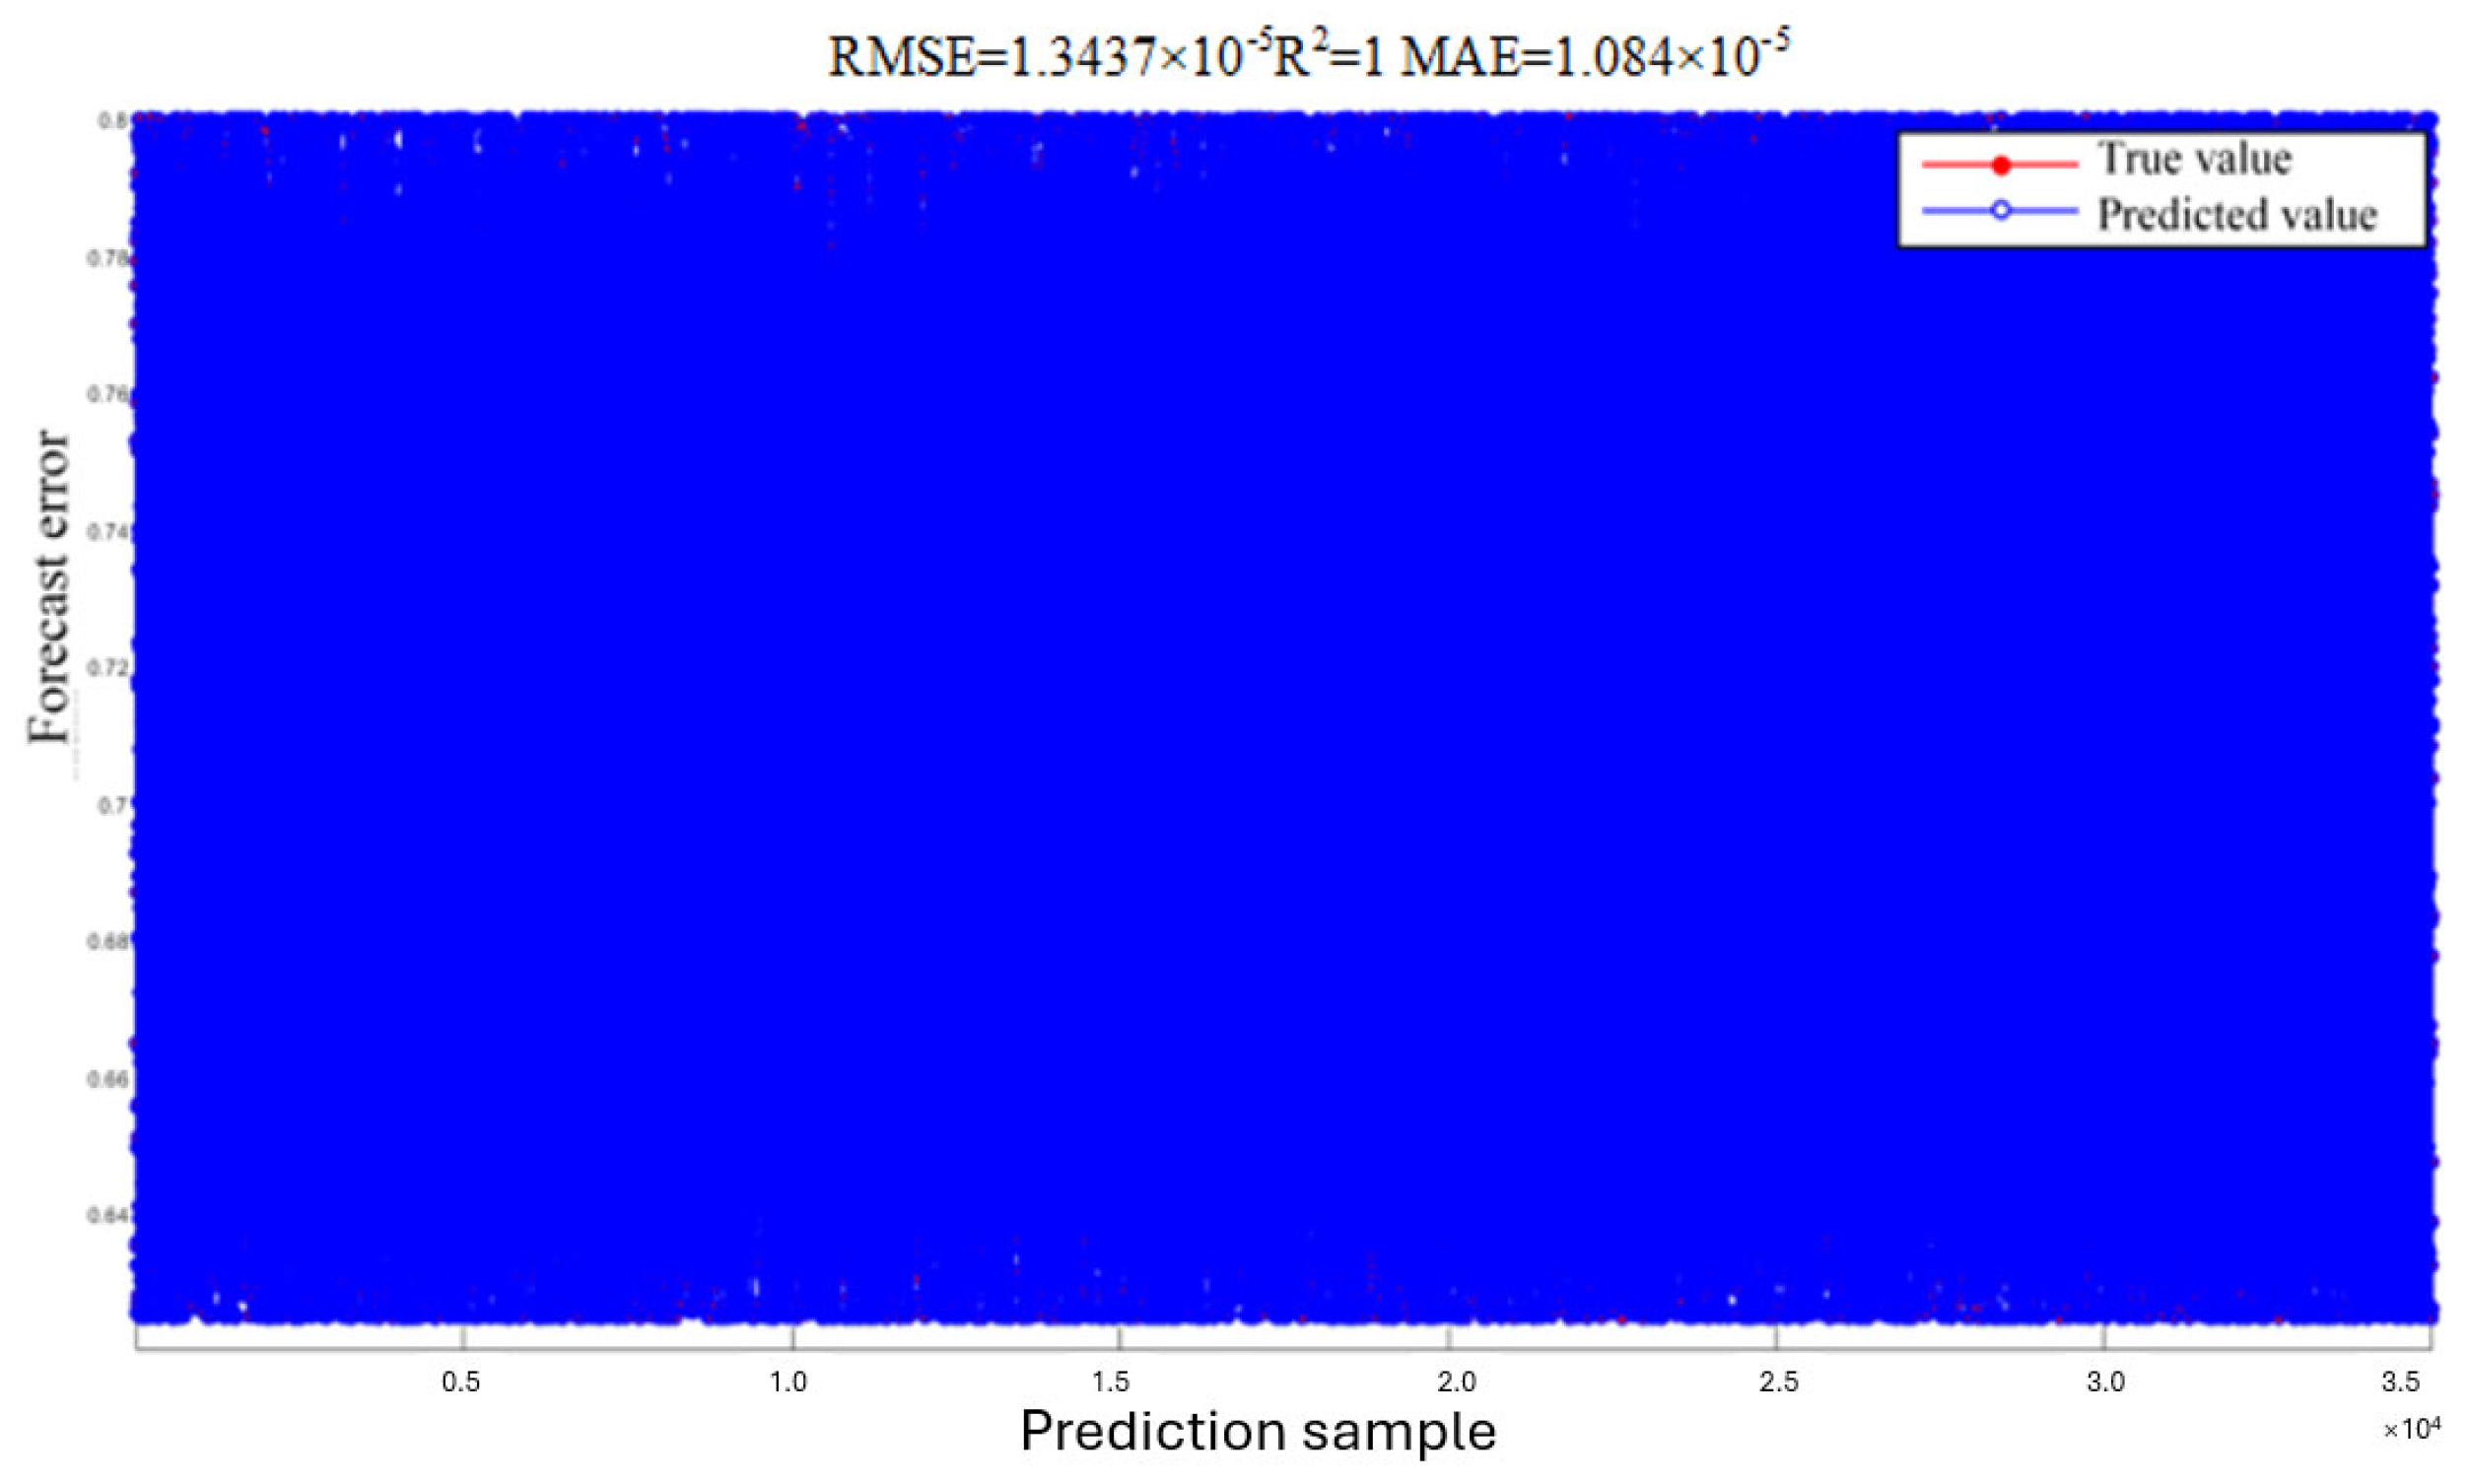
As can be observed from
Figure 10 and
Figure 11, the SOC predicted values optimized by SAO-LSTM have a more ideal fitting effect with the true values.
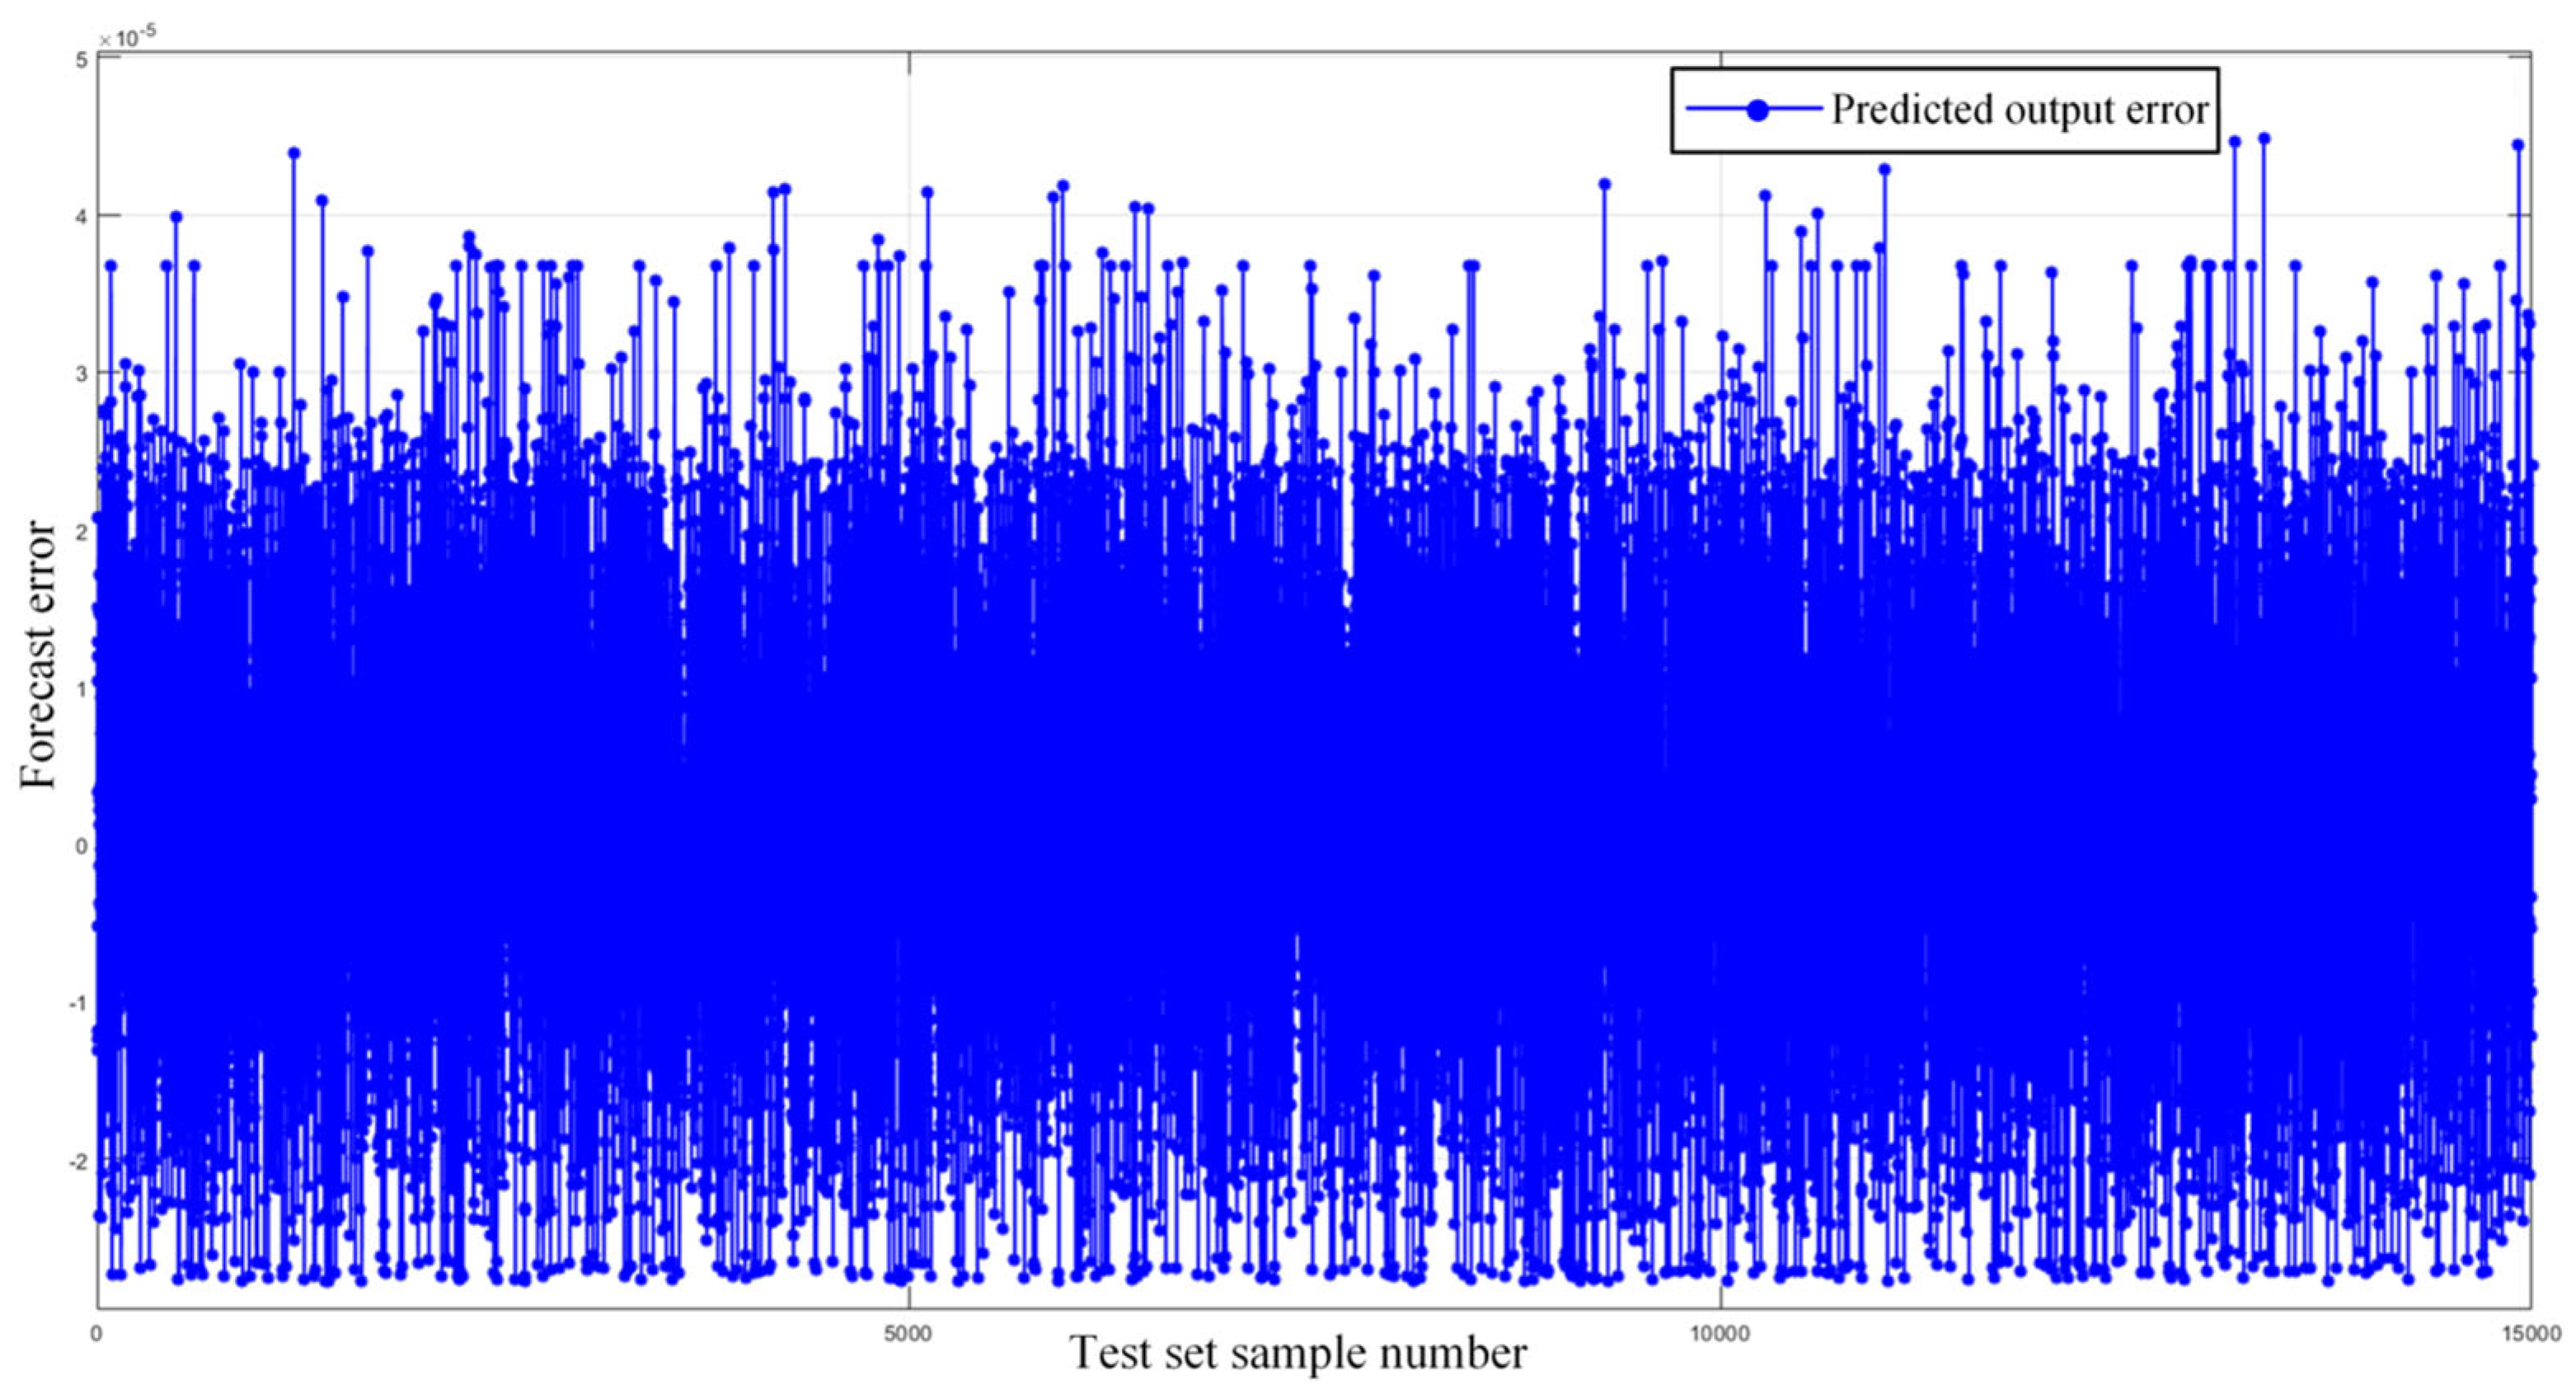
As shown in
Figure 12, the prediction errors of SAO-LSTM are concentrated in
, and the SOC estimation error < 0.001% meets the requirements of a high-precision BMS.
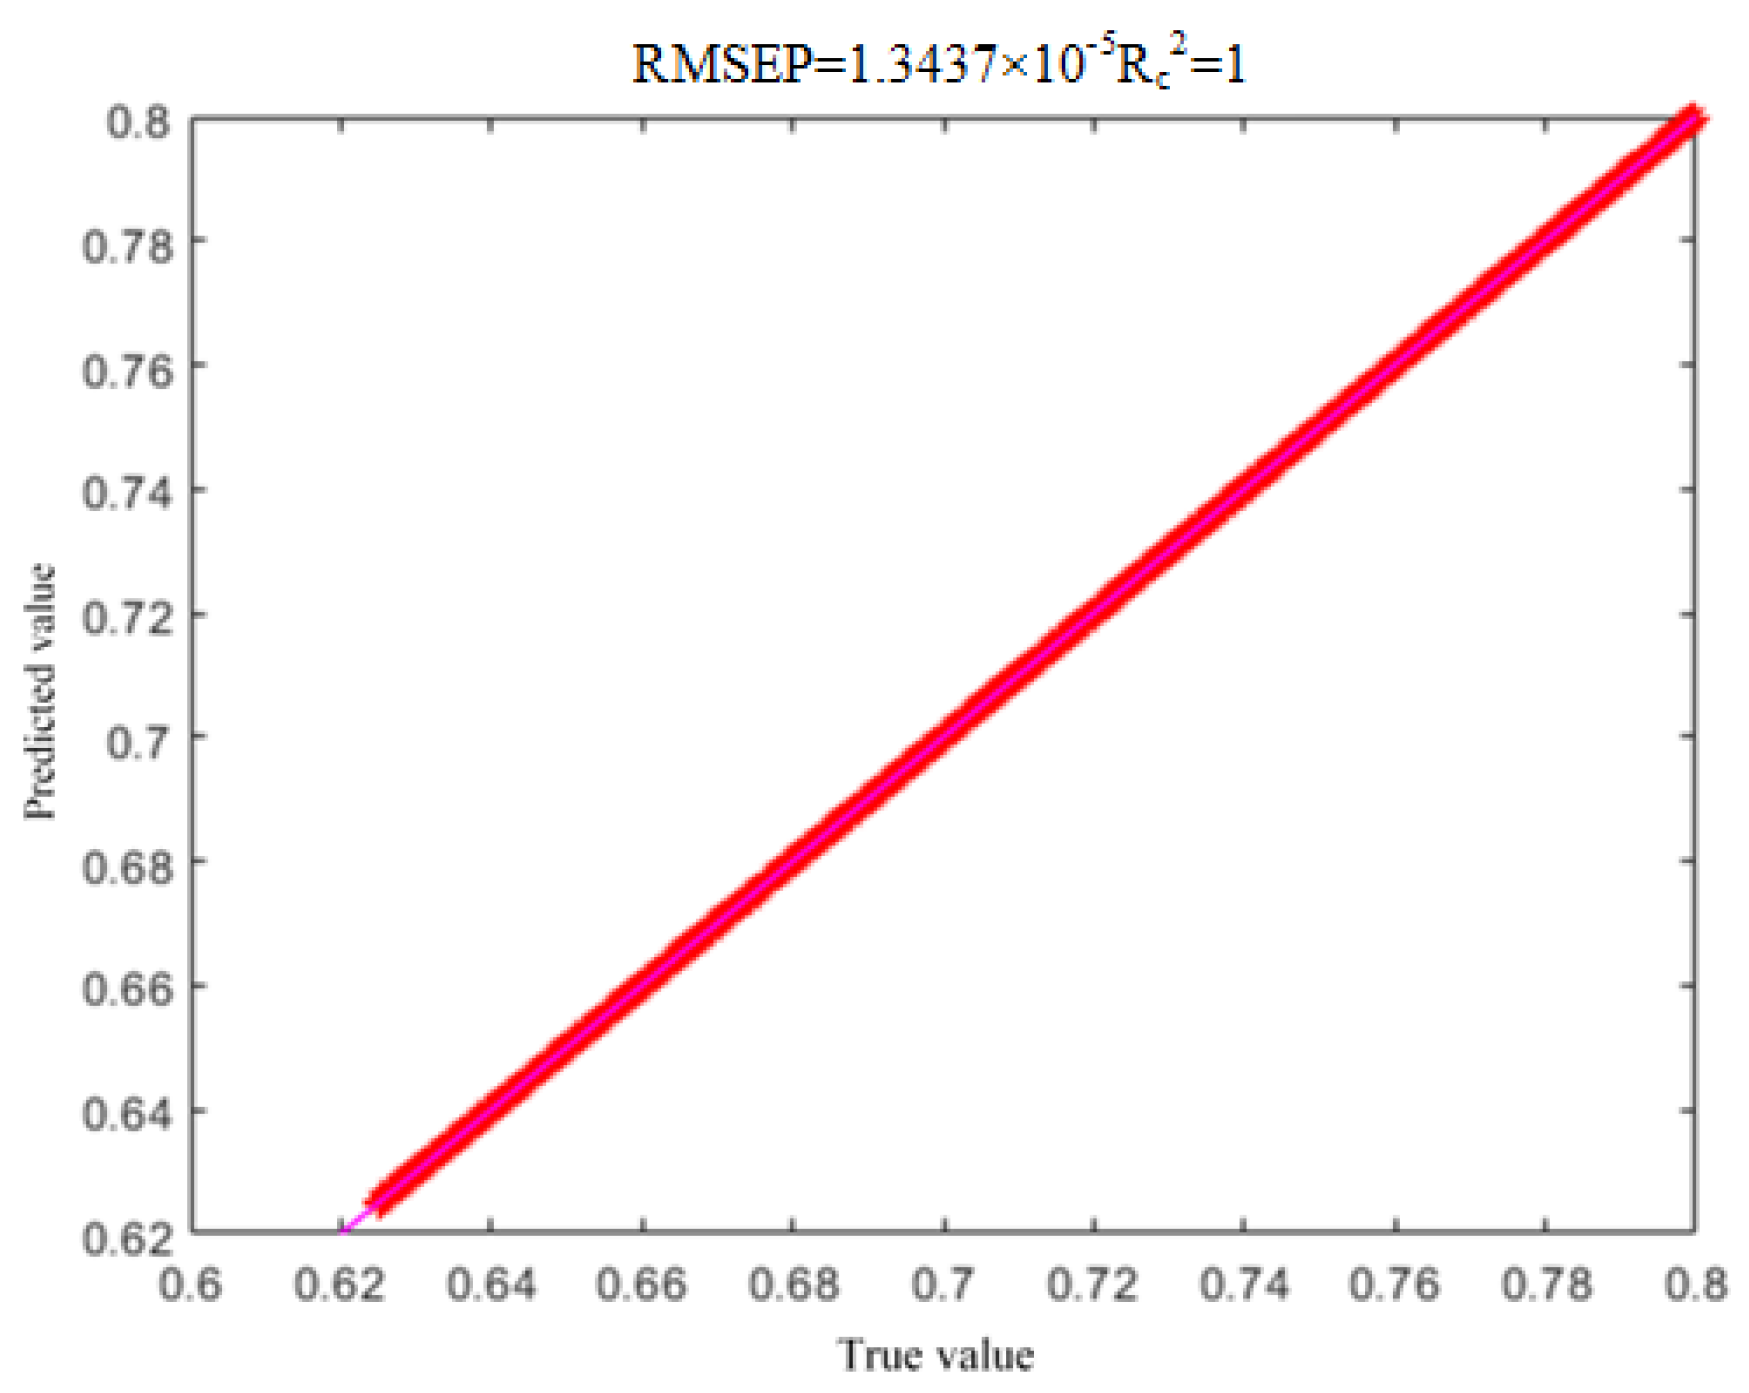
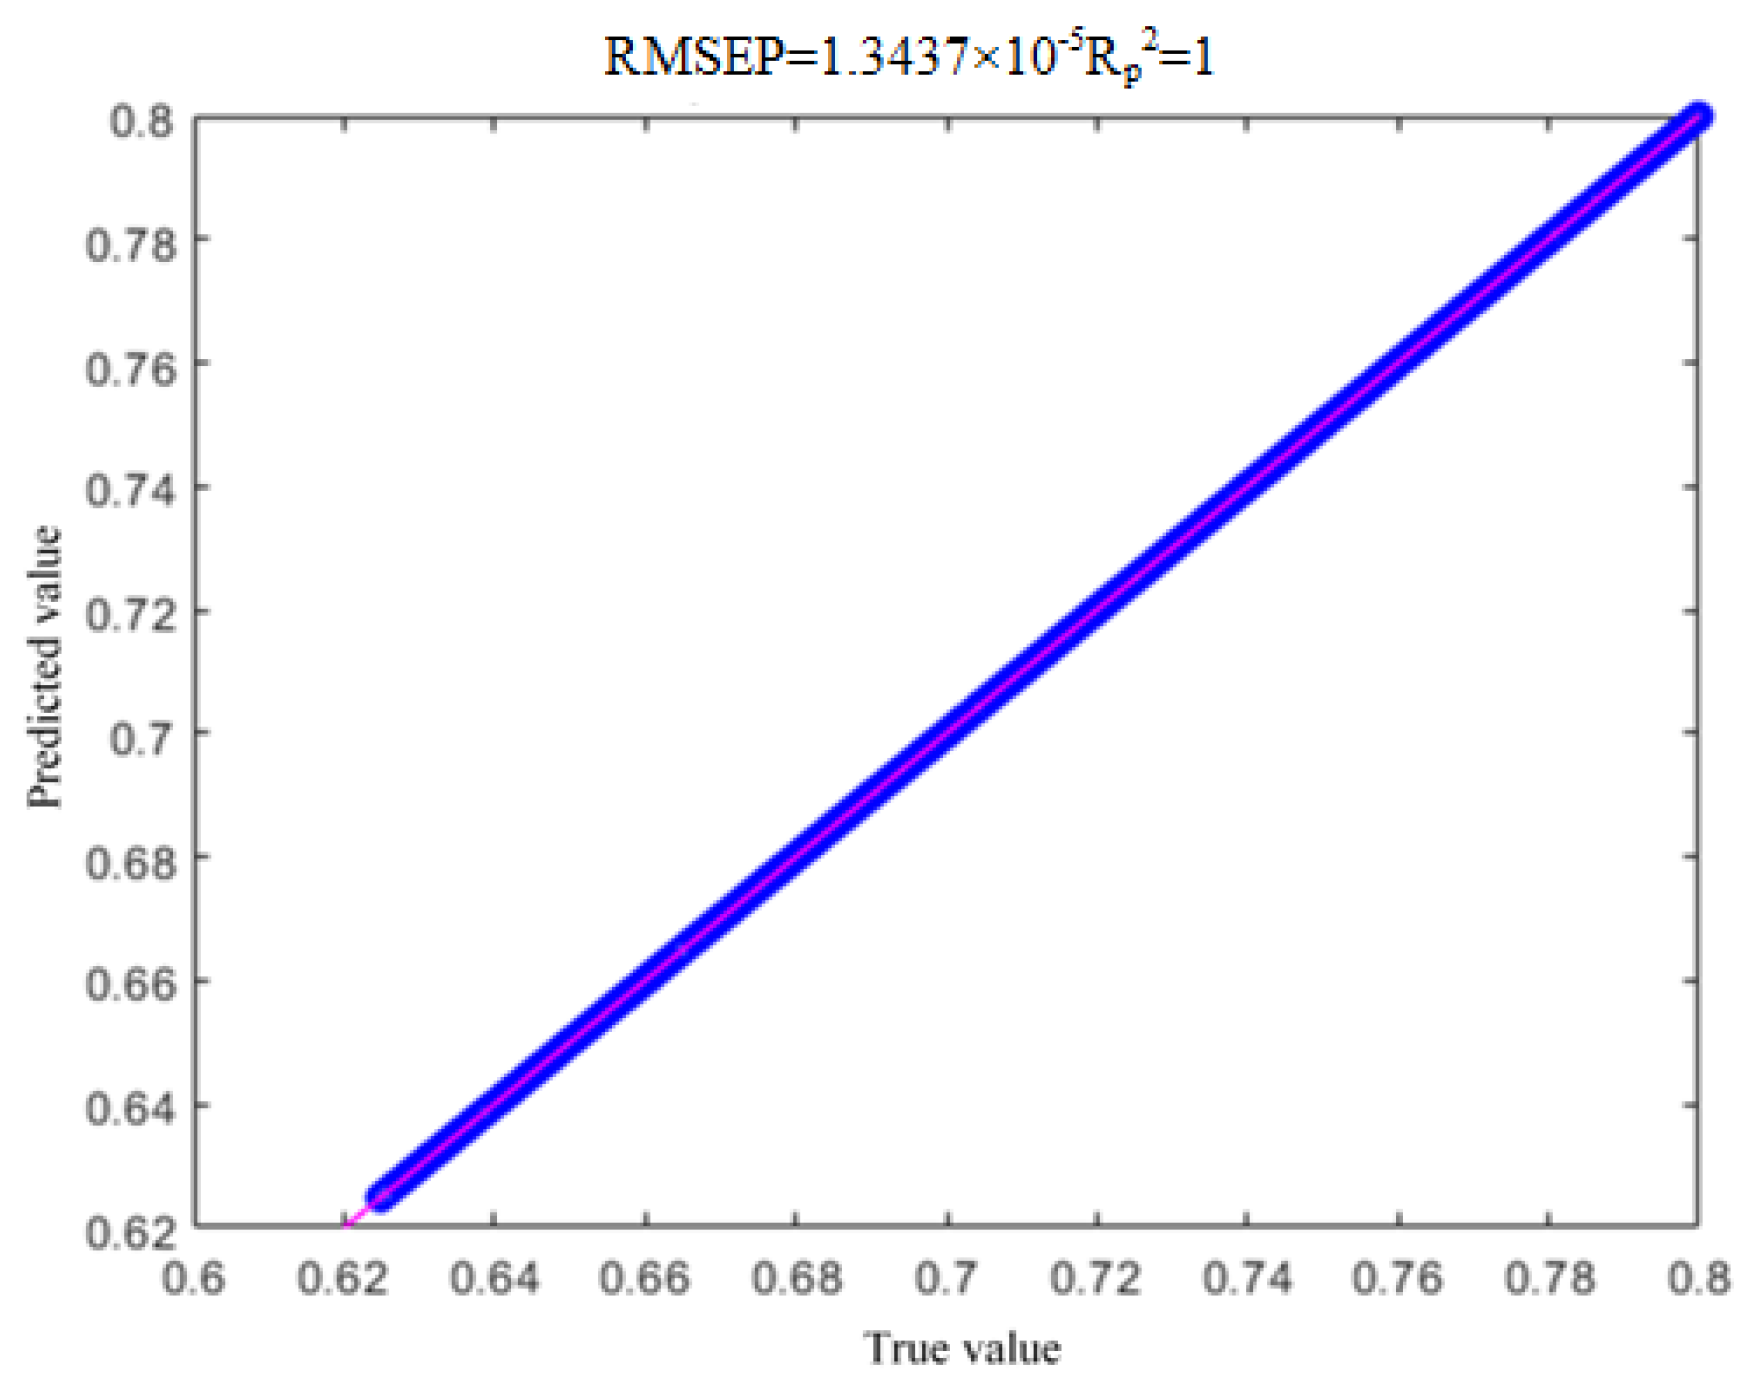
From
Figure 13 and
Figure 14, it can be seen that both the predicted values of the real dataset and the training dataset can achieve a good correspondence with the true values, and there is no overfitting phenomenon.
As can be seen from
Table 8, for the SOC data of lithium iron phosphate batteries after being trained by SAO-LSTM, the Root Mean Squared Error (RMSE) is reduced by 0.39% compared with the original test dataset, the coefficient of determination (R2) is 1 for all cases, and the Mean Absolute Error (MAE) is reduced by 0.31%. The model has extremely strong generalization ability, effectively avoiding the overfitting phenomenon.
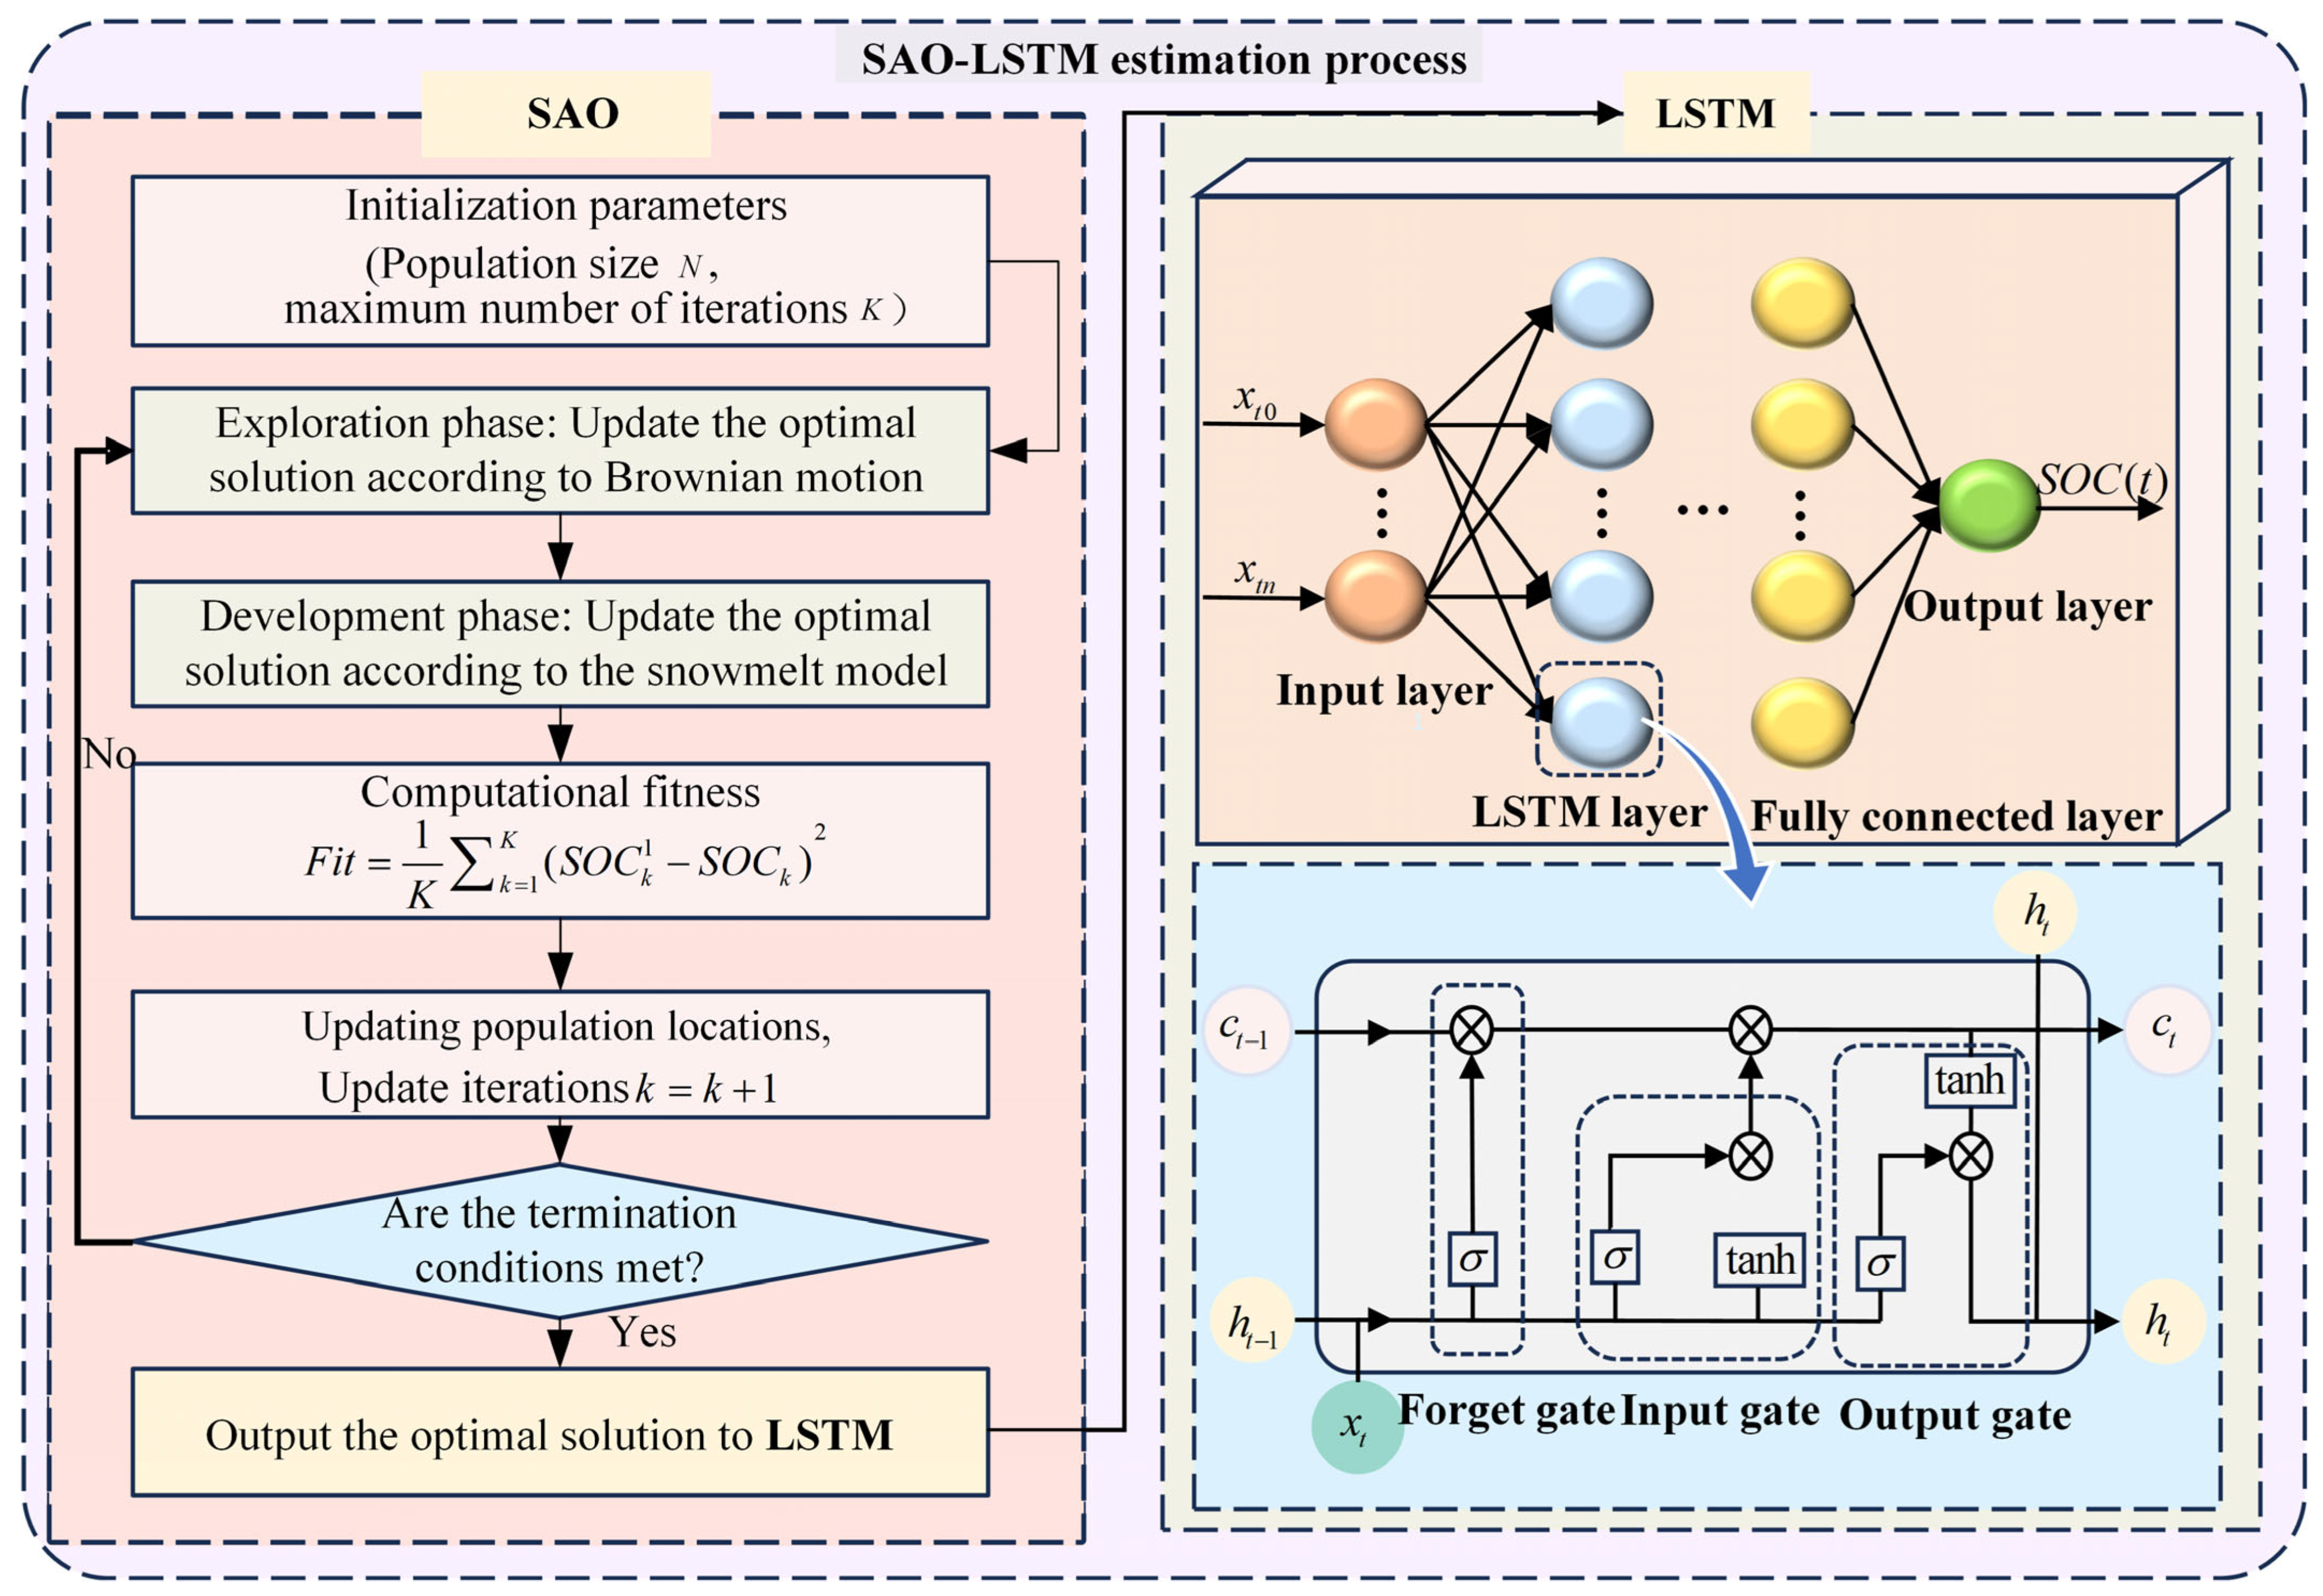
This study employs the SAO algorithm to dynamically adjust temperature-dependent parameters (R0, R1, C1, R2, C2) in a second-order RC equivalent circuit model. By real-time recalibration of these parameters based on ambient operating temperature, the method compensates for nonlinear temperature effects on battery polarization dynamics. Simultaneously, an LSTM network is integrated to capture long-term dependencies in voltage-current sequences through its gating mechanisms, with temperature features fused into the input layer. The research results of this paper provide new ideas and methods for the SOC estimation of lithium iron phosphate batteries in hybrid tractors. However, there are still some issues worthy of further discussion. This paper mainly focuses on the influence of temperature on the SOC estimation of lithium iron phosphate batteries. However, battery aging will also lead to changes in model parameters. In the future, a multi-state joint estimation model can be constructed by combining the health state estimation of lithium iron phosphate batteries. At the same time, this paper mainly conducts SOC estimation based on current, voltage, and temperature data. In the future, by combining the battery health state estimation, a multi-state joint estimation model can be constructed, with the expectation of further improving the accuracy of the SOC estimation of lithium iron phosphate batteries [
29].


 ,
, 
