Article

Evaluating the Role of Vehicle-Integrated Photovoltaic (VIPV) Systems in a Disaster Context

Department of Engineering, University of Palermo, 90128 Palermo, Italy
*
Author to whom correspondence should be addressed.
World Electr. Veh. J. 2025, 16(4), 190; https://doi.org/10.3390/wevj16040190
Submission received: 28 January 2025 / Revised: 8 March 2025 / Accepted: 21 March 2025 / Published: 23 March 2025
(This article belongs to the Special Issue Power and Energy Systems for E-mobility)

Abstract

:
This study focuses on Vehicle-Integrated Photovoltaic (VIPV) strategy adopted as an energy supply vector in disaster scenarios. As a matter of fact, energy supply may be a very critical issue in a disaster context, when grid networks may be damaged. Emergency vehicles, including ambulances and trucks, as well as mobile units such as containers and operating rooms, can be equipped with photovoltaic modules and can serve as mobile emergency energy sources, supporting both vehicle operations and disaster relief efforts. A methodology was developed to estimate energy production under unpredictable disaster conditions, by adapting existing VIPV simulation approaches. Obtained results show that VIPV strategy, even under minimal daily energy generation, can be a useful aid for disaster resilience and emergency prompt response. Ambulance performance, analyzed for worst-case scenarios (e.g., December), shows that they can power medical devices for 1 to 15 h daily. Additionally, the ambulance can generate up to 2 M W h annually, reducing CO2 emissions by up to 0.5 tons. In optimal configurations, mobile operating rooms can generate up to 120 times the daily energy demand for medical devices.

1. Introduction

Disasters, whether natural or human-made, may severely disrupt critical infrastructure, with power outages being one of the most significant consequences [1]. The loss of electricity affects not only homes and businesses but also emergency response efforts, where uninterrupted power is essential for medical services, rescue operations, and communication systems [2]. Restoring power can take hours or even days, making energy resilience a crucial aspect of disaster management [3]. Ensuring a stable power supply in such scenarios requires an efficient prioritization of energy demands, optimal use of available resources, and the integration of renewable energy technologies to reduce reliance on conventional fuel-based systems [4,5].
Several studies have explored strategies to enhance energy resilience in disaster situations. For example, Candan et al. [6] proposed an algorithm that improves grid resilience by classifying household appliances based on priority levels and integrating electric vehicles (EVs) and localized PV generation. Their work demonstrated that EV batteries could serve as mobile energy storage units, ensuring continuous power for critical loads while optimizing overall energy use. Vaziri Rad et al. [7] investigated standalone renewable energy solutions for post-disaster environments, identifying optimal configurations of PV systems, battery storage, and hybrid generators to supply electricity for residential units and healthcare facilities. Their methodology incorporated a multi-criteria decision-making framework to balance reliability, cost-effectiveness, and sustainability, emphasizing the necessity of hybrid solutions to compensate for intermittent solar and wind energy. Additionally, Saboori [8] introduced a mobile battery storage approach, where transportable energy storage systems were strategically deployed using trucks and trains to supply power to affected areas. Their optimization model considered transport logistics, charging station placement, and energy transfer efficiency, demonstrating that mobile storage could significantly enhance grid flexibility and resilience in disaster-stricken locations.
While these studies provide valuable solutions, they also present challenges. Stationary PV systems may become damaged in disasters such as earthquakes, reducing their effectiveness [9]. Mobile battery storage, while flexible, is constrained by transport logistics and limited capacity [10,11]. These limitations highlight the need for an alternative energy solution that is both mobile and self-sufficient [12]. A promising approach may be a Vehicle-Integrated Photovoltaic (VIPV) strategy, which integrates PV cells directly into vehicles, allowing them to generate and store renewable energy while maintaining mobility [13]. Unlike conventional battery electric vehicles (BEVs) or stationary energy storage systems, VIPV-equipped vehicles can act, even if in a limited range of energy production due to a limited extension of available surfaces, as self-sustaining electric power sources, providing energy for critical applications such as emergency medical equipment, communication systems, and temporary shelters, without relying on external infrastructure [14,15].
Some existing studies have explored the use of PV-equipped vehicles in disaster scenarios or emergency response. The FIVE project [16] demonstrated how integrating PV panels into emergency medical vehicles could reduce dependence on fossil fuels and enhance operational efficiency. Hasan et al. [17] proposed a specialized ‘water ambulance’ for remote areas, incorporating an intelligent energy management unit to ensure continuous power supply for onboard medical equipment. Araki et al. [18] used Monte Carlo simulations to assess the effectiveness of PV-equipped vehicles in supplying power to temporary disaster stations, although their focus remained on stationary applications rather than the mobile nature of emergency vehicles.
So, the authors find that research on the potential of VIPV in disaster scenarios remains limited. Additionally, many studies that propose energy solutions for disaster response overlook the role of VIPV. This omission is particularly significant because while some studies suggest using EVs as mobile energy storage units, they neglect the fact that VIPV-equipped vehicles can serve both as mobile storage and as self-sustaining energy generation sources [19,20]. Furthermore, there is a lack of methodologies specifically designed to assess the potential of VIPV in disaster scenarios. Although various approaches exist for evaluating VIPV system performance, they often fail to account for the unpredictable nature of disasters, where vehicle routes and operational conditions vary significantly [21,22,23,24,25]. This makes simulation and energy estimation challenging. To address these gaps, this study adapts existing methodologies to incorporate the dynamic and uncertain conditions of disaster response. Additionally, we conduct a sensitivity analysis to evaluate the impact of key factors such as geographic location and vehicle movement on VIPV performance, providing a more comprehensive understanding of its potential applications in an emergency scenario.
We focus on integrating solar cells into emergency vehicles to supply their required energy or to power vital medical devices within mobile care units. Two types of emergency vehicles are investigated: ambulances and trucks, each evaluated under different operational scenarios. Ambulances are analyzed in both mobile and stationary conditions to determine their ability to supply power for medical equipment while transporting patients or providing on-site care. Similarly, trucks are examined under multiple-use cases, including their role in transporting aid to disaster zones and their potential to serve as mobile medical units or containerized operating rooms. In stationary mode, the possibility of enhancing energy production through solar tracking systems [26], evaluating the benefits of one-axis and two-axis tracking mechanisms, has been also investigated. Furthermore, this study includes a geographical analysis by evaluating the performance of VIPV systems across three Italian cities, Palermo, Rome, and Milan, representing different latitudes and solar radiation levels.
Critical loads for essential systems, such as medical equipment, have been identified and their energy demands are compared with the energy generated by the VIPV systems to ensure the uninterrupted functionality of critical systems. Additionally, we assume that trucks and ambulances utilize their existing onboard batteries to support both vehicle operations and the VIPV system. To assess their feasibility, the impact of various working conditions, including operational energy demands and standby charging losses, have been analyzed to determine the energy produced and stored under different scenarios. In contrast, for case studies such as container and mobile operating rooms, which operate in stationary mode, existing methodologies and equations have been adapted for battery sizing to meet their specific energy requirements.
Beyond ensuring energy resilience in disaster response, this study also considers the environmental impact of VIPV adoption. Using grid power emission data [27], the potential CO2 reductions achieved through VIPV-generated electricity compared to conventional grid power and fuel-based generators have been estimated. Although reducing emissions is a secondary concern in emergency scenarios, it underscores the broader sustainability advantages of integrating solar energy into mobile applications.
By addressing energy resilience, operational optimization, and environmental impact, this research contributes to the practical implementation of VIPV technology in emergency response applications. Our findings may offer valuable insights into how VIPV-equipped vehicles can improve disaster management by providing a sustainable, autonomous, and mobile, even if limited, energy solution.
The rest of this paper is organized as follows: First, in Section 2, the fundamental equations for the methodology are presented, focusing on solar radiation and performance ratio using general and basic equations. Then, in Section 3, the case studies are introduced, and the governing equations are adapted to the specific conditions of each case study. Finally, in Section 4, the results are analyzed, starting with the obtained energy production and its potential to extend the range of each vehicle. Based on these results, battery sizing for each case study is approached, along with the evaluation of the potential emissions reduction. Additionally, the required energy for vital medical devices is compared with the produced electrical energy to assess the feasibility of sustaining critical healthcare operations.

2. Methodology

Generally, the amount of power produced by a fixed photovoltaic system W P V , can be calculated using Equation (1) [28]:
W P V = η · H · A · P R
where η represents the efficiency of PV system, H ( W · m 2 ) is irradiance, A ( m 2 ) is area, and P R is the performance ratio. In VIPV systems, due to the curvature and complex shape of the vehicle body, PV cells may not entirely cover it. Therefore, by applying a coverage ratio to A in Equation (1), the amount of power produced by a VIPV system W V I P V can be calculated using Equation (2) [29,30]:
W V I P V = η · H · S r · P R
where S r represents the PV coverage area ( m 2 ) and is defined by the following:
S r = α · A
In Equation (3), α represents the percentage of the vehicle’s surface area that is covered by PV cells, while A refers to the area of the specific section of the vehicle (e.g., roof, sides) where PV is installed.

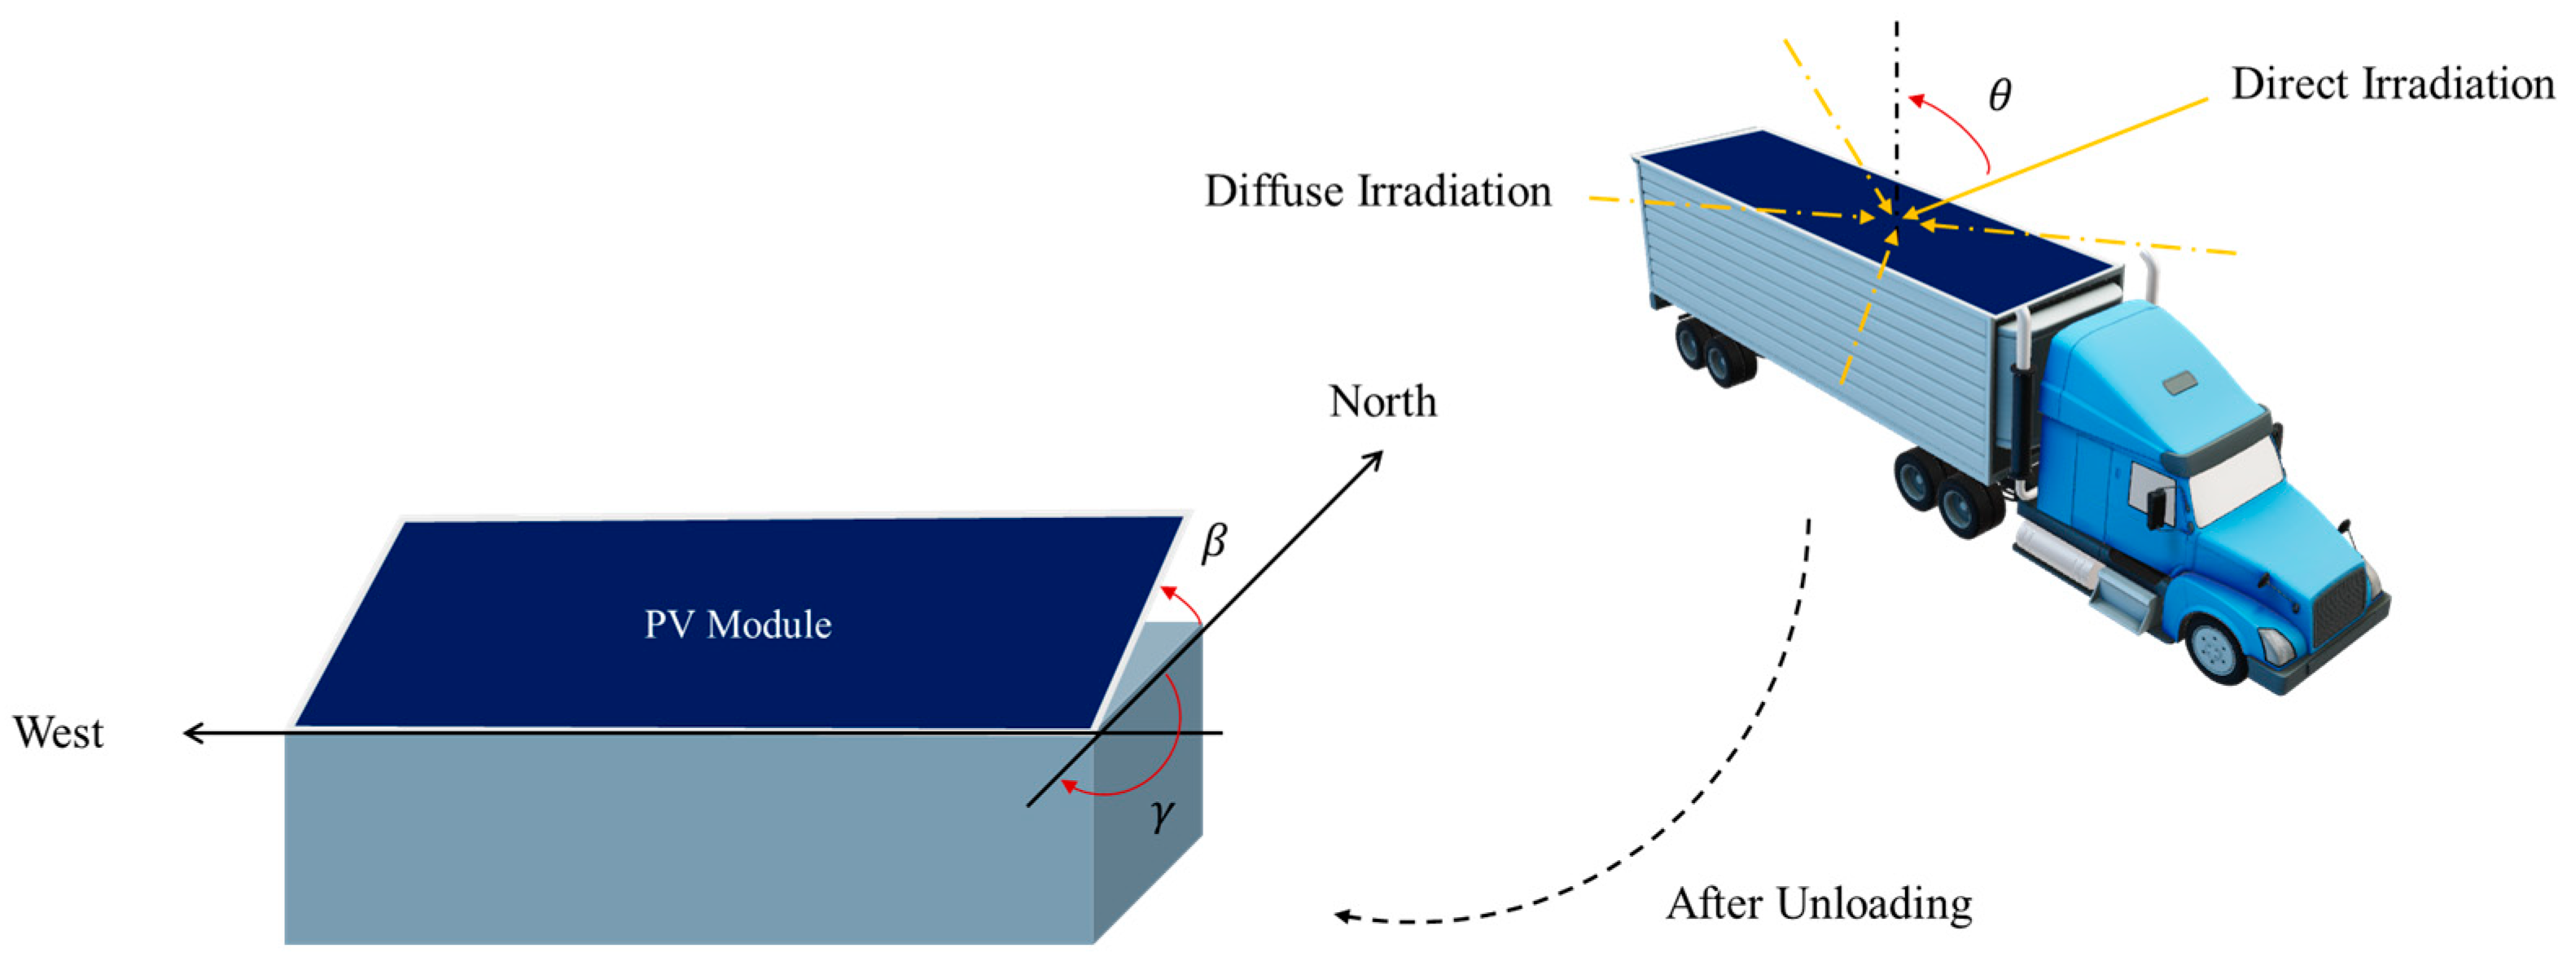
2.1. Solar Irradiance

Solar radiation that reaches the Earth’s surface consists of direct (beam), diffuse, and reflected components. In this study, reflected radiation is neglected, and only direct and diffuse irradiance are considered [31].
H = D H I · ( 180 β 180 ) + D N I · c o s   θ
cos θ = sin δ sin cos β sin δ cos sin β cos γ + cos δ cos cos β cos ω + cos δ sin sin β cos γ cos ω + cos δ sin β sin γ sin ω
where DHI is diffuse horizontal irradiance, DNI is direct normal irradiance, β is inclination of PV panel, θ is angle of incidence of beam radiation on a surface, and γ is azimuth angle (Figure 1).
All irradiance calculations were performed using Meteonorm software [32] and the computed results were used for subsequent analysis. By defining specific conditions, such as zero inclination, single-axis tracking, or dual-axis tracking, the software generated hourly irradiance data for three different Italian cities: Palermo, Rome, and Milan. These cities were selected to represent different geographical locations and latitudes, influencing solar radiation levels. Palermo, located in the south, has a Mediterranean climate characterized by hot, dry summers and mild, wet winters, offering high solar potential. Rome, in central Italy, experiences a temperate climate with balanced seasonal variations, while Milan, in the north, has a humid subtropical climate with colder winters and moderate summers, leading to lower overall irradiance. The monthly average direct normal irradiance (DNI), diffuse horizontal irradiance (DHI), and global horizontal irradiance (GHI) values for Palermo, Rome, and Milan in 2020 [33] are illustrated in Figure 2.
Shading is a critical factor influencing the performance of PV systems, particularly in VIPV applications. In fixed PV systems, shading is typically more manageable, as it can be reduced through careful system design and installation in locations with minimal obstructions. However, in VIPV systems, shading evaluation becomes more complex due to the vehicle’s movement [34]. The shading level varies dynamically, depending on factors such as the vehicle’s mode (e.g., parking or driving), the surrounding environment, and the specific routes taken. In disaster situations, the unpredictability of shading becomes even more pronounced because both the timing and location of the disaster are unknown. While GIS-based methods can estimate shading effects in some cases [35], using them is challenging in disaster scenarios where the environment is highly variable and unpredictable. In these scenarios, shading can result from both typical obstructions (e.g., buildings or trees) and also temporary obstacles, such as debris or damaged infrastructure. Additionally, atmospheric factors such as smoke or dust may further reduce the direct irradiance received by the vehicle’s PV system.
By considering shading as a dynamic loss factor, this work highlights the ability of VIPV systems to provide reliable energy in unpredictable and challenging conditions, emphasizing their relevance for emergency response and disaster recovery applications. The impact of different shading levels (0% to 80%) on energy generation has been investigated. Similar to previous studies [36,37,38,39], shading was modeled as a ratio to account for its impact on direct irradiance. For instance, a shading level of 40% means that the vehicle receives only 60% of the direct irradiance during each hour. This reduction is applied uniformly across all hours, allowing us to evaluate the average effect of shading on energy generation over time.
To maximize solar energy utilization, it is assumed that PV modules operate at their maximum power point (MPP). Although tracking the MPP under partial shading can be challenging, the shading ratio is expected to inherently account for any associated losses. With this assumption, the analysis focuses on modeling peak power output rather than the detailed behavior of the entire PV module, simplifying the evaluation while still providing a reasonable estimation of system performance [36].

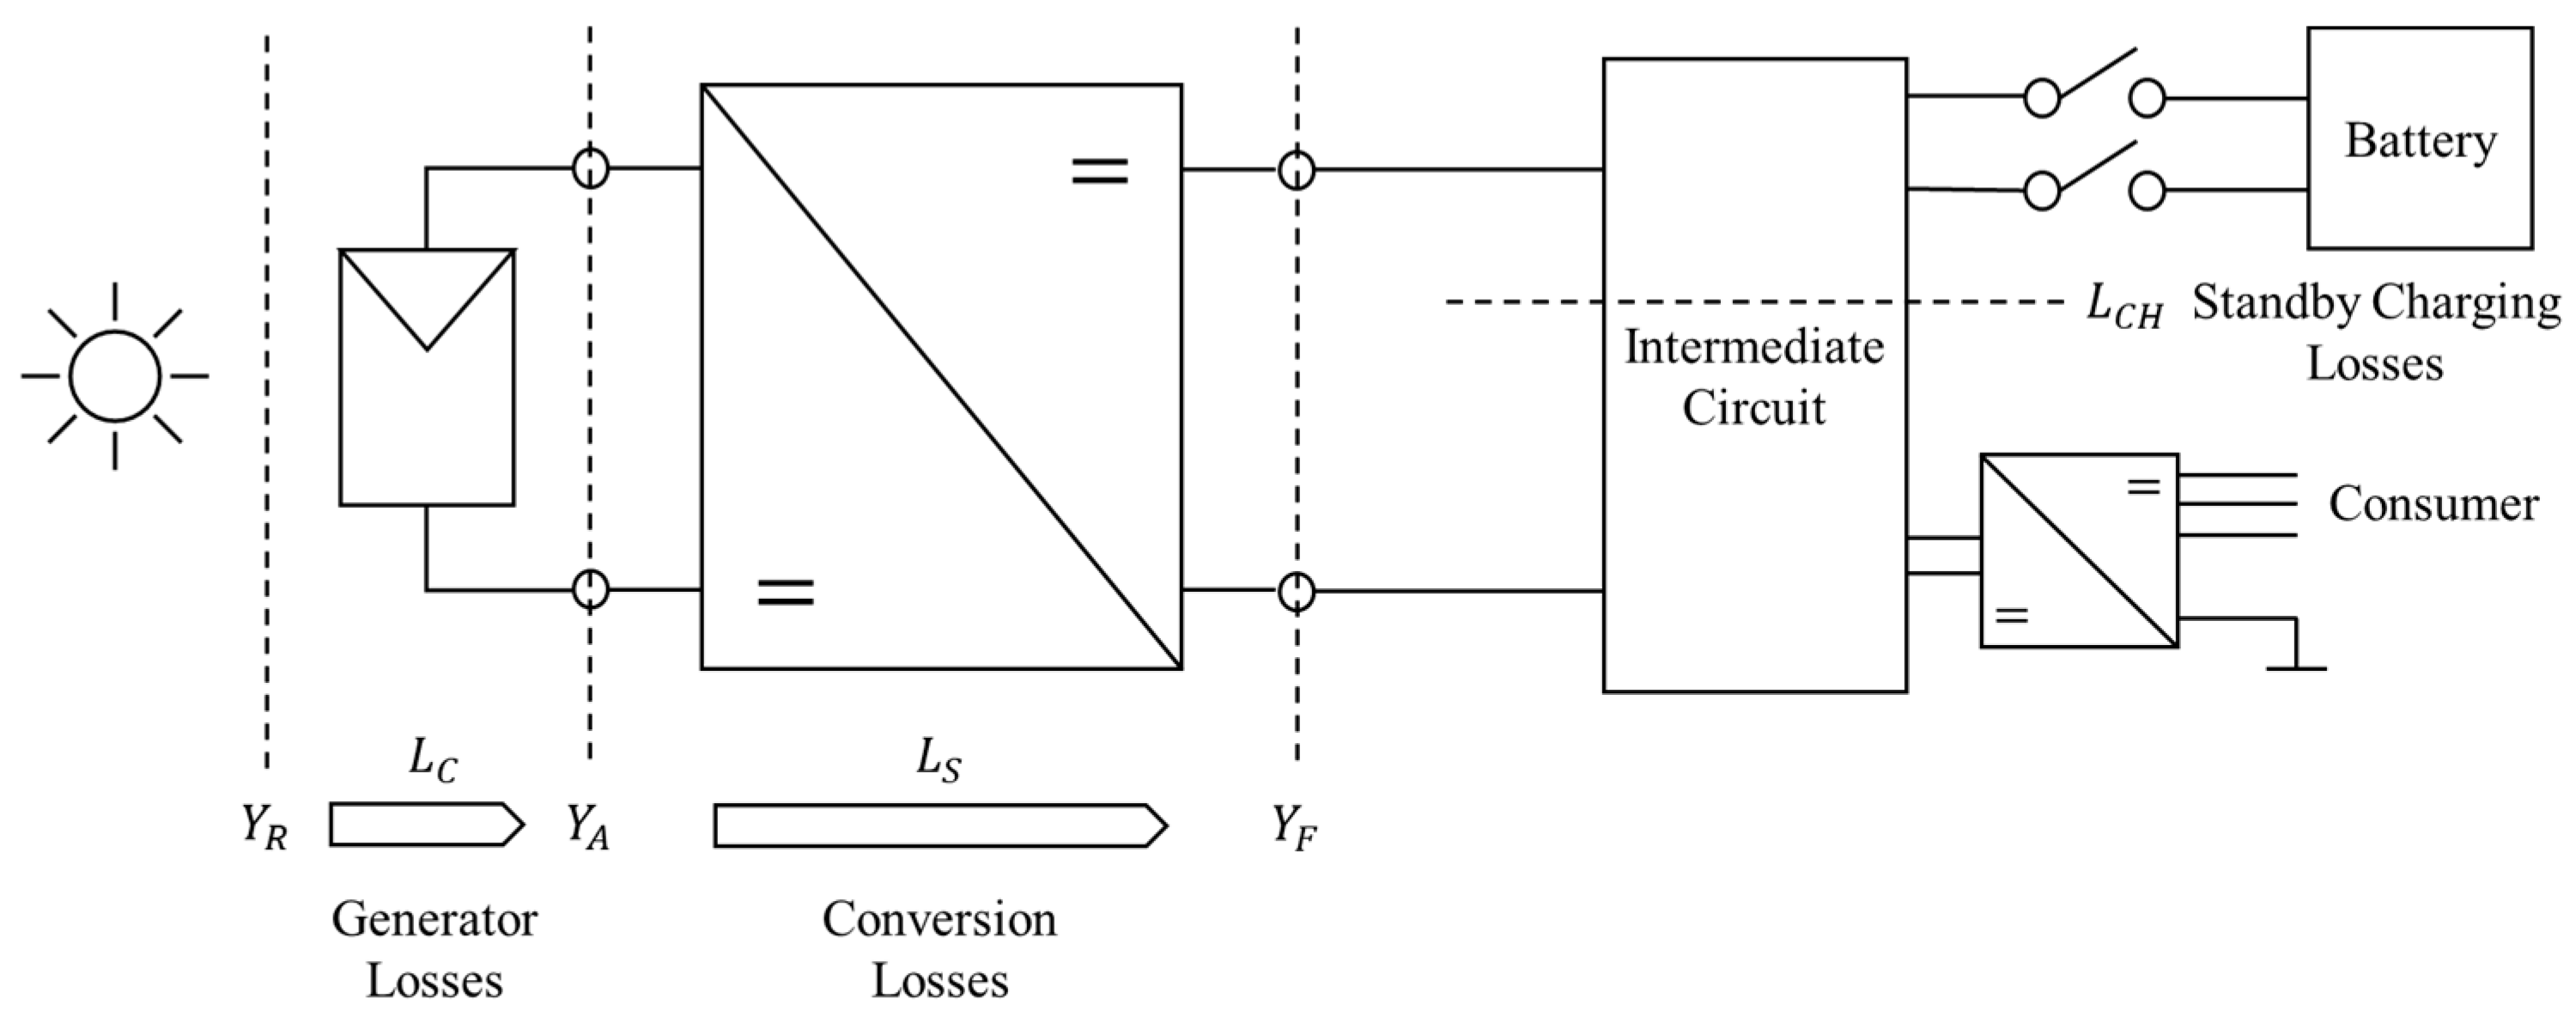
2.2. Performance Ratio

Generally, each photovoltaic system comprises two main parts: energy production and conversion which are shown in Figure 3. However, each part of this diagram can be extended and may have more components based on the system application. This figure illustrates the basic structure where energy production involves receiving solar radiation and converting it into electrical energy through photovoltaic cells. The conversion part includes the electrical components that regulate, store, and distribute the generated electricity to power various applications [40].
The overall performance ratio of the PV system is calculated by multiplying the performance ratios of the energy production and conversion sectors. According to Equation (1), the performance ratio of a photovoltaic system can be defined as Equation (6) [40].
P R = P R G e n e r a t i o n · P R C o n v e r s i o n = Y F Y R
P R G e n e r a t i o n = 1 L C = Y A Y R
P R C o n v e r s i o n = 1 L S = Y F Y A
Y R = G H S T C
Y A = E D C W S T C
Y F = E A C W S T C
By dividing the radiation energy G ( k W h · m 2   p e r   Y e a r ) by H S T C = 1000   W · m 2 [41], the obtained Y R represents the reference yield, which is the number of sun full load hours at the generator level per year. Y A ( k W h · W P 1   p e r   Y e a r ) is array yield and Y F ( k W h · W P 1 per Year) is final yield, representing the number of plant full load hours per year. By dividing the PV energy generation E D C ( k W h   p e r   Y e a r ) and the energy fed into the grid E A C ( k W h   p e r   Y e a r ) by the power of PV panels W S T C ( W P ), Y A and Y F are obtained, respectively.
Generator losses L C can arise from several factors. These include the actual power output of the modules being lower than the values specified in their datasheets, higher module temperatures exceeding 25 °C, and the presence of soiling or partial shading on the modules. Additional causes of losses are mismatches between modules in a string, operating conditions where modules are not functioning at their MPP, and ohmic losses occurring in the direct current (DC) lines. System losses L S are primarily attributed to the inverter, with several factors contributing to these losses. One key factor is the inverter’s efficiency, which is typically less than 100%, leading to energy being dissipated as heat during the conversion process [40].

3. Case Studies

In this study, we analyze four case studies: the WAS E 500 (ambulance), the Tesla Semi (truck), a mobile operating room, and a container that can also be transported by a truck. The dimensions and specifications of these case studies are provided in Table 1 [42,43,44,45]. It is important to note that solar cells are integrated solely into the roofs of all the case studies.
Ambulances are analyzed in both mobile and stationary conditions to assess their ability to supply power for medical equipment while transporting patients or providing on-site care. Trucks are considered under various use cases, including their role in transporting aid to disaster zones. While the truck is modeled in both driving and parking conditions, the mobile operating room and container are modeled in stationary conditions after unloading. This distinction allows us to explore different strategies to enhance energy output, such as the potential use of solar trackers to optimize energy generation.

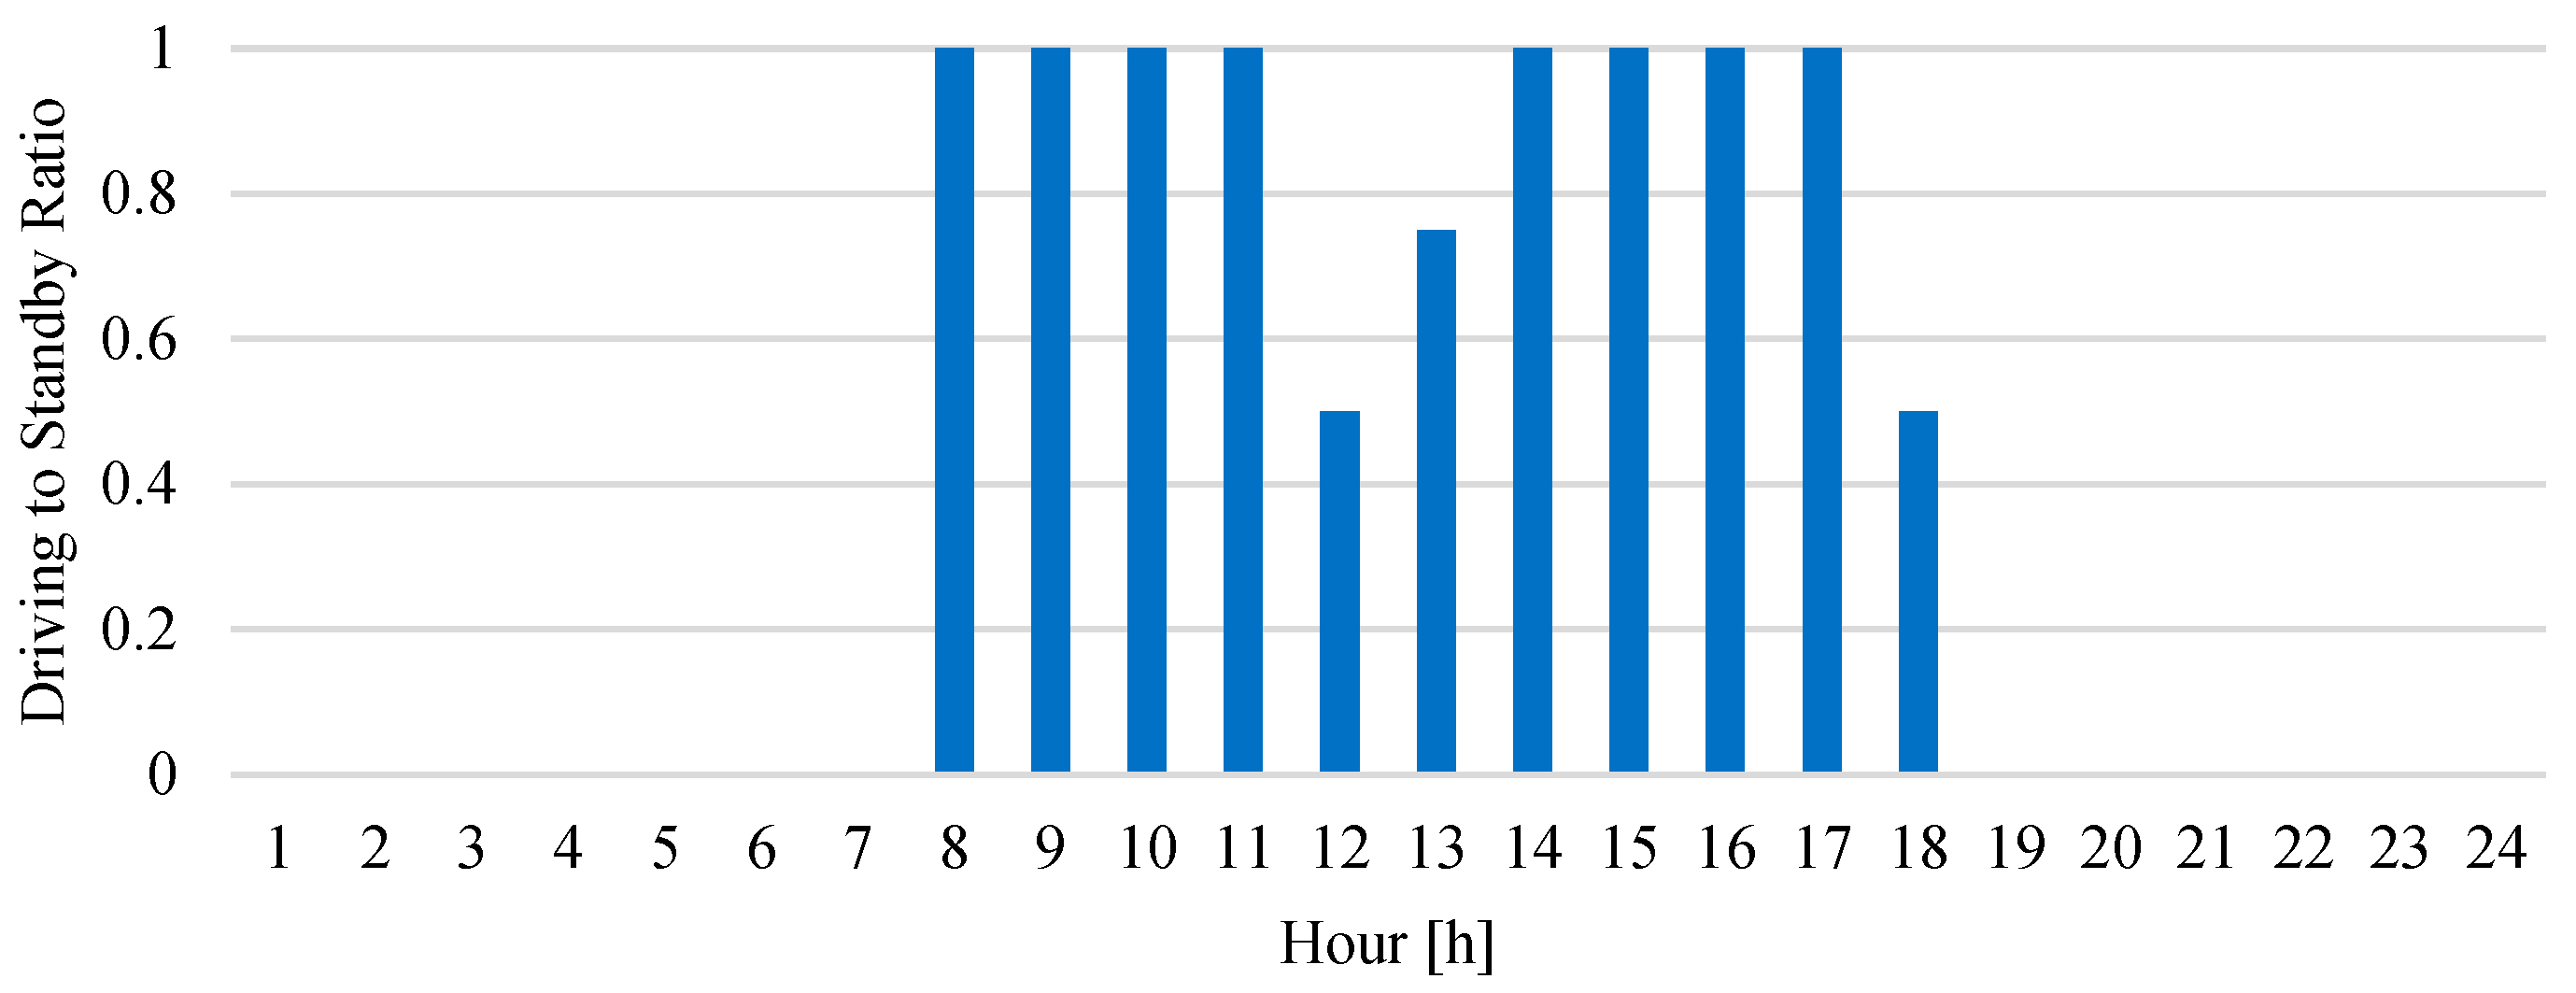
3.1. Ambulance and Truck

Solar cells were integrated into the roofs of ambulances and trucks with β = 0 , and the elevation was assumed to be constant (the road pitch angle was set to zero). The vehicles were considered in both driving and parking operating conditions. In contrast, the container and mobile operating room were positioned in a fixed location, and β was not constant. To calculate energy generation during both driving and standby modes, Equation (2) is adapted as follows [23]:
E V I P V   ,       D r i v i n g = 1 1000 h = 1 8784 η · H h · S r · P R · R   ( k W h   p e r   Y e a r )
E V I P V ,   S t a n d b y = 1 1000 h = 1 8784 η · H h · S r · P R · (   1 R ) L C H   ( k W h   p e r   Y e a r )
E = E V I P V   ,   S t a n d b y + E V I P V ,       D r i v i n g
where L C H ( W ) represents standby charging losses, H h ( W · m 2 ) is hourly irradiance, and R is driving-to-park ratio.
To obtain the system’s performance ratio, as described in Section 2.2, the performance ratios for both the generation and conversion components have to be computed. The performance ratio for the generation component can be calculated as follows [40,41]:
P R G e n e r a t i o n = Y A Y R = E D C W S T C G H S T C = P V O U T G T I o p t a H S T C
where P V O U T ( k W h · k W P 1   p e r   Y e a r ) is specific photovoltaic power output and G T I o p t a ( k W h · m 2   p e r   Y e a r ) is global tilted irradiance at optimum angle. These parameters for each region are available on Global Solar Atlas [46]. In this method, the P V O U T is considered as the array yield ( Y A ) for the respective city, while the G T I o p t a is used to represent the yearly radiation energy ( G ) for that city. Due to Equation (6), to calculate P R C o n v e r s i o n , the L S value is set to 2% [23]. The calculated P R values for Palermo, Rome, and Milan are presented in Table 2.
Temperature significantly impacts PV performance, with higher temperatures typically reducing the efficiency of solar cells [47,48]. In contrast, cooler climates result in a higher P R due to reduced thermal losses. Although Palermo experiences higher irradiance compared to Milan, the P R in Milan remains slightly higher.
In critical emergency response situations, such as those requiring ambulances, it is difficult to apply standard values for operational parameters due to the highly variable nature of the scenarios. Therefore, various driving-to-standby ratios ( R ) were considered to assess their impact on energy production for the WAS E 500 ambulance. The driving-to-standby ratio ranging from 40% to 80% to capture potential operating conditions that ambulances may encounter. For example, when R = 0.4 , this indicates that during each hour, the ambulance is in driving mode for 40% of the time and in standby mode for the remaining 60%. In standby mode, the ambulance is either providing on-site healthcare services or transporting patients to the vehicle.
For the Tesla Semi, R was defined as shown in Figure 4, following the guidelines in [49]. Due to these standards, drivers must take a break (45 min) after each 4.5 hours of driving during the working day.
When an electric vehicle is parked with the ignition turned off, the circuit contactors in the drivetrain battery typically remain open, preventing any charging. To enable solar charging, the vehicle must be placed in an operational state that allows high-voltage battery charging. In this state, the circuit contactors close, activating essential safety monitoring systems such as the Battery Management System (BMS) and Vehicle Management System (VMS). However, this activation introduces standby operational losses, denoted as L C H . Based on the literature review and calculated values of L C H for similar trucks or case studies [23,50], L C H was analyzed through a sensitivity analysis using values of 0, 25, 100, and 700 W . If the vehicle is in standby mode and L C H exceeds the energy generated by the VIPV system in standby mode ( E V I P V   ,   S t a n d b y ), the system is assumed to shut down to prevent battery discharge, leading to E V I P V   ,   S t a n d b y = 0 . The specific yields of the VIPV system, considering L C H , are presented in Figure 5.
The solar range of the vehicle can be calculated as follows:
S o l a r   R a n g e = E · C A v e r a g e   ( k m )
The average consumption C A v e r a g e for the Tesla Semi is assumed to be 1.25 k W h · k m 1 . Additionally, based on the available data for battery capacity and the range of the WAS E 500 ambulance, C A v e r a g e was determined to be 0.58 k W h · k m 1 [42,43].

3.2. Container and Mobile Operating Room

To determine the generated energy by solar cells integrated into the container and mobile operating room, Equation (2) is rewritten as follows:
E = 1 1000 h = 1 8784 η · H h · S r · P R     ( k W h   p e r   Y e a r )
Due to the stationary nature of these systems, similar to other fixed PV installations, various factors such as temperature, maximum power point tracking (MPPT) losses, storage system losses, and converter losses can impact the system’s overall performance ratio. Therefore, rather than using a general performance ratio for the energy generation and conversion segments of the system, specific values for each of these losses, as recommended in [38,39], are detailed in Table 3.
This leads to a DC charging/discharging loss of 2%. Additionally, the DC/DC converter contributes an extra loss of 5%. There is a 5% energy loss due to the lack of MPP tracking. A performance loss of 9% is also likely, attributed to increased temperatures and suboptimal irradiance conditions. By accounting for these losses and calculating the performance ratio for each component, the overall system performance ratio can be determined by multiplying all individual ratios. Notably, based on these values, the performance ratio for the integrated PV system in the container and mobile operating room is estimated to be approximately 81%.

3.3. Solar Module

For various reasons, such as the complex shape of the vehicle body, the impact of the additional weight of the panel on fuel consumption, aerodynamics, etc., the choice of solar panels for VIPV systems requires careful consideration of multiple standards [51]. These considerations necessitate adherence to multiple standards to ensure optimal performance under varying operational conditions. Given the dynamic nature of vehicle use and mobility, the chosen solar panels must demonstrate durability and resilience against diverse weather and climate conditions. Therefore, the type of solar cell selected significantly influences the overall performance and efficiency of the system [52].
Various types of solar cells, including multi-junction, silicon, perovskite, flexible, etc., have been employed in VIPV systems [53]. Due to the impact of environmental factors such as strong winds and aerodynamics, especially in this application, these elements have been carefully considered in selecting an appropriate solar cell. In this study, PV cells from the LE series of SunGold company were selected [54]. The specifications of the chosen solar cell are outlined in Table 4.
These cells incorporate Ethylene Tetrafluoroethylene (ETFE) instead of glass which reduces their weight [55]. Moreover, the 22.7% efficiency of this solar cell type makes it a suitable choice for this application. Solar cells using ETFE can reduce the weight from the typical 10–15 k g · m 2 seen in glass-structured cells to approximately 6 k g · m 2 or even less [56]. Removing glass does not affect their strength or ability to endure harsh conditions. For instance, according to company datasheets, the 100 W solar panel flex is engineered to withstand extreme winds up to 2400 Pa and snow loads up to 5400 Pa [54]. This design ensures that the panels maintain structural integrity and continue to perform efficiently even under severe environmental stress. Existing literature also corroborates these findings, highlighting the panels’ effectiveness and resilience in various adverse conditions [55,57]. Thus, the selection of these specific solar cells addresses the concerns about environmental impact, ensuring that the system remains lightweight, durable, and efficient, even in challenging local conditions.

4. Results

The energy production potential of solar cells integrated into emergency response vehicles has been evaluated by using solar radiation data from 2020.

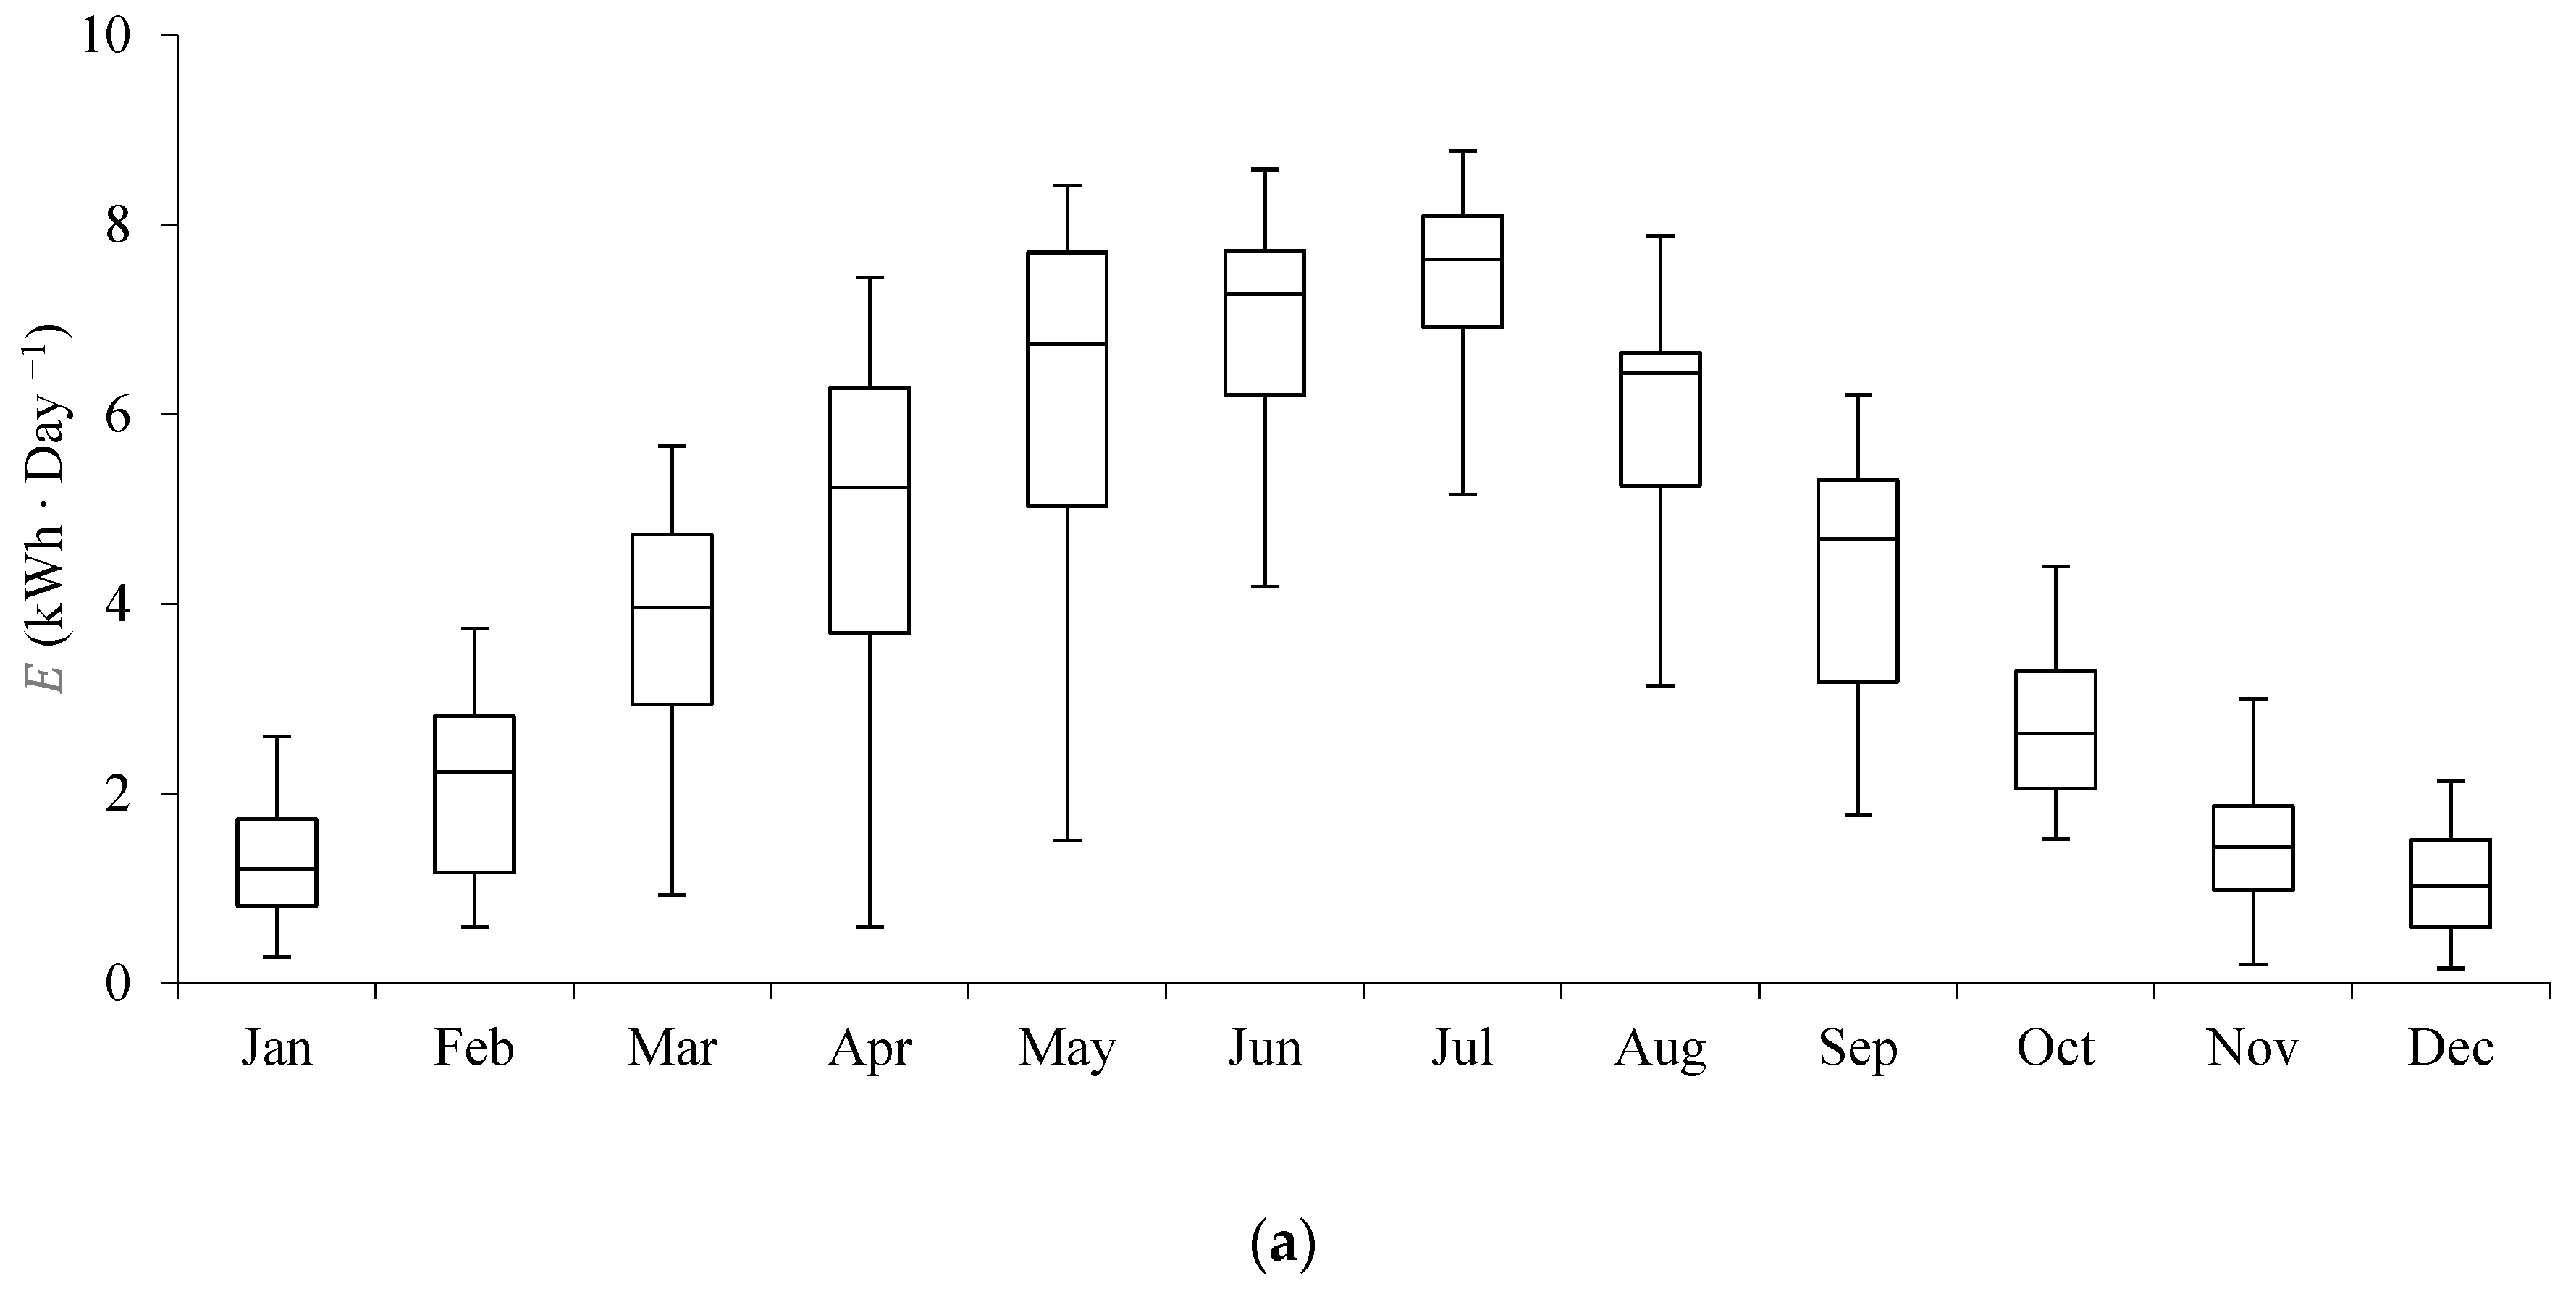
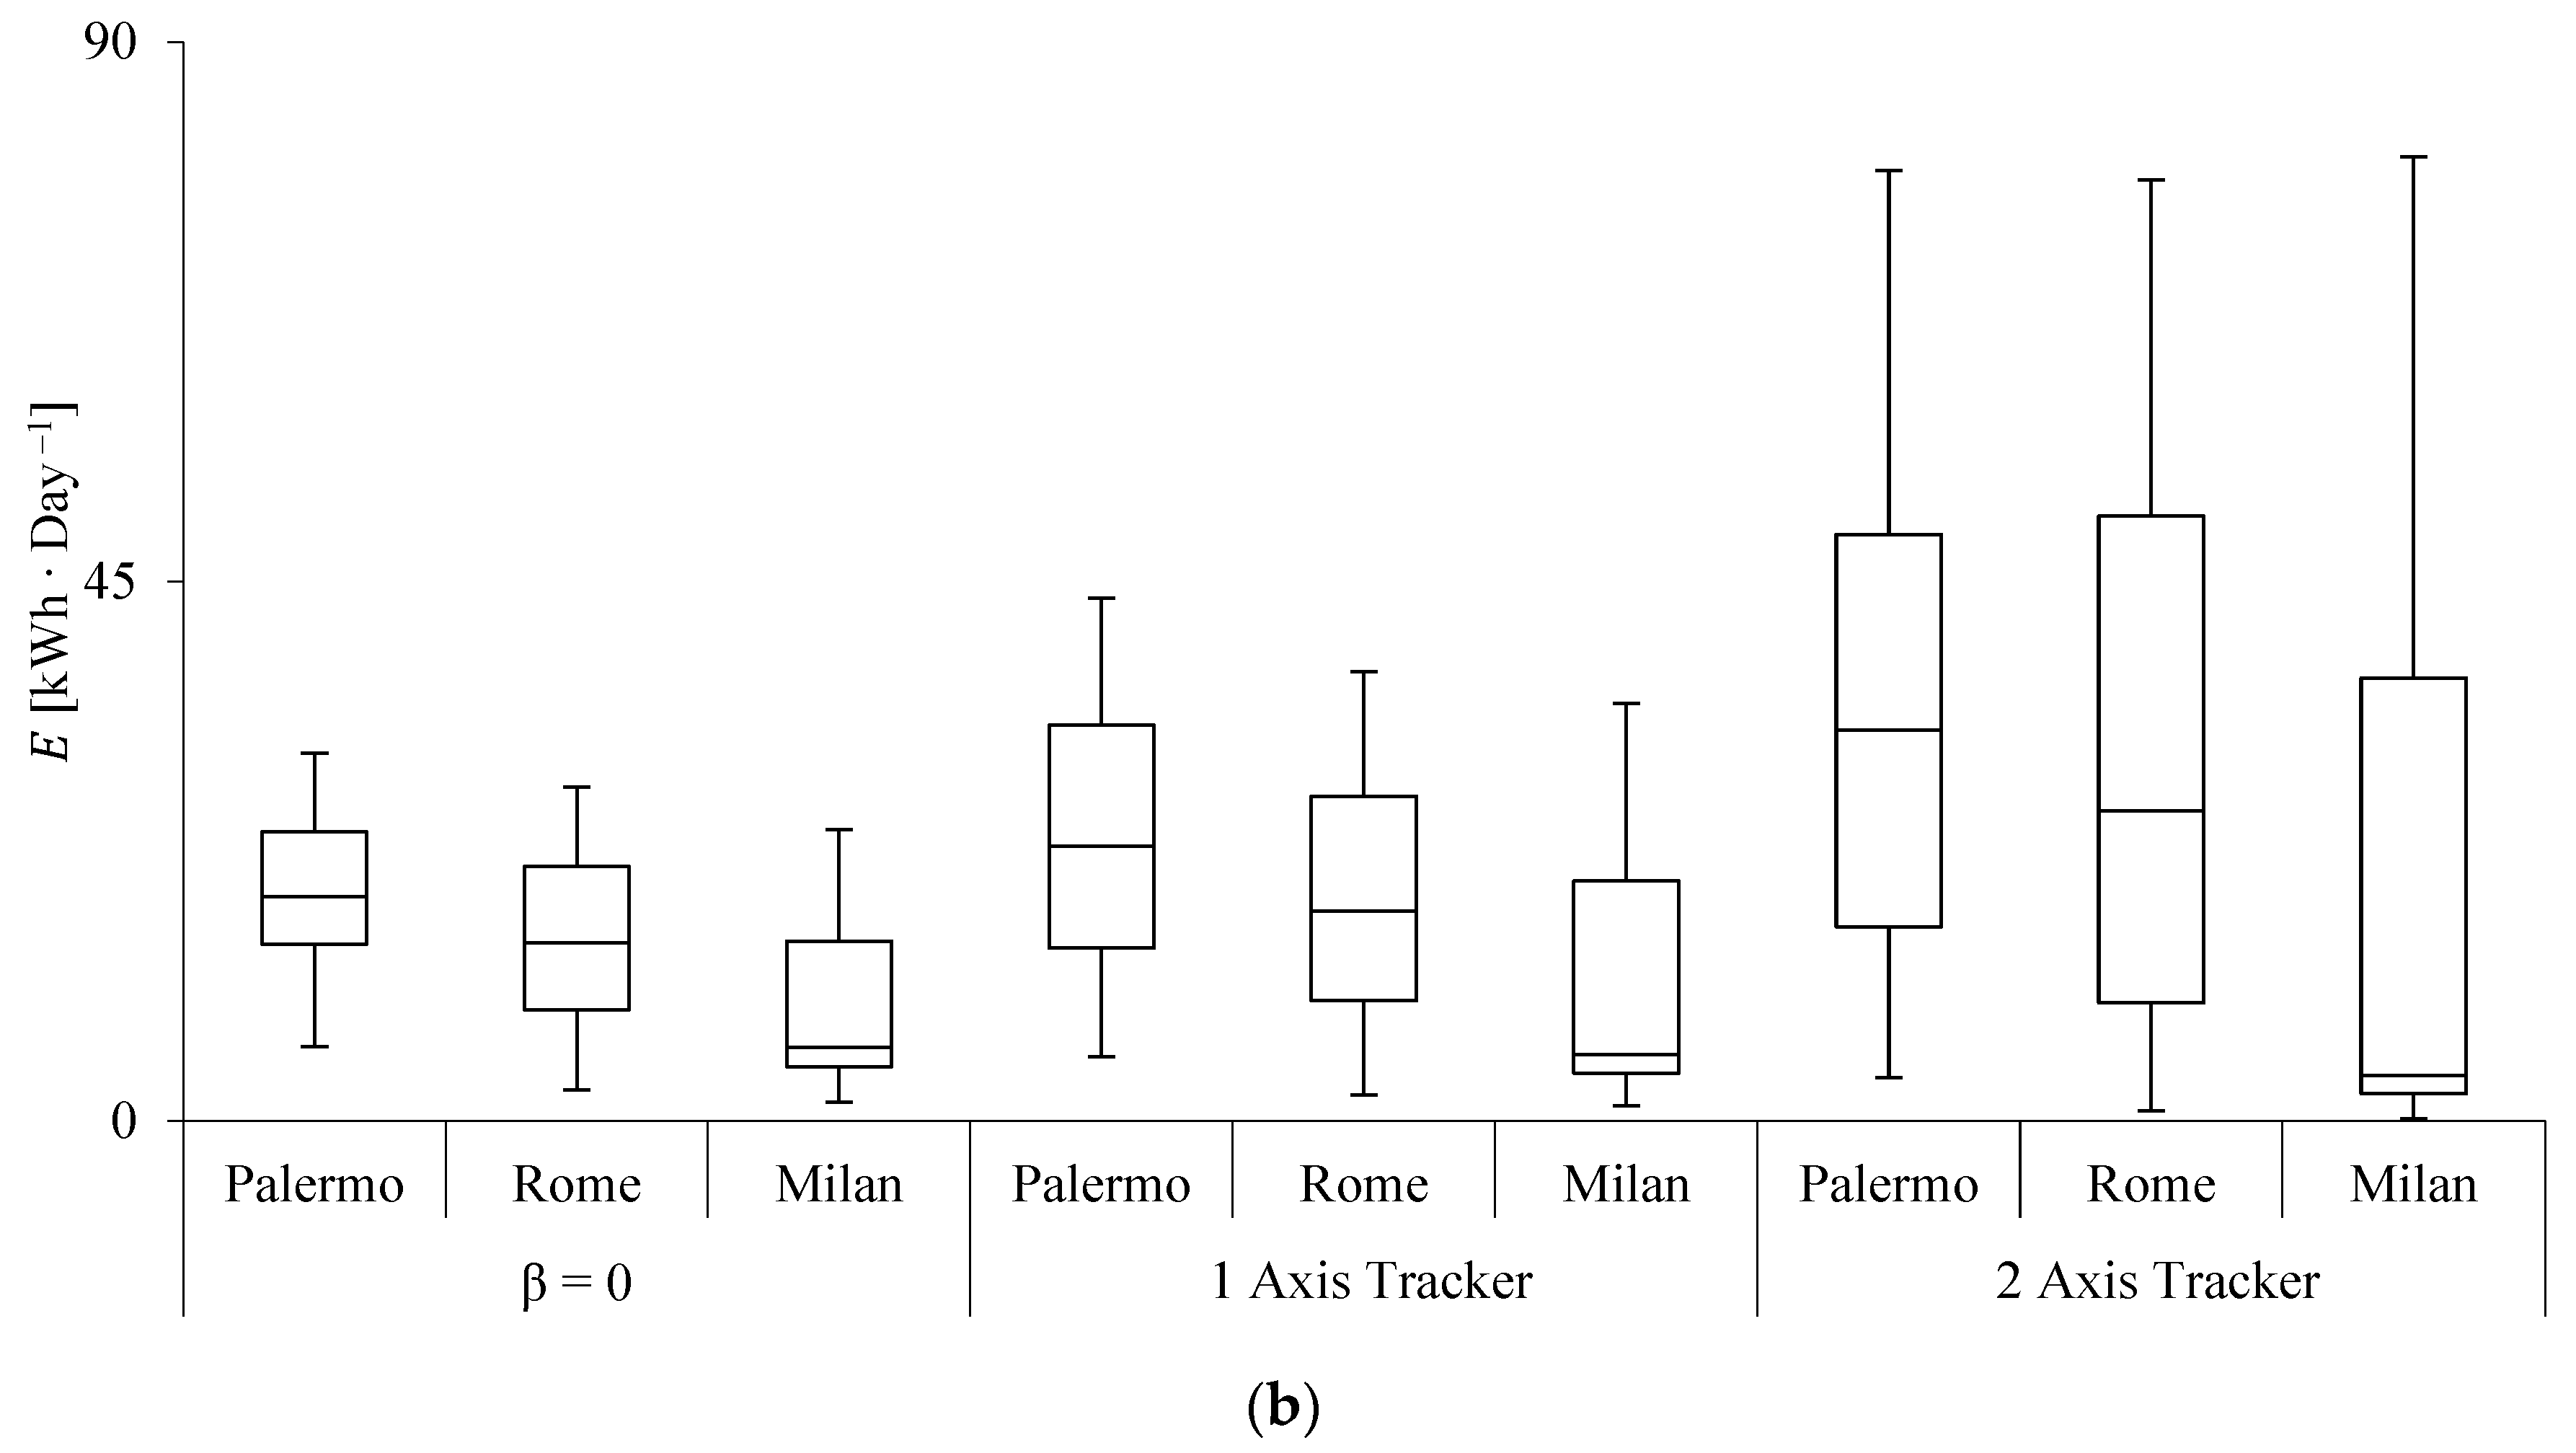
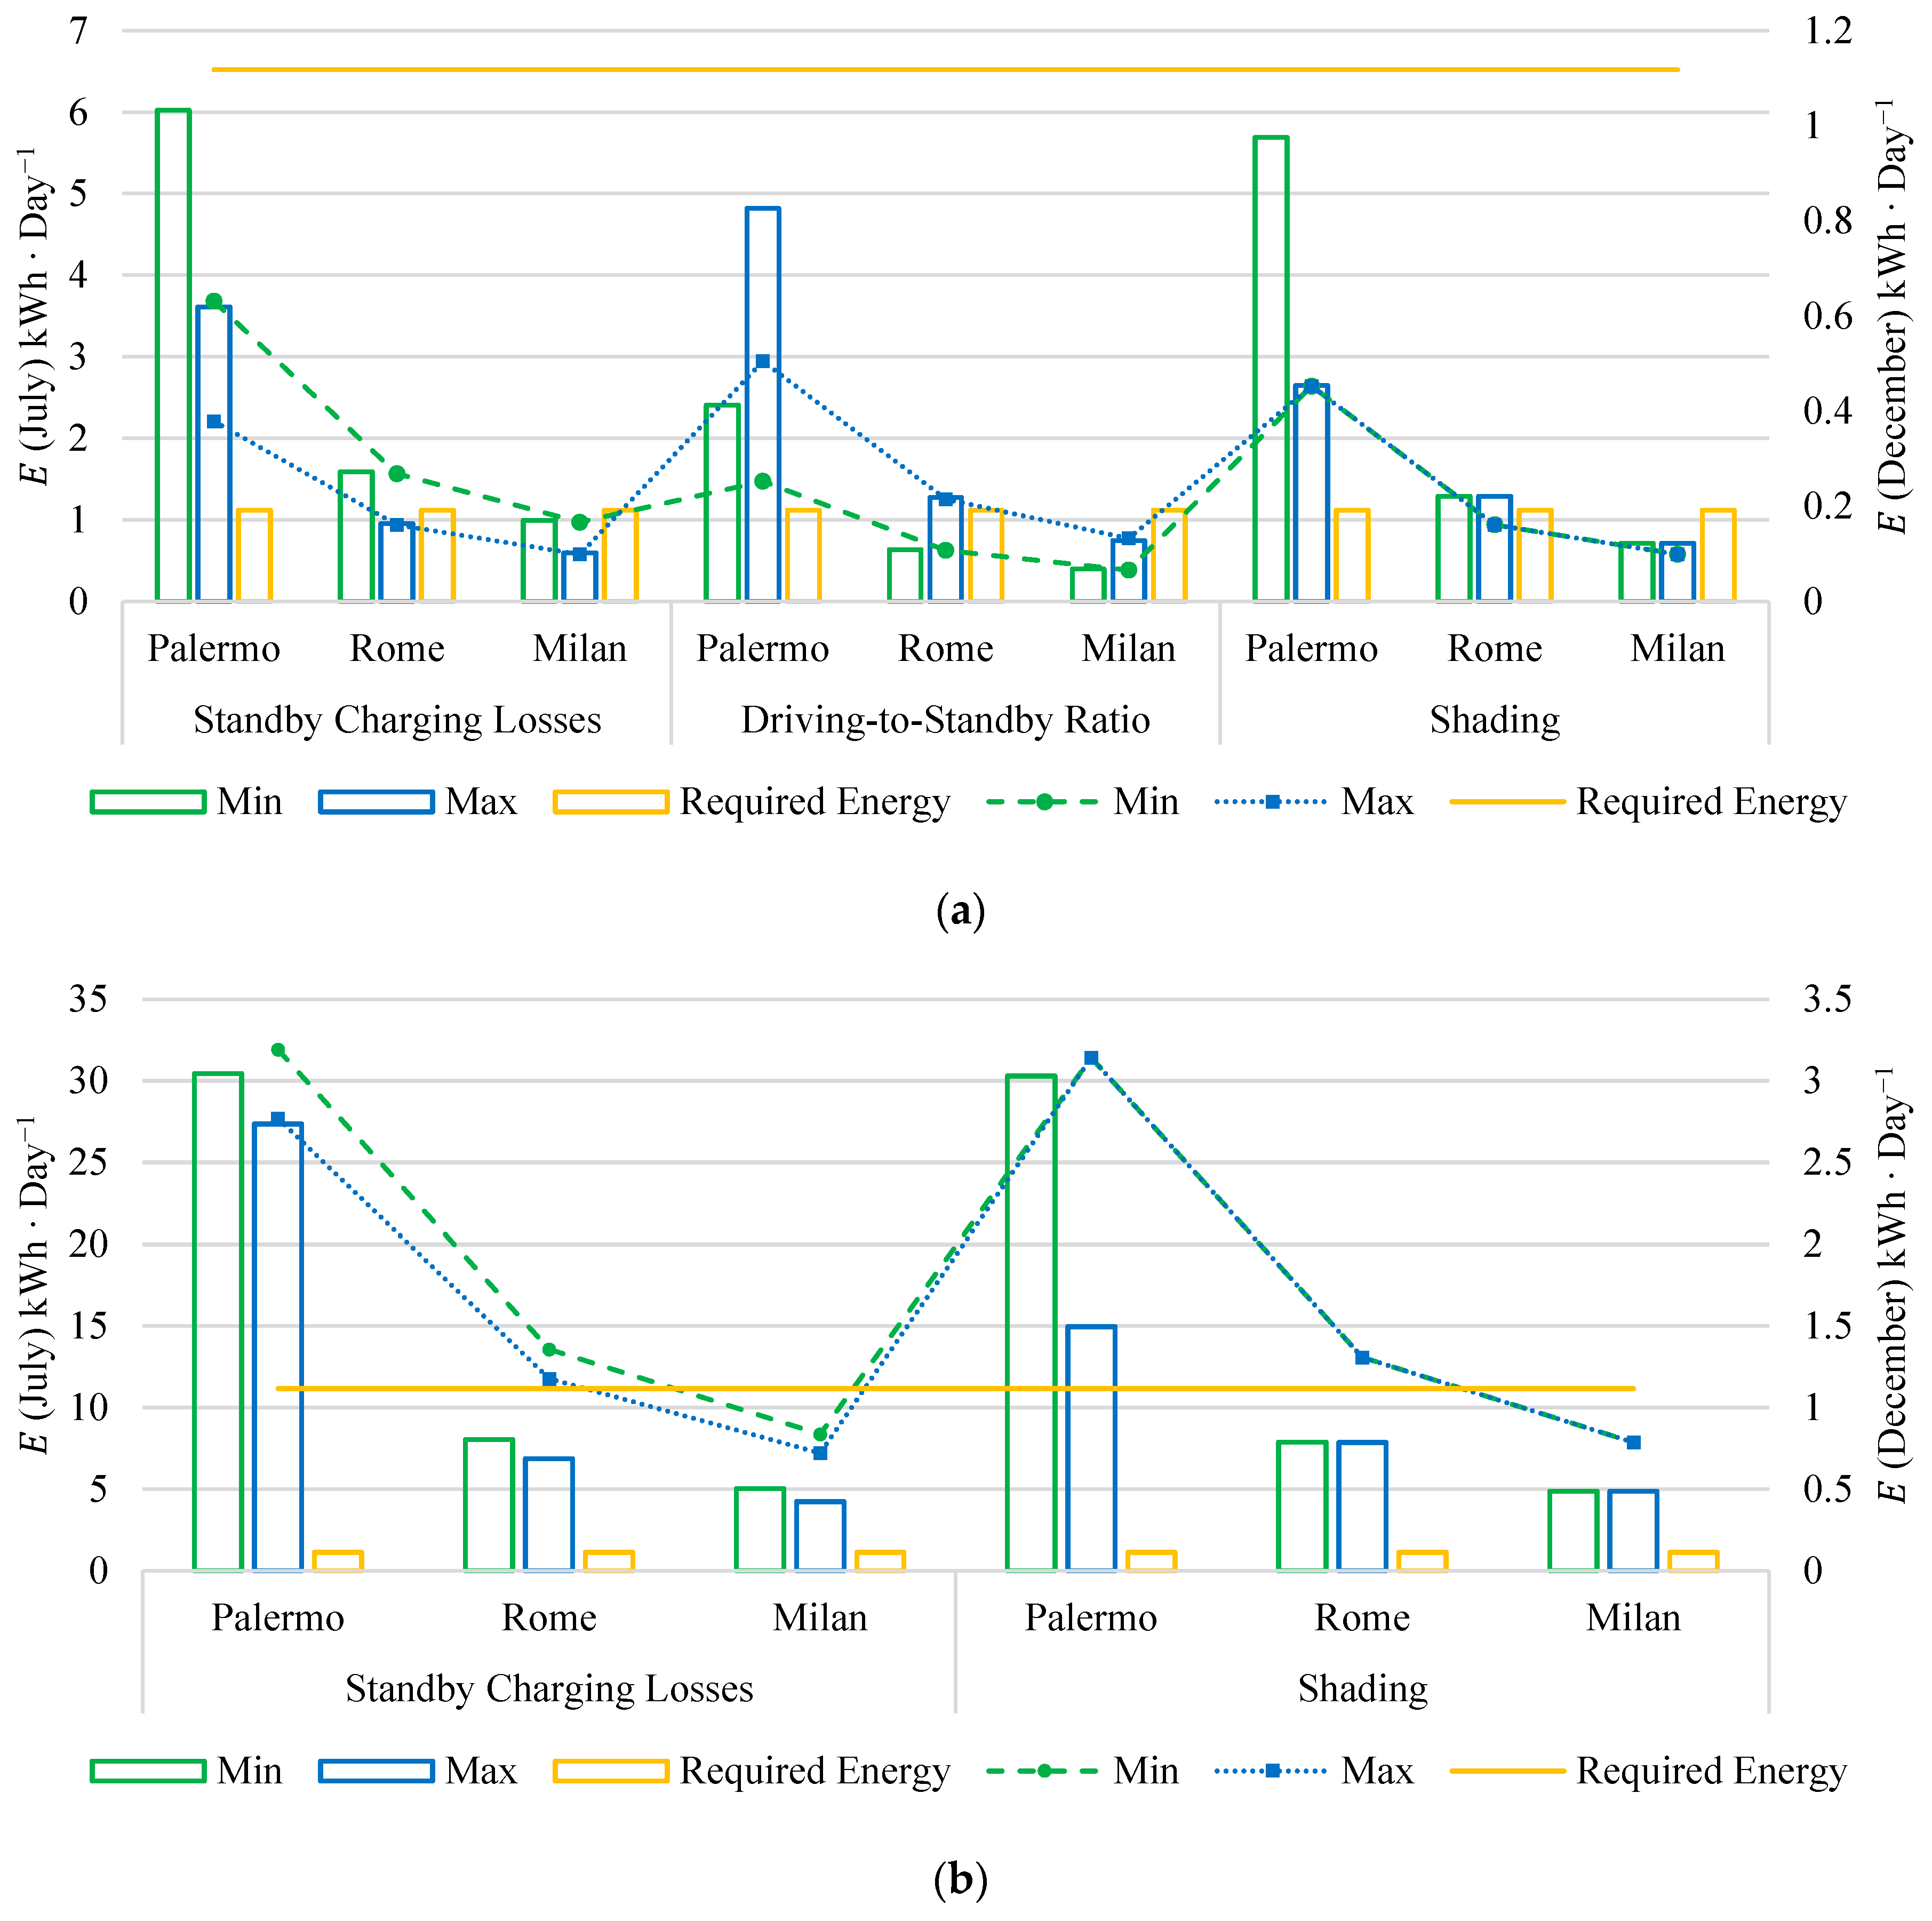
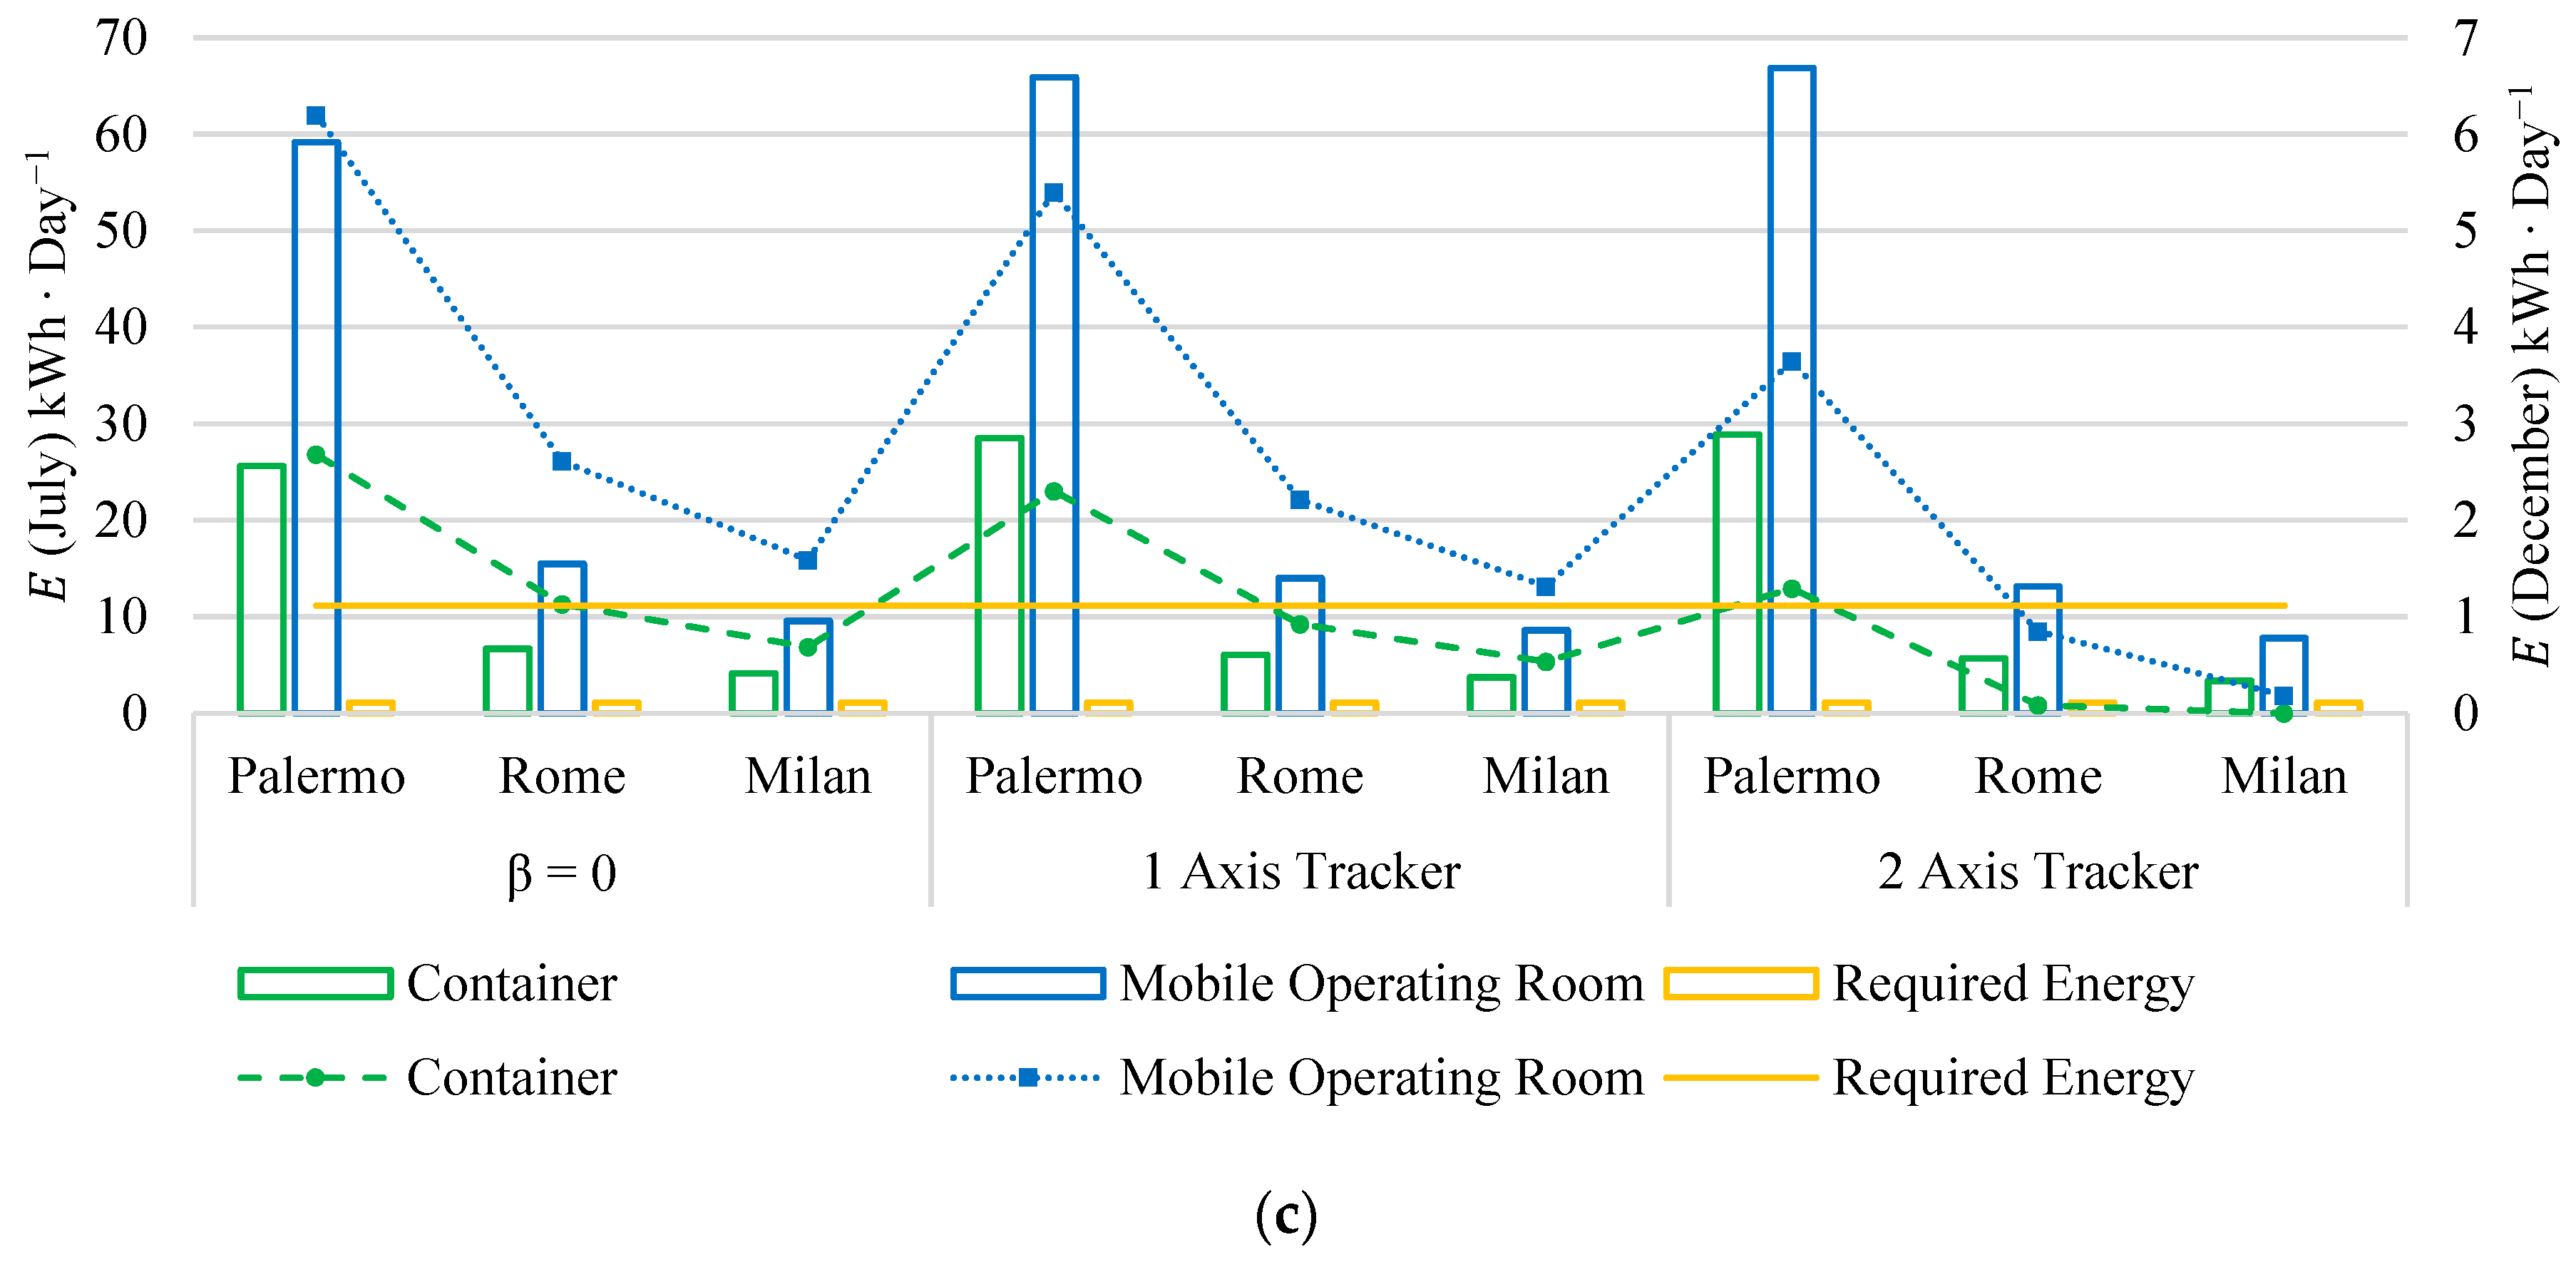
4.1. Energy Production and Solar Range

Due to their mobile solar energy generation capabilities, the WAS E 500 ambulance and the Tesla Semi truck were specifically analyzed for their potential application in the disaster response. Additionally, based on available data regarding the average energy consumption of these vehicles, this study evaluated the feasibility of using solar-generated energy to meet their operational demands. Table 5 presents the results of the sensitivity analysis conducted on various parameters for the WAS E 500 and Tesla Semi. The table contains values obtained for the maximum and minimum of each parameter, providing insights into the variability of energy efficiency under different conditions.
Among the three analyzed cities, Palermo exhibited the highest annual energy production due to its greater solar irradiance. However, the impact of standby charging losses ( L C H ) was significant. When L C H = 700   W was considered, it meant that during each hour in standby mode, any generated energy below 700   W was disregarded to prevent battery discharge. The difference in total annual energy generation between L C H = 0   W and L C H = 700   W represents the energy lost due to standby consumption. This energy loss varied based on both the vehicle’s operational pattern (driving-to-standby ratio, R ) and the available solar radiation in each city. For the ambulance, increasing L C H from 0 to 700   W resulted in an approximately 40% reduction in total energy production. However, for the truck, this reduction has a limited variation across cities: approximately 8% in Palermo, 9% in Rome, and 10% in Milan. These differences can be attributed to variations in solar radiation levels and the vehicle’s operational profile. The truck, with a larger PV surface area and different R values, spent more time in driving mode, reducing the overall impact of L C H on energy production. It is important to note that for this analysis, R was set to 0.6 for the ambulance, while for the truck, it followed the values in Figure 4. To further analyze the impact of R variations, R was adjusted between 0.4 and 0.8 for the ambulance. In this analysis, L C H was set to 100 W to evaluate the effect of the driving-to-standby ratio under average conditions and compare it with other obtained results. The findings indicate that increasing R from 0.4 to 0.8 led to an increase in E by approximately 6% in Palermo and Rome, and 11% in Milan.
The effect of shadowing was examined by varying it from 0% to 80% while keeping L C H = 25   W and R = 0.6 for the ambulance. Since shading was applied only to direct radiation, its impact was more pronounced in cities where direct radiation constituted a significant portion of total irradiance. As a result, Palermo and Rome experienced greater reductions in energy generation compared to Milan, where diffuse radiation played a more substantial role. For example, for the truck, an 80% shading level resulted in an energy loss of approximately 36% in Milan, while the losses are similar in Rome (47%) and Palermo (46%). Finally, based on the obtained energy values and the average energy consumption of each vehicle, the solar range for each case study under the specified conditions has been calculated.
Additionally, the distribution of daily energy generation across different months is presented to highlight seasonal variations. The ambulance and truck were analyzed under average conditions for Rome in Figure 6, which exhibited a relatively typical energy generation profile based on the obtained results. Figure 6a illustrates the results for the ambulance with R = 0.6 . It is important to note that for both the truck and ambulance, the presented results correspond to L C H = 100   W .
To better understand the effects of L C H and R on the energy produced by the ambulance under different operational scenarios, two different conditions have been investigated: L 1 = 100   W , L 2 = 700   W and R 1 = 0.4 , R 2 = 0.8 , with a fixed shading ratio of 20%. These scenarios were chosen to reflect different ambulance roles. In the first one, the ambulance is primarily engaged in providing local healthcare services, meaning it operates within a limited area and spends most of its time in standby mode. This reflects situations where the ambulance remains near a medical facility or within a community, delivering healthcare services on-site with minimal driving. Therefore, R 1 = 0.4 was considered to represent this operational pattern. In contrast, the second scenario assumes the ambulance is mainly used for patient transportation, meaning it spends more time in driving mode. For this reason, R 1 = 0.8 was selected. Additionally, to analyze the combined impact of L C H and R , each scenario was further examined by varying L C H between 100   W and 700   W (denoted as L 1 and L 2 , respectively). The previous results indicated that daily energy generation reached its peak in July and its lowest point in December. Therefore, to better understand seasonal variations, we analyzed the distribution of daily generated energy in these two months across the three cities, as illustrated in Figure 7. Based on these results and considering the average consumption of the ambulance, the VIPV system can extend the ambulance’s range by up to 4 k m · D a y 1 in December and up to 13 k m · D a y 1 in July.
The energy production and solar range of each vehicle fluctuate daily and monthly due to variations in the amount of solar radiation received throughout the year. Figure 8 presents the number of days in each month where the solar range of the Tesla Semi falls within defined ranges, for different locations. For instance, in May, the Tesla Semi exceeded a solar range of 30 k m · D a y 1 on 22 days in Palermo, 19 days in Rome, and 9 days in Milan. It is important to note that the values shown in this figure are based on the condition where L C H = 0 W, representing the scenario with no standby charging losses.
Regarding the container, it is supposed to be detached from the truck and positioned in a fixed location. The focus is on evaluating how advanced technologies, such as solar trackers, can enhance energy production compared to keeping the container mounted on the truck without any further adjustments. The daily energy output of the solar cells integrated into the container roof was analyzed under different configurations: a fixed installation with a tilt angle of β = 0 , as well as installations equipped with one-axis and two-axis solar trackers, as illustrated in Figure 9.
In Figure 9, the energy consumption of tracking systems is also considered [58,59,60]. While solar trackers generally enhance energy production by optimizing the panel’s orientation to capture more solar radiation, their effectiveness varies depending on seasonal changes and local weather conditions. In some cases, the total received irradiance with a fixed panel ( β = 0 ) can be higher than with tracking systems. This occurs particularly on cloudy days when most of the solar radiation is diffuse. Since diffuse irradiance is uniformly distributed across the sky, tilting the panels does not significantly improve energy capture, making a fixed-angle configuration more effective in such conditions. Additionally, there are some days when the increase in energy production from tracking systems is relatively small. As shown in Figure 9, when factoring in the energy consumption of the tracking mechanism itself, the net energy gain may be negligible compared to a fixed-tilt system. This highlights the importance of evaluating whether the additional energy yield from solar tracking justifies its own energy consumption under different environmental conditions.
As already underlined, the potential of integrating photovoltaic cells into the roof of a mobile operating room has been also investigated. In fact, sometimes, mobile operating rooms may be necessary during disasters, because the primary focus is on preserving the health of the injured. To examine the variation in daily energy production across different months, Figure 10 presents the distribution of daily generated energy from the integrated solar cells for July and December.
The results demonstrate significant differences influenced by weather conditions and seasonal changes. Also notably, daily energy generation can vary within a month due to factors such as weather patterns and cloud cover. Such insights are crucial for effective energy management, particularly in disaster scenarios, as they enable better utilization of renewable resources to meet energy demands across varying time frames.

4.2. Battery Sizing

As discussed in the previous section, trucks and ambulances utilized their existing onboard batteries to support both vehicle operations and the PV system. The impact of various work conditions and standby charging losses ( L C H ) was also analyzed to quantify the energy produced and stored under different scenarios. In this section, the focus shifts to containers and mobile operating rooms, which may serve as examples of off-grid systems.
In traditional off-grid PV systems, the design process begins with identifying the energy loads and determining the required daily energy consumption [40,61]. Based on this, usually, the necessary PV panel capacity and battery size are then calculated to meet the energy demand. However, in our system, the approach is reversed. Instead of designing the system based on energy demand, we first assess the energy production potential of the PV modules integrated into the available roof space of each case study. Since the installation area is limited, the PV system can only generate a fixed amount of energy, as determined in the previous section. For this reason, the battery size is determined based on the available PV energy production rather than the required energy demand. Battery capacity ( k W h ) was calculated as follows:
B a t t e r y   C a p a c i t y = E · N A D o D
where E represents the daily energy production, N A denotes the number of autonomy days, and D o D is the depth of discharge of the battery. In this study, D o D was considered as 0.75 and N A was set to 3 [40]. The results obtained for calculating the required battery size across different cities and case studies are presented in Table 6.
The mentioned results for battery sizing in Table 6 are based on the obtained energy production data, and suitable battery capacities can be rounded up to ensure reliable operation and availability.

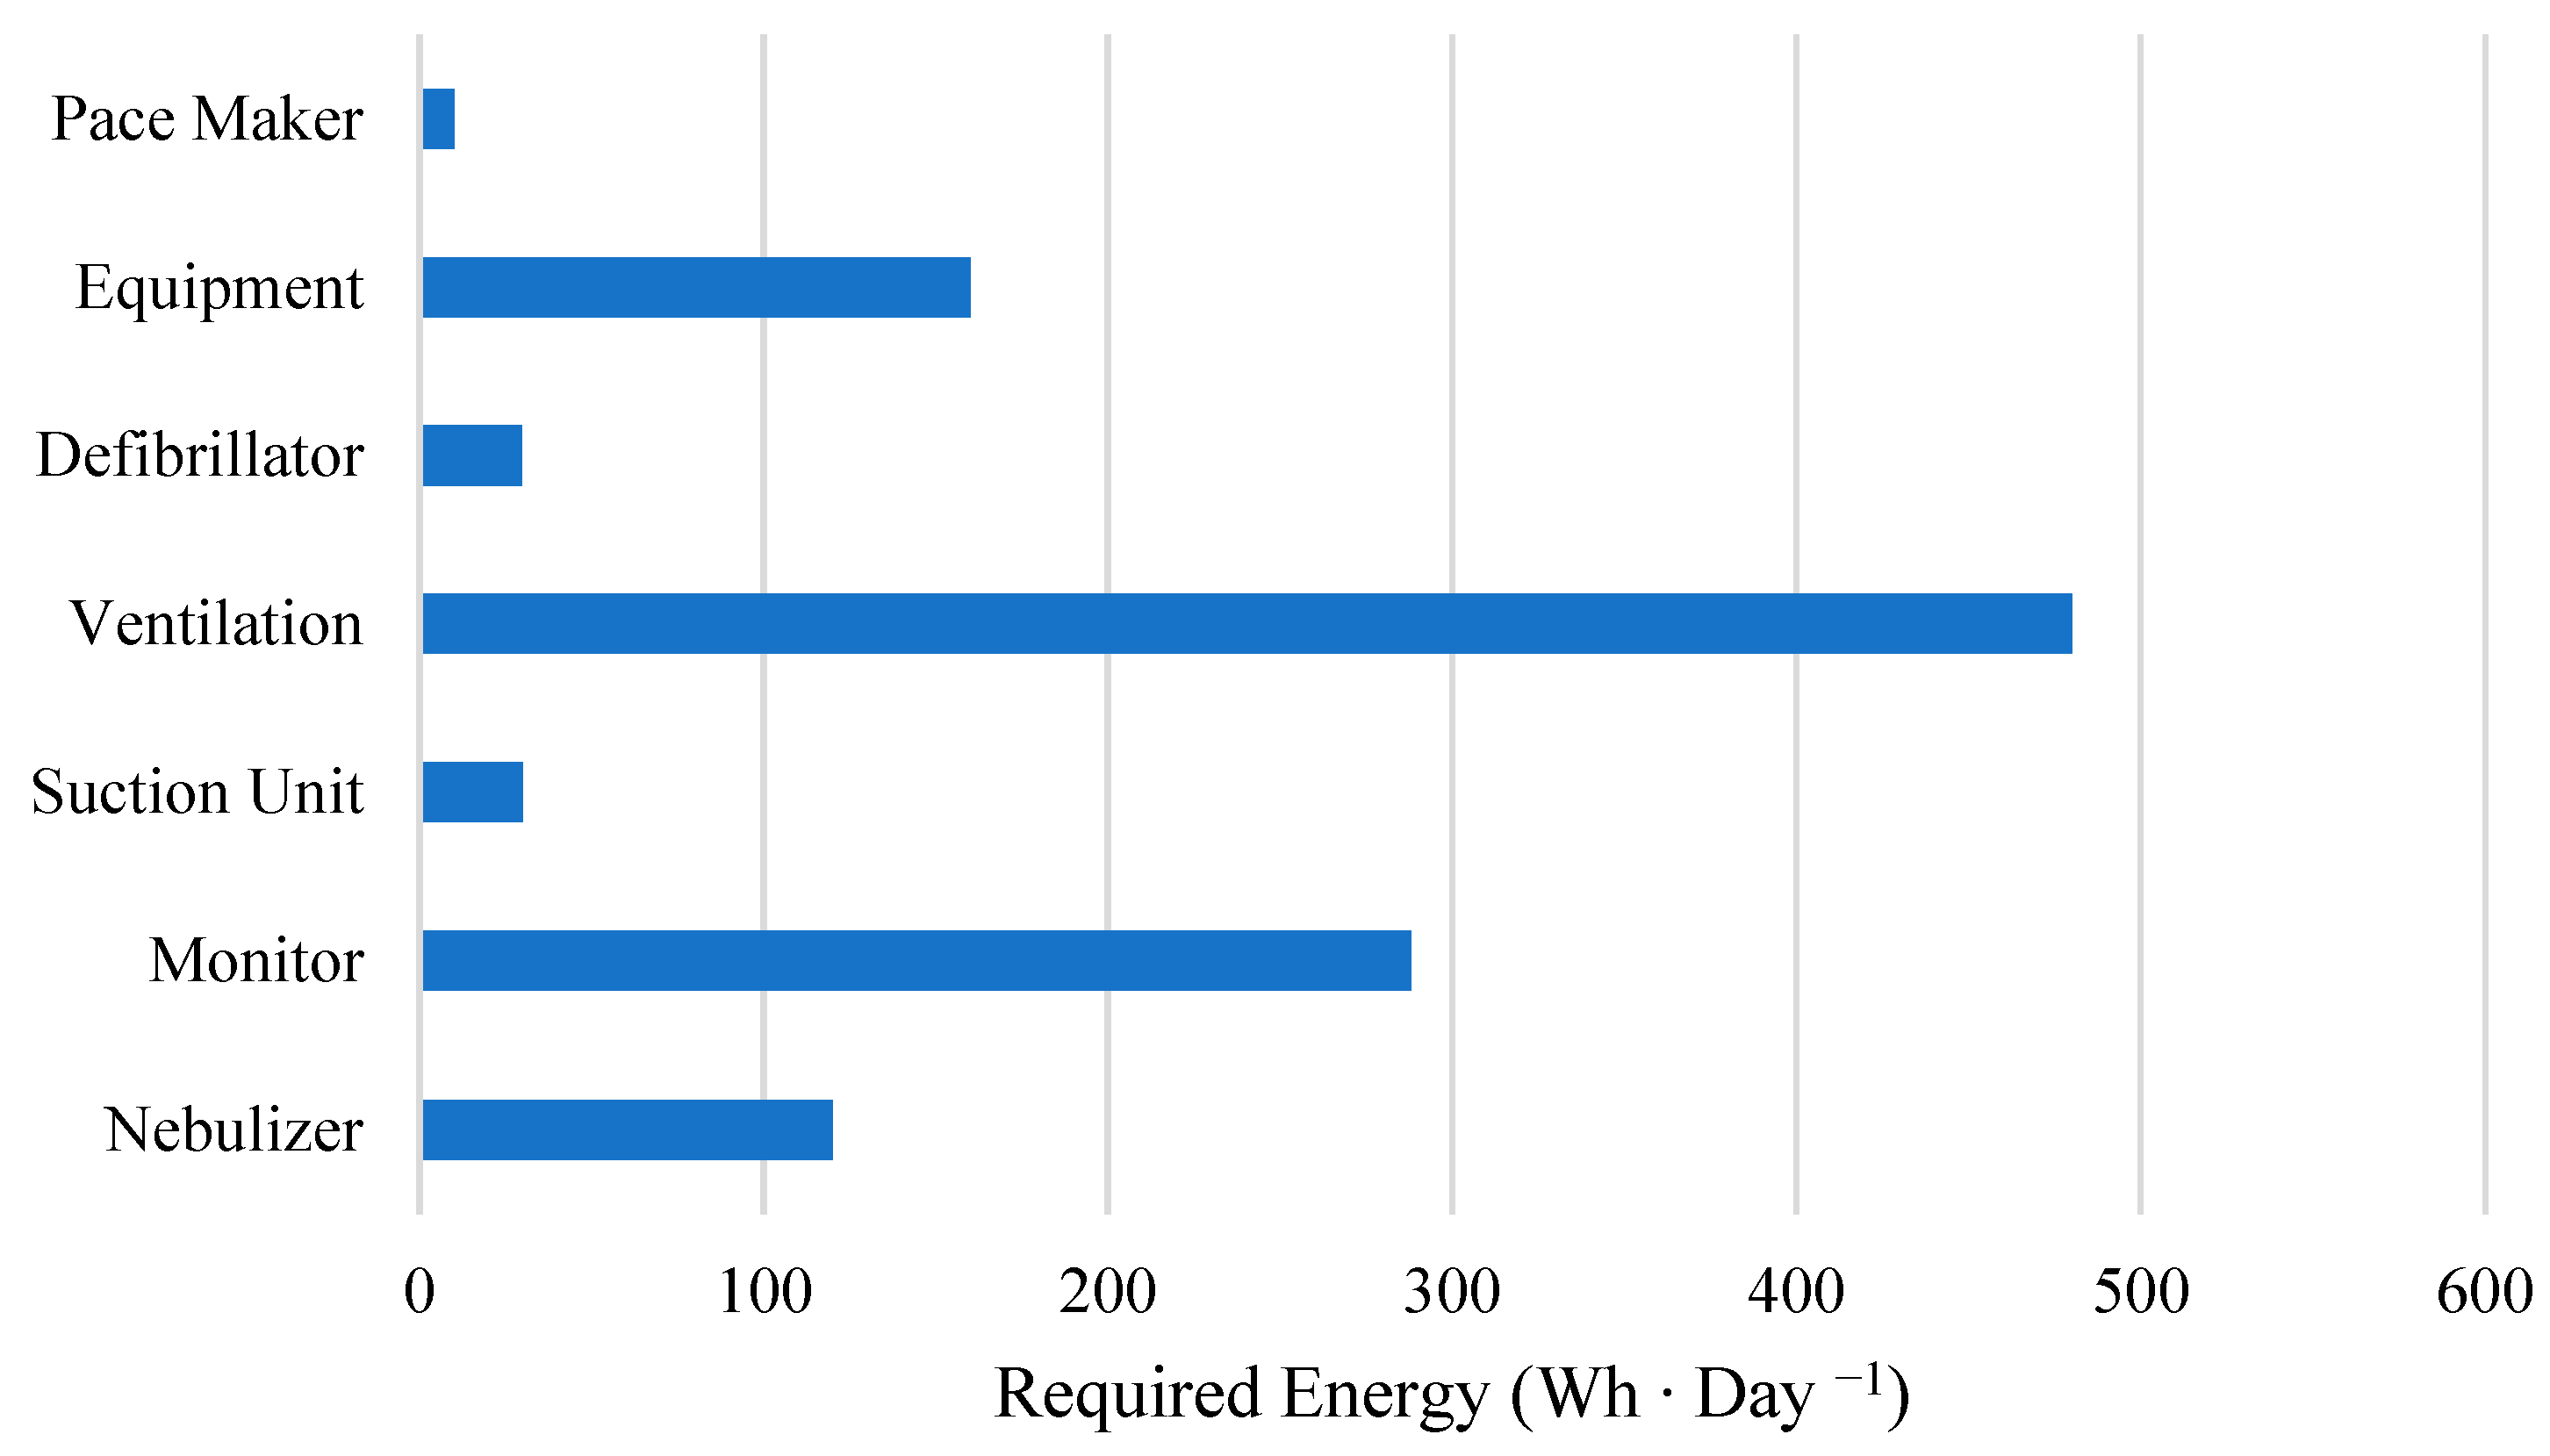
4.3. Load Analysis of Critical Healthcare Equipment

In disaster scenarios, the energy required to power critical medical equipment takes precedence over other needs. Ensuring the health and survival of individuals is paramount, and as such, energy for operating vital devices has been prioritized as the primary requirement. This prioritization allows for a clear understanding of the energy production potential and its ability to support critical healthcare equipment before addressing secondary energy demands.
Data on the energy requirements for operating medical equipment in an Intensive Care Unit (ICU) were gathered through a comprehensive literature review [17,62,63,64], as illustrated in Figure 11.
These data were adapted to address disaster scenarios where a reliable and consistent energy supply is essential. To align with these critical situations, the operational hours of each piece of equipment were analyzed based on their importance. For example, essential devices such as monitors and ventilators, which play a crucial role in sustaining life or checking vital signs, were identified as requiring uninterrupted operation (24/7). This ensures continuous patient care and highlights the capability of the energy produced in each case study to support these critical devices. It should be noted that the total daily energy requirement, based on the values presented in Figure 11, is approximately 1.12 k W h · D a y 1 . Additionally, if all the mentioned medical devices are used continuously for one hour, the required energy amounts to 0.09 k W h . However, under the considered operational scenario, where these devices are utilized throughout the day, the average hourly energy demand is approximately 0.05 k W h .
By understanding how long the generated energy can sustain such equipment, this study underscores the vital role of energy production in maintaining healthcare services during emergencies. Hence, to evaluate whether the generated energy can reliably supply the critical energy requirements for healthcare devices under worst-case conditions, we compared the obtained energy production with the essential loads. For each case study and location, we selected July and December as representative months for summer and winter, respectively, since they exhibit the highest and lowest levels of energy production. The minimum daily energy generated in these months was determined and compared with the daily energy demand of vital devices. The results of this analysis are presented in Figure 12, where the line graphs represent December, and the bar charts correspond to July.
For both the ambulance and the truck, the terms “Max” and “Min” in the figures represent the energy production corresponding to the maximum and minimum values of a given parameter. For instance, in the case of standby charging losses ( L C H ), the maximum and minimum values were set at 700 W and 0 W , respectively. All other conditions and parameters were kept consistent with those outlined for obtaining the values in Table 5. Although the VIPV system may not always provide sufficient energy to power all medical devices for an entire day, it can still supply energy for durations ranging from 1 to 15 h, even under the lowest production conditions. Additionally, the average energy production across the analyzed months was significantly higher than these minimum values. For instance, in July, although daily energy production in Milan and Rome sometimes fell below the required energy at certain times, the average generated energy consistently exceeded the required amount.
For the container and mobile operating room, the minimum daily energy production in July and December is shown in Figure 12c, considering three different configurations: a fixed installation with zero inclination and systems with solar tracking. In July, the results indicated that these case studies could fully meet their energy demands, with production ranging from 3 to 60 times the required energy. However, in December, accounting for the energy consumption of tracking systems, some cases in Milan and Rome showed instances where net energy production was close to zero when two-axis trackers were used. On other days, when a two-axis tracker was used, the average energy produced by the container in Milan and Rome was 9.3 and 14.11 k W h , respectively.

4.4. CO2 Emissions

Based on the results in Table 5 and the emissions factors from the power sector, the amount of reduced emissions due to using the VIPV system and its energy production instead of using grid power can be calculated (Table 7) [65]:
C O 2   r e d u c t i o n = E n e r g y   g e n e r a t i o n · E m i s s i o n   i n t e n s i t y
To assess the quantity of CO2 emissions saved, we rely on available data, utilizing emission factors from the power sector in 2020 [27], which were 259.8 g C O 2 · k W h 1 .
As already underlined, although reducing emissions is a secondary concern in emergency scenarios, it underscores the broader sustainability advantages of integrating solar energy into mobile applications.

5. Conclusions

Ensuring a reliable energy supply in disaster scenarios is a critical challenge, particularly when grid networks are compromised. This study proposes the evaluation of the the potential of VIPV systems to support emergency response efforts by generating energy for both vehicle mobility and essential medical devices. By adapting existing methodologies to account for the unpredictable nature of disasters, energy production under various operational conditions and environmental factors has been assessed.
While this study primarily focuses on emergency scenarios, long-term energy production results highlight the broader potential of integrating PV systems into emergency vehicles. The results indicate that integrating photovoltaic systems into ambulances can generate, depending on location, between 0.76 and 1.89 M W h · Y e a r 1 , also leading to carbon dioxide savings of 0.2 to 0.549 tons, also underlining the broader sustainability advantages of integrating solar energy into mobile applications. Additionally, the truck’s solar range exceeded 30 k m · D a y 1 for 38 to 99 days of the year, depending on the city. These PV-equipped vehicles can serve dual purposes, functioning under normal conditions while also offering a resilient energy source during emergencies. By considering these results, different cities can proactively equip emergency vehicles with VIPV technology, ensuring they are prepared for rapid deployment in disaster zones.
Considering the energy demand for vital medical devices, where the total daily requirement was 1.12 k W h , the hourly consumption varies between 0.05 k W h in the defined scenario and 0.09 k W h when all devices operate simultaneously. Even under the most challenging conditions, the ambulance’s VIPV system could supply medical devices for one to fifteen hours per day. This study also examined the role of solar tracking systems in enhancing energy production for a container and a mobile operating room in fixed installations. While tracking generally increases energy yield, its own energy consumption can sometimes reduce net energy output. In some cases, such as during the winter in Milan, the energy consumed by dual-axis tracking resulted in zero net energy production. Additionally, in cloudy conditions where diffuse radiation dominates, fixed installations with zero inclination sometimes performed better than tracking systems. In extreme wind conditions (more than 35 m · s 1 ), which are common in disaster scenarios, keeping panels at zero inclination is also a safer and more stable option. However, the mobile operating room, under optimal conditions in July, produced more than 120 times the required energy.
Although this study focused on specific vehicles and case studies, the proposed methodology can be extended to other emergency and utility vehicles. While energy production from a single VIPV-equipped vehicle may sometimes be limited, energy losses can be minimized by integrating additional storage solutions, such as portable batteries, or by enabling vehicles to share power. This approach could enhance the overall efficiency and reliability of VIPV systems in disaster response. To further improve resilience, future studies may explore how data from past disasters could be used to predict access routes for emergency vehicles, ensuring more efficient deployment of energy resources.

Author Contributions

Conceptualization, G.A., H.S. and P.R.; methodology, H.S. and F.V.; software, H.S.; investigation, H.S.; resources, G.A. and F.V.; data curation, H.S. and A.I.; writing—original draft preparation, H.S.; writing—review and editing, G.A., H.S., S.L., F.V. and P.R.; visualization, A.I. and S.L.; supervision, G.A.; project administration, G.A., P.R. and F.V. All authors have read and agreed to the published version of the manuscript.

Funding

The PhD work of Hamid Samadi contributing to this research is supported by the Italian National PhD in Photovoltaics—Curriculum: Design and Integration. This work was also financed by the European Union—NextGenerationEU (National Sustainable Mobility Center CN00000023, Italian Ministry of University and Research Decree n. 1033—17/06/2022, Spoke 12). Dr. Silvia Licciardi were supported by the following project: “Network 4 Energy Sustainable Transition—NEST”, code PE0000021, CUP B73C22001280006, Spoke 7, funded under the National Recovery and Resilience Plan (NRRP), Mission 4, by the European Union—NextGenerationEU.

Data Availability Statement

Data are contained within the article.

Conflicts of Interest

The authors declare no conflicts of interest.

References

  1. Román, M.O.; Stokes, E.C.; Shrestha, R.; Wang, Z.; Schultz, L.; Carlo, E.A.S.; Sun, Q.; Bell, J.; Molthan, A.; Kalb, V.; et al. Satellite-based assessment of electricity restoration efforts in Puerto Rico after Hurricane Maria. PLoS ONE 2019, 14, e0218883. [Google Scholar] [CrossRef]
  2. Popke, J.; Harrison, C. Energy, resilience, and responsibility in post-hurricane Maria Dominica: Ethical and historical perspectives on ‘Building Back Better’. J. Extrem. Events 2018, 5, 1840003. [Google Scholar] [CrossRef]
  3. Der Sarkissian, R.; Dabaj, A.; Diab, Y.; Vuillet, M. Evaluating the implementation of the “build-back-better” concept for critical infrastructure systems: Lessons from saint-martin’s island following hurricane irma. Sustainability 2021, 13, 3133. [Google Scholar] [CrossRef]
  4. Miranda, M.R.; Catalán, D.P.; Menéndez, A.F.; Barbosa, R. Analysis of the economic feasibility of a PV system with hydrogen and supercapacitors-based hybrid energy storage for rural community shelter in Yucatán, México. Int. J. Hydrogen Energy 2024, 108, 171–184. [Google Scholar] [CrossRef]
  5. Unal, S.; Dagteke, S.E. Enhancement of fuel cell based energy sustainability for cell on wheels mobile base stations used in disaster areas. Int. J. Hydrogen Energy 2024, 75, 567–577. [Google Scholar] [CrossRef]
  6. Candan, A.K.; Boynuegri, A.R.; Onat, N. Home energy management system for enhancing grid resiliency in post-disaster recovery period using Electric Vehicle. Sustain. Energy Grids Netw. 2023, 34, 101015. [Google Scholar] [CrossRef]
  7. Rad, M.A.V.; Shahsavari, A.; Rajaee, F.; Kasaeian, A.; Pourfayaz, F.; Yan, W.M. Techno-economic assessment of a hybrid system for energy supply in the affected areas by natural disasters: A case study. Energy Convers. Manag. 2020, 221, 113170. [Google Scholar] [CrossRef]
  8. Saboori, H. Enhancing resilience and sustainability of distribution networks by emergency operation of a truck-mounted mobile battery energy storage fleet. Sustain. Energy Grids Netw. 2023, 34, 101037. [Google Scholar] [CrossRef]
  9. Li, Q.; Li, T.; Zanelli, A. Performance evaluation of flexible photovoltaic panels for energy supply in post-disaster emergency shelters. J. Build. Eng. 2024, 98, 111285. [Google Scholar] [CrossRef]
  10. He, G.; Michalek, J.; Kar, S.; Chen, Q.; Zhang, D.; Whitacre, J.F. Utility-scale portable energy storage systems. Joule 2021, 5, 379–392. [Google Scholar] [CrossRef]
  11. Saboori, H.; Jadid, S. Optimal scheduling of mobile utility-scale battery energy storage systems in electric power distribution networks. J. Energy Storage 2020, 31, 101615. [Google Scholar] [CrossRef]
  12. Borodinecs, A.; Zajecs, D.; Lebedeva, K.; Bogdanovics, R. Mobile off-grid energy generation unit for temporary energy supply. Appl. Sci. 2022, 12, 673. [Google Scholar] [CrossRef]
  13. Samadi, H.; Ala, G.; Brano, V.L.; Romano, P.; Viola, F.; Miceli, R. Potential and Methods of Integrating Solar Cells into Vehicles. In Proceedings of the 2023 International Conference on Clean Electrical Power (ICCEP), Terrasini, Italy, 27–29 June 2023; pp. 715–720. [Google Scholar] [CrossRef]
  14. Ben Said-Romdhane, M.; Skander-Mustapha, S. A Review on Vehicle-Integrated Photovoltaic Panels. In Advanced Technologies for Solar Photovoltaics Energy Systems; Springer: Cham, Switzerland, 2021; pp. 349–370. [Google Scholar] [CrossRef]
  15. Samadi, H.; Ala, G.; Lo Brano, V.; Romano, P.; Viola, F. Investigation of Effective Factors on Vehicles Integrated Photovoltaic (VIPV) Performance: A Review. World Electr. Veh. J. 2023, 14, 154. [Google Scholar] [CrossRef]
  16. Almonacid, G.; Muñoz, F.J.; De La Casa, J.; Aguilar, J.D. Integration of PV systems on health emergency vehicles. The FIVE project. Prog. Photovolt. Res. Appl. 2004, 12, 609–621. [Google Scholar]
  17. Hasan, T.; Jamaludin, S.; Nik, W.W. Analysis of intelligent solar ICU water ambulance to optimize energy. Ann. Med. Surg. 2022, 80, 104141. [Google Scholar] [CrossRef]
  18. Araki, K.; Ota, Y.; Maeda, A.; Kumano, M.; Nishioka, K. Solar Electric Vehicles as Energy Sources in Disaster Zones: Physical and Social Factors. Energies 2023, 16, 3580. [Google Scholar] [CrossRef]
  19. Roudbari, A.; Nateghi, A.; Yousefi-khanghah, B.; Asgharpour-Alamdari, H.; Zare, H. Resilience-oriented operation of smart grids by rescheduling of energy resources and electric vehicles management during extreme weather condition. Sustain. Energy Grids Netw. 2021, 28, 100547. [Google Scholar] [CrossRef]
  20. Rahimi, K.; Chowdhury, B. A hybrid approach to improve the resiliency of the power distribution system. In Proceedings of the 2014 North American Power Symposium (NAPS), Pullman, WA, USA, 7–9 September 2014; pp. 1–6. [Google Scholar] [CrossRef]
  21. Kim, H.; Ku, J.; Kim, S.M.; Park, H.D. A new GIS-based algorithm to estimate photovoltaic potential of solar train: Case study in Gyeongbu line, Korea. Renew. Energy 2022, 190, 713–729. [Google Scholar] [CrossRef]
  22. Oh, M.; Kim, S.M.; Park, H.D. Estimation of photovoltaic potential of solar bus in an urban area: Case study in Gwanak, Seoul, Korea. Renew. Energy 2020, 160, 1335–1348. [Google Scholar] [CrossRef]
  23. Kutter, C.; Alanis, L.E.; Neuhaus, D.H.; Heinrich, M. Yield potential of vehicle integrated photovoltaics on commercial trucks and vans. In Proceedings of the 38th European PV Solar Energy Conference and Exhibition, Online, 6–10 September 2021; Volume 6, p. 10. [Google Scholar]
  24. Araki, K.; Ota, Y.; Nagaoka, A.; Nishioka, K. 3D solar irradiance model for non-uniform shading environments using shading (aperture) matrix enhanced by local coordinate system. Energies 2023, 16, 4414. [Google Scholar] [CrossRef]
  25. Tiwari, A.; Darbari, M. (Eds.) Emerging Trends in Computer Science and Its Application, 1st ed.; CRC Press: Boca Raton, FL, USA, 2025. [Google Scholar] [CrossRef]
  26. Almajali, Z.S.; Aldmour, S.A. Single-Axis Solar Tracker System for Maintaining Southward Orientation of Solar Cells in Solar Cars. In Proceedings of the 2023 IEEE Jordan International Joint Conference on Electrical Engineering and Information Technology (JEEIT), Amman, Jordan, 22–24 May 2023; pp. 211–216. [Google Scholar] [CrossRef]
  27. Efficiency and Decarbonization Indicators in Italy and in the Biggest European Countries. Edition 2023. 2023. Available online: https://www.isprambiente.gov.it/files2023/pubblicazioni/rapporti/r386-2023.pdf (accessed on 15 June 2024).
  28. Kumar, N.M.; Chopra, S.S.; Malvoni, M.; Elavarasan, R.M.; Das, N. Solar cell technology selection for a PV leaf based on energy and sustainability indicators—A case of a multilayered solar photovoltaic tree. Energies 2020, 13, 6439. [Google Scholar] [CrossRef]
  29. Yamaguchi, M.; Nakamura, K.; Ozaki, R.; Kojima, N.; Ohshita, Y.; Masuda, T.; Okumura, K.; Mabuchi, T.; Satou, A.; Tanimoto, T.; et al. Analysis of Climate Conditions Upon Driving Distance of Vehicle Integrated Photovoltaics-Powered Vehicles. Energy Technol. 2024, 12, 2300692. [Google Scholar] [CrossRef]
  30. Ota, Y.; Araki, K.; Nagaoka, A.; Nishioka, K. Facilitating vehicle-integrated photovoltaics by considering the radius of curvature of the roof surface for solar cell coverage. Clean. Eng. Technol. 2022, 7, 100446. [Google Scholar] [CrossRef]
  31. Duffie, J.A.; Beckman, W.A. Solar Engineering of Thermal Processes; John Wiley & Sons: Hoboken, NJ, USA, 2013. [Google Scholar] [CrossRef]
  32. Remund, J.; Müller, S.C.; Schmutz, M.; Graf, P. Meteonorm Version 8. In Proceedings of the EU PVSEC 2020, Lisbon, Portugal, 7–11 September 2020. [Google Scholar] [CrossRef]
  33. European Commission; Joint Research Centre. Photovoltaic Geographical Information System (PVGIS). 2024. Available online: https://ec.europa.eu/jrc/en/pvgis (accessed on 7 February 2025).
  34. Brito, M.C.; Santos, T.; Moura, F.; Pera, D.; Rocha, J. Urban solar potential for vehicle integrated photovoltaics. Transp. Res. Part D Transp. Environ. 2021, 94, 102810. [Google Scholar] [CrossRef]
  35. Brito, M.C.; Amaro e Silva, R.; Pera, D.; Costa, I.; Boutov, D. Effect of urban shadowing on the potential of solar-powered vehicles. Prog. Photovolt. Res. Appl. 2024, 32, 73–83. [Google Scholar] [CrossRef]
  36. Mallon, K.R.; Assadian, F.; Fu, B. Analysis of on-board photovoltaics for a battery electric bus and their impact on battery lifespan. Energies 2017, 10, 943. [Google Scholar] [CrossRef]
  37. Abdelhamid, M.; Pilla, S.; Singh, R.; Haque, I.; Filipi, Z. A comprehensive optimized model for on-board solar photovoltaic system for plug-in electric vehicles: Energy and economic impacts. Int. J. Energy Res. 2016, 40, 1489–1508. [Google Scholar] [CrossRef]
  38. Kanz, O.; Reinders, A.; May, J.; Ding, K. Environmental impacts of integrated photovoltaic modules in light utility electric vehicles. Energies 2020, 13, 5120. [Google Scholar] [CrossRef]
  39. Araki, K.; Karr, A.J.; Chabuel, F.; Commault, B.; Derks, R.; Ding, K.; Duigou, T.; Ekins-Daukes, N.J.; Gaume, J.; Hirota, T.; et al. State-of-the-Art and Expected Benefits of PV-Powered Vehicles. 2021. Available online: https://iea-pvps.org/wp-content/uploads/2021/07/IEA_PVPS_T17_State-of-theart-and-expected-benefits-of-VIPV_report.pdf (accessed on 6 June 2024).
  40. Mertens, K. Photovoltaics: Fundamentals, Technology, and Practice; John Wiley & Sons: Hoboken, NJ, USA, 2018. [Google Scholar]
  41. Leloux, J.; Taylor, J.; Moretón, R.; Narvarte, L.; Trebosc, D.; Desportes, A.; Solar, S. Monitoring 30,000 PV systems in Europe: Performance, faults, and state of the art. In Proceedings of the 31st European Photovoltaic Solar Energy Conference and Exhibition, Hamburg, Germany, 14–18 September 2015; pp. 1574–1582. [Google Scholar]
  42. WAS 500 E-RTW. 2023. Available online: https://www.was-vehicles.com/de/innovation/was-500-e-rtw.html (accessed on 20 November 2023).
  43. Semi. The Future of Trucking Is Electric. 2023. Available online: https://www.tesla.com/semi (accessed on 20 November 2023).
  44. Mobile Surgery Unit. Available online: https://www.expandable-trailers.com/applications/mobile-surgery-unit (accessed on 10 April 2024).
  45. Types of Containers, Dimensions and Characteristics of Containers. 2023. Available online: https://www.groupe-rdt.com/en/useful-information/types-of-containers/ (accessed on 20 November 2023).
  46. Global Solar Atlas. 2024. Available online: https://globalsolaratlas.info/map/ (accessed on 28 December 2024).
  47. Yamaguchi, M.; Ota, Y.; Masuda, T.; Thiel, C.; Tsakalidis, A.; Jaeger-Waldau, A.; Araki, K.; Nishioka, K.; Takamoto, T.; Nakado, T.; et al. Analysis for effects of temperature rise of PV modules upon driving distance of vehicle integrated photovoltaic electric vehicles. Energy Power Eng. 2024, 16, 131–150. [Google Scholar] [CrossRef]
  48. Park, C.; Park, H.; Jeon, H.; Choi, K.; Suh, J. Evaluation and Validation of Photovoltaic Potential Based on Time and Pathway of Solar-Powered Electric Vehicle. Appl. Sci. 2023, 13, 1025. [Google Scholar] [CrossRef]
  49. REGULATION (EC) No 561/2006 OF THE EUROPEAN PARLIAMENT AND OF THE COUNCIL on the Harmonisation of Certain Social Legislation Relating to Road Transport and Amending Council Regulations (EEC) No 3821/85 and (EC) No 2135/98 and Repealing Council Regulation (EEC) No 3820/85. 2023. Available online: https://eur-lex.europa.eu/resource.html?uri=cellar:5cf5ebde-d494-40eb-86a7-2131294ccbd9.0005.02/DOC_1&format=PDF (accessed on 10 November 2023).
  50. Lodi, C.; Seitsonen, A.; Paffumi, E.; De Gennaro, M.; Huld, T.; Malfettani, S. Reducing CO2 emissions of conventional fuel cars by vehicle photovoltaic roofs. Transp. Res. Part D Transp. Environ. 2018, 59, 313–324. [Google Scholar] [CrossRef]
  51. Ota, Y.; Masuda, T.; Araki, K.; Yamaguchi, M. Curve-correction factor for characterization of the output of a three-dimensional curved photovoltaic module on a car roof. Coatings 2018, 8, 432. [Google Scholar] [CrossRef]
  52. Hirota, T.; Kamiya, Y.; Komoto, K. Feasibility Study of Onboard PV for Passenger Vehicle Application. Trans. Soc. Automot. Eng. Jpn. 2020, 51. [Google Scholar] [CrossRef]
  53. Commault, B.; Duigou, T.; Maneval, V.; Gaume, J.; Chabuel, F.; Voroshazi, E. Overview and perspectives for vehicle-integrated photovoltaics. Appl. Sci. 2021, 11, 11598. [Google Scholar] [CrossRef]
  54. Le Series. 2023. Available online: https://www.sungoldsolar.com/flexible-solar-panel/le/ (accessed on 30 December 2023).
  55. Kutter, C.; Basler, F.; Alanis, L.E.; Markert, J.; Heinrich, M.; Neuhaus, D.H. Integrated lightweight, glass-free PV module technology for box bodies of commercial trucks. In Proceedings of the 37th European PV Solar Energy Conference and Exhibition, Lisbon, Portugal, 7–11 September 2020; Volume 7, p. 11. [Google Scholar]
  56. Martins, A.C.; Chapuis, V.; Virtuani, A.; Ballif, C. Robust glass-free lightweight photovoltaic modules with improved resistance to mechanical loads and impact. IEEE J. Photovolt. 2018, 9, 245–251. [Google Scholar] [CrossRef]
  57. Kim, S.; Holz, M.; Park, S.; Yoon, Y.; Cho, E.; Yi, J. Future options for lightweight photovoltaic modules in electrical passenger cars. Sustainability 2021, 13, 2532. [Google Scholar] [CrossRef]
  58. Kuttybay, N.; Mekhilef, S.; Koshkarbay, N.; Saymbetov, A.; Nurgaliyev, M.; Dosymbetova, G.; Orynbassar, S.; Yershov, E.; Kapparova, A.; Zholamanov, B.; et al. Assessment of solar tracking systems: A comprehensive review. Sustain. Energy Technol. Assess. 2024, 68, 103879. [Google Scholar] [CrossRef]
  59. Single Axis Tracker. 2025. Available online: https://lumaxenergy.com/assets/datasheets/single-axis-tracker/SAT.pdf (accessed on 15 February 2025).
  60. Duo Series Dual Axis Solar Tracking Systems. 2025. Available online: https://www.pvsolarfirst.com/Products_details/Duo_Series_Dual_Axis_Solar_Tracking_Systems.html (accessed on 15 February 2025).
  61. Jogunuri, S.; Kumar, R.; Kumar, D. Sizing an off-grid photovoltaic system (A case study). In Proceedings of the 2017 International Conference on Energy, Communication, Data Analytics and Soft Computing (ICECDS), Chennai, India, 1–2 August 2017; pp. 2618–2622. [Google Scholar] [CrossRef]
  62. Mat, F.C.; Mokhtar, S.E.B.; Hisyam, M.B.; Harun, S.W. Smart Power Management System for Ambulance. IOP Conf. Ser. Mater. Sci. Eng. 2020, 854, 012070. [Google Scholar] [CrossRef]
  63. Drinhaus, H.; Schumacher, C.; Drinhaus, J.; Wetsch, W.A. W(h)at(t) counts in electricity consumption in the intensive care unit. Intensive Care Med. 2023, 49, 437–439. [Google Scholar] [CrossRef]
  64. Dieleman, N.A.; Jagtenberg, C.J. Electric ambulances: Will the need for charging affect response times? SSRN 2024. [Google Scholar] [CrossRef]
  65. New Energy and Industrial Technology Development Organization. NEDO, PV-Powered Vehicle Strategy Committee. 2018. Available online: https://www.nedo.go.jp/content/100885778.pdf (accessed on 29 June 2024).
Figure 1. Schematic of solar angles definition.
Wevj 16 00190 g001
Figure 2. Monthly average values of (a) global horizontal irradiance (GHI), (b) direct normal irradiance (DNI), and (c) diffuse horizontal irradiance (DHI) for Palermo, Rome, and Milan in 2020.
Wevj 16 00190 g002
Figure 3. Specific yields of a photovoltaic system.
Wevj 16 00190 g003
Figure 4. Driving-to-standby ratio in different hours of weekdays for Tesla Semi.
Wevj 16 00190 g004
Figure 5. Specific yields of VIPV system which is integrated into ambulance and truck.
Wevj 16 00190 g005
Figure 6. Distribution of daily energy generation across different months for (a) ambulance and (b) truck in Rome.
Wevj 16 00190 g006aWevj 16 00190 g006b
Figure 7. Distribution of daily energy production from ambulance considering different L and R values across various cities in (a) July and (b) December.
Wevj 16 00190 g007
Figure 8. Number of days that the solar range of Tesla Semi is in defined ranges for (a) Palermo, (b) Rome, (c) Milan when L C H = 0 W.
Wevj 16 00190 g008
Figure 9. Daily net energy production from solar cells integrated into the roof of the container for (a) Palermo, (b) Rome, (c) Milan.
Wevj 16 00190 g009
Figure 10. Distribution of daily energy produced by the solar cells integrated into the mobile operating room in (a) July and (b) December for Palermo (PA), Rome (RO), and Milan (MI).
Wevj 16 00190 g010aWevj 16 00190 g010b
Figure 11. Daily energy requirements for various medical equipment in an ICU.
Wevj 16 00190 g011
Figure 12. The minimum daily energy production in July and December for different case studies, parameters, and cities for (a) ambulance, (b) truck, and (c) container and mobile operating room.
Wevj 16 00190 g012aWevj 16 00190 g012b
Table 1. Dimensions and specifications of vehicles.
TypeModelRoof Area (m2)Area Usage (%)
AmbulanceWAS E 5008.1779
TruckTesla Semi34.0096
ContainerDry Cargo28.3095
Mobile Operating RoomExpandable66.1294
Table 2. Performance ratio values for different Italian cities.
PalermoRomeMilan
P V O U T ( k W h · k W P 1   p e r   Y e a r )1564.201520.301382.80
G T I o p t a ( k W h · m 2   p e r   Y e a r )1943.101870.701681.50
P R G e n e r a t i o n (%)80.5081.2782.24
P R C o n v e r s i o n (%)98.0098.0098.00
P R (%)78.8979.6480.60
Table 3. Losses values of different sections of the VIPV system.
Value (%)
Temperature Losses9
MPPT Losses5
DC/DC Conversion Losses5
Battery Charging Losses2
Table 4. Specifications of selected solar cells.
ModelPower (Wp)Cell Efficiency (%)Number of CellsCell Dimension (mm)Module Size (mm)
LE-M2 270 22.7 4 · 18 182 · 91 1755 · 780 · 4
Table 5. Energy obtained with a sensitivity analysis conducted on various parameters.
Parameters
Value
E   ( M W h · Y e a r 1 ) Solar   Range   ( k m · Y e a r 1 )
WAS E 500 Tesla SemiWAS E 500 Tesla Semi
PAROMIPAROMIPAROMIPAROMI
L C H (W)01.891.791.349.549.056.75325330852302763372385402
7001.131.070.808.798.286.09195218511381703066284873
R (%)401.511.421---261124511730---
801.601.511.11---275726071917---
Shading (%)01.791.691.249.509.016.71307829112136760372075371
800.920.860.765.134.814.30158814811315410438493444
Table 6. A summary of the results obtained from the sensitivity analysis conducted on various parameters.
E   ( k W h · D a y 1 ) Required   Battery   ( k W h )
PalermoRomeMilanPalermoRomeMilan
Container β = 0 21.9120.5815.1887.6482.3260.72
1 Axis Tracker27.7126.1118.42110.82104.4573.67
2 Axis Tracker32.2831.1521.46129.13124.6285.84
Mobile Operating Room β = 0 50.6647.5835.09202.64190.32140.36
1 Axis Tracker64.160.4542.66256.4241.8170.64
2 Axis Tracker75.372.6950.27301.2290.76201.08
Table 7. CO2 emissions reduced values for WAS E 500 and Tesla Semi.
ParametersValueWAS E 500 Tesla Semi
Reduced   Emissions   ( T o n C O 2 · Y e a r 1 )
PalermoRomeMilanPalermoRomeMilan
L C H (W)00.490.470.352.482.351.75
7000.290.280.212.282.151.58
R (%)400.450.430.30---
800.480.450.33---
Shading (%)00.460.440.322.472.341.74
800.240.220.201.331.251.19
Disclaimer/Publisher’s Note: The statements, opinions and data contained in all publications are solely those of the individual author(s) and contributor(s) and not of MDPI and/or the editor(s). MDPI and/or the editor(s) disclaim responsibility for any injury to people or property resulting from any ideas, methods, instructions or products referred to in the content.

