Article

Modeling and Technical-Economic Analysis of a Hydrogen Transport Network for France

1
Territoires Villes Environnement Société—ULR 4477, Université du Littoral Côte d’Opale, 59140 Dunkerque, France
2
Center for Operations Research and Econometrics, Université Catholique de Louvain, 1348 Ottignies-Louvain-la-Neuve, Belgium
*
Author to whom correspondence should be addressed.
World Electr. Veh. J. 2025, 16(2), 109; https://doi.org/10.3390/wevj16020109
Submission received: 23 January 2025 / Revised: 6 February 2025 / Accepted: 11 February 2025 / Published: 18 February 2025

Abstract

:
This work aims to study the technical and economical feasibility of a new hydrogen transport network by 2035 in France. The goal is to furnish charging stations for fuel cell electrical vehicles with hydrogen produced by electrolysis of water using low-carbon energy. Contrary to previous research works on hydrogen transport for road transport, we assume a more realistic assumption of the demand side: we assume that only drivers driving more than 20,000 km per year will switch to fuel cell electrical vehicles. This corresponds to a total demand of 100 TWh of electricity for the production of hydrogen by electrolysis. To meet this demand, we primarily use surplus electricity production from wind power. This surplus will satisfy approximately 10% of the demand. We assume that the rest of the demand will be produced using surplus from nuclear power plants disseminated in regions. We also assume a decentralized production, namely, that 100 MW electrolyzers will be placed near electricity production plants. Using an optimization model, we define the hydrogen transport network by considering decentralized production. Then we compare it with more centralized production. Our main conclusion is that decentralized production makes it possible to significantly reduce distribution costs, particularly due to significantly shorter transport distances.

1. Introduction

Currently, climate change and the depletion of fossil fuel reserves are issues at the heart of global concerns, particularly in the transportation sector, which alone represents 31% of C O 2 emissions in France. Therefore, with the aim of drastically reducing these emissions in the coming years, new resources, methods, and strategies are needed in order to respond to this problem.
Today, fossil fuels dominate the electricity production sector in many countries. As a result, significant research is taking place to develop sustainable energy systems [1,2]. One solution is the electrification of vehicles for road transport, provided that the electricity is produced from low-carbon energy sources. However, a weak point of these vehicles is the battery recharge time, making their use very difficult or even impossible in certain sectors [3]. Therefore, the use of hydrogen for road transport appears to be a concrete solution to this problem, provided that it is produced from energies with a low-carbon footprint, such as wind turbines or nuclear power plants.
In the future, it is estimated that hydrogen will become the second-largest energy vector behind electricity [4]. It is reasonable to think that these are mainly car users who drive long distances (more than 20,000 km/year) who will adopt fuel cell electrical vehicles. However, the development of a network of production and transport of hydrogen will require the implementation of numerous infrastructures in the coming years.
This problem was studied for France by André et al. [5], considering the problem of having an optimal design of a hydrogen transmission network. The application to the case of the development of future hydrogen pipeline networks in France has been conducted at the national level. They consider a unique production point for hydrogen in France and a high level of use of hydrogen for particular cars. André et al. [6] consider that pipeline networks compete with other hydrogen carriers: compressed gas trucks and liquid cryogenic trucks. In the paper, they deal with the determination of the temporal deployment of a new hydrogen transportation infrastructure. They showed that, for the midterm perspective and a low market share, trucks are the most economical options. This problem was also studied for Germany by Reuß et al. [7]. They consider a central production in the north of the country near big wind farms. For a review of hydrogen production and supply chain modeling and optimization, see Jefferson et al. [8].
The novelties of this work compared with existing studies concern three aspects. First, we consider a hydrogen market share that is significantly more reasonable than the large market share in previous studies. Second, we consider production delocalized in regions rather than national production. Third, we only use water electrolysis to produce hydrogen from low-carbon electricity. As indicated by Akyuza et al. [9], electrolysis is an environmentally friendly process even if it is not the means currently mainly used to produce hydrogen, especially due to its cost. As indicated by Kato et al. [10], if large quantities of hydrogen need to be produced from renewable resources via the electrolysis process, the by-product oxygen should be fully utilized. The oxygen produced can be used for semiconductor production, wastewater treatment, or medical use, therefore reducing the cost of hydrogen production.
However, in the current state of knowledge, the creation of a hydrogen transport network produced from low-balance energy carbon to meet part of the demand from the transport sector appears to be a realistic solution, especially since predictions of energy production by wind turbines and nuclear power plants in the coming years should be able to satisfy this request. As the consultant Capgemini [11] indicates in its report on wind power in France, the current growth is 21% per year, and wind power is constantly growing in the French electricity mix. Compared with a country like Germany, the growth potential is also very high in France. The increase in electricity production by wind turbines will thus be able to compensate for possible closures of nuclear power plants.
Therefore, the general problem of this work is to study the feasibility of a hydrogen transport and distribution network for cars in France in 2035 using decentralized production by electrolysis of water from low-carbon electricity.
In order to answer this problem, we will answer the following research questions:
  • What will be the total demand for hydrogen in France in 2035 for the road transport sector, considering that only car users who drive long distances (more than 20,000 km/year) will switch to fuel cell electrical vehicles?
  • Will the energy supply of wind origin be available for the production of green hydrogen for road transport?
  • Will the energy supply from nuclear power plants be available for the production of hydrogen with low-carbon emission?
  • What is the cost of the considered hydrogen transport network?
  • Is centralized or decentralized hydrogen production better economically?
Regarding demand for hydrogen, let us remember that, unlike existing works, we are adopting a much more realistic approach. As indicated by De Wolf and Smeers [3], it is more reasonable to think that only heavy car users may be interested in the advantages of hydrogen: loading time is only 3 minutes, and fuel cell electrical vehicles have greater autonomy than battery cars (see Table 1, page 2, of De Wolf and Smeers [3]). We therefore consider here, for each region of France, users driving more than 20,000 km per year.
The rest of the article is organized as follows: In Section 2, we calculate the hydrogen demand for the transport sector in 2035 and the surplus electricity production from wind turbines and nuclear power plants to meet this demand. Section 3 presents a mathematical model that makes it possible to define the hydrogen transport network. Section 4 presents the calculation of the complete cost of the hydrogen transport network for France in 2035 and compares cases of a centralized production (German case) and that of a decentralized production (French case). Finally, we conclude in Section 5 and give some ideas for future research on the subject of evaluating the costs of the transport and distribution of hydrogen for road transport.

2. Demand and Supply

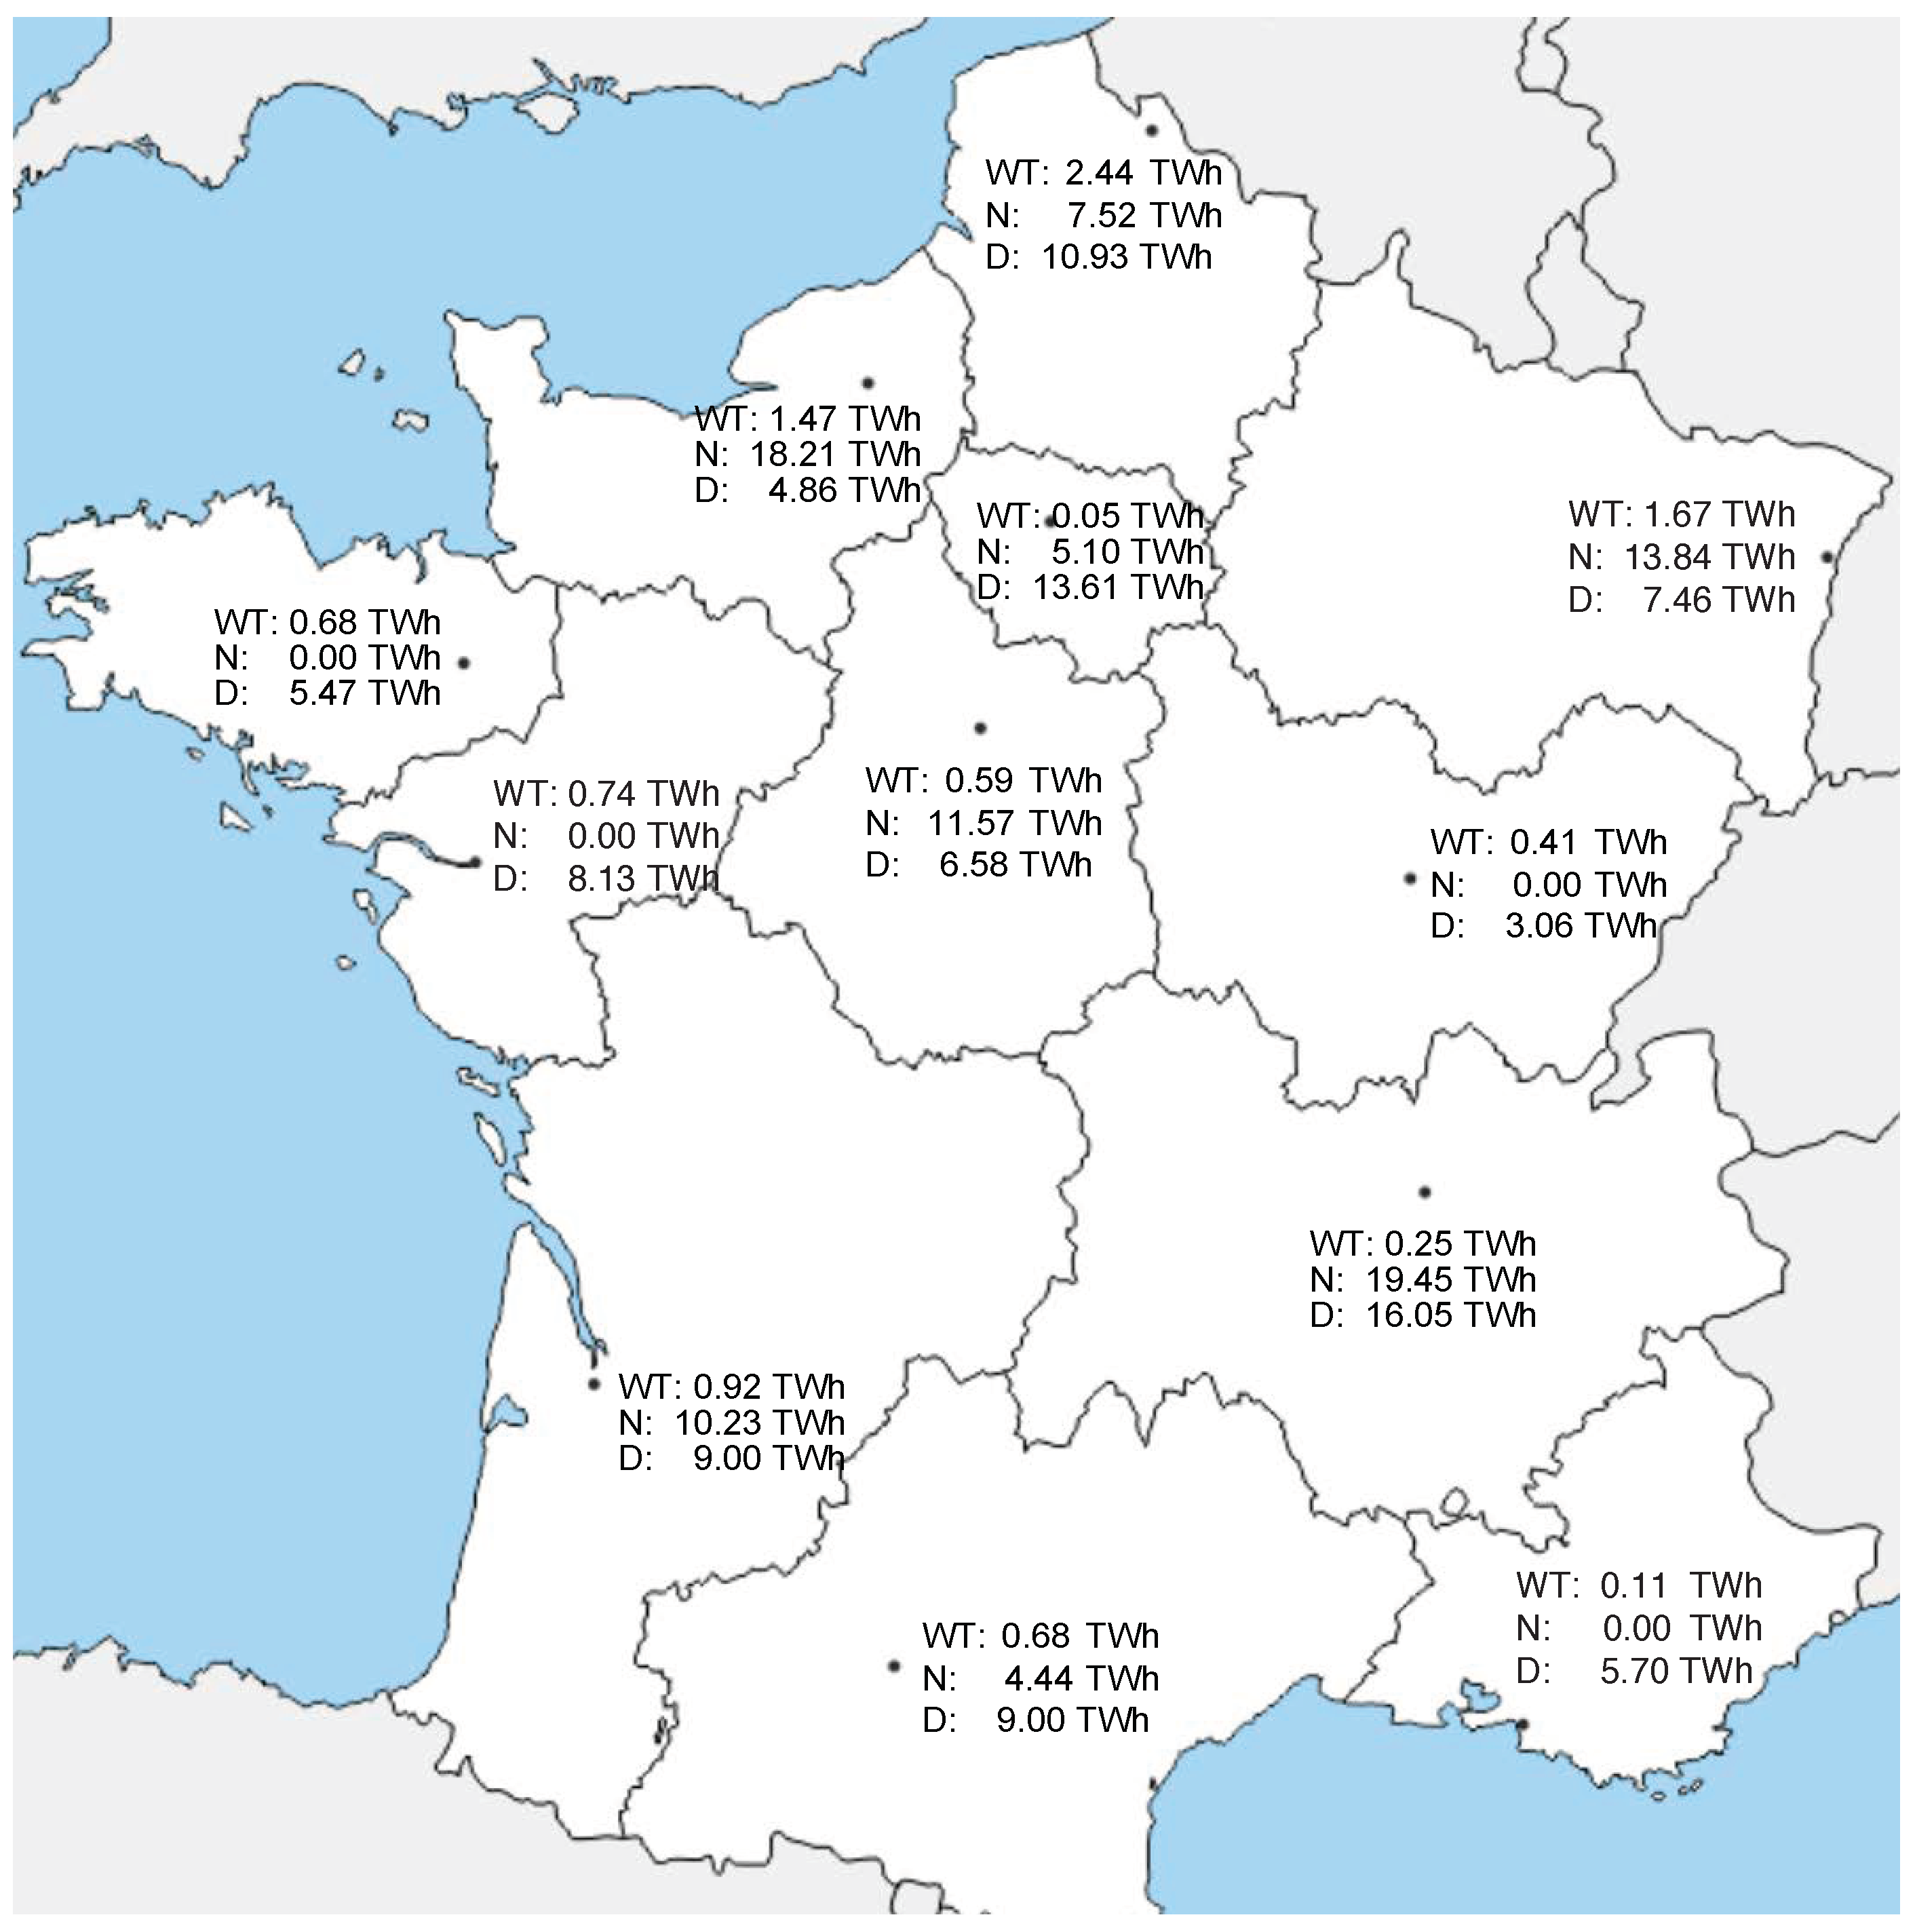
2.1. Demand of Hydrogen

To compute the future demand for hydrogen for road transport in France in 2035, we make the following assumptions:
  • The proportions of drivers driving more than 20,000 km per year are currently well known by region in France. It is assumed that these proportions will remain the same in 2035 (see Table 1).
  • It is assumed that it is necessary to have 1 kg of hydrogen to travel 100 km for a fuel cell electrical vehicle (see Maruta [12]).
  • It is necessary to have 60.9 kWh of electricity, which includes the following (see Pierre [13]):
    • 56 kWh of electricity per kg of H2 for electrolysis of water;
    • 4.9 kWh of electricity per kg of H2 to compress at 900 bars (necessary because it needs 700 bars in the car).
Table 1 presents the hydrogen demand by region in 2035 and the necessary quantity of electricity to produce and compress this hydrogen.
If we sum theses quantities all over France, we conclude that the total electricity demand per year to produce hydrogen for the transport sector is 100.37 TWh per year (See Table 1). As noted by Ramirez et al. [14], 9 L of water is needed to produce 1 kg of hydrogen by electrolysis. However, additional volume is required for water purification and results in a total water consumption of 20–30 L per kg. Note that the cumulative water consumption of all green hydrogen is less than the 20 to 40 L/kg of water necessary for the production of fossil-based hydrogen. As Torregrossa [15] indicates, this water consumption will have little impact on the overall consumption. It will only represent 0.33% of the total water consumption in the planet. For the french case, using the high range of 30 L of water per kilogram of hydrogen, we have an annual water consumption of 4.94 million cubic meters. It can be compared with the 5.2 billion cubic meters of drinking water consumed in France per year (See [16]). This therefore represents 0.10%, a drop in the ocean.

2.2. Wind Electricity Surplus for Hydrogen

To compute the surplus of wind turbines available in 2035 to produce green hydrogen, we make the following assumptions:
  • The efficiency of wind turbines, namely, the average production divided by the nominal power, is 24% for onshore turbines (see Alterna [17]) and 34% for offshore turbines (see Le Figaro [18]).
  • Tlili et al. [19] determined that 7.9 TWh per year was produced in surplus by renewable energies in France in 2017. In 2017, France produced 84.26 TWh of electrical energy, thanks to these renewable sources. Therefore, a good estimate of the percentage of renewable energy allocable to hydrogen production is 9.38%. We assume that this factor will be used and applied only to wind energy in our case.
Table 2 presents the excess production of wind turbines computed by region in France in 2035.
If we sum theses quantities all over France, we conclude that the total energy from wind turbines that can be used to produce green hydrogen is 10.1 TWh (See Table 2). This is approximately 10% of the demand for electricity to produce the hydrogen total demand for the road sector in 2035.
This naturally leads to the third question. Will the surplus production of nuclear power plants in France in 2035 be sufficient to meet the remaining 90%?

2.3. Surplus Nuclear Electricity for Hydrogen

In France, there are 56 reactors in 18 sites for an energy capacity of 61.4 GW in 2024. However, by 2035, it is estimated that the total energy capacity produced by nuclear power will be 46.4 GW due to, among other things, the age of the power plants. Estimated values of the reduction in the capacity of nuclear power plants by 2035 in each region in France were calculated by Tliti et al. [19]. These values are deduced from the actual capacity of existing nuclear plants.
To compute the excess of the production of nuclear plants in France in 2035 available to produce hydrogen, we make the following assumptions:
  • The efficiency of nuclear plants, namely, the average production divided by the nominal power, is 85%.
  • The annual production of nuclear plants in France in 2017 is 379.1 TWh (see Ministère du Développement Durable [20]). We know that the nominal capacity of the parks is 61.4 GW, corresponding to a theoretical maximum annual production of 553.02 TWh. The actual excess production of nuclear plants France is thus:
    1 379.1 553.02 = 31.45 %
    We suppose that the same proportion will remain available in 2035.
Table 3 presents the excess production of nuclear plants in France in 2035.
However, it must also be taken into account that nuclear power plants do not not work at 100%, but on average at 85%. This percentage takes into account the maintenance and refueling periods. Finally, the power available will be: 127.77 × 0.85 = 108.60 TWh. It is clear that this amount is sufficient to fill the gap of electricity produced by wind turbines to satisfy the demand for hydrogen (90.36 TWh).
As we make the hypothesis that we first use the excess of the production from wind turbines, and then, for the missing part, the excess of the production of nuclear power plants, we conclude that the supply used from nuclear electricity will be 90.36 TWh, the part of the total demand not furnished by wind turbines surplus.
It should be noted that to reach this level of production surplus, electricity production by nuclear power plants will have to be increased by 32.44% by 2035 to meet the demand for hydrogen from the road transport.
Figure 1 presents, for each region in France, the surplus electricity from wind turbines (WT), the surplus electricity from nuclear power plants (N) mobilized to produce hydrogen, and the region’s electricity demand (D) to produce the region’s demand for hydrogen. Remember that we have chosen to locate production locations close to low-carbon electricity sources in France, that is to say near large offshore wind farms and near nuclear electricity production centers.
We see that electricity supply is not at all balanced with demand region by region. We will see in Section 3 how to define optimal transfers between surplus regions and demand regions. However, before that, we say a word about the location chosen in our model for the electrolyzers and how to calculate the number of electrolyzers per production point.

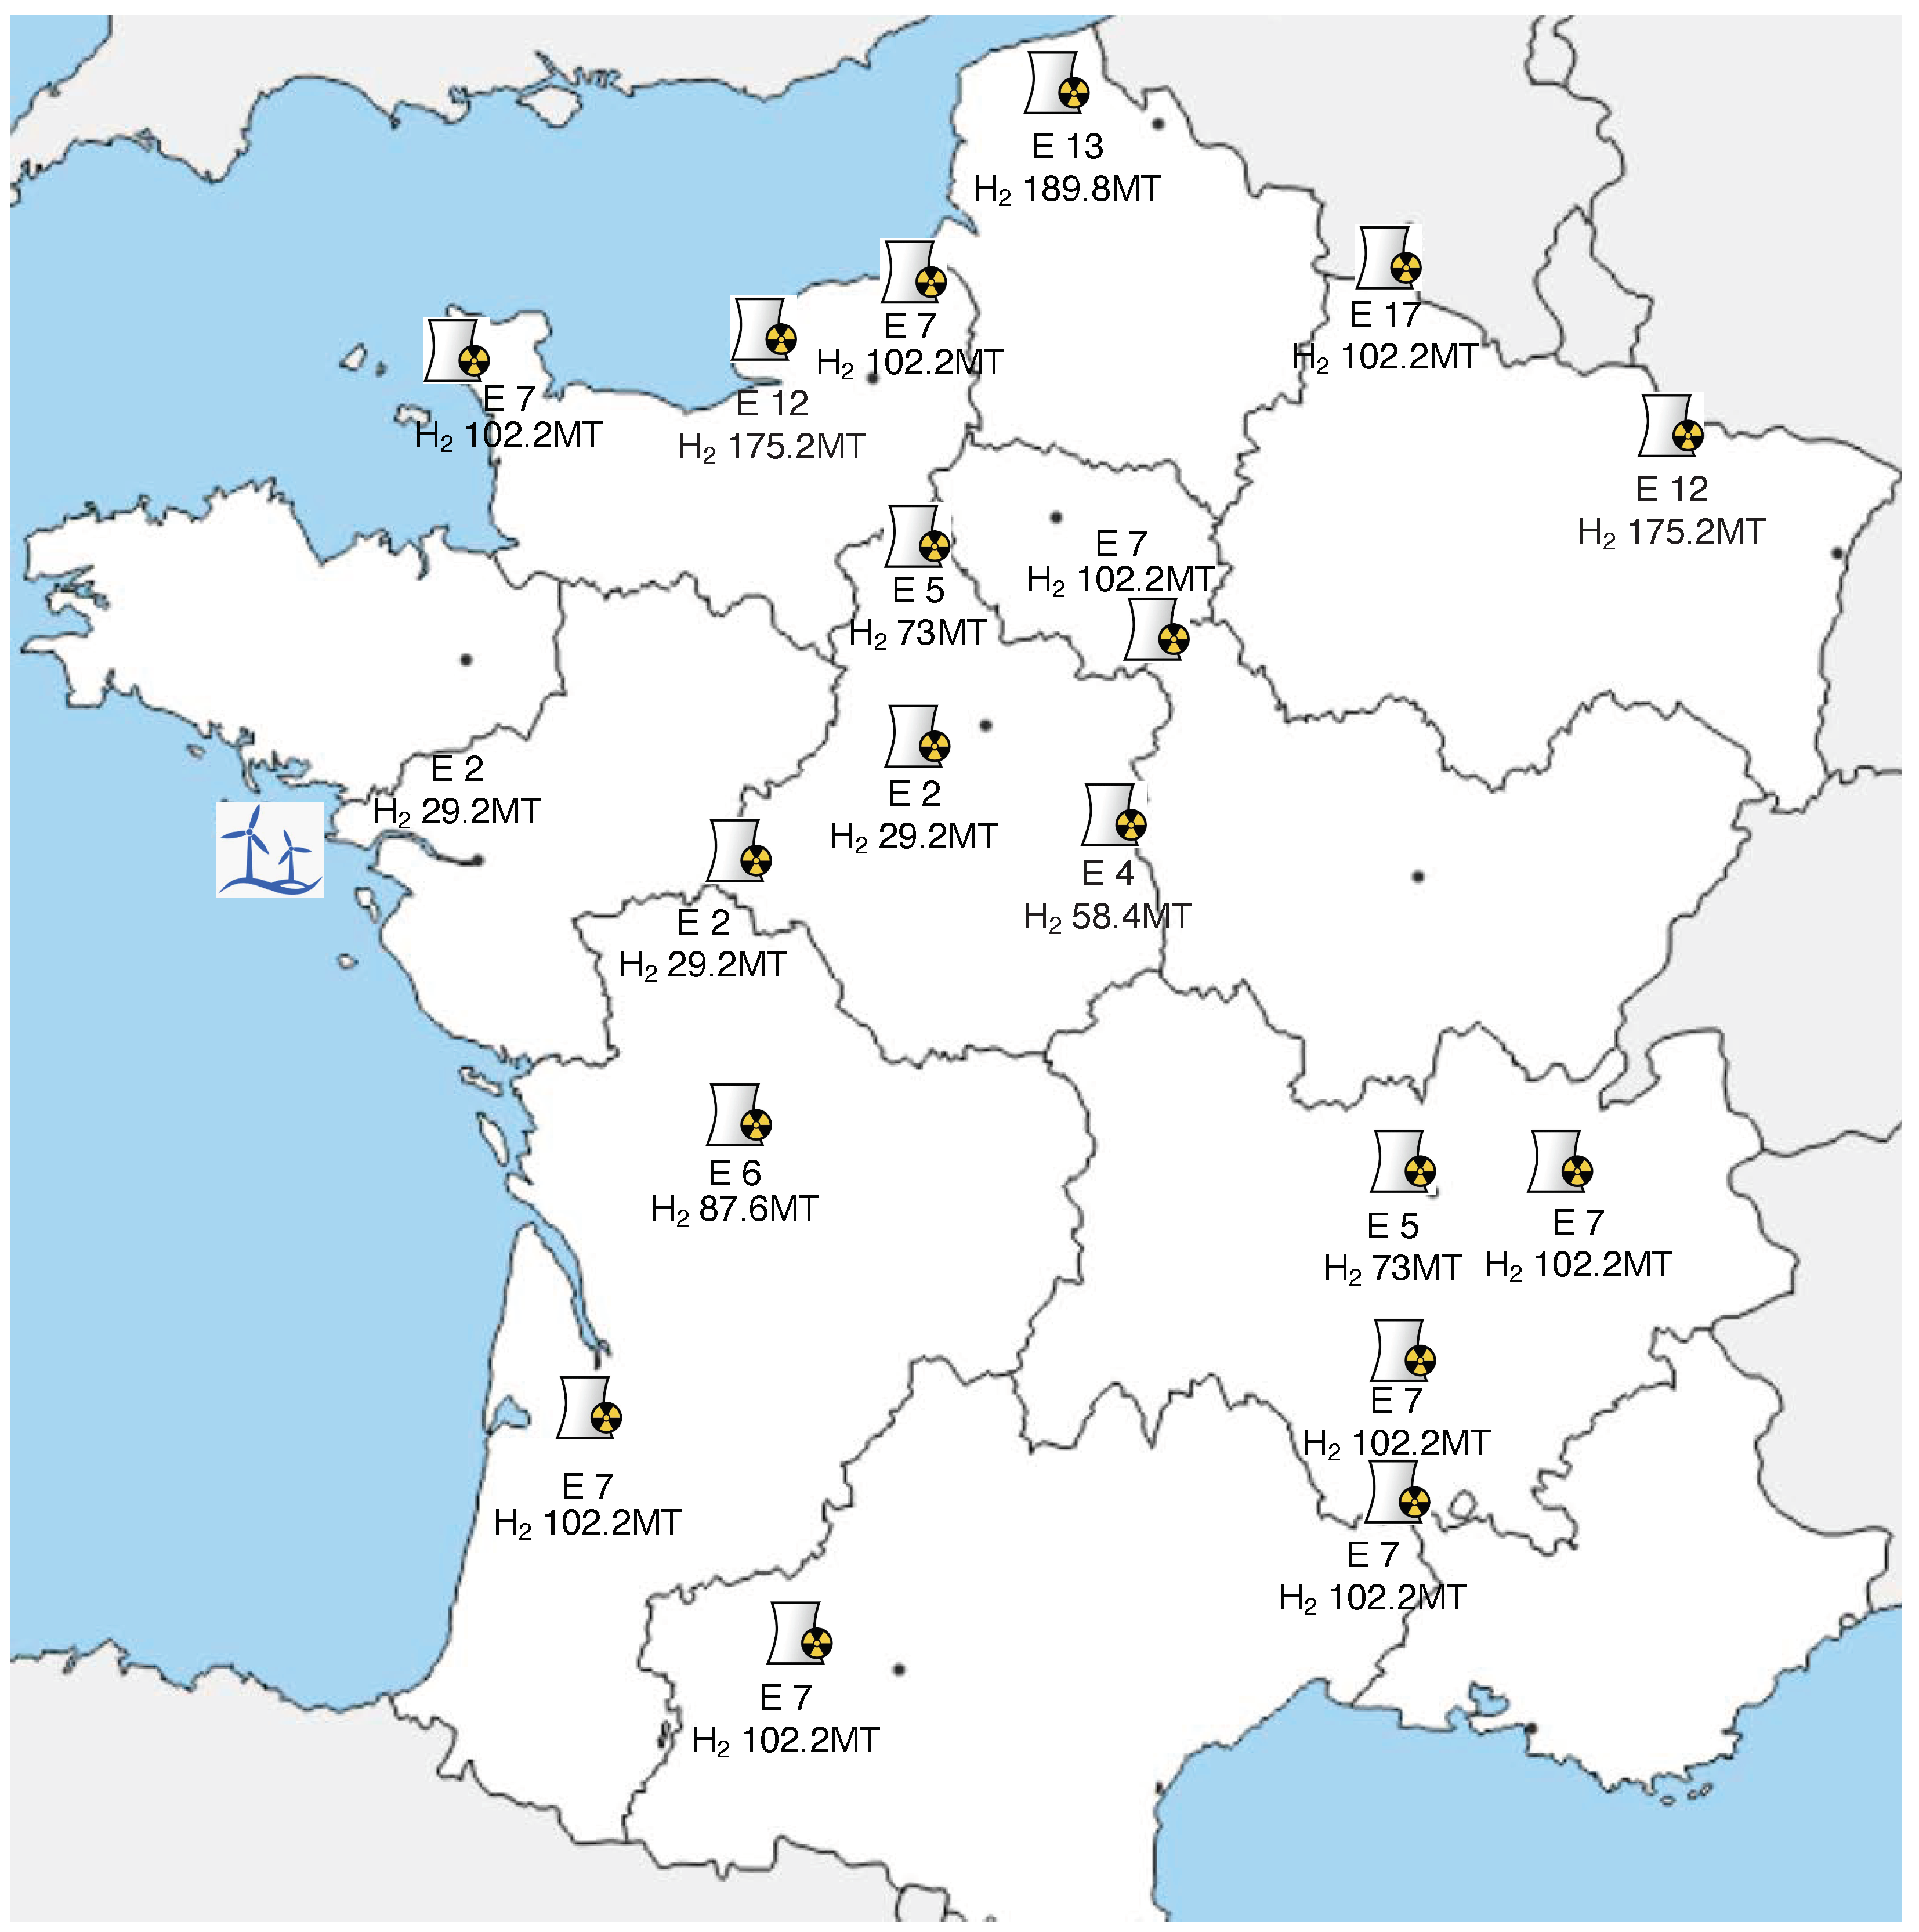
2.4. Location and Number of Electrolyzers

We make the following assumptions concerning the location of the electrolyzers:
  • For electrolyzers using nuclear electricity, we assume a location close to the source, namely, close to the nuclear plants (see Figure 2).
  • For electrolyzers using onshore wind electricity, since onshore wind turbines are disseminated all over France, we assume a location close to nuclear plants, and we use the grid to transport electricity from the supply point (the wind turbine) to the production point (the electrolyzer).
  • For electrolyzers using offshore wind electricity, we assume a location close to the important wind farm of Saint-Nazaire (see Figure 2).
To compute the number of electrolyzers for each H2 production point, we assumed that this number is proportional to the source’s power, and we suppose that we use electrolyzers with a nominal power of 100 MW.
Figure 2 presents the number of of electrolyzers (E) and the total hydrogen production (H2) for each location of a hydrogen production point.

3. Network Design

Now that we have determined the hydrogen demand for each of the regions (see Table 1) and we have determined the decentralized hydrogen production in the different locations illustrated in Figure 2, it is necessary to match supply to demand by assigning each demand point to the closest hydrogen production sources. Indeed, as we justify below, we will use trucks to transport hydrogen over short distances (less than 400 km in each case) from a place of production to a place of demand. It is well known that the cost of truck transportation is proportional to the quantity transported and the distance traveled (see van der Meulen [21]). We will therefore define an optimization model whose objective is to assign the demand of the region to the nearest supply points.
We make the following assumptions to define the mathematical program:
  • The demand of each region is assumed to be located in the largest city of the region, thus in one point for each region.
  • Hydrogen is transported by truck with hydrogen in gaseous form for distances shorter than 130 km and in liquid form for longer distances (see Reuß et al. [7]).
  • The transportation cost is assumed to be proportional to the traveled distance and to the quantities of hydrogen transported.
Let us stop for a moment to justify the choice of transporting hydrogen by truck. Indeed, as indicated by Sophanna [22], if gas pipelines constitute the most economical way of transporting hydrogen with an operating cost lower than that of transport by truck, the reason why most transport is done by truck for a short distance is the very large difference in investment costs. As Yang [23] indicates, trailers with compressed hydrogen gas are the most economical for short distances (100–200 km) to satisfy the demand of customers who do not require very large quantities. Hydrogen can also be transported in liquid form by truck. This is the most economical solution according to Reuß et al. [7] for distances greater than 130 km. As we are going to compare our decentralized production model with the more centralized model of Reuß et al. [7], we adopt the same tipping point between gas trucks and liquid trucks.
The variables of the problem are the following: x e , r is the quantity of hydrogen transported from the electrolyzer e to the region r [kT]. Recall that several electrolyzers can be located near the same electricity source (power plant or wind turbine farm).
The objective function is the minimization of the total distance traveled by the trucks times the quantity of hydrogen transported, as follows:
min z = e = 1 19 r = 1 13 d i s t e , r x e , r
where d i s t e , r is the distance between e and r [km].
The constraints of the problem are the following:
  • For each supply point, the total quantity of hydrogen for all demand regions cannot exceed the total supply of hydrogen, as follows:
    r = 1 13 x e , r S U P P e , e
    where S U P P e is the total supply of hydrogen of e.
  • For each demand point, the total quantity of hydrogen coming from all sources must satisfy the demand of the region, as follows:
    e = 1 19 x e , r D E M r , r
    where D E M r is the total demand of hydrogen of the region r.
  • They are, of course, also the non-negativity constraints on all variables, as follows:
    x e , r 0 , e r
The model is a purely linear program and can be solved by GAMS (General Algebraic Modeling System) [24]. The optimal solution of the software GAMS/CPLEX is given in Table 4.
The rows in the table represent the different production locations (nuclear power plants or offshore wind farms). The columns of the table represent the main cities of each region considered in our model.
The quantities shown in Table 4, therefore, indicate the total quantity (in KT) of hydrogen produced by the electrolyzer location e transferred to the demand region r. For example, 89.78 KT of hydrogen produced in Flamanville is sent to the Rennes region.
Let us end this section by saying a word about the limits of the model. We consider a constant cost per tonne kilometer in our model. We could also take into account the uncertainty in transport costs. However, as Wang and Wu [25] show, uncertainty can have a negative, negligible, or even positive effect on transport costs. We therefore chose not to take this aspect into account. Another limitation of our model is that it does not take into account a possible regulation of the transport market. As noted by Vickerman [26], transportation requires both consistent pricing policies and infrastructure investment. However, this aspect goes well beyond the scope of this model.

4. Network Cost

Now that our optimization model has determined what quantities to transport by truck, the final step is to calculate an approximate cost of the transport network. It is important to note that only transport network costs are considered. The costs of building electrolyzers, producing hydrogen, storage, and stations are not analyzed in this work.
As determined by Reuß et al. [7] and André et al. [5], the following two types of transport must be considered:
  • For a distance of less than 130 km, it is more advantageous in terms of costs to transport hydrogen in gaseous form.
  • For a distance of more than 130 km, the liquid form is preferred.
For each transport line ( e , r ) , the cost is therefore calculated according to the distance of the line and the parameters presented in Table 5 are considered. Note that, for a comparison with the German case studied by Reuß et al. [7], most of the amounts are taken from this study except the price of diesel taken from INSEE [27].
The first step is therefore to calculate N C e r , the number of trucks necessary for the transport of quantities of hydrogen determined on the chosen lines ( e , r ) . The following formula is therefore applied to each line ( e , r ) :
N C e r = H 2 , e r × 2 × d i s t e r T r a i l e r c a p a c i t y × A v e r a g e d i s t a n c e
where H2,er is the hydrogen total quantity transported by year on line ( e , r ) and d i s t e r is the distance in km from e to r. The trailer capacities for gaseous H2 and for liquid H2 are given in Table 5. The average distance traveled per year by a truck is also given in Table 5.
Then, the following five components are taken into account in order to estimate the cost for each line ( e , r ) :
  • The initial investment for the tractor and trailer;
  • The salary of drivers during the year;
  • The fuel consumption of trucks;
  • The cost of operating and maintaining equipment;
  • The cost of French highways for trucks (class 4 vehicle).
We will now be able to compare the French cases with a more decentralized production and the German case with a more centralized production in the north of the country in order to determine which is the most economical solution (centralized or decentralized production).

4.1. The German Case

The German case was already studied by Reuß et al. [7]. They make the following assumptions in their model:
  • They consider 15 sources of hydrogen production by water electrolysis, all located in the north of Germany.
  • They consider 96,083 hydrogen recharging stations scattered throughout the country.
  • The transport of hydrogen is done by trucks with H2 in gaseous form for a distance of less than 130 km and by trucks H2 in liquid form for a greater distance.
The method of assigning each demand point (blue points in Figure 3) to a production source (green points in Figure 3) is the shortest path method (Dijkstra method). Figure 3 presents the results of the study of Reuß et al. [7].
The two main results of the model are as follows:
  • On the one hand, a total transport price of EUR 0.73 per kilo of hydrogen transported is computed by dividing the total cost of the network by the total H2 transported per year.
  • On the other hand, the average distance traveled between the supply points and the charging station is 430 km.

4.2. The Case of France

For the French case, we make the following assumptions:
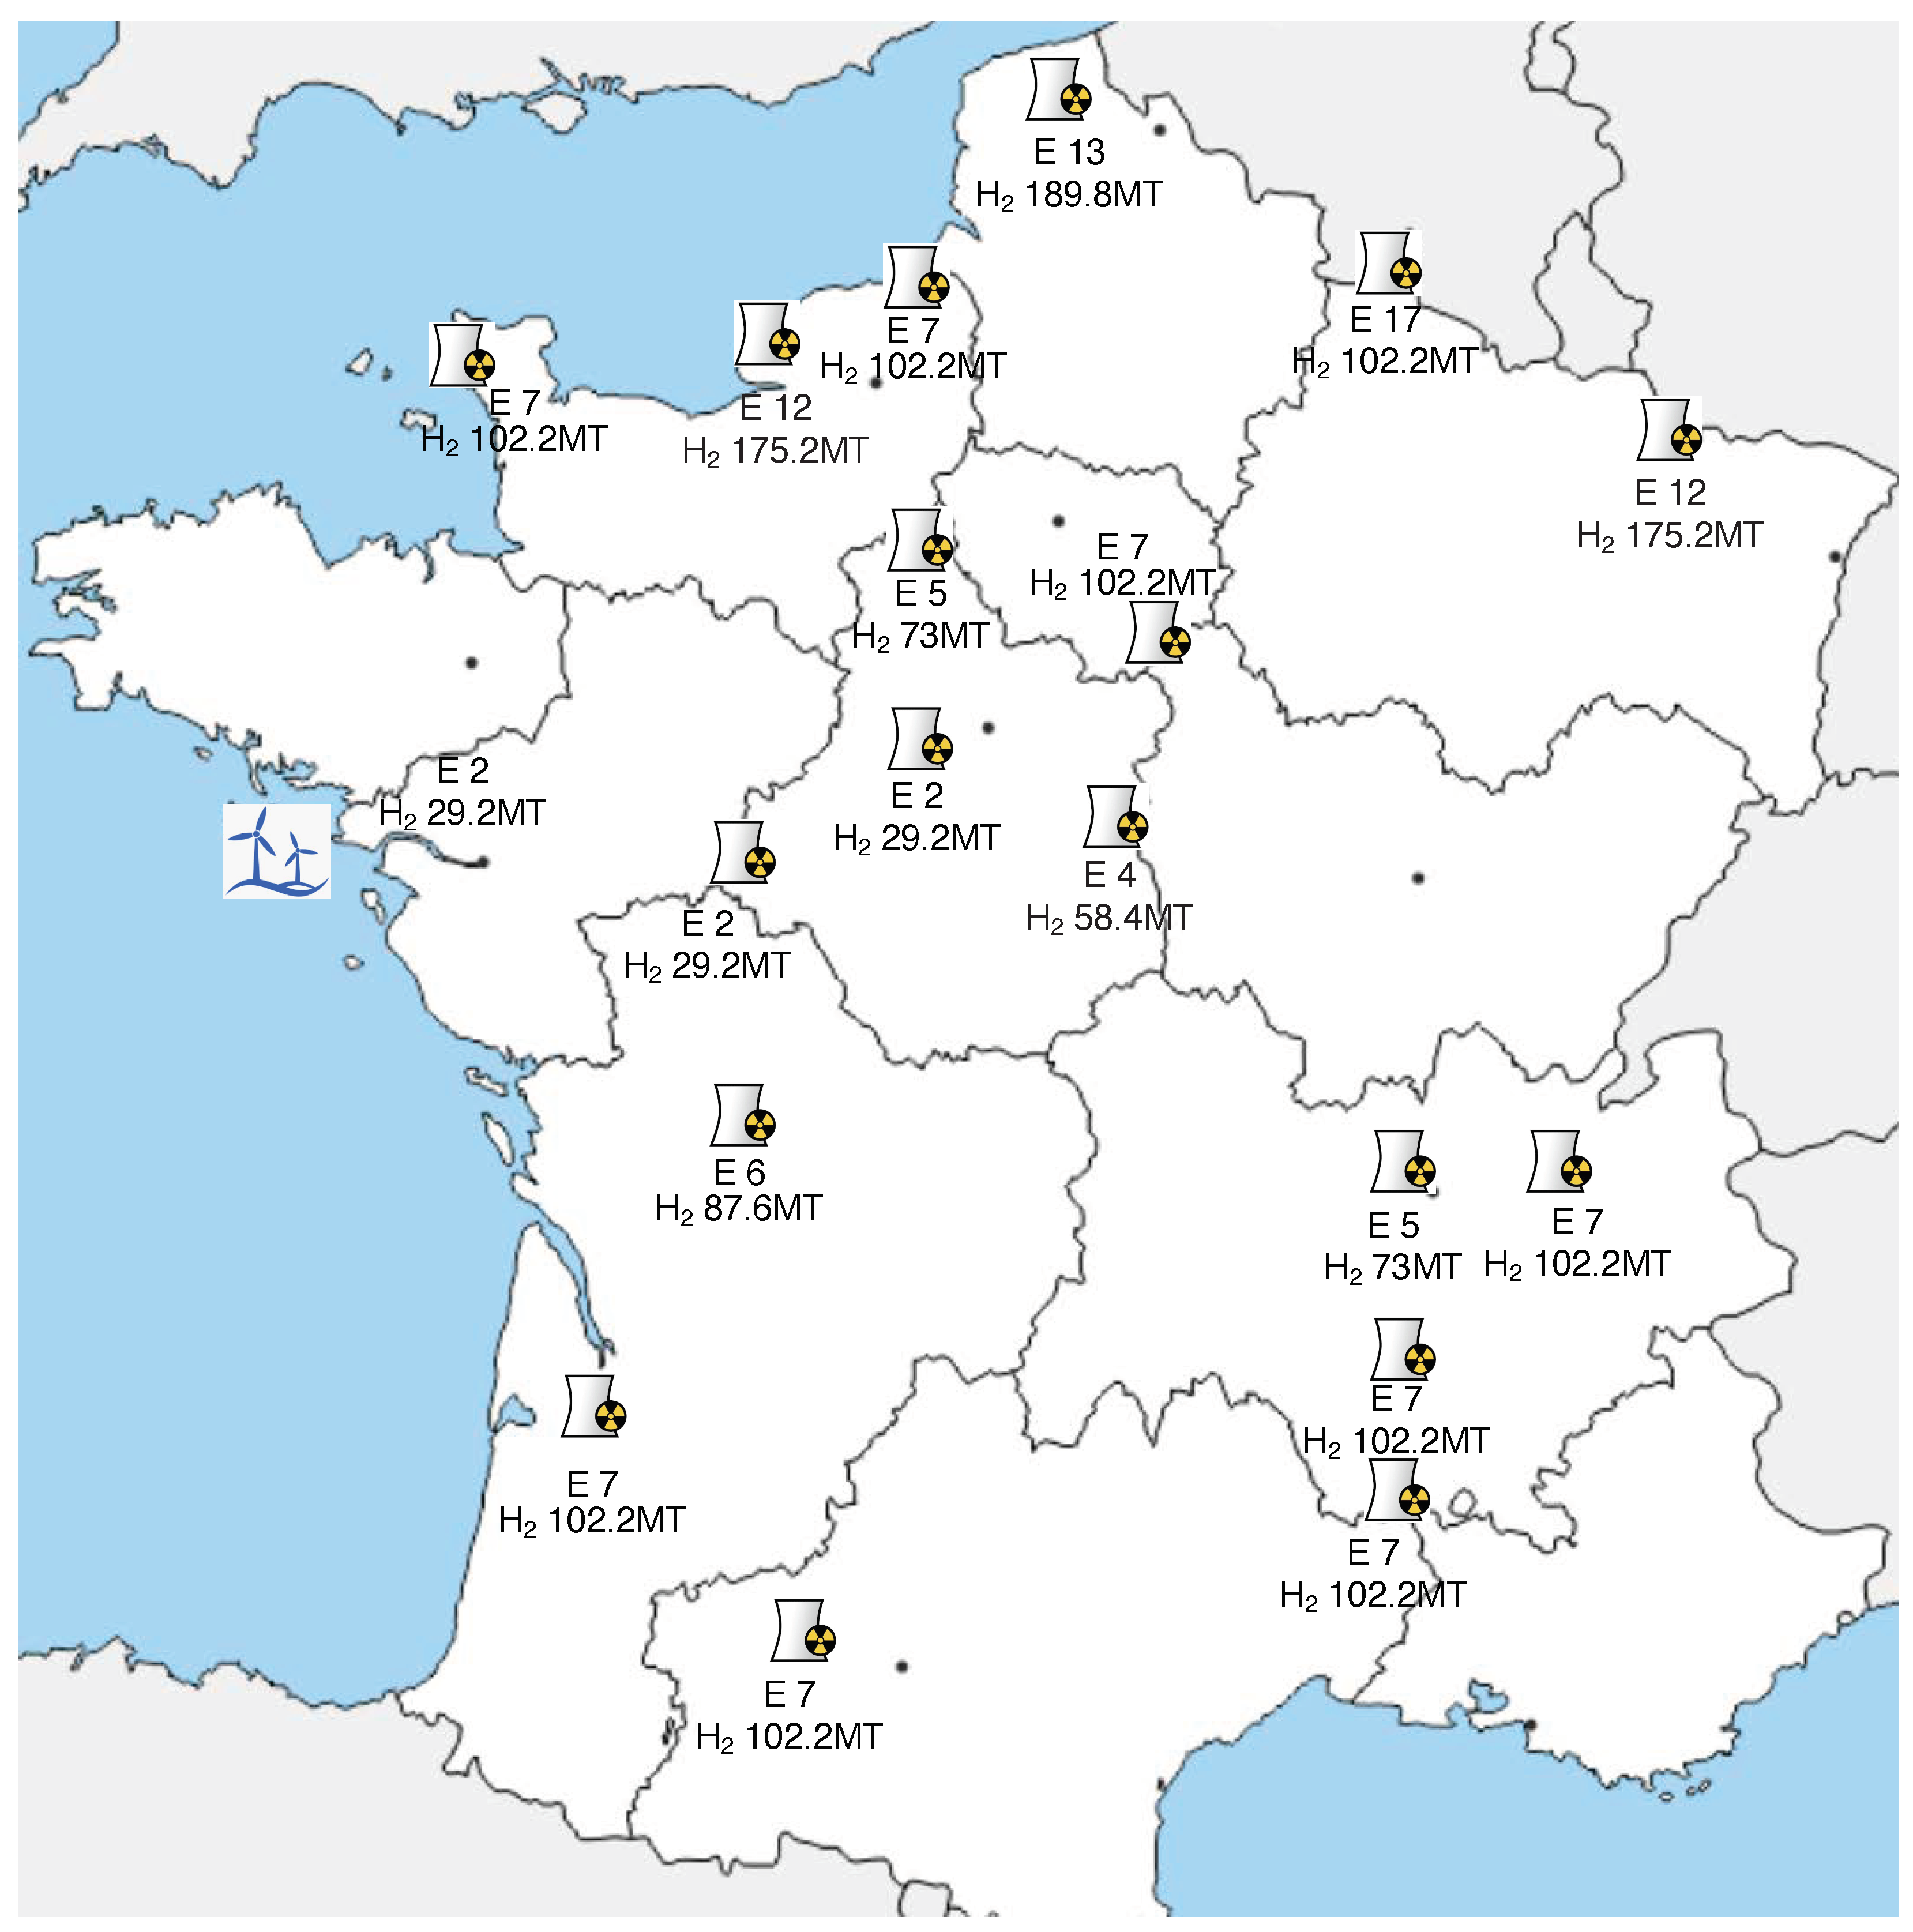
  • We consider 19 sources of hydrogen production by electrolysis (located near wind turbines farm or near nuclear power plants) distributed across the different regions in France (see Figure 4).
  • We consider 13 demand points, one per region situated in the biggest city of the region.
  • Hydrogen is transported by trucks with H2 in gaseous form for distances less than 130 km and in liquid form for greater distances.
The method of assigning each demand point to a production source is to minimize the total distance traveled by trucks. Figure 4 presents the results of our model applied to the French case.
The two main results of the model are as follows:
  • On the one hand, we computed a total transport price of EUR 0.31 per kilo of hydrogen transported.
  • On the other hand, we computed an average distance traveled between the supply points and the centers of the regions of 160 km.

5. Conclusions

The main objective of this paper is to evaluate the feasibility of setting up a hydrogen transport network to answer to the future demand for hydrogen for road transport in France in 2035, the hydrogen being produced from the surplus of wind turbines and nuclear plants in France.
Our first conclusion is that by taking into account the onshore and offshore wind turbines’ excess in production in 2035, only 10% of the future demand for hydrogen from road transport in France will be satisfied.
Our second conclusion is that the remaining 90% of the demand for hydrogen from road transport in France in 2035 can be produced by the excess in production from nuclear plants in France in 2035.
Our third conclusion is that the total transport cost is EUR 0.31/kg per kilo of hydrogen transported for France and that the average distance between a local source of hydrogen and the center of the demand region is 160 km.
Our fourth conclusion is that the comparison with more centralized production in Germany gives a reduction of a factor of 2.35 for our distribution cost with decentralized production, especially due to shortest distances: the average distance between a source and a demand region is divided by 2.7 in our decentralized model. We can now answer to the last question. The conclusion is that decentralized production of hydrogen is more economical than a centralized hydrogen production.
Finally, let us emphasize the limitations and possible improvements of the model. First of all, we made a lot of assumptions about the future: proportion of car users who switch to fuel cell electrical vehicles, public investment in wind turbines, and share of production that can be used for the production of green hydrogen. All these will probably be strongly influenced by the political decisions that will be taken in terms of transport and energy over the next 10 years. In addition, the hypothesis of only considering the surplus of different energy sources with a low-carbon footprint seems quite simplistic with a view to setting up such a green hydrogen transport network.
Then, the network studied is simpler than a distribution network that can reach every citizen relatively easily on a French territory. To hope for a mass adoption of hydrogen vehicles, greater availability at demand points will be necessary. This will necessarily increase the average cost of transport.
However, the most important point for the future is that it will be essential to carry out a study of the entire hydrogen supply chain in order to determine the feasibility of such a network. Indeed, this work only focuses on the transport part and a little on production. Therefore, a necessary perspective would be to carry out the same type of analysis on the stages of production, storage, and connection to hydrogen stations. For example, our model does not consider the economies of scale that could be made when investing in electrolyzers more centrally rather than distributing them across regions. Our problem also does not analyze the dependence on the electricity network, which is used to bring surpluses from onshore wind turbines. A cost benefit analysis comparing centralized and decentralized infrastructure investments and grid dependence would provide a more comprehensive assessment of economic trade-offs. This study could constitute a very useful extension of our model.
Another future development of the model concerns sensibility analysis. In fact, hydrogen transport is affected by many factors, wages for drivers, delivery technology (storage, vehicle, capacity), CAPEX and OPEX of the vehicle, etc. It would be meaningful to study the influence of these factors.
Another limitation of the present work is that 90% of the carbon-free electricity supply in our model is based on nuclear electricity production. The seismic disaster in Fukushima showed the fragility of nuclear power plants in the event of an earthquake. In France, historically, nuclear power plants only took into account low-magnetic earthquakes (see Levret et al. [28]). The earthquake in Japan called into question practices in France in terms of taking into account seismic hazards and contributed to establishing new provisions to take into account rarer levels of hazards than those considered for the initial design of nuclear installations. On the other hand, several new dispositions have been taken: the connection of a generator to an ultimate emergency diesel engine, a new water source to account for the total loss of electrical supplies, or the total loss of a cooling source (see IRSN [29]).
Let us end with the following remark. The model presented in this paper can be applied to other countries. However, this requires taking into account the specificities of the country’s energy mix, which can vary greatly from one country to another. Therefore, the possibility of producing green hydrogen will strongly depend on the share of carbon-free electricity sources in the country. Figure 5 presents the electricity mix for each European country (see European Council [30]). We can see the difference in potential between countries.

Author Contributions

Conceptualization, D.D.W.; writing, review, and editing, D.D.W.; software: C.M. and J.S.; validation, D.D.W. All authors have read and agreed to the published version of the manuscript.

Funding

This research received no external funding.

Data Availability Statement

The original contributions presented in this study are included in the article. Further inquiries can be directed to the corresponding author.

Acknowledgments

The authors gratefully acknowledge Jean André from Air Liquide for constructive discussions on the establishment of the model.

Conflicts of Interest

The authors declare no conflicts of interest.

References

  1. Kim, M.; Kim, J. An integrated decision support model for design and operation of a wind-based hydrogen supply system. Int. J. Hydrogen Energy 2017, 42, 3899–3915. [Google Scholar] [CrossRef]
  2. Al-Ghussain, L.; Ahmad, A.D.; Abubaker, A.M.; Hassan, M.A. Exploring the feasibility of green hydrogen production using excess energy from a country-scale 100% solar-wind renewable energy system. Int. J. Hydrogen Energy 2022, 47, 21613–21633. [Google Scholar] [CrossRef]
  3. De Wolf, D.; Smeers, Y. Comparison of battery electric vehicles and fuel cell vehicles. World Electr. Veh. J. 2023, 14, 262. [Google Scholar] [CrossRef]
  4. Galimova, T.; Fasihi, M.; Bogdanov, D.; Breyer, C. Impact of international transportation chains on cost of green e-hydrogen: Global cost of hydrogen and consequences for Germany and Finland. Appl. Energy 2023, 347, 121369. [Google Scholar] [CrossRef]
  5. André, J.; Auray, S.; Brac, J.; Wolf, D.D.; Maisonnier, G.; Ould-Sidi, M.; Simonnet, A. Design and dimensioning of hydrogen transmission pipeline networks. Eur. J. Oper. Res. 2013, 229, 239–251. [Google Scholar] [CrossRef]
  6. André, J.; Auray, S.; Wolf, D.D.; Ould-Sidi, M.; Simonnet, A. Time development of new hydrogen transmission. Int. J. Hydrogen Energy 2014, 39, 10323–10337. [Google Scholar] [CrossRef]
  7. Reuß, M.; Dimos, P.; Léon, A.; Grube, T.; Robinius, M.; Stolten, D. Hydrogen Road Transport Analysis in the Energy System: A Case Study for Germany through 2050. Energies 2021, 14, 3166. [Google Scholar] [CrossRef]
  8. Rieraa, J.A.; Lima, R.M.; Knio, O.M. A review of hydrogen production and supply chain modeling and optimization. Int. J. Hydrogen Energy 2023, 48, 1373–13755. [Google Scholar] [CrossRef]
  9. Akyuza, E.S.; Tellia, E.; Farsak, M. Hydrogen generation electrolyzers: Paving the way for sustainable energy. Int. J. Hydrogen Energy 2024, 81, 1338–1362. [Google Scholar] [CrossRef]
  10. Kato, T.; Kubota, M.; Kobayashi, N.; Suzuoki, Y. Effective utilization of by-product oxygen from electrolysis hydrogen production. Energy 2005, 30, 2580–2595. [Google Scholar] [CrossRef]
  11. Capgemini France, Observatoire de l’éolien, Analyse des Emplois et des Enjeux de l’éolien en France, September 2020. pp. 1–188. Available online: https://www.connaissancedesenergies.org/sites/connaissancedesenergies.org/files/pdf-actualites/obseol2020_web_light_v2.pdf (accessed on 4 February 2025).
  12. Maruta, A. Economics of Hydrogen for Transportation. In Hydrogen Science and Engineering: Materials, Processes, Systems and Technology; John Wiley & Sons, Ltd.: Hoboken, NJ, USA, 2016; pp. 831–848. [Google Scholar]
  13. Pierre, S. Rendement de la Chaîne Hydrogène. Available online: https://www.connaissancedesenergies.org/sites/connaissancedesenergies.org/files/pdf-pt-vue/rendement-chaine-h2_fiche-technique-02-2020.pdf (accessed on 10 May 2024).
  14. Ramirez, K.; Weiss, T.; Kirk, T.; Gamage, C. Hydrogen Reality Check: Distilling Green Hydrogen’s Water Consumption. Available online: https://rmi.org/hydrogen-reality-check-distilling-green-hydrogens-water-consumption/ (accessed on 4 February 2025).
  15. Torregrossa, M. Hydrogène Vert: Quel Impact sur la Consommation d’eau? Available online: https://www.h2-mobile.fr/actus/non-production-hydrogene-vert-impactera-ressources-eau/ (accessed on 4 February 2025).
  16. Ministère de la Transition Écologique et de la cohésion des Territoires, L’eau en France: Ressource et Utilisation—Synthèse des Connaissances en 2023. Available online: https://www.statistiques.developpement-durable.gouv.fr/leau-en-france-ressource-et-utilisation-synthese-des-connaissances-en-2023 (accessed on 4 February 2025).
  17. Alterna Energie, Energie, Décryptage du Rendement d’une éolienne. Available online: https://www.alterna-energie.fr/blog-article/a-la-conquete-du-vent-decryptage-du-rendement-eolien-pour-une-energie-verte-maximale (accessed on 24 March 2024).
  18. Le Figaro, Eoliennes en Mer: Bataille de Chiffres sur la Production du Parc au Large de Saint-Nazaire. Available online: https://www.lefigaro.fr/nantes/eoliennes-en-mer-bataille-de-chiffres-sur-la-production-du-parc-au-large-de-saint-nazaire-20230317 (accessed on 24 March 2024).
  19. Tlili, O.; Mansilla, C.; Robinius, M.; Syranidis, K.; Reuss, M.; Linssen, J.; André, J.; Perez, Y.; Stolten, D. Role of electricity interconnections and impact of the geographical scale on the French potential of producing hydrogen via electricity surplus by 2035. Energy 2019, 172, 977–990. [Google Scholar] [CrossRef]
  20. Ministère du Développement Durable, Bilan Énergétique de la France Pour 2017, Données Et études Statistiques. Available online: https://www.statistiques.developpement-durable.gouv.fr/bilan-energetique-de-la-france-pour-2017 (accessed on 30 March 2024).
  21. Van der Meulen, S.; Grijspaardt, T.; Mars, W.; Van der Gees, W.V.; Roest-Crollius, A.; Kiel, J. Cost Figures for Freight Transport—Final Report, Netherlands Institute for Transport Policy Analysis, Zoetermeer, January 2023. pp. 1–86. Available online: https://www.kimnet.nl (accessed on 5 February 2025).
  22. Sophanna, S. An in Depth Comparison Between the Different Methods of Hydrogen Transportation. 11 March 2024. Available online: https://www.divigas.com/blog/transportation-of-hydrogen (accessed on 5 February 2025).
  23. Yang, M.; Hunger, R.; Berrettoni, S.; Sprecher, B.; Wang, B. A review of hydrogen storage and transport technologies. Clean Energy 2023, 7, 190–216. [Google Scholar] [CrossRef]
  24. GAMS Development Corporation. General Algebraic Modeling System (GAMS) Release 47.1.0. Fairfax, VA, USA, 2024. Available online: https://www.gams.com/download/ (accessed on 5 February 2025).
  25. Wang, W.; Wu, Y. Is uncertainty always bad for the performance of transportation systems? Commun. Transp. Res. 2021, 1, 100021. [Google Scholar] [CrossRef]
  26. Vickerman, R. The transport problem: The need for consistent policies on pricing and investment. Transp. Policy 2024, 149, 49–58. [Google Scholar] [CrossRef]
  27. Institut National de la Statistique et des Études Économiques, Prix Moyens Mensuels de Vente au détail en métropole-Gazole (1L). Available online: https://www.insee.fr/fr/statistiques/serie/000442588 (accessed on 8 May 2024).
  28. Levret, A.; Mohammadioun, B. Determination of seismic reference motion for nuclear sites in France. Eng. Geol. 1984, 20, 25–38. [Google Scholar] [CrossRef]
  29. Institut de Radioprotection et de Sûreté Nucléaire. Suites de l’accident nucléaire de Fukushima Daiichi en mars 2011, March 2016. pp. 1–163. Available online: https://www.irsn.fr/sites/default/files/documents/connaissances/installations_nucleaires/les-accidents-nucleaires/accident-fukushima-2011/fukushima-2016/IRSN-Fukushima-2016.pdf (accessed on 5 February 2025).
  30. European Council. How Is EU Electricity Produced and Sold? Available online: https://www.consilium.europa.eu/en/infographics/how-is-eu-electricity-produced-and-sold/ (accessed on 5 February 2025).
Figure 1. Production and demand in 2035.
Wevj 16 00109 g001
Figure 2. Location and number of electrolyzers.
Wevj 16 00109 g002
Figure 3. The German case. Reprinted from Ref. [7].
Wevj 16 00109 g003
Figure 4. The French case.
Wevj 16 00109 g004
Figure 5. The electricity mix for the European countries. Reprinted from Ref. [30].
Wevj 16 00109 g005
Table 1. Hydrogen demand by region in 2035.
RegionPopulation (Residents)Proportion >20.000 km106 KmH2 [103T]Electricity [TWh]
Corse355,52812%85390.520
Bourgogne-Franche-Comté2,791,7199%5025503.060
Normandie3,327,07712%7985804.863
Bretagne3,453,02313%8978905.468
Provence-Alpes-Côte d’Azur5,198,0119%9356945.698
Centre-Val de Loire2,573,29521%10,8081086.582
Grand Est5,568,71111%12,2511237.461
Pays de la Loire3,926,38917%13,3501338.130
Occitanie6,154,72912%14,7711488996
Nouvelle-Aquitaine6,154,77212%14,7711488.996
Hauts-de-France5,983,82315%17,95118010.932
Ile-de-France12,419,9619%22,35622413.615
Auvergne-Rhône-Alpes8,235,92316%26,35526416.050
France métropolitaine66,142,96112%164,8121648100.37
Table 2. Excess production of wind turbines in 2035.
RegionOnshore [TWh]Offshore [TWh]Total [TWh]
Hauts-de-France2.270.172.44
Grand Est1.67 1.67
Occitanie0.590.090.68
Bretagne0.470.210.68
Pays de la Loire0.470.270.74
Nouvelle-Aquitaine0.640.280.92
PACA0.030.080.11
Auvergne-Rhône-Alpes0.25 0.25
Bourgogne-Franche-Comté0.41 0.41
Normandie0.371.101.47
Corse0.01 0.01
Centre-Val de Loire0.59 0.59
Ile-de-France0.05 0.05
France7.822.1910.1
Table 3. Excess production of nuclear plants in 2035.
RegionSurplus 2035 [TWh]Used 2035 [TWh]
Hauts-de-France10.637.52
Grand Est19.5713.84
Occitanie6.284.44
Bretagne0.000.00
Pays de la Loire0.000.00
Nouvelle-Aquitaine14.4610.23
PACA0.000.00
Auvergne-Rhône-Alpes27.5019.45
Bourgogne-Franche-Comté0.000.00
Normandie25.7518.21
Corse0.000.00
Centre-Val de Loire16.3611.57
Ile-de-France7.225.10
France127.7790.36
Table 4. Optimal solution of solver GAMS.
x e , r (kT)RouenLilleStrasb.ParisOrléansBord.LyonMontp.NantesRennesMars.Dijon
Flamanville00000 00089.7800
Paluel79.850095.3500000000
Penly00026.0100000000
Gravelines0179.520000000000
Chooz000000000000
Cattenom00122.510000000020.75
Nogent000102.200000000
Saint-Laurent000029.20000000
Dampierre0000730000000
Belleville00005.88023.02000029.5
Chinon0000000073000
Civaux0000045.520031.3000
Le Blayais00000102.2000000
Bugey000000102.200000
Saint-Alban0000007300000
Cruas00000065.3300036.870
Tricastin000000045.510056.690
Golfech0000000102.20000
Saint-Nazaire0000000029.2000
Table 5. Network cost.
ParameterUnitUnitary Cost
Tractor investment120,000
H2 gas trailer investment1,000,000
Liquid H2 trailer investment860,000
Average usage timeh/year2000
Driver’s salary€/h35
Operation and maintenance€/year*truck14,400
Consumptionl/100 km35.5
Price of diesel1.75
Average speed of truckkm/h60
Average distancekm/truck*year120,000
Average price per km of motorway€/km0.37
Trailer capacity for gaseous H2kg1000
Trailer capacity for liquid H2kg4300
Disclaimer/Publisher’s Note: The statements, opinions and data contained in all publications are solely those of the individual author(s) and contributor(s) and not of MDPI and/or the editor(s). MDPI and/or the editor(s) disclaim responsibility for any injury to people or property resulting from any ideas, methods, instructions or products referred to in the content.

