1. Introduction
The road transport sector contributes approximately 18% of global CO
2 emissions [
1]. The use of fossil fuels by the vehicle fleet increases environmental pollutants such as sulfur dioxide (SO
2), nitrogen oxides (NO
x), carbon monoxide (CO), and particulate matter (PM), which affect air quality in urban areas [
2]. It is known that 90% of the world’s population lives in areas that do not meet the minimum standards proposed by the World Health Organization (WHO) [
3].
In this context, to achieve the objectives and targets set in international agreements, governments have proposed the decarbonization of transportation as a strategy. For example, the state of California in the United States has set a target that by 2035, 100% of vehicle sales will be electric [
4]. The United Kingdom has committed to achieve zero emissions by 2050, where the gradual elimination of fossil fuels is essential [
5]. Similarly, China projects that by 2035, approximately 75% of vehicle sales will be electric. Thus, electric vehicle technologies and technologies that support the energy transition towards electrification, such as hybrid electric vehicles, have been promoted [
6]. Since electric vehicles typically have three times greater energy efficiency than those powered by internal combustion engines according to a tank-to-wheel analysis [
7], certain motorization technologies, such as hybrid electric vehicles, are regarded as more energy-efficient and environmentally friendly compared to conventional vehicles [
8,
9].
Hybrid electric vehicles present different levels of hybridization: Mild Hybrid Electric Vehicles (MHEVs), hybrid electric vehicles (HEVs), and Plug-in Hybrid Electric Vehicles (PHEVs). PHEVs are equipped with a plug that allows their battery to be recharged via connection to the electrical grid. Additionally, the electric motor has the power to propel the vehicle without starting the combustion engine. HEVs, like PHEVs, have an electric motor with sufficient power to propel the vehicle without starting the combustion engine. However, this technology cannot be plugged into the electrical grid, and the energy for the battery is supplied by fossil fuel consumption and regenerative braking [
10]. Finally, in MHEVs, the electric motor does not have enough power to propel the vehicle, so the internal combustion engine always remains on during vehicle operation [
11,
12]. The electric motor only increases the power generated by the ICE and supports the operation of vehicle accessories and air conditioning.
There has been increased interest in understanding the impact on energy consumption and emissions [
13]. Karjalainen et al. [
14] developed on-road tests to compare the emissions of PM and black carbon (BC) from a PHEV (Volkswagen Passat 2017) with two conventional vehicles. The tests were conducted on two routes, the first consisting of typical urban driving and the second based on highway driving conditions. This study found that PHEVs have a PM emission factor nearly ten times lower than that recorded by conventional vehicles. However, the study does not analyze the energy consumed by the vehicles.
Wang et al. [
15] conducted on-road tests with a PHEV, evaluating the actual energy consumption and the pollutant emissions (CO, NO
x, and PM). The authors found that the energy consumption was 45% higher under charge-sustaining conditions (when the combustion engine is turned on to maintain the vehicle’s battery charge) compared to charge-depleting conditions (when the vehicle uses the battery’s energy). The study focuses on a PHEV and does not consider other hybridization technologies. Huang et al. [
16] conducted on-road tests with an HEV and an ICEV to conduct a comparison of fuel consumption and emissions under different operating conditions. The authors found that the HEV had 41% better fuel efficiency in urban conditions compared to the conventional vehicle, and CO
2 and NO
x emissions were reduced by 33% and 61%, respectively. However, the number of particles (PN) and CO emissions were higher than those of combustion vehicles. Similarly, Wang et al. [
17] carried out tests with three vehicles: two ICEVs (Nissan Rogue 2019 and 2020 models) and a 2020 Ford Fusion hybrid (HEV). The results revealed that the HEV exhibited a fuel consumption of 5.1 [L/100 km], 40% and 57% lower than the 2020 Nissan Rogue and the 2019 Nissan Rogue, respectively. Additionally, considering NO
x emissions, the HEV presented emissions like those of the ICEV at 0.010 g NO
x/km. Squalli [
10] conducted a statistical analysis of the growth of the EV and HEV fleets between 2016 and 2019 in the US to determine the impact on CO
2 emissions. This study found that the increase in the HEV fleet does not represent a statistically significant change in CO
2 emissions associated with the transportation sector in the US. It also highlights the need to address pollutant emissions and evaluate results in other countries, as differences in markets, infrastructure, and policies may affect the findings.
Most studies focus on analyzing a single motorization technology and its comparison with combustion vehicles, conducting on-road tests. Therefore, the results may be subject to specific operating conditions. In addition, the literature review did not identify any studies that included MHEVs to conduct energy projections. The review reveals that the energy and emission benefits of hybrid vehicles are still uncertain, posing a high risk for meeting environmental goals, especially in developing countries.
In Latin America, the EV and hybrid electric vehicle sales of these motorization technologies have grown exponentially. In Argentina, around 9600 hybrid and electric vehicles were registered in 2023, of which 85.4% were HEVs, followed by 8.3% MHEVs, 3.9% PHEVs, and 2.4% EVs. In Brazil, approximately 3197 electric vehicles (EVs) and 4000 PHEVs were sold. In Chile, over 8000 hybrid and electric vehicles, EVs and HEVs, were sold during the same period, with HEVs representing 43% of the total, MHEVs 34%, PHEVs 6%, and EVs 17% [
18]. In Colombia, by 2023, hybrid electric vehicles outnumbered EVs by about 24,000 units [
19]. This may be associated with the following reasons:
Hybrid vehicles have economic incentives such as tariff and tax reductions [
20,
21].
In some countries, hybrid vehicles are granted non-economic benefits such as exemption from mobility restrictions and preferential mobility and parking zones, among others [
22].
The scarcity of charging stations is a barrier to the adoption of electric vehicles (EVs) [
7].
It is evident that an important research gap is to evaluate the potential present and future impact on fuel consumption and emissions due to the implementation of hybrid vehicles in LATAM countries. These technologies are close to leading the vehicle market in developing countries. In addition, due to the topographical characteristics of the roads, mostly mountainous, and the requirements for high autonomies, buyers are inclined towards this type of technology. This highlights the importance of energy consumption and emissions projection analyses for hybrid electric vehicles.
This study projects the energy consumption and emissions of hybrid electric vehicles in Colombia, considering each level of hybridization. The aim is to evaluate the benefits and drawbacks of incorporating hybrid electric vehicles compared to ICEVs, considering the improvement in the level of emission standards.
This article uses the information reported in the in-service conformity check by vehicle importers during the homologation process in Colombia and the number of vehicles registered in the country between 2010 and 2022. These reports show the tailpipe emission values and performance for each level of hybridization (MHEV, HEV, and PHEV). This information is also available for conventional, natural gas, and electric vehicles (EVs). Additionally, fleet projection models are used to identify the potential impacts on energy consumption and emissions up to the year 2040. This study intends to provide relevant technical information for LATAM governments to make decisions regarding the incentives granted to hybrid vehicles and propose immediate actions that influence the reduction in energy consumption and emissions in each country.
2. Methodology
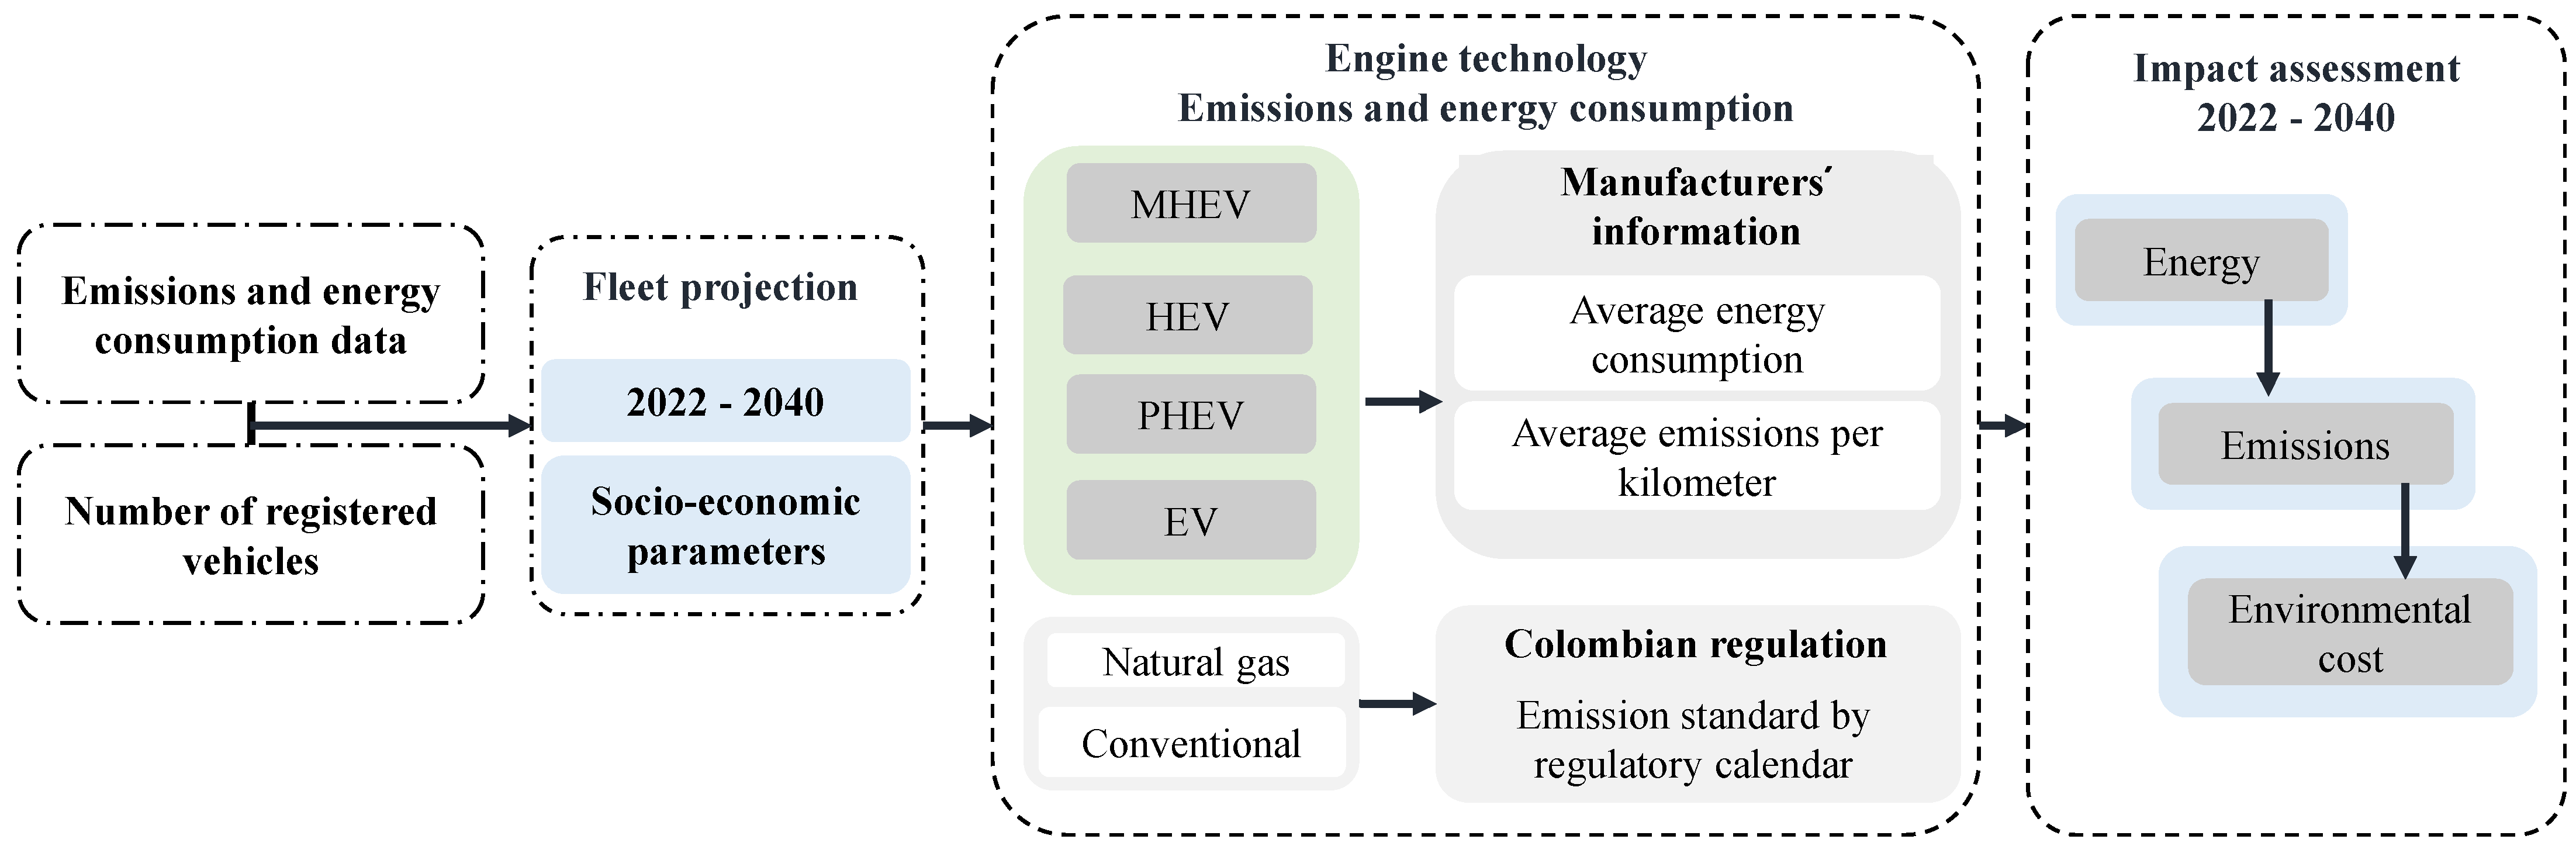
This study identifies the impacts on energy consumption, emissions, and potential environmental costs resulting from the inclusion of different hybrid electric vehicle technologies in the Colombian vehicle fleet over an 18-year period (2022–2040). It is important to mention that a tank-to-wheel analysis was considered.
Figure 1 describes the procedure that was carried out:
(i) Vehicle fleet projection: The Gompertz model was applied [
23,
24] to determine the growth of the vehicle fleet until 2040. The model considers the historical growth of the vehicle fleet, the GDP, and the population of Colombia.
(ii) Projection by motorization technology: Linear regression was used for conventional vehicles. For MHEVs, HEVs, PHEVs, and EVs, logistic growth curves were applied.
(iii) Fuel economy and emissions per kilometer: For conventional vehicles, fuel economy and emissions factors were determined based on the Colombian regulatory calendar and vehicle typologies. For MHEVs, HEVs, and PHEVs, average factors by vehicle type and engine technology were established using data from the Colombian Agency of Environmental Licensing (ANLA, for its acronym in Spanish).
(iv) Calculation of energy consumption and emissions: With information on fuel consumption, emissions, and the number of vehicles per engine technology, energy consumption was calculated based on the average annual kilometers driven and the lower heating value of the fuel used.
(v) Calculation of environmental cost: To estimate the environmental costs associated with emissions from light-duty vehicles, the study by Cantillo et al. [
25] was referenced, which provides the average environmental cost per emission. However, as this study was conducted in 2011, an economic model was applied to calculate the net present value (NPV) of emissions. Once the NPV of each ton of gas emitted was determined, the total cost of emissions was estimated at five-year intervals.
(vi) Analysis of hybrid vehicle participation scenarios in the vehicle fleet: Finally, three scenarios for the growth of the hybrid electric vehicle fleet in Colombia were analyzed, considering potential regulations or incentives that the national government might implement. These scenarios allowed for an assessment of the impact of hybrid electric vehicles on pollutant emissions, greenhouse gas emissions, and fuel consumption in the country.
2.1. Vehicle Fleet Projection
The growth of vehicle fleets worldwide typically follows an S-shaped trend: slow initial growth, followed by exponential acceleration, and eventually tapering off as it approaches saturation. Various mathematical models, such as the Gompertz function and logistic curves, align with this trend and can be used to predict the growth of vehicle fleets in each country [
26]. Forecasting the vehicle fleet requires historical data, including the number of registered vehicles and GDP for the country.
In Colombia, the National Single Transit Registry (RUNT, for its initials in Spanish) database has been collecting transportation sector information since 2010. Analysis of the database shows that by 2020, 5,915,177 light-duty vehicles (LDVs) and approximately 494,414 heavy-duty vehicles (HDVs) had been registered [
27]. Hybrid vehicles represent 0.76% of the vehicle fleet, of which 99% are LDVs. Therefore, it was decided to focus the analysis on the impact presented by the light-duty vehicle fleet, as heavy hybrid vehicles are not representative in the country.
Based on the RUNT (National Single Transit Registry) information, the projection model is used to estimate the growth of the vehicle fleet during the analysis period (2022–2040). Some studies show that vehicle fleet growth is related to economic growth and population size [
28,
29]. Therefore, the size of a vehicle fleet can be estimated by knowing the per capita gross domestic product (GDPc).
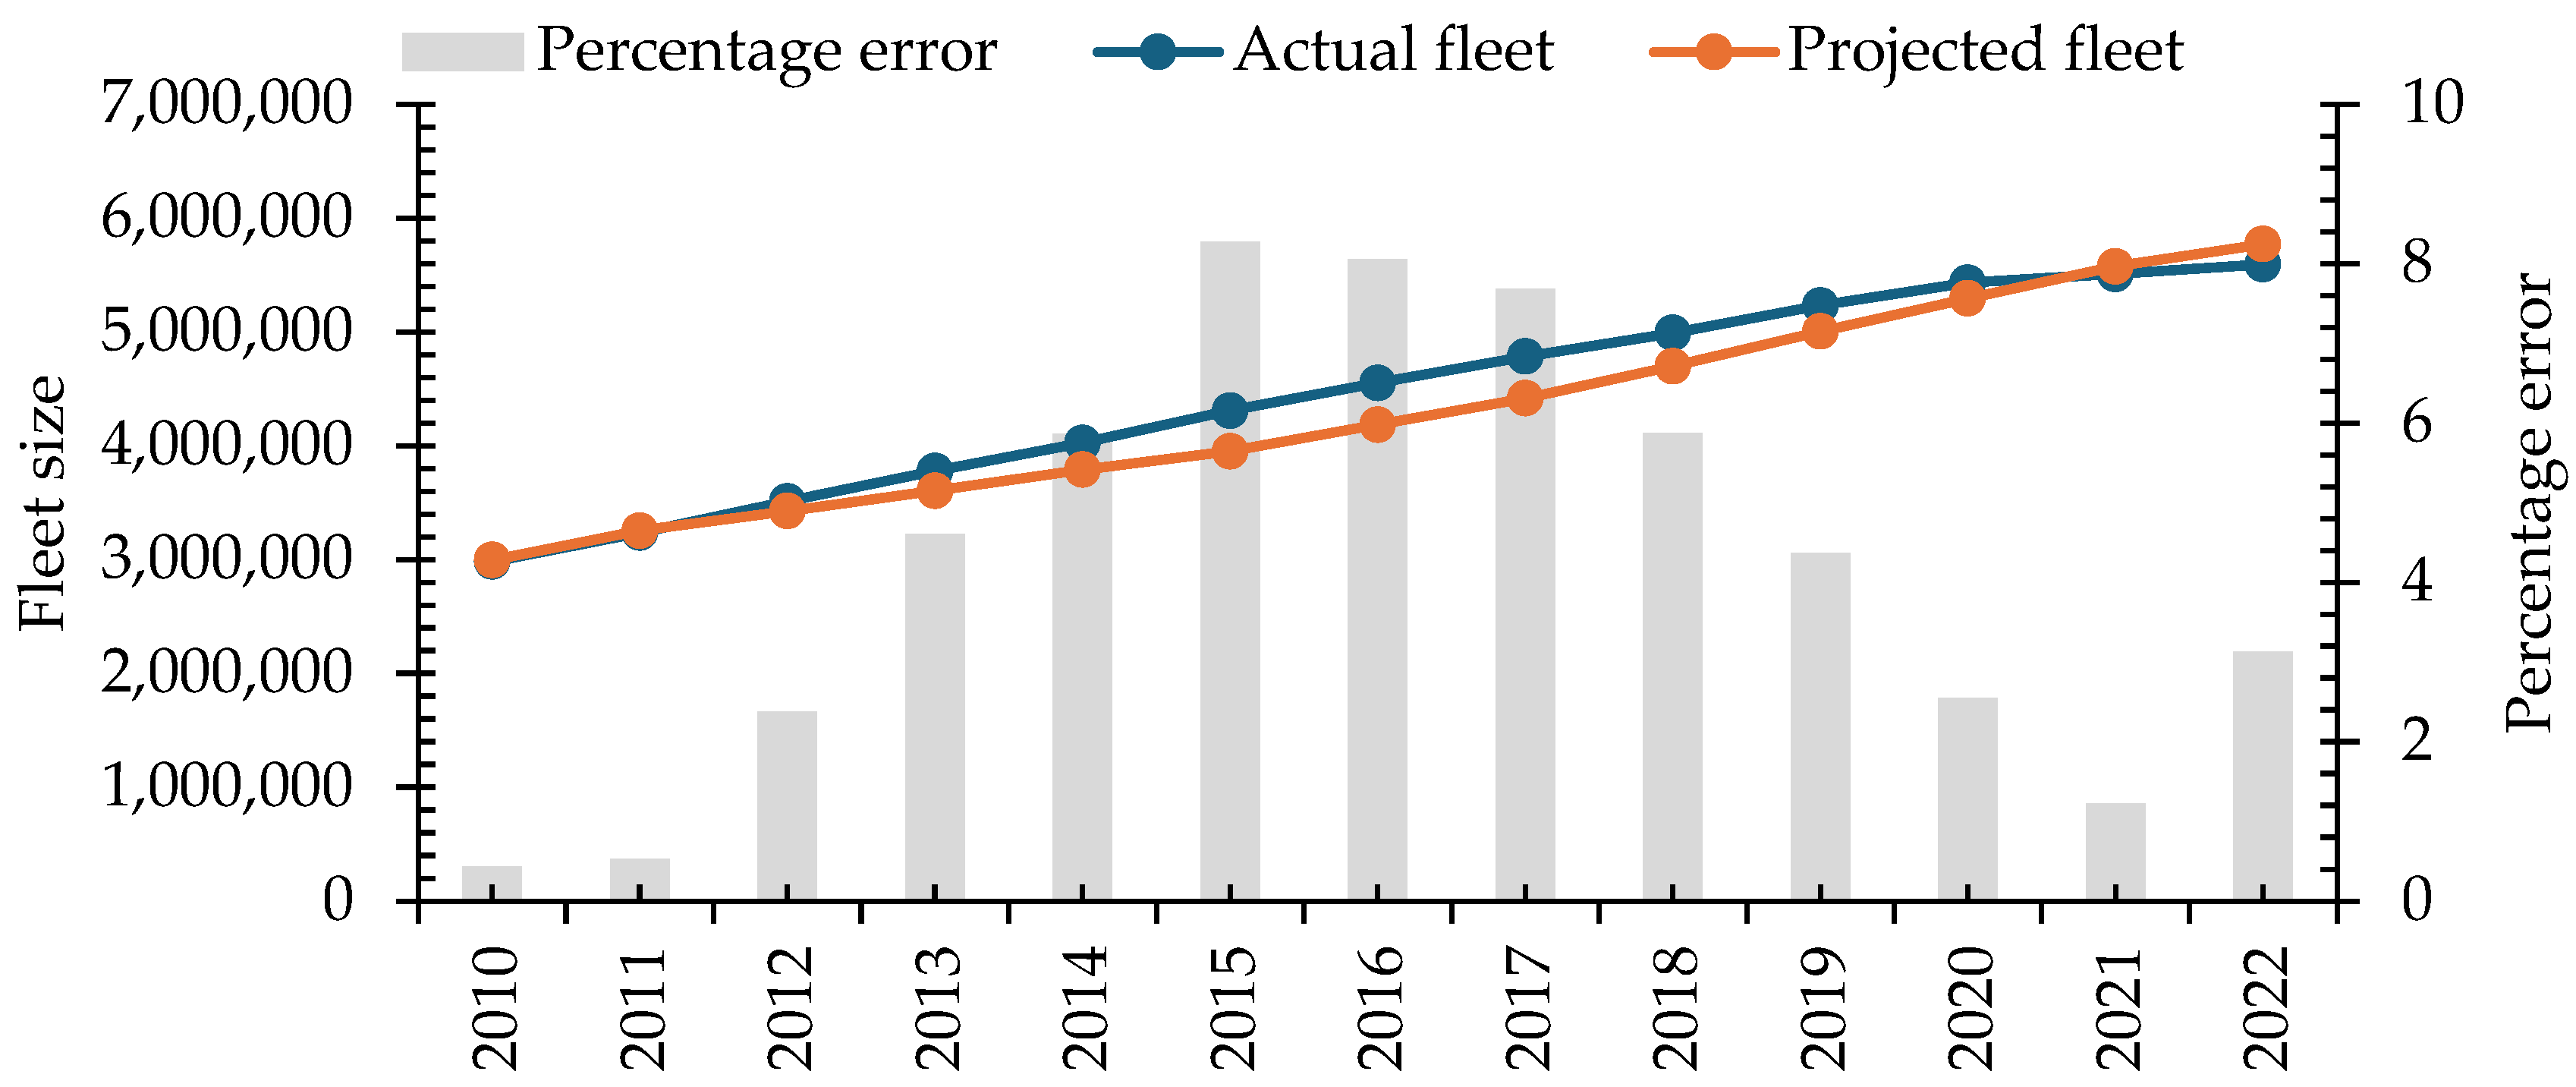
For the fleet projection, the Gompertz model was used. The Gompertz model is used because of its proven accuracy, as demonstrated by a comparison of historical and projected values for the 2010–2022 period, showing an average deviation up to 4.22%, as shown in
Figure 2. Furthermore, this model aligns with methodologies validated in other studies. For example, the study proposed by [
10] employs a similar methodology that considers multiple factors, including population, income, and technology to evaluate the impact of electric and hybrid vehicles on CO₂ emissions in US.
According to the Gompertz model, the saturation level can be calculated from the GDPc. This implies that to establish vehicle growth in cities, it is necessary to know both the population and GDP projections. Therefore, the GDPc for a year
t is calculated by dividing the GDP of that year by the study population, as shown in Equation (1).
In this way, studies such as [
29,
30] utilize the Gompertz model for fleet forecasting, using Equation (2).
where
represents the number of vehicles per 1000 inhabitants (known as the motorization index) at time
. The
combines GDP and population size. The parameter γ (gamma) refers to the vehicle saturation level, expressed in vehicles per 1000 inhabitants, and establishes the limit of vehicle fleet growth. The parameters α (alpha) and β (beta) determine the shape of the Gompertz curve. The α parameter indicates the number of vehicles with low income, i.e., when the GDPc tends to zero. On the other hand, β determines the number of vehicles with high income.
The population projection for Colombia is estimated using the projection model of the Economic Commission for Latin America and the Caribbean (ECLAC), which projects the number of inhabitants per country until 2100 [
31]. This level is not directly related to per capita GDP (GDPc) but to non-economic factors such as density and urbanization. Densely populated and urbanized countries have less need for vehicles. For example, in 2006, the United States had a saturation level of 652 vehicles per 1000 inhabitants at a GDPc of USD 20,000. Currently, countries like Japan have 550 vehicles per 1000 inhabitants, and France 653 vehicles per 1000 inhabitants [
28].
For this study, considering that Colombia is a developing country and its vehicle market increases every year, a saturation level consistent with its population density compared to the United States is estimated, as shown in Equation (3) [
28].
The population density of Colombia
is 46 persons per km
2, and that of the United States
is 36 people per km
2, according to World Bank data [
32]. Therefore, the estimated saturation level for Colombia is adjusted to 648 vehicles per 1000 inhabitants. It is necessary to consider a high saturation level, like that of developed countries, as Colombia is experiencing rapid growth in its vehicle fleet [
33].
In this study, through iterations, the values of
α and
β for each vehicle class were established. The regression method to find the parameters
α and
β involves transforming the Gompertz function into a linear function, thus establishing a relationship between the parameters of both functions. In this way, it is found that the parameter
β corresponds to the slope of the straight line, and the value of
α is calculated from Equation (4).
Thus, from the historical values of the motorization index V (knowing the number of vehicles and the population) and with an established saturation level γ, the values of Y are obtained as a function of GDPc to calculate the slope m and the intercept b of the line, and subsequently obtain the parameters α and β.
According to [
29,
30], the Gompertz model allows estimating the motorization rates (MRs) as it accurately reflects the S-curve growth pattern typical of economic and vehicle ownership trends. Its smooth transition during slow growth stages makes it more realistic than standard logistic models, particularly in capturing gradual saturation. This is crucial for forecasting electric vehicle (EV) adoption, especially in contexts where motorization rates vary significantly between developing and developed countries.
2.2. Projection by Motorization Technology
Once the number of vehicles by type (car, van, and SUV) has been projected, the motorization technologies present in each class must be identified. This allows for relating the performance and emissions per kilometer of each vehicle category according to its motorization technology.
Historical data on the vehicle fleet were obtained from the Colombian National Single Transit Registry (RUNT, for its initials in Spanish). The database includes the number of vehicles registered in the country and the years of vehicle growth.
To predict the growth of the conventional vehicle fleet, linear regression was used [
34]. The number of MHEVs, HEVs, PHEVs, and EVs in the country grew exponentially. Given these results, the projection strategy for the HEVs, PHEVs, and EVs was changed to one based on logistic curves, as it is anticipated that the vehicle market will tend to stabilize as it approaches a practical limit. That is, factors such as infrastructure, road capacity, market demand, and resource availability begin to restrict sustained growth as market saturation is reached.
Studies such as [
29,
35,
36,
37] employ methodologies based on logistic curves, along with the Gompertz model, to estimate the growth of the vehicle population by motorization technology. Logistic curves model the increase in a population over time. This approach enables the estimation of fleet growth for emerging technologies by incorporating data from projections of the total vehicle fleet in the country. In Colombia, MHEVs, HEVs, PHEVs, and EVs are classified as emerging technologies, as they were introduced less than a decade ago and are currently experiencing rapid growth in adoption. This strategy allows understanding the behavior of a population at a time
t, considering that if this behavior grows, it slows down as the population approaches an upper limit. Logistic curves are commonly used when there is a saturation constraint.
This study considers diesel, gasoline, natural gas, and EV (electric vehicle) motorization technologies and emphasizes hybrid technologies like MHEVs, PHEVs, and HEVs, thus prioritizing the estimation of the growth of the electric and hybrid electric vehicle fleet in Colombia. To achieve this, data from Colombian Energy Planning Unit (UPME) were used. The UPME is a national-level special administrative unit that proposes a long-term vision for the energy sector in Colombia and provides records of the participation percentages of these vehicles between 2010 and 2022. A logistic adjustment is applied to the data to model a logistic growth curve [
35,
38] that describes the growth of these vehicles and is presented in Equation (5).
where
L represents the maximum value of the function,
k is the growth rate,
x is the year of participation, and
is the inflection point that shows the year in which the maximum change in the curve occurs.
From the participation percentages of each technology, it is possible to project the future composition of the vehicle fleet according to the type of motorization. This analysis allows evaluating the implications of increasing the proportion of vehicles with cleaner technologies. For this, a model is constructed that relates energy consumption and emissions with the technological characteristics of the vehicle fleet. By varying the number of vehicles of each technology, changes in energy consumption and emissions generation can be predicted. Equations (6)–(8) are those used in this study to estimate the participation percentage of MHEVs, HEVs, and PHEVs.
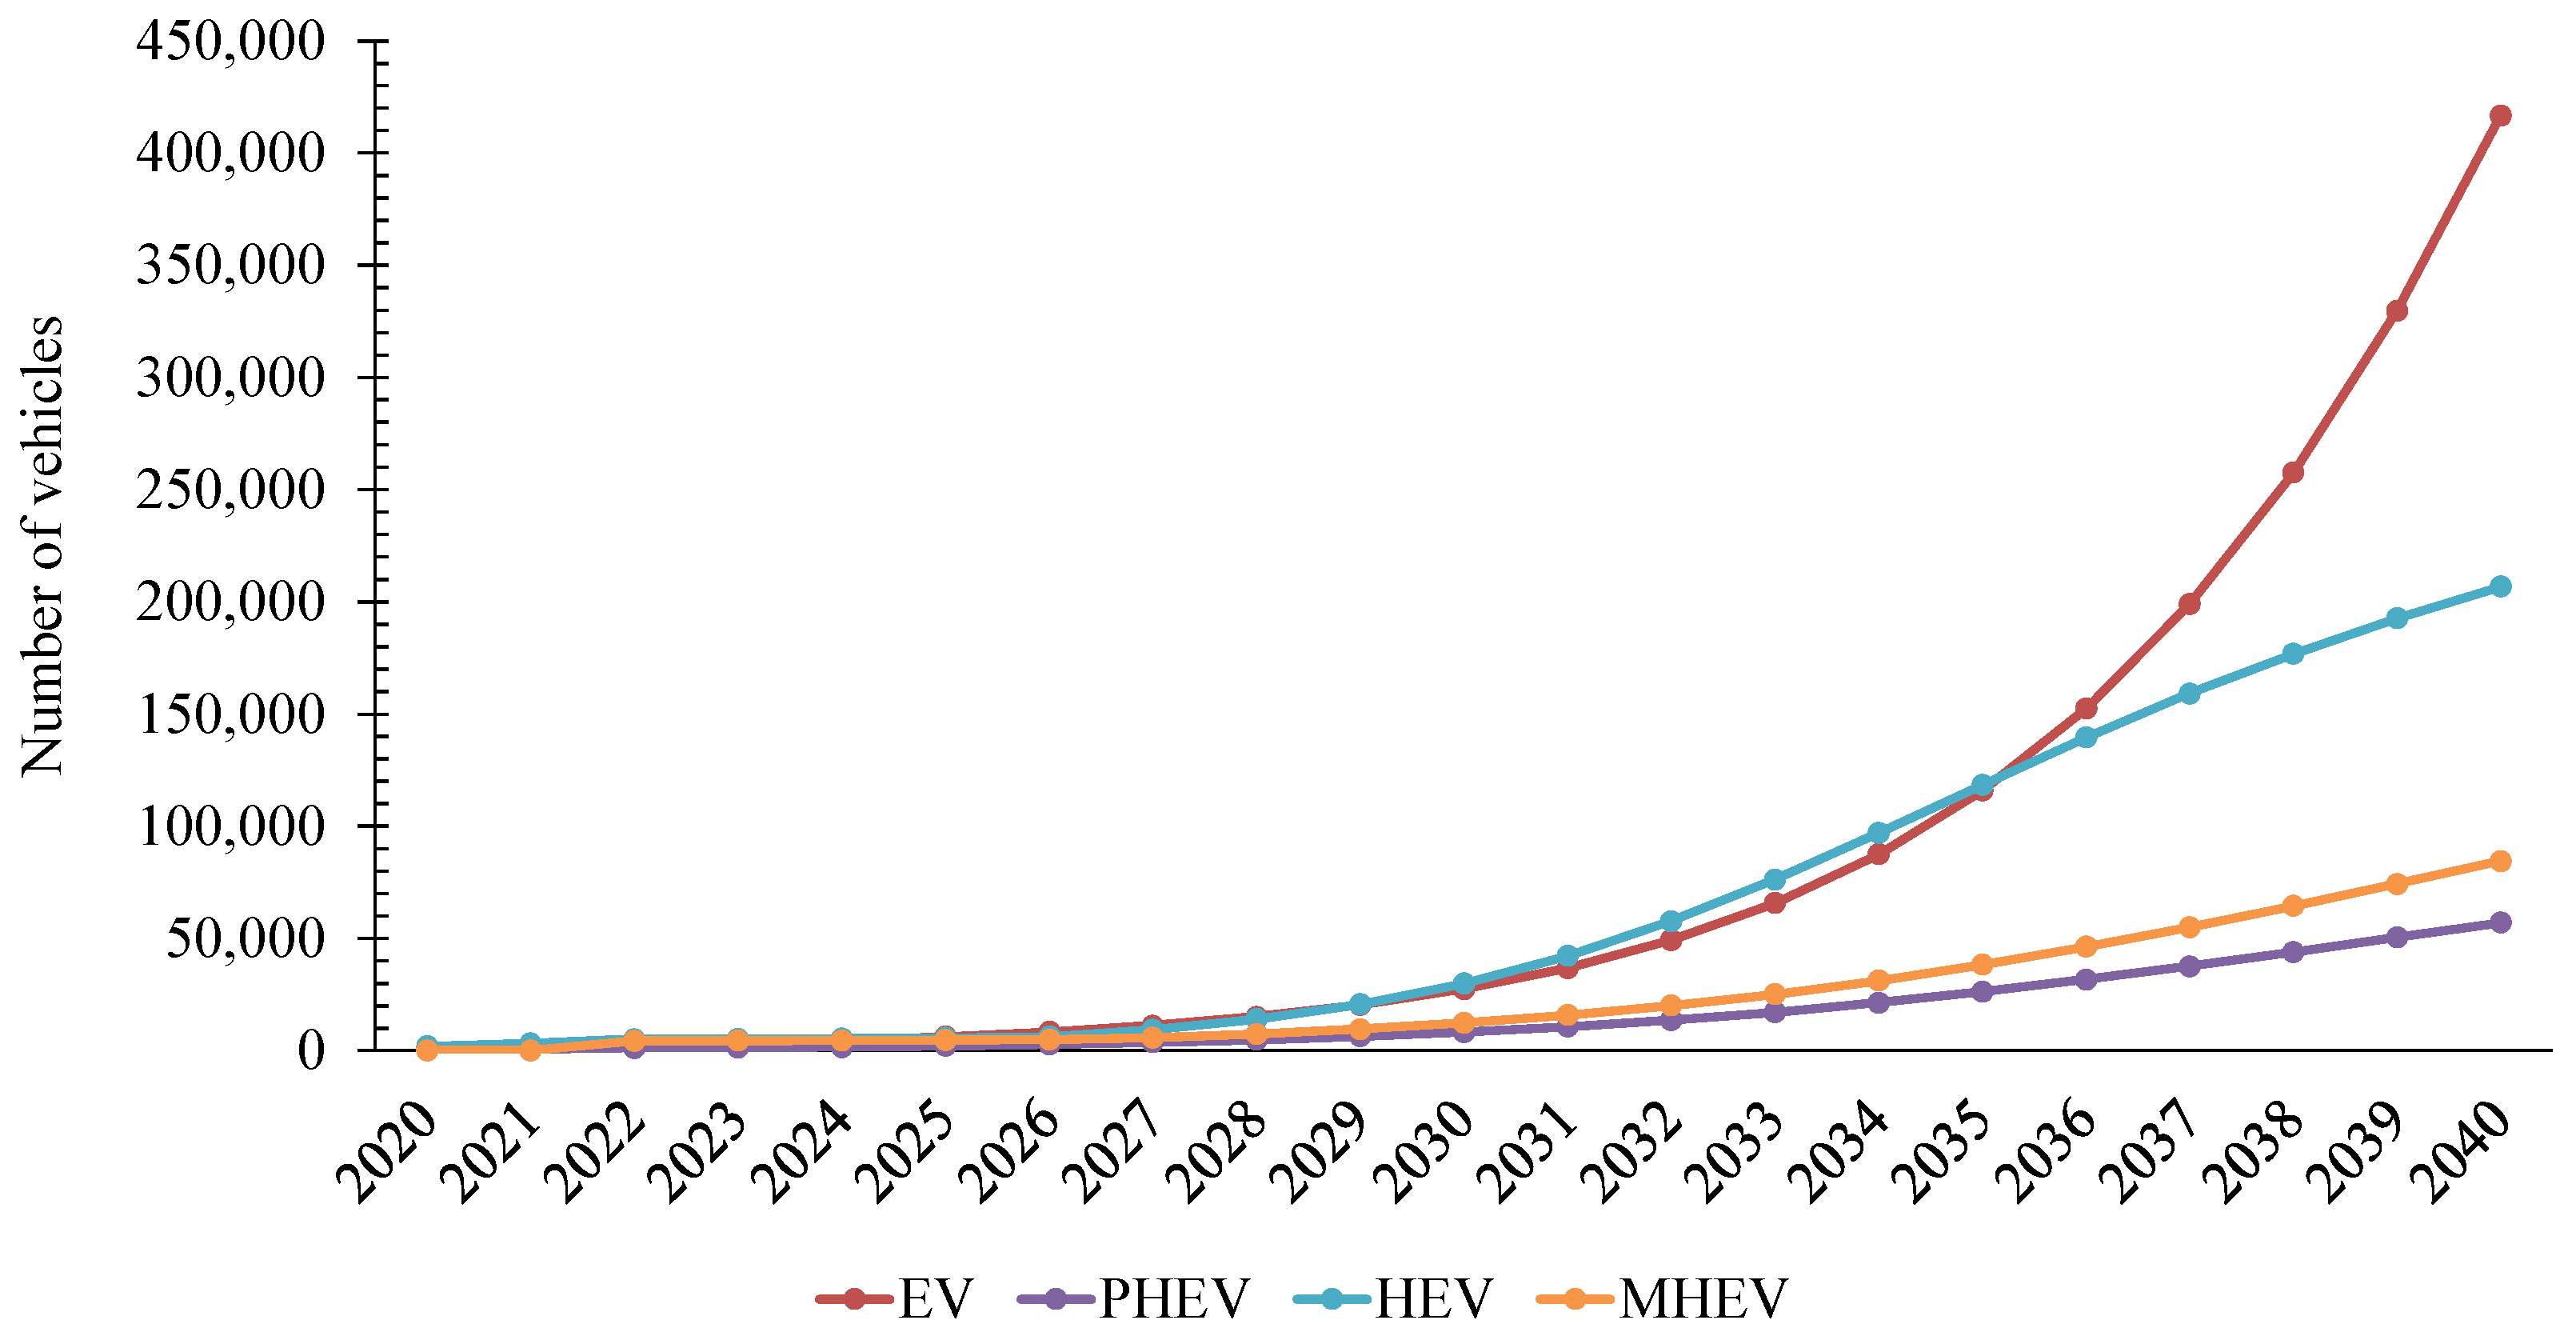
Figure 3 shows the behavior of electric and hybrid vehicles considering the different levels of hybridization, based on the proposed logistic growth curves.
According to the behavior of the blue line corresponding to HEV vehicles, a logistic model is suggested in which the market approaches its maximum capacity in the long term. On the other hand, HEVs show a moderate growth curve compared to electric vehicles. According to the projection, these vehicles seem to experience sustained growth, which could indicate that in approximately 10 years, consumers will prefer fully electric options or that HEVs will reach a moderate level of market adoption [
39].
Regarding MHEVs, their growth is slower than that of HEVs and EVs. The curve is less pronounced, indicating that their adoption is more gradual and will likely reach a saturation level before other types of vehicles. Finally, PHEVs show more limited growth and a linear trend curve, suggesting that, in the long term, they have less growth potential compared to EVs.
2.3. Assignment of Performance and Emissions per Kilometer
The information contained in the RUNT database does not include emissions per kilometer and performance data for registered vehicles; this information is found in the database of the National Environmental Licensing Agency (ANLA, for its initials in Spanish). This database is fed with information on CO2, CO, NOx, and PM emissions [g/km] and performance in [km/gal], provided by manufacturers and importers in the Certificates of Emissions by Dynamic Tests (CEDT), for the homologation process. The reported values are under different driving cycles, such as FTP 75, the New European Driving Cycle (NEDC), and the Worldwide harmonized Light vehicles Test Cycles (WLTC). It is identified that the information of the best-selling vehicle lines in the country is reported under the NEDC.
The database is not complete for the entire vehicle fleet; therefore, the following considerations were made: (a) for conventional vehicles, the emission standard that must be met according to the country’s regulatory calendar is used, (b) for electric and hybrid electric vehicles, the weighted average of emissions per kilometer and performance reported for the most representative vehicles in ANLA and under the NEDC is used, and (c) the average emissions and performance for electric and hybrid electric vehicles are maintained throughout the analysis period.
Table 1 presents the assignment of emission standards per kilometer for conventional vehicles according to the year of entry.
As observed in
Table 1, for gasoline vehicles, the Euro 2/Tier 1 standard is maintained from 2011 to 2024, advancing to Euro 4 from 2025 to 2029, and reaching Euro 6 from 2030 to 2040. This regulation outlines a long-term plan for emission control, with targets set until 2040. By this date, all vehicles, regardless of their fuel type, must comply with the Euro 6 standard.
As mentioned for hybrid vehicles, the average consumption and emissions reported by manufacturers in ANLA are used and remain constant throughout the analysis period. This study used information from the ANLA database for the years 2017 to 2022. It is important to highlight that these emission values are below the emission standards, while the performance is higher. The database analysis allowed identifying unreported data, as shown in
Table 2.
Due to the above, the following actions were established to complete and reduce the amount of unreported information:
For cases where CO
2 emissions per kilometer are available but fuel consumption is unknown, or vice versa, the calculation is performed using the calculator developed by The International Council on Clean Transportation (ICCT) [
40].
For each brand, vehicles registered with the same vehicle line for different model years but with unchanged engine displacement, vehicle standard, and engine code were identified. In these cases, the unreported data in one record were completed with those from the other record.
The information reported under the NEDC is used as a basis, as it is not possible to relate pollutant emission values under different driving cycles.
In cases where CO2 emissions per kilometer and fuel consumption are not available, official energy labeling websites were consulted, and the registered value was assigned considering the respective driving cycle and converting the values to the NEDC.
Appendix A (
Table A1) presents the emission standard values and average emissions for hybrid electric vehicles, classified by class and motorization technology. Additionally,
Table 3 presents the percentage differences between the performance and emissions values reported by manufacturers in the ANLA database compared to the Euro 6 emission standard.
For vehicle projection, vehicles that stop circulating upon reaching their useful life, estimated at 18 years for Colombia, are considered, according to reports from the National Association of Sustainable Mobility (ANDEMOS, for its initials in Spanish), which establish that the average age of the vehicle fleet is 17.7 years [
41].
Table 4 presents the 10 best-selling hybrid electric vehicles in the country. In this study, a total of 19,667 vehicles were analyzed, of which 3493 are MHEVs, 12,776 are HEVs, and 3398 are PHEVs.
2.4. Calculation of Energy Consumption and Emissions
To calculate the fuel consumption and emissions of a vehicle fleet, it is essential to understand the characteristics of the vehicles and the mobility patterns within the country. In a study conducted by Castillo et al. [
42], data from Colombia’s gas-powered vehicle fleet were used to estimate the annual pollutants emitted by these vehicles. A homologous methodology was developed to estimate the emissions and fuel consumption of the light vehicle fleet in Colombia.
The calculation of energy consumption (
EC) is performed by relating the performance of each motorization technology, the annual average of kilometers traveled by the technology, and the number of vehicles. Similarly, the calculation of emissions emitted (
Ev) per year is performed, as presented in Equations (9) and (10).
where AVKT [km] is the average kilometers traveled per year by the vehicle categories under analysis in Colombia. For this model, an AVKT of 13,000 for cars and 14,000 km for vans and SUVs is considered [
43]. LHV is the fuel lower heating value [kJ/kg], for gasoline 40,659 kJ/kg and for diesel 42,418 kJ/kg; ρ is the fuel density [kg/m
3], for gasoline 720 kg/m
3 and for diesel 850 kg/m
3. The values are taken specifically for the fuel characteristics of Colombia [
44]. Finally, RC is the fuel economy [km/L] and FE is the emissions factor [g/km] for each motorization technology.
2.5. Calculation of Environmental Cost
To estimate the environmental cost, the study by Diaz and Cantillo is taken as a reference, which proposes an estimation of emission costs in the transport sector adapted for the Colombian case [
25]. These values were adjusted to the year 2020 by applying the future value (FV) concept from Equation (11).
where
is the present value with an annual inflation rate
π of 3.86%, over a period
n of 9 years. The initial cost parameters are shown in
Table 5.
The environmental cost analysis exposes the economic implications associated with pollutant emissions, evaluating the economic value of each pollutant emitted for the analysis period, calculated using Equation (16).
where
Ez is the emissions of each pollutant [ton/year],
is the unit cost per emission for each pollutant, and
Finf is the estimated inflation factor for each projected period, and it is estimated for the middle of the projected period with an annual rate of 3%. In
Table 6, the values are grouped in five-year periods to highlight the calculated values more noticeably.
2.6. Scenario
To evaluate the benefits of incorporating electric vehicles over a 20-year analysis period, three scenarios are proposed. The base scenario is modeled with the current behavior of the vehicle fleet. The first scenario proposes conservative growth, in which the participation of hybrid vehicles in the total light vehicle fleet remains stable from 2025. MHEVs would have a participation of 0.001% vehicles, HEVs 0.057%, and PHEVs 0.016%. In this context, Scenario 1, for 2040, presents around 8071 hybrid vehicles, 98.2% less than the base scenario.
Given the limitations in the number of charging stations and the high acquisition costs of electric vehicles, a scenario was developed to facilitate the introduction of hybrid technologies. This approach aligns with Colombia’s commitments to reduce GHG emissions, and can be used to assess energy and environmental impact. In this sense, the second scenario simulates accelerated growth of all hybrid vehicles, aiming for MHEV, HEV, and PHEV participation to reach about 50% of the vehicle fleet by 2040. This scenario is proposed considering that Colombia seeks to reduce CO
2 emissions by 50% by 2030, which makes hybrids and electric technologies key to reach this target [
45]. Thus, the number of hybrid vehicles (MHEV, HEV, and PHEV) is estimated at 5,453,378.
Finally, Scenario 3 projects accelerated growth of HEVs and PHEVs, while MHEVs maintain the same participation from the 2025 share. That is, the number of HEV and PHEV vehicles is 5,235,243, but the number of MHEVs would be 109 vehicles, the same as in Scenario 1.
Table 7 presents the scenarios in a detailed manner.
3. Results
According to the projection model, the light vehicle fleet would have an average growth of 19.8% per five-year period until 2040. That is, Colombia will have around 10,906,756 light vehicles, of which 60.6% will be cars and 39.4% vans and SUVs.
Table 8 shows the projection of the vehicle fleet until 2040.
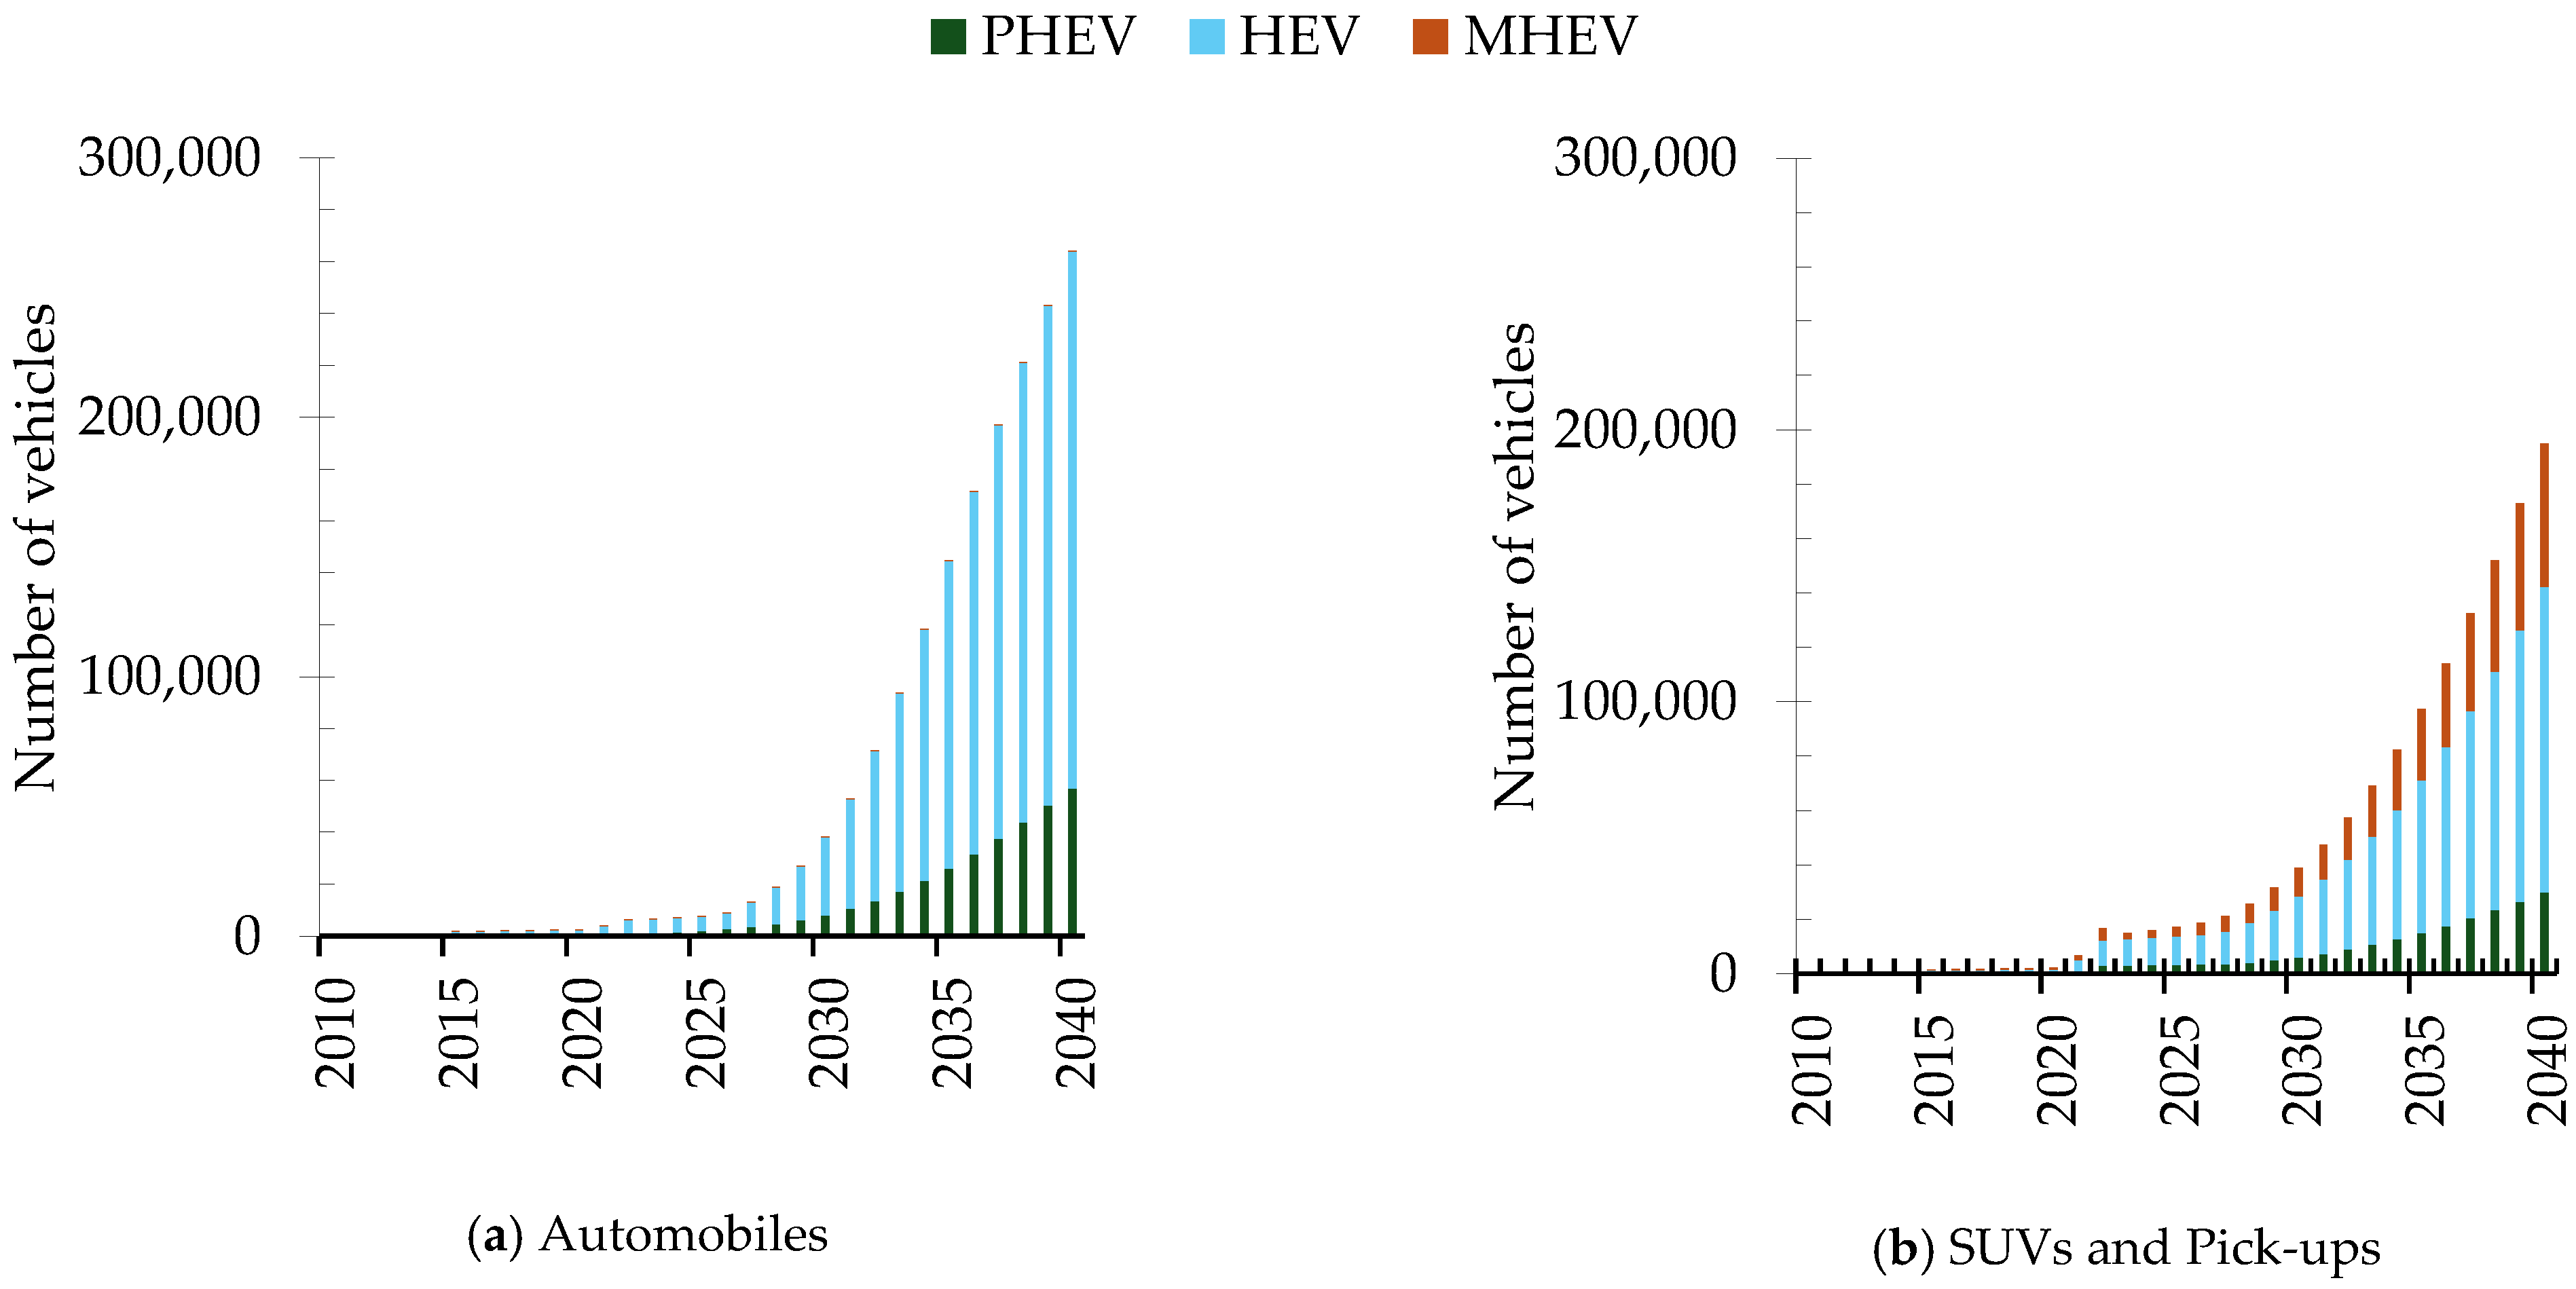
The projection shows a growth trend in vehicles with hybrid motorization technologies, as shown in
Figure 4. This may be associated with the fact that hybrid vehicles are emerging technologies in the Colombian market. Over a 20-year period, that is, until 2040, the participation of hybrid vehicles in cars would increase by 3.9% and 5.3% for vans and SUVs.
Among the levels of hybridization studied, HEVs maintain market leadership in hybrid vehicles during 2040 (69.6%), followed by PHEVs (18.9%), while the contribution of MHEVs would be lower than the other technologies (11.5%). The number of hybrid vehicles in the study period is detailed in
Table 9 for cars, vans, and SUVs.
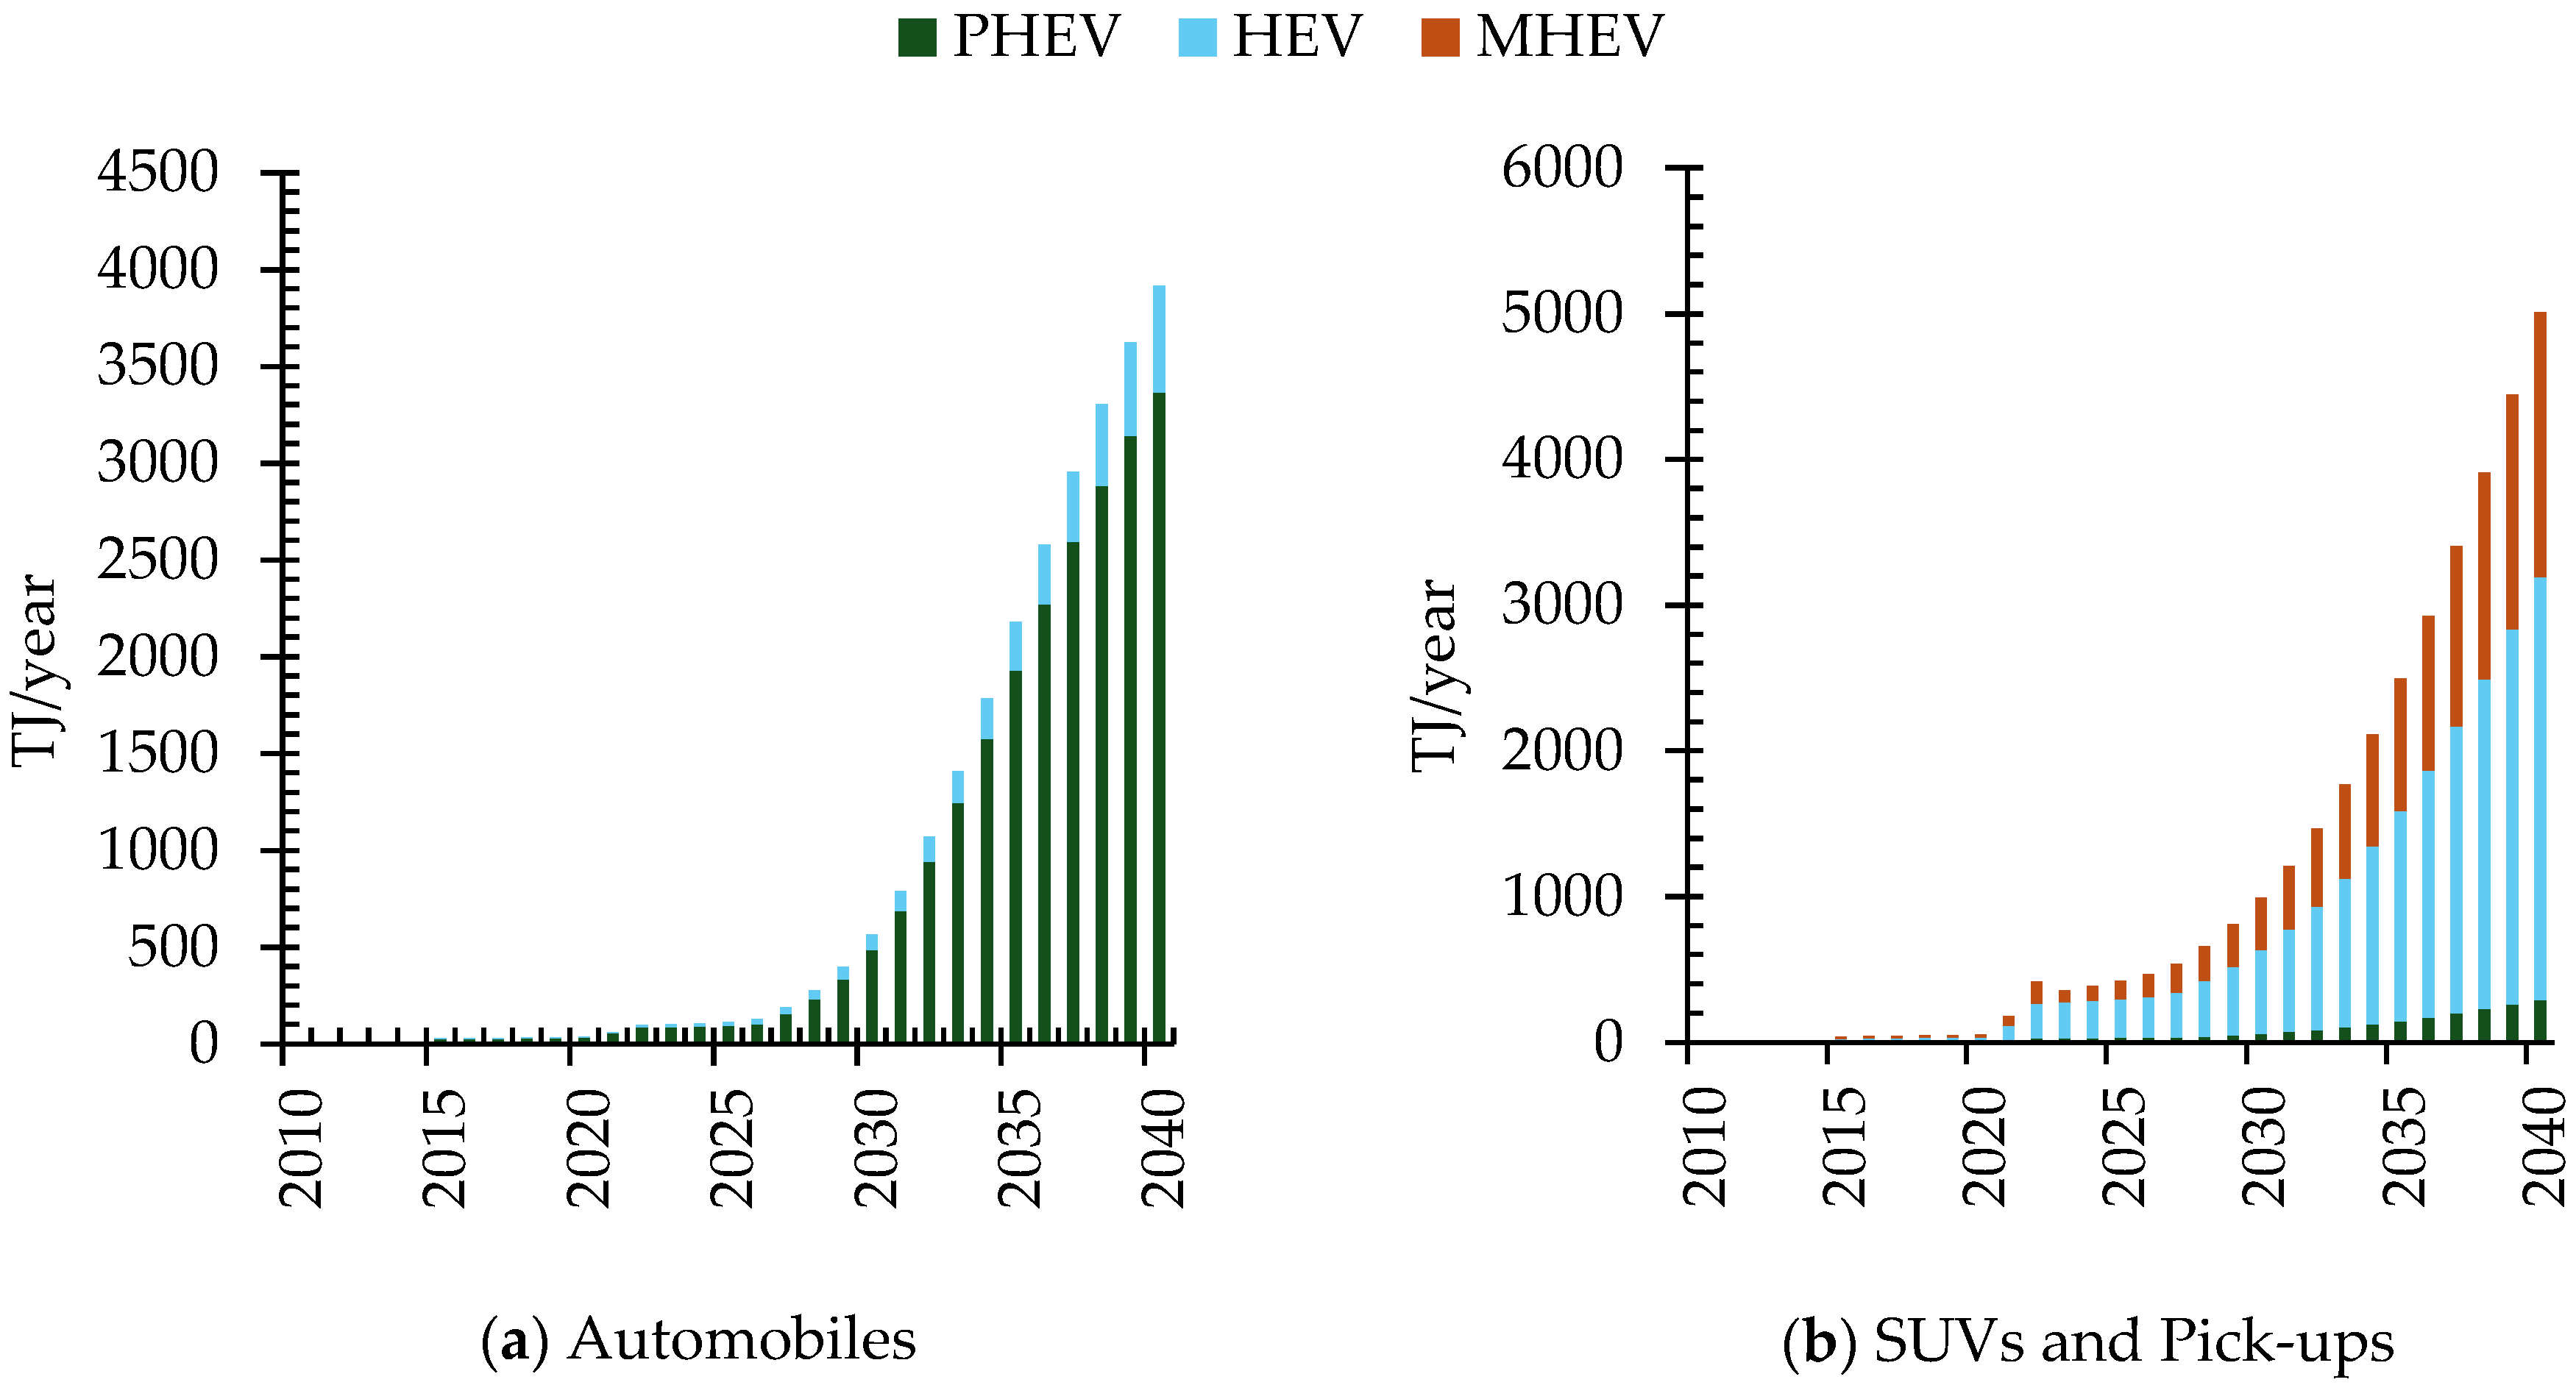
The existing light vehicle fleet in 2024 generates a total consumption of 416,254 TJ/year. Hybrid vehicles represent 0.12% (491 TJ/year) of the total consumption, with the largest contributor being HEV vans and SUVs (256 TJ/year), followed by MHEVs (99 TJ/year) and HEV cars (89 TJ/year). Changes in the vehicle fleet are reflected in energy consumption, which increases as the vehicle fleet size grows, and for the projected years, the contribution of hybrids in 2040 exceeds 1.4%. By 2040, the behavior differs: most of the energy will be consumed by HEV cars (3365 TJ/year), followed by HEV vans and SUVs (2899 TJ/year) and MHEV vans and SUVs (1818 TJ/year). The energy consumption of hybrid vehicles will increase from 492 TJ/year to 8924 TJ/year.
Figure 5 presents the mentioned behavior.
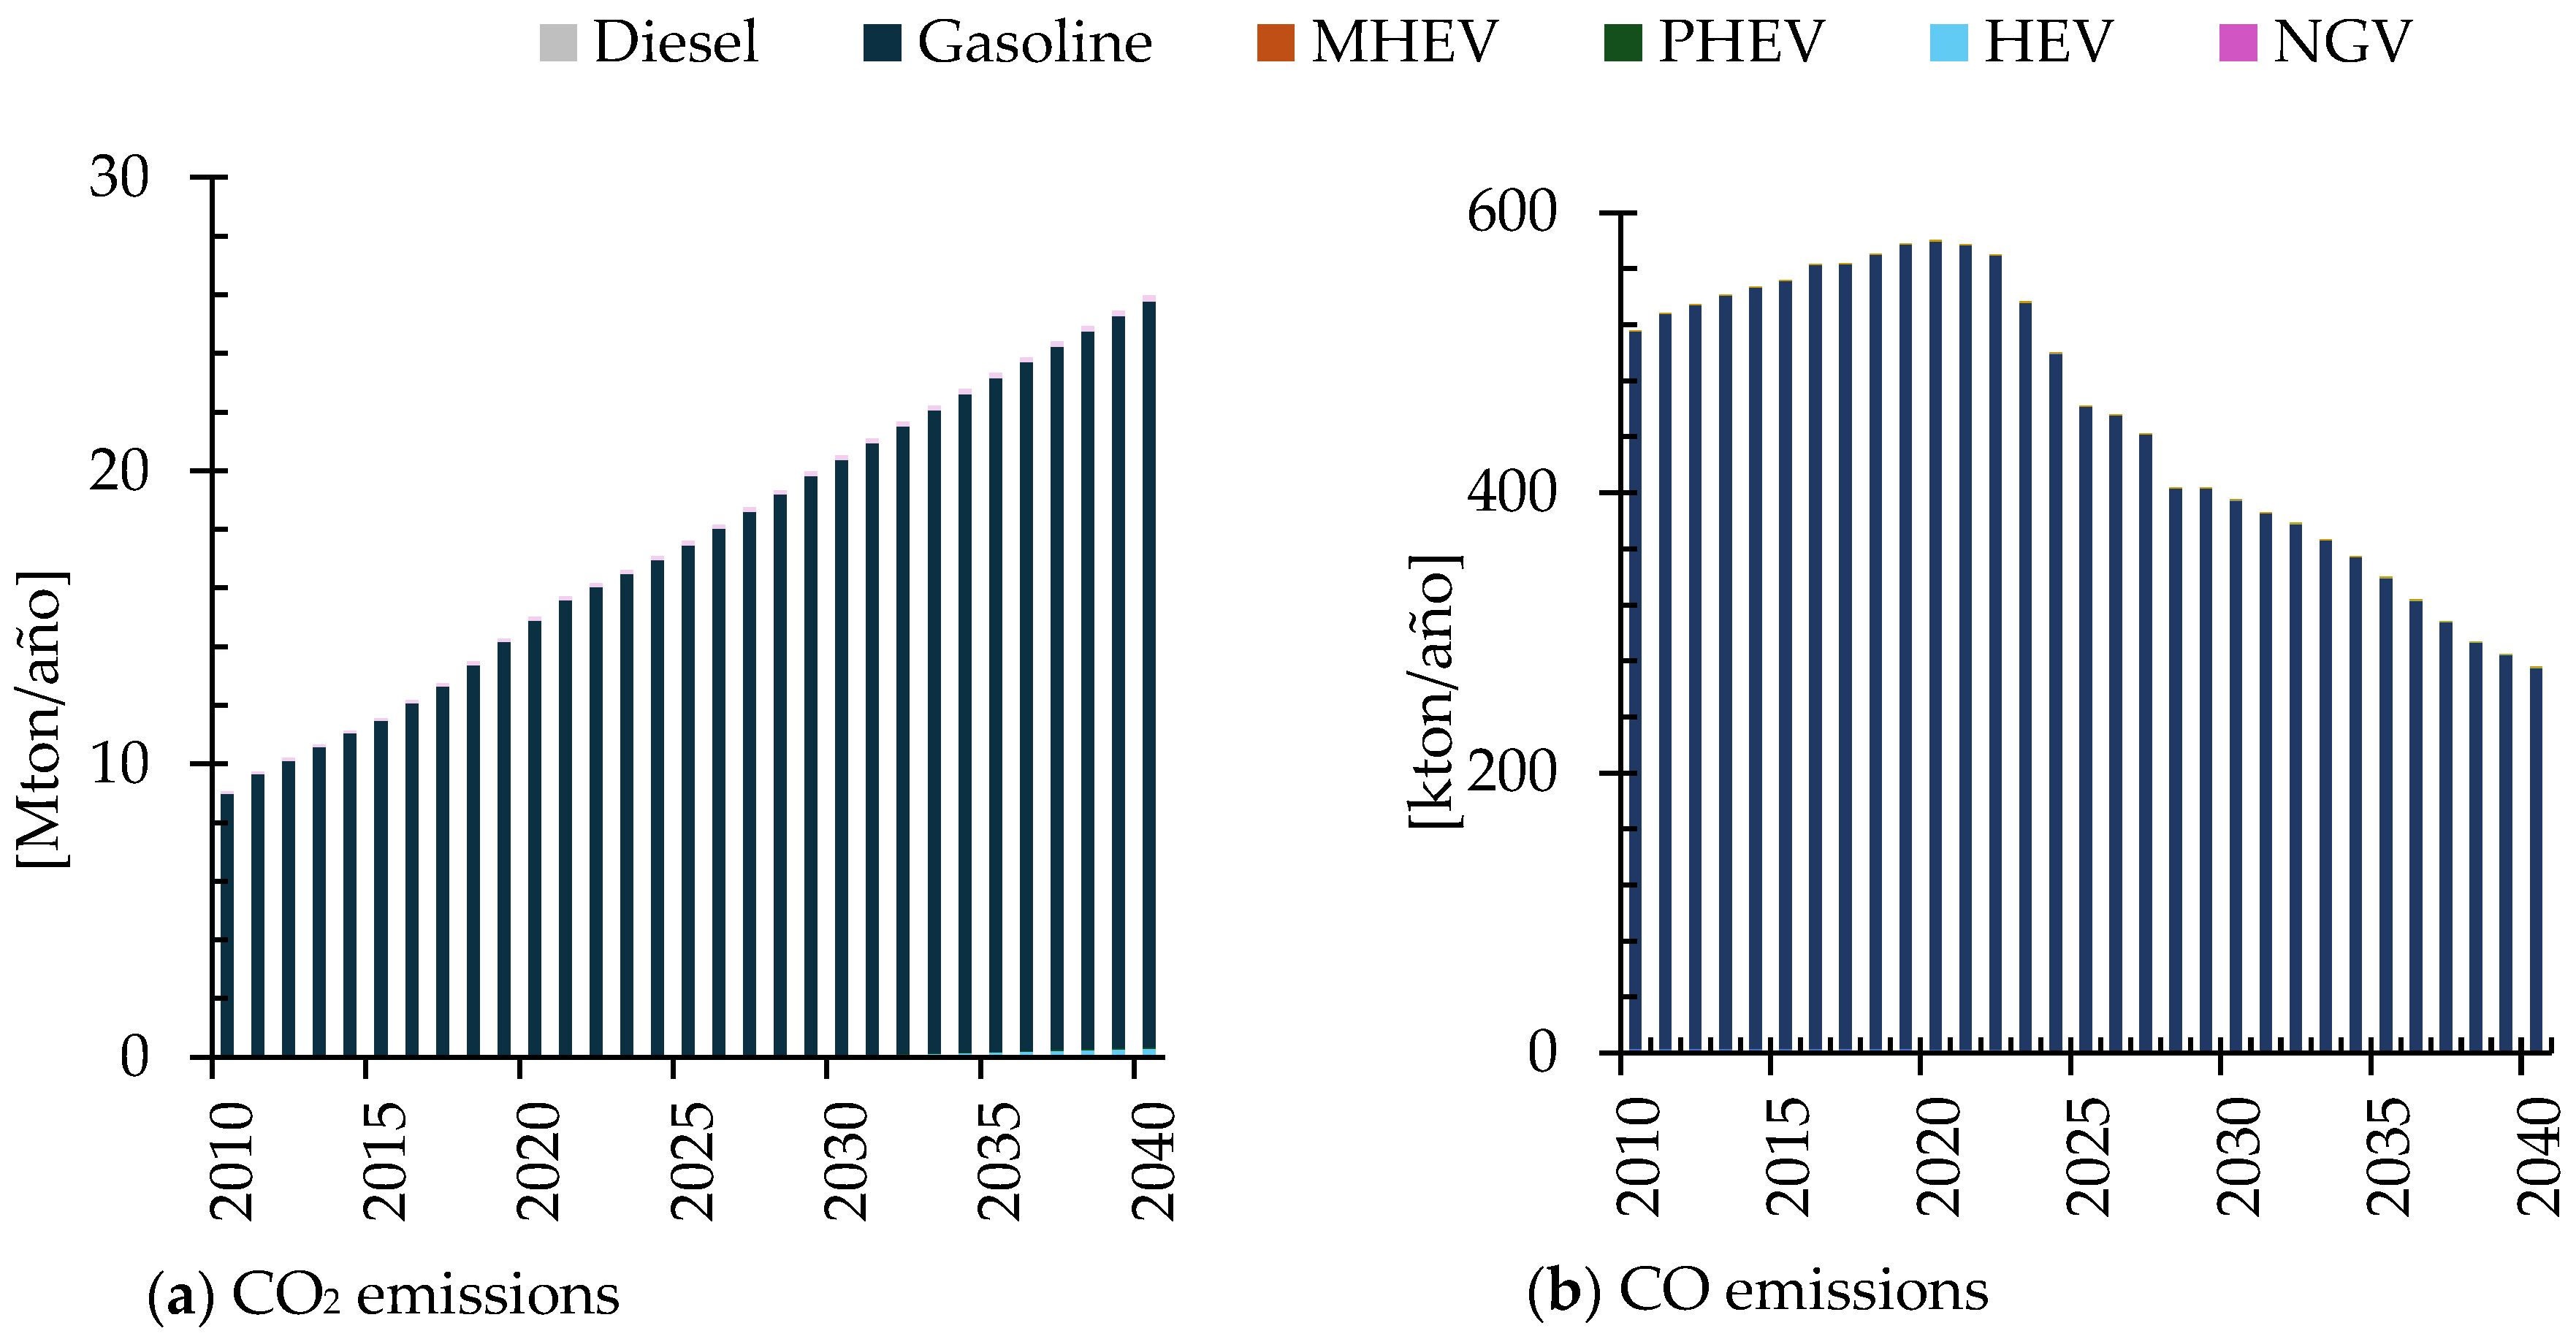
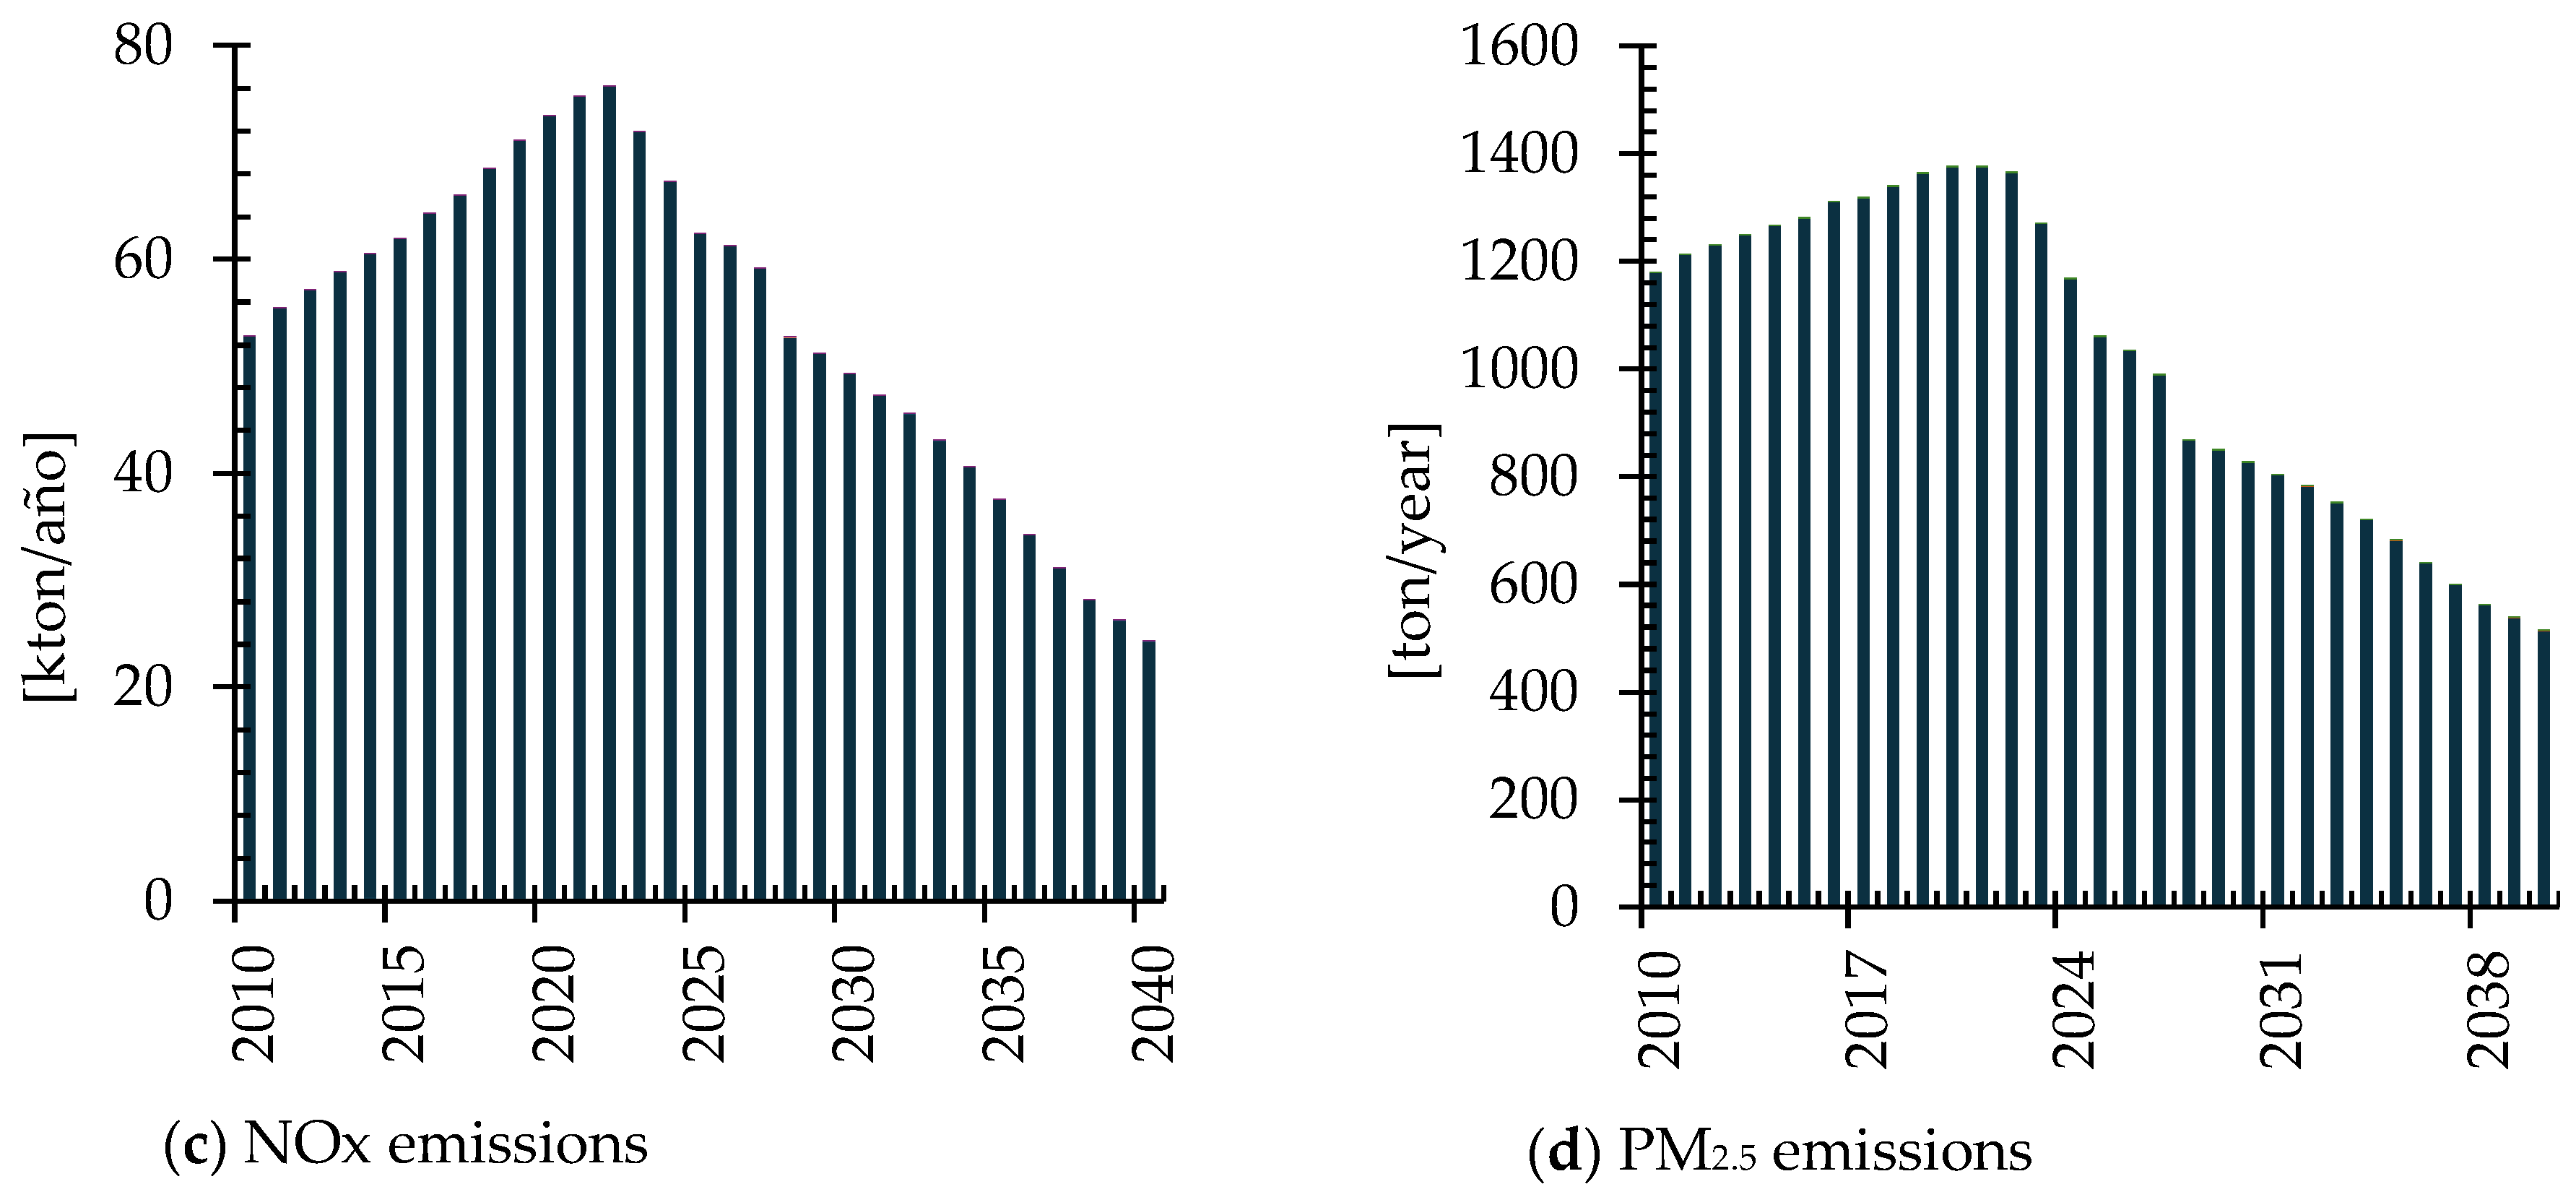
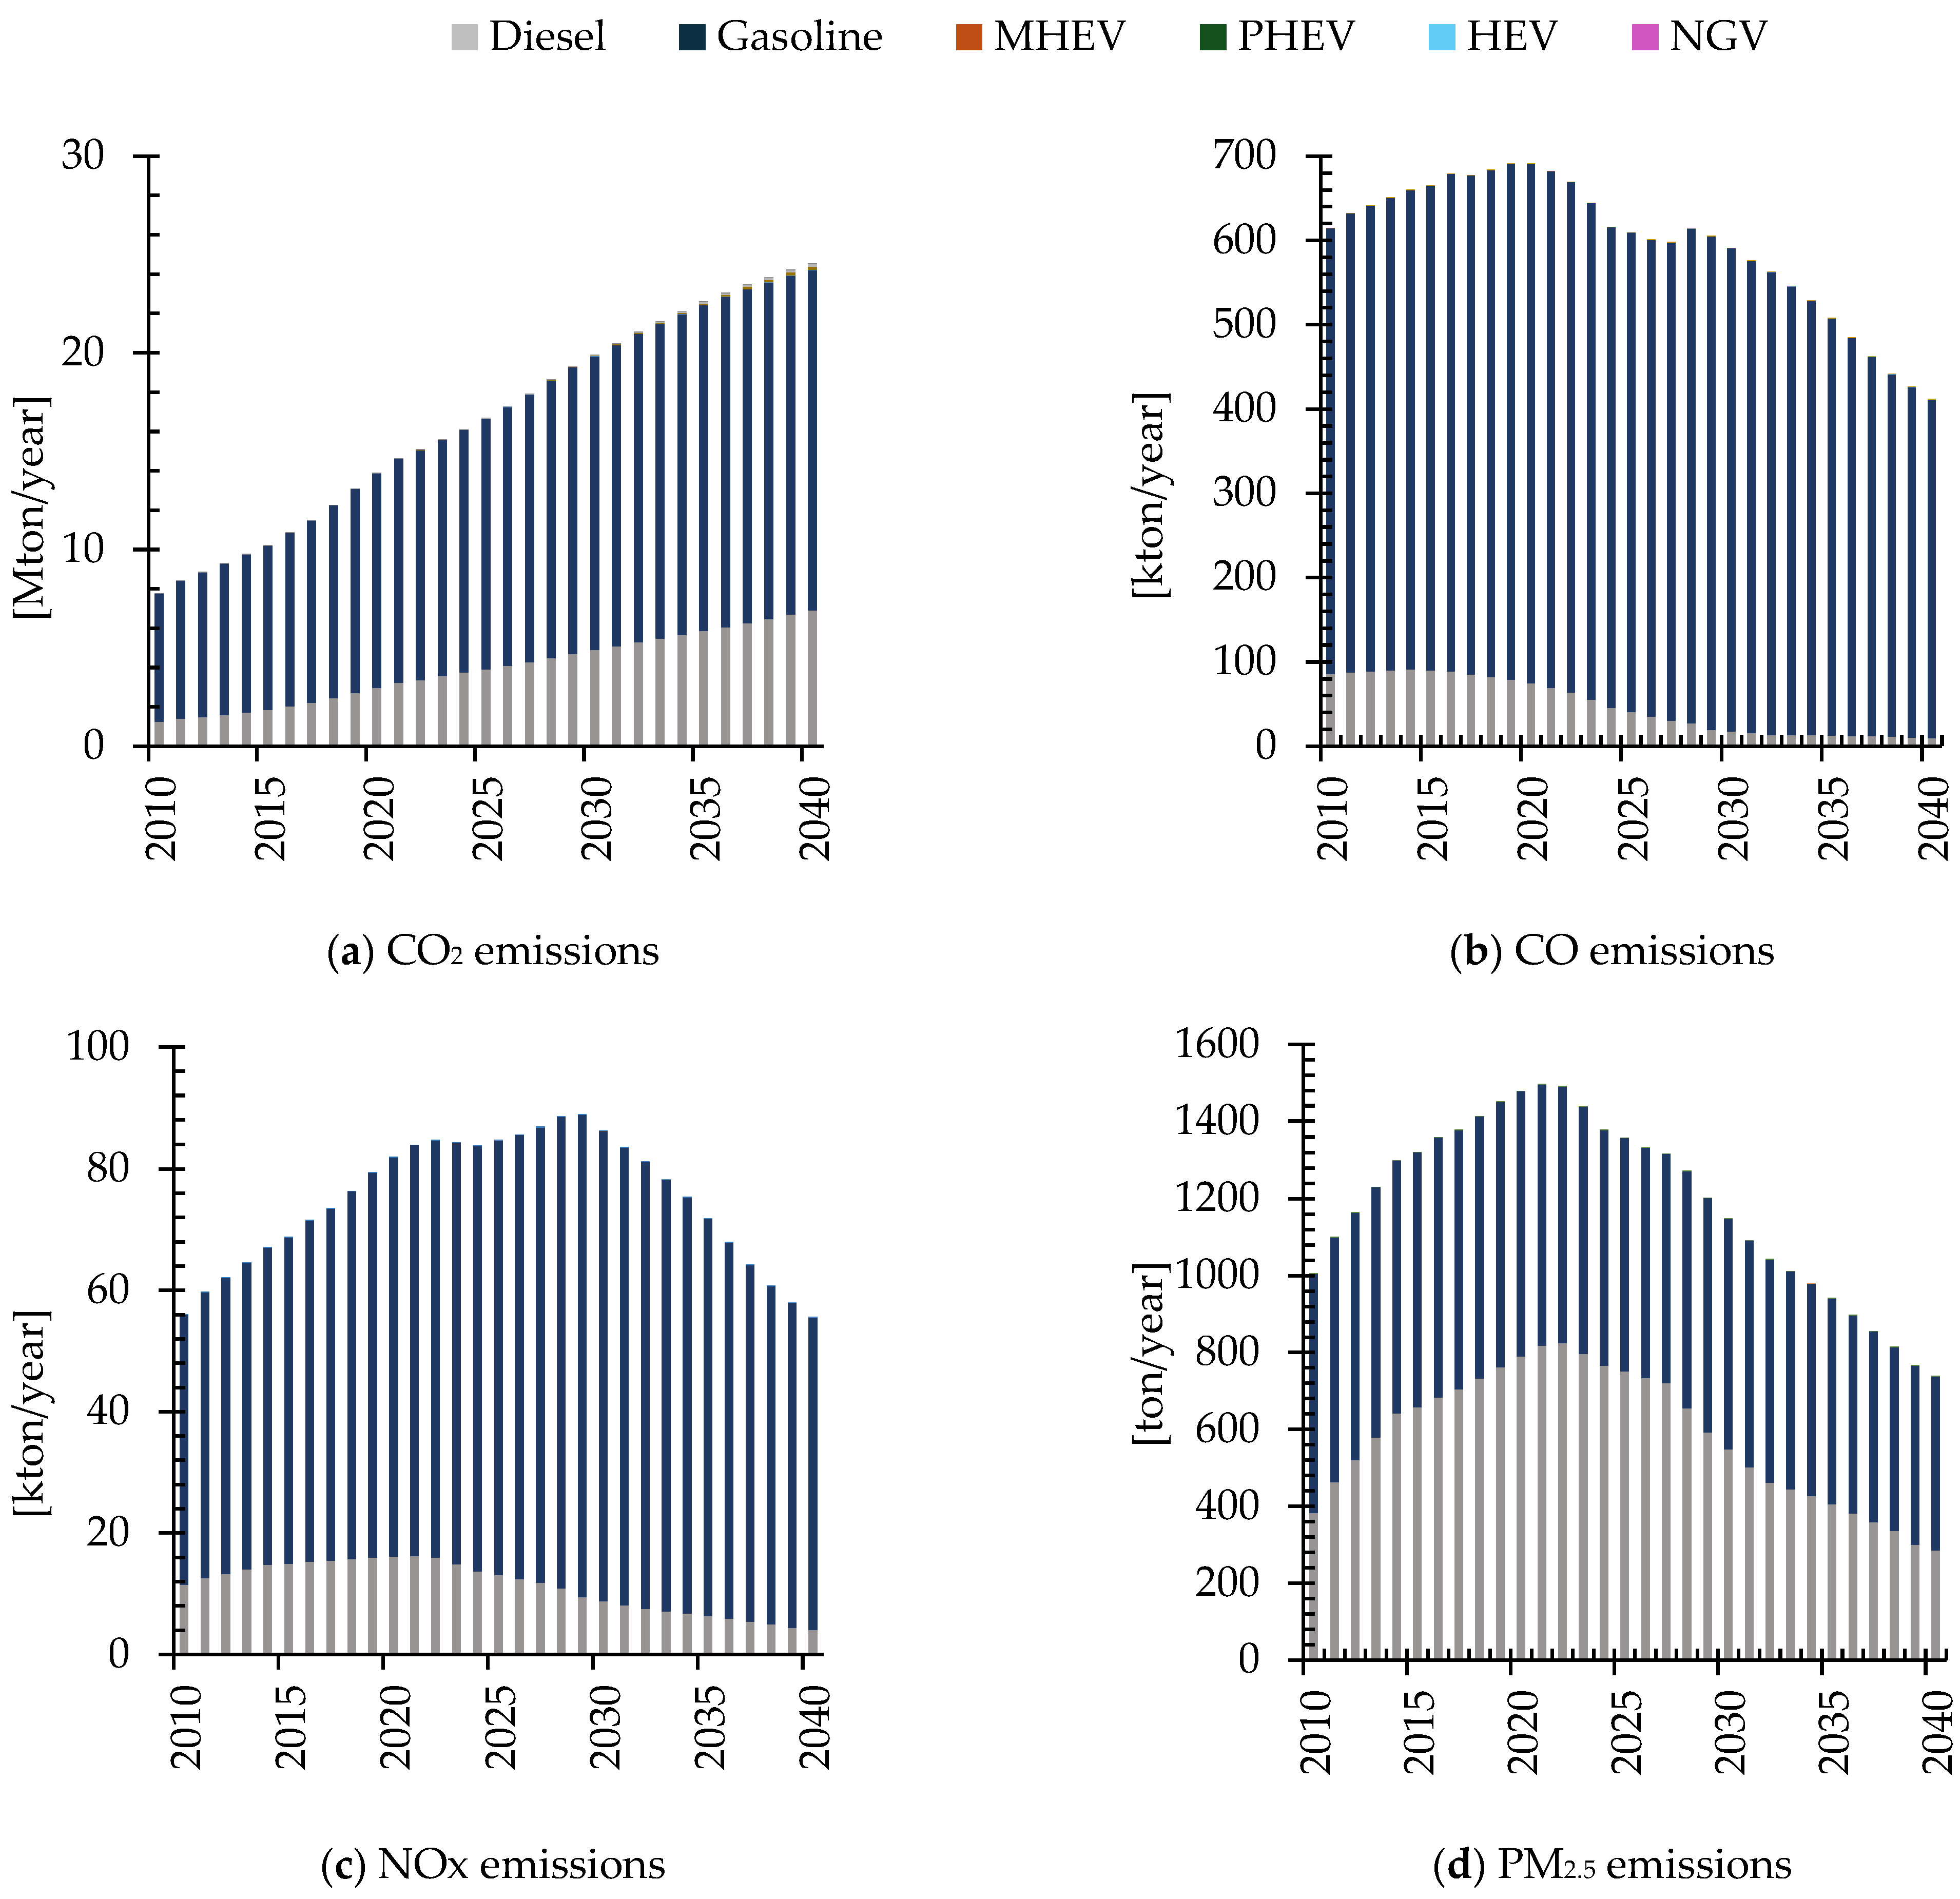
The estimation of emissions from the vehicle fleet is also affected each year by changes in the vehicle fleet. CO
2 emissions from cars, vans, and SUVs continue to increase. On the other hand, CO, NO
x, and PM
2.5 emissions show a trend change at the beginning of the 2020s, as shown in
Figure 6 and
Figure 7. This is mainly due to the reduction in emissions from the gasoline vehicle fleet due to the imposition of new emission standards, low- and zero-emission vehicle technologies, vehicle replacement, and the fulfillment of their useful life. The same behavior is observed in vans and SUVs.
The costs generated by emissions are evaluated considering the composition of the vehicle fleet. The projection shows that, due to the increase in the number of vehicles, in the last study period (2035–2040), the costs generated by CO2 increase by 35.72% compared to the previous period, which is twice the increase in previous years. Additionally, the change in the emission standard does not improve vehicle performance, so CO2 emissions continue to rise in relation to energy consumption.
The costs associated with CO, NO
x, and PM2.5 decrease in the following years, being more noticeable for NO
x, decreasing from more than COP 21 trillion in 2020–2024 estimated in net present value to less than 15.5 trillion in 2035–2040. In the case of CO and PM
2.5 costs, although the costs decreased each five-year period, the variation was smaller in the last period, as shown in
Table 10.
The results of the base scenario show benefits in terms of reducing pollutant emissions. However, CO2 emissions continue to increase, and no significant contribution to their reduction is identified due to the introduction of hybrid vehicles. This is because their percentage in the number of vehicles is minimal under the current scenario.
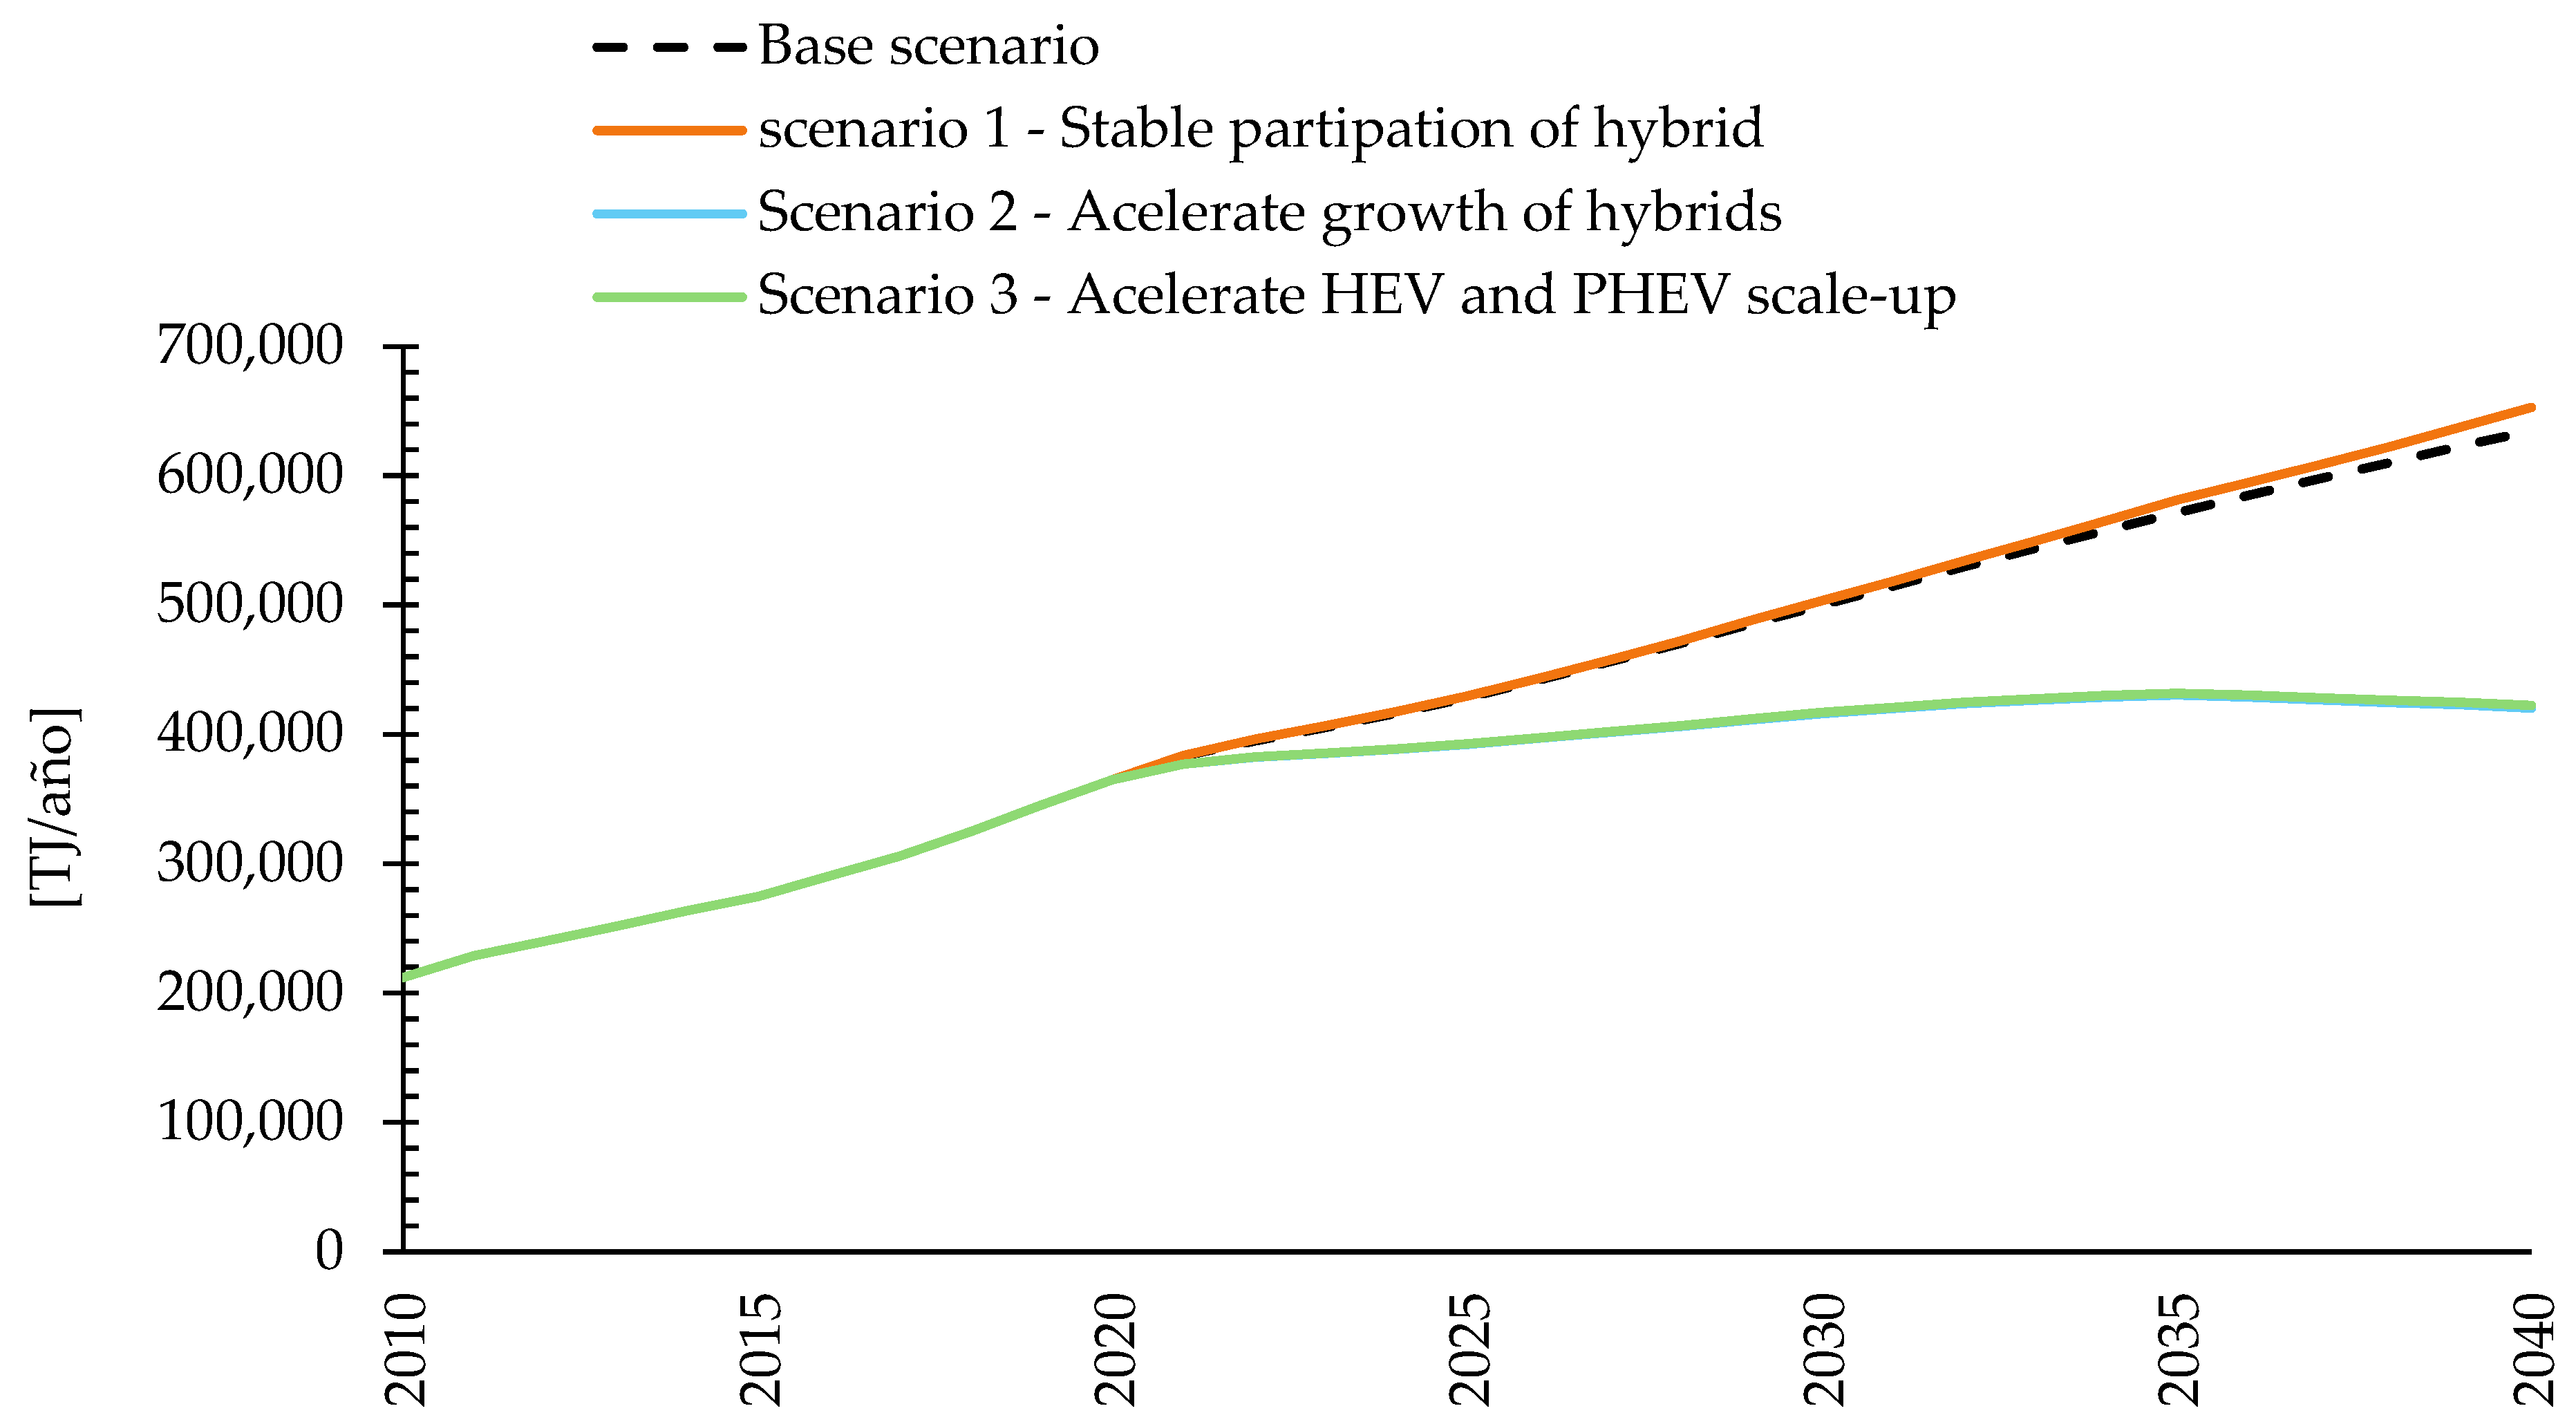
Figure 8 shows the energy consumption of light vehicles for the three scenarios from 2020 to 2040. In all three scenarios, there is an increase in energy consumption, as mentioned earlier, due to the increase in the number of vehicles. However, variances are perceived due to the participation of hybrid vehicles:
Scenario 1 shows a slight increase in energy consumption compared to the base scenario, about 1.72% in 2035 and 2.87% in 2040. The percentage of hybrid vehicles remains constant, an increase in the vehicle fleet presents an increase in the number of hybrid vehicles. However, as their participation does not increase over time the fuel consumption by conventional vehicles is predominant. In this sense, conventional vehicles have lower fuel performance than other motorization technologies. Therefore, in this scenario, there is higher energy consumption compared to the base scenario, where hybrid vehicle technologies show independent logistic growth.
Scenario 2 shows a significant reduction in energy consumption compared to the base scenario, with a reduction of 24.64% identified for 2035 and 33.81% for 2040. In this scenario, the importance of hybrid vehicle participation in the vehicle fleet can be observed. However, it is notable that this reduction is due to the high performance of HEV and PHEV vehicles.
Scenario 3 does not differ from Scenario 2, reinforcing the hypothesis that MMHEV vehicles do not substantially contribute to reducing energy consumption.
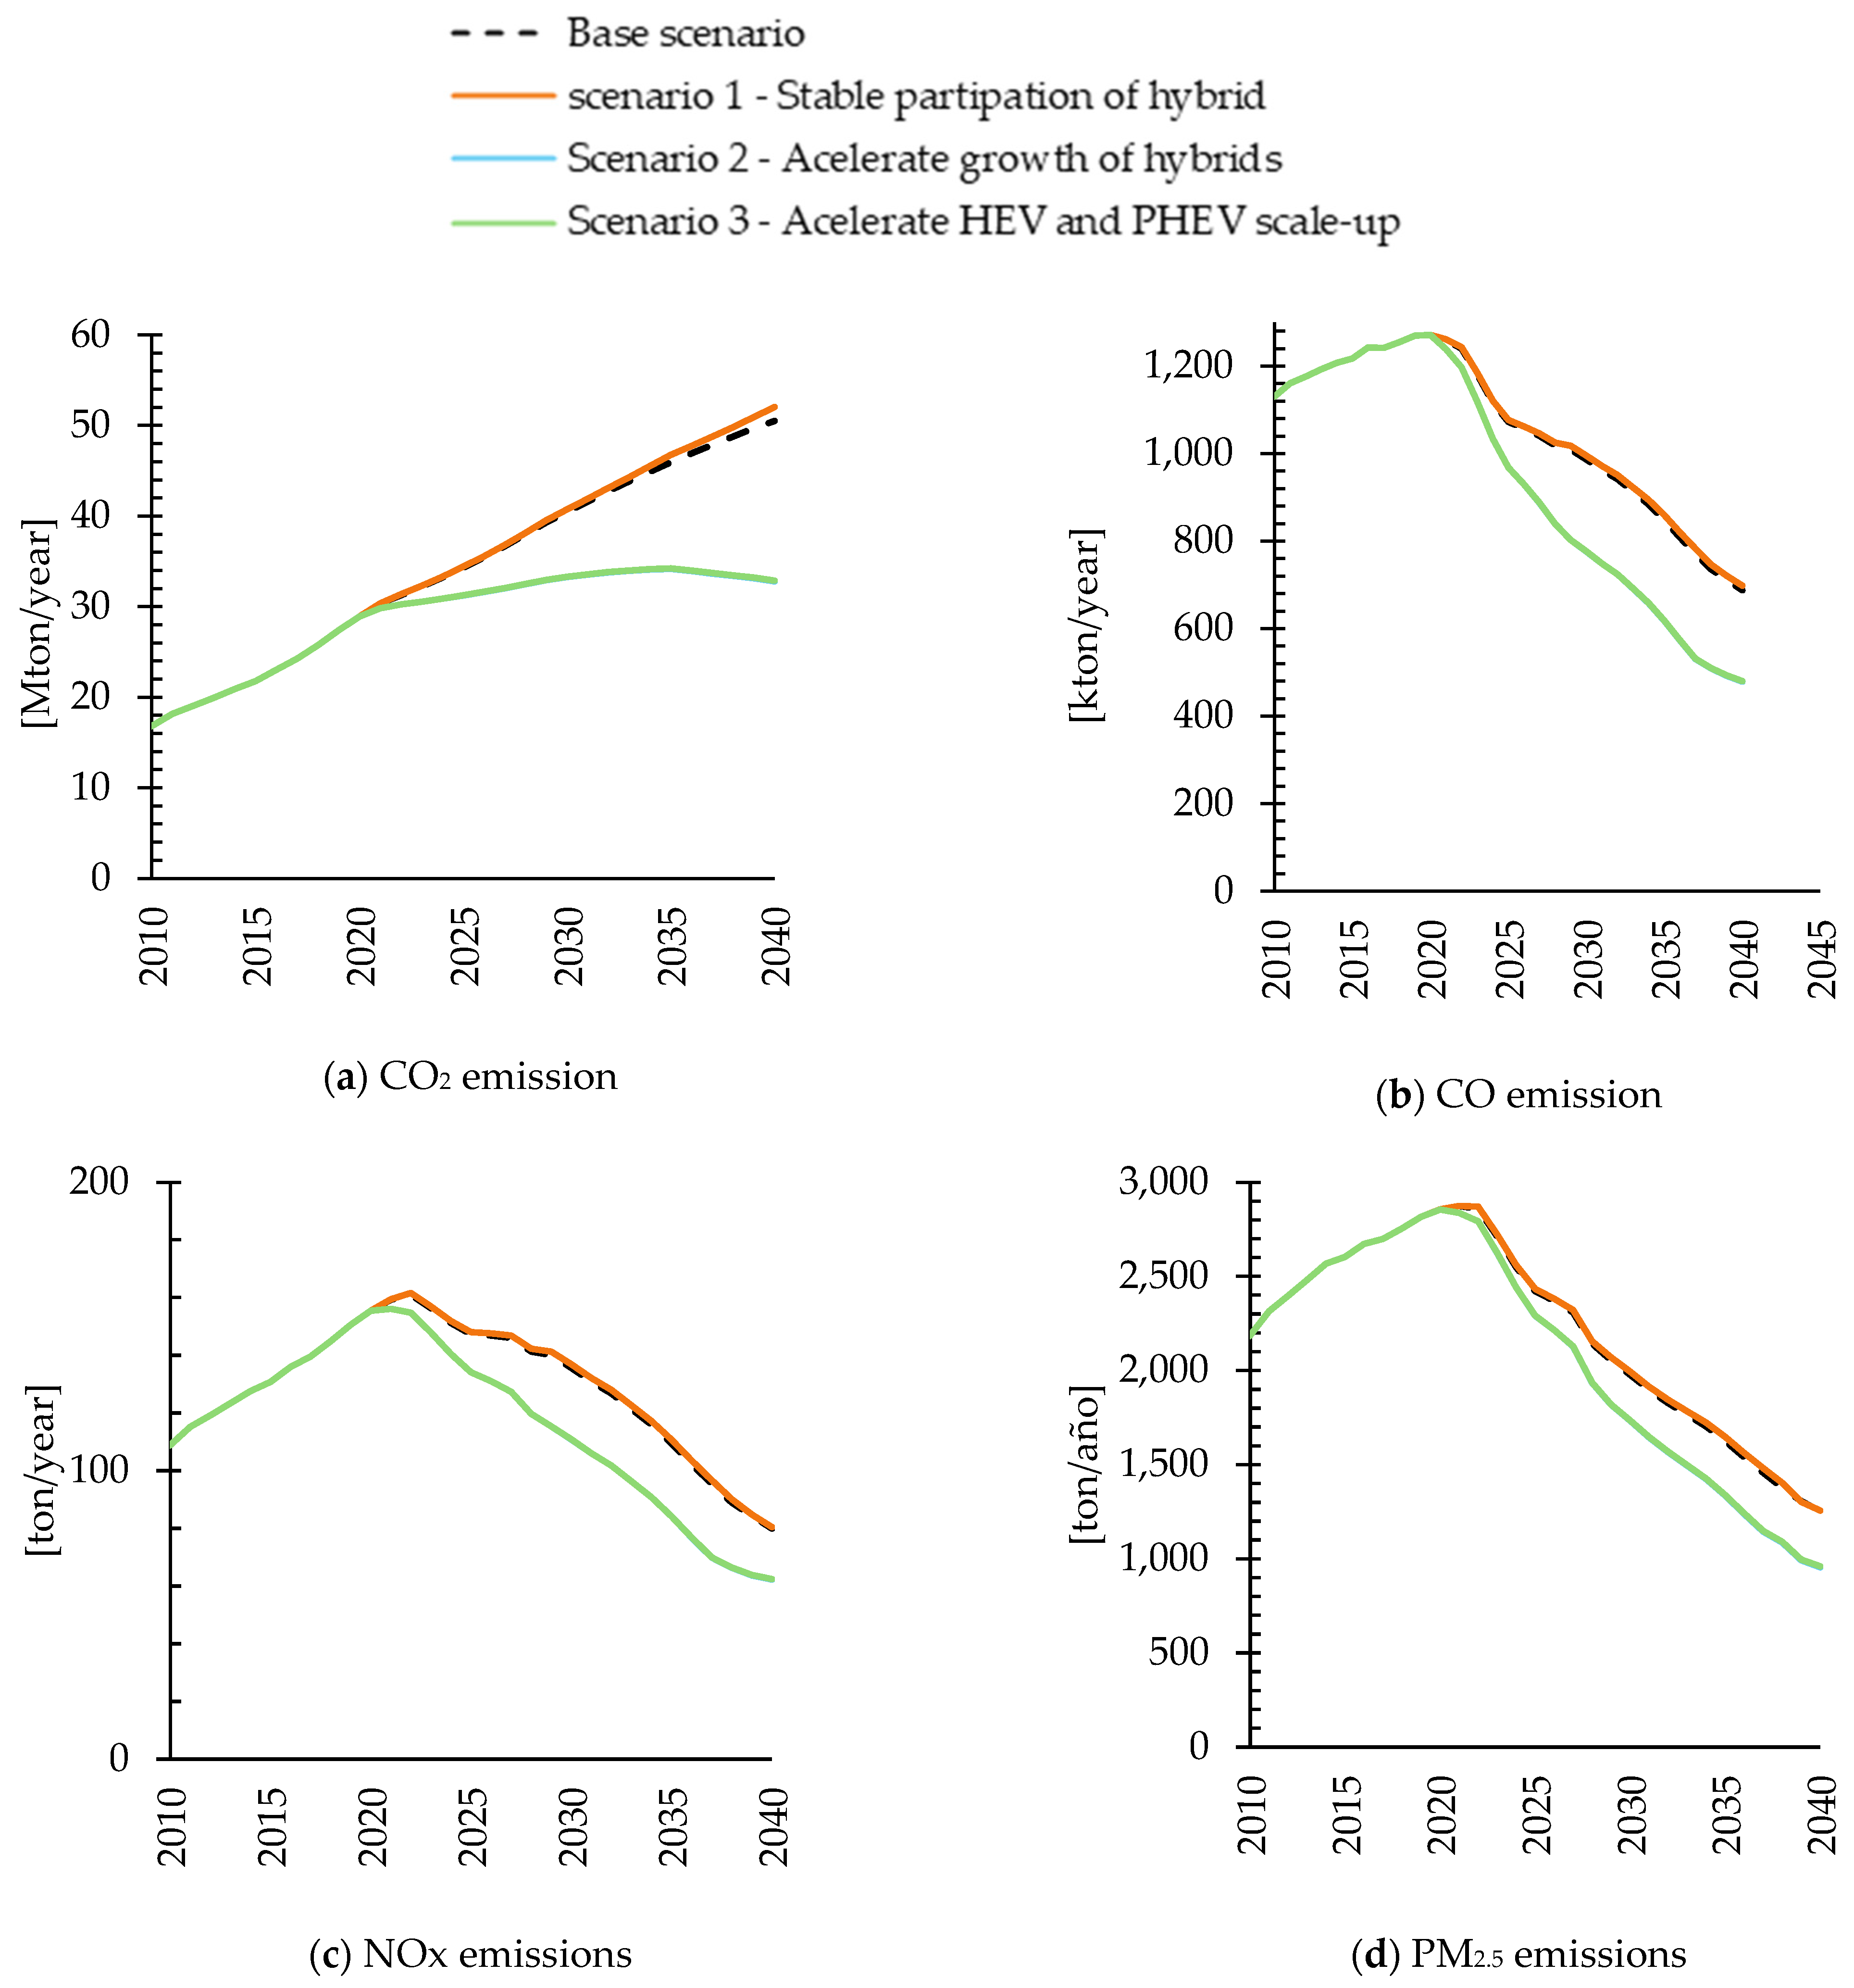
Figure 9 shows the CO
2, CO, NO
x, and PM
2.5 emissions presented by the vehicle fleet during the analyzed period. As expected, the behavior of CO
2 emissions is identical to that of energy consumption. However, in the case of pollutant emissions, it is completely different. It can be observed that pollutant emissions show an immediate reduction from 2024. This is due to the introduction of the Euro IV standard and the fact that most Pre-Euro and Euro 1 standard vehicles reach the end of their useful life.
In the case of CO emissions, by 2040, Scenario 1 does not show a significant difference, 1.53% higher than the base scenario. Meanwhile, Scenarios 2 and 3 show reductions of up to 30.32%. For NOx, Scenario 1 shows an increase of 0.64%, while Scenarios 2 and 3 show reductions of 22.16% and 21.98%, respectively. Finally, for PM2.5 emissions, Scenario 1 increases the percentage by 0.19%, while the other scenarios show a reduction of up to 23.84%. The small variance between Scenario 2 and Scenario 3 confirms the limited influence of MHEV vehicles in reducing emissions. Additionally, it can be identified that the reductions in NOx and PM2.5 due to the massive growth of hybrid vehicles are smaller than those presented in CO.
Table 11 presents the percentage values of the comparison of Scenario 1 with respect to the base scenario.
Likewise, considering the emissions generated by the vehicle fleet in Scenario 1, the percentage difference in environmental costs compared to the base scenario is calculated. There is a small increase in environmental costs compared to the baseline scenario. The
Table 12 shows that the environmental costs in the five-year period from 2035 to 2040 for CO
2 are 2.18% higher than in the baseline scenario, and the same is true for pollutant emissions. This is due to the fact that hybrid vehicles that cease to enter the market are replaced by conventional vehicles with higher emissions per kilometer.
The second scenario, which proposes an accelerated introduction of hybrid technologies, would have favorable effects on energy consumption and emissions, which are replicated in costs. In 2025, energy consumption is 8.39% lower, and this difference increases steadily until 2040, where approximately 34% lower consumption is reached compared to the base scenario for the same year.
Table 13 presents the percentage variation of emissions in Scenario 2 compared to the base scenario.
It is estimated that, by 2040, emission reductions on average would result in a 25% reduction in environmental costs. The largest reductions in pollutant emissions are identified for CO, with around 29.80%.
Table 14 shows the variation in costs associated with emissions.
Finally, the third scenario aims to evaluate the influence of MHEV vehicles in the accelerated introduction scenario of hybrid vehicles. The projection shows results similar to Scenario 2. Energy consumption in 2025 in this case would be 8.31% lower, and in 2040, 33.46% lower, than the base scenario.
Table 15 presents the percentage variation in energy consumption and emissions in Scenario 3 compared to the base scenario.
For Scenario 3, the environmental cost generated by CO
2, CO, NO
x, and PM
2.5 emissions, which in the base scenario was estimated at COP 78.3 trillion, was reduced to COP 56.2 trillion. In this case, environmental costs are on average 26.4% lower than in the base scenario.
Table 16 shows the percentage change in the cost associated with emissions in Scenario 3 compared to the base scenario.
It is important to mention that although CO2 emissions are growing in proportion to the increase in energy consumption of the vehicle fleet, pollutant emissions are decreasing due to the incorporation of new and increasingly stringent emission standards. It can be inferred that since the proportion of conventional vehicles is still much higher than hybrid electric vehicles, the emission standards represent considerable improvements. This can be observed for all proposed scenarios.
4. Discussion and Conclusions
The increase in hybrid vehicles in Latin American countries is notable. These new motorization technologies are seen as a positive step towards the energy transition, and therefore countries are promoting their market penetration. However, the expectations of reducing energy consumption and emissions of both GHGs and pollutants may be misguided. As emerging economies, the renewal of the vehicle fleet can be slow [
46]. This study allows energy consumption and emissions projections to be addressed considering different levels of hybridization of electric vehicles (MHEVs, HEVs, and PHEVs). It has also made it possible to evaluate the behavior of possible reductions in energy consumption, emissions, and costs associated with the integration of new motorization technologies in the vehicle fleet. This provides the possibility for governments to make decisions based on technical grounds.
The results found, for the case of Colombia, indicate that even with the current growth rate of hybrid vehicles (base scenario), it does not represent a significant change in emissions and energy consumption compared to a scenario where their incentives are restricted (Scenario 1). It should be noted that this may be associated with the number of conventional vehicles in the country and despite the introduction of new emission standards and even simulating a useful life, their participation dampens any positive results.
On the other hand, when the market share of hybrid vehicles is much higher than expected (Scenario 2 and Scenario 3), energy consumption and emissions are significantly reduced. Even so, the MHEV level of hybridization does not provide a significant improvement. Although MHEV technology supports the operation of accessories and air conditioning, it does not have an electric motor powerful enough to move the vehicle, which means its operation is essentially combustion-based. Start–stop technologies combined with higher-capacity alternators are referred to as MHEVs. These technologies reduced the fuel consumption by only 3.1% to 4.3% compared to conventional vehicles [
47].
The light vehicle fleet in Colombia is projected to grow by an average of 19.8% per five-year period, reaching approximately 10.9 million vehicles by 2040, with 60.6% being cars and 39.4% vans and SUVs. Hybrid vehicles are expected to increase by 3.9% for cars and 5.3% for vans and SUVs by 2040. Among hybrid technologies, HEVs (hybrid electric vehicles) will dominate, with 69.6% of the market, followed by PHEVs (Plug-in Hybrid Electric Vehicles) at 18.9%, and MHEVs (Mild Hybrid Electric Vehicles) at 11.5%.
For the case of Colombia, the total energy consumption for the fleet in 2024 is 416,254 TJ/year, with hybrid vehicles contributing 491 TJ/year (0.12%); this is expected to rise to 8924 TJ/year by 2040, representing 1.4% of total consumption. Despite decreasing pollutant emissions due to the introduction of higher vehicle standards, CO2 emissions remain challenging to mitigate given the dominance of conventional vehicles. Accelerated adoption of HEVs and PHEVs presents the greatest opportunity for reducing energy consumption and emissions, highlighting the limited impact of MHEVs in achieving these reductions.
The results indicate that when the adoption rates of these technologies are relatively low, the benefits in energy consumption and emissions could be debatable. Based on the above, it is proposed that governments should formulate policies to meet consumption and emission reduction targets, based on one of the following strategies: (i) improve economic and non-economic benefits to more successfully boost sales of HEV, PHEV, and electric vehicle technologies, or (ii) exclude hybrid vehicles from benefits and improve those granted to EVs to reduce acquisition costs. It is possible that with option (i), the rise of new technologies will motivate awareness of the energy transition, and the population will break the inertia of using internal combustion vehicles, as myths are dispelled through general knowledge and the adoption of these technologies.
On the other hand, the results show that the improvement in air quality is influenced by the introduction of HEV and PHEV hybrid vehicles. However, the introduction of more stringent emission standards presents the greatest contribution, given that conventional vehicles still lead sales in the national market. This is also related to the need to implement energy performance standards, as there is a diversity of hybrid vehicle lines, and some may have low fuel performance, which directly affects the country’s energy consumption and thus the generation of GHG emissions.
In this sense, the country could opt for measures such as the following:
Direct and improved benefits on income tax deductions for the acquisition value of new HEV and PHEV hybrid vehicles, provided that the emissions per kilometer reported are lower than the average of conventional vehicles. This is like the measure adopted in Spain, where a 15% deduction is granted [
48]. This will incentivize the purchase of more efficient and less polluting vehicles.
Implement a gradual reduction in the circulation tax for PHEVs and HEVs, like Chile’s strategy, where benefits decrease over time, for example, offering a 100% reduction in the first two years, 75% in the next two years, 50% in the fifth and sixth years, and 25% in the seventh and eighth years, until the benefit is eliminated from the ninth year onwards.
These proposals aim to create a regulatory framework that promotes the use of hybrid electric and low-emission vehicles in Colombia, fostering the adoption of more efficient and sustainable technologies.
This study is proposed as the beginning of the evaluation of hybrid vehicle technologies, and therefore it presents limitations that should be addressed by other studies. Initially, the proposed analysis focuses on tank-to-wheel emissions and energy consumption, so a life cycle analysis could complement the global emissions due to energy use by these technologies. Countries like Brazil have hybridization technologies and flex-fuel engines, which could show different results when considering life cycle analysis. On the other hand, the average performance and emissions for hybrid vehicles were obtained from the ANLA database. However, as mentioned, since the information is reported under different driving cycles, it was not possible to consider the emissions of all vehicle lines. It would be of great value to complement and compare the information with other databases.


 ,
, 