1. Introduction
With the increasing severity of the global energy crisis and environmental pollution, HFCVs have become a key solution for achieving green transportation and sustainable development, due to their high efficiency and zero emissions [
1]. Furthermore, hydrogen fuel, as a renewable energy source, offers advantages such as cleanliness and safety [
2]. In dynamic and complex operating conditions, the fuel cell system must respond rapidly, placing higher demands on its durability and the overall economic efficiency of the system [
3]. Therefore, it is essential to design an effective energy management control strategy to address these challenges [
4,
5].
The energy management and control strategy for HFCVs is key to ensuring vehicle performance and economy. The current research on optimizing the collaborative operation between the fuel cell and the power battery mainly focuses on two directions [
6]: a rule-based control strategy [
7,
8,
9] and an optimization-based control strategy [
10,
11,
12].
The rule-based energy management control strategy is developed based on engineering experience. While it offers good real-time control performance, it is difficult to achieve optimal fuel economy. Currently, the rule-based control strategy mainly includes a thermostat control strategy [
13], a fuzzy control strategy [
14], a multi-mode switching control strategy [
15], and a power-following control strategy [
16].
The optimization-based control strategy can be broadly categorized into global optimization control and instantaneous optimization control approaches. Although the former can achieve optimal control performance, it typically requires prior knowledge of the entire operating condition information and involves a large computational load, making it difficult to apply in practical control scenarios. The latter achieves optimal control based on the status of the vehicle’s system and the current operating condition information. Common optimization algorithms include dynamic programming [
17], Pontryagin’s minimum principle algorithm [
18], genetic algorithms [
19], convex optimization [
20], and particle swarm optimization [
21], among others.
With advancements in artificial intelligence, reinforcement learning (RL)-based energy management strategies have evolved, leveraging historical driving data for iterative optimization. Li et al. [
22] proposed a Q-learning strategy with deterministic rules for optimal control. Lin et al. [
23] developed an RL-based approach for plug-in fuel cell electric vehicles, demonstrating improved battery maintenance and reduced energy consumption. Tang et al. [
24] enhanced deep learning efficiency via the adoption of distributed architecture, achieving a fourfold improvement. Qi et al. [
25] introduced a hierarchical RL framework for hybrid vehicle energy management, addressing sparse rewards and optimizing the power distribution. However, RL-based strategies require extensive training, limiting their real-time adaptability and introducing discretization errors.
In traditional fuel cell control strategies, the power-following control strategy is a commonly used approach that derives the hydrogen fuel cell target power from the required drive motor power and the power battery’s state of charge (SOC). This enables the hydrogen fuel cell output power to vary with the operating conditions, avoiding large current discharge from the power battery and significantly improving the vehicle’s NVH performance. However, the threshold parameters of the power-following control strategy are fixed, which may lead to frequent start–stop cycles and low efficiency of the fuel cell. To address this issue, numerous studies have applied intelligent optimization algorithms to the energy management and control strategy. Li et al. [
26] optimized the CD-CS power-following strategy using particle swarm optimization, improving the performance despite the algorithm’s complexity in regard to parameter tuning. Xiao et al. [
27] applied a genetic algorithm for multi-objective optimization, balancing fuel economy, performance, and the assembly cost, although its practical application remains challenging due to complex operating conditions.
Driving conditions significantly impact the economic performance of fuel cell vehicles, making their integration into energy management strategies a key research focus [
28,
29]. Lei et al. [
30] applied cluster analysis for condition recognition, while Sun et al. [
31] used data clustering to classify vehicle routes, based on static and quasi-static traffic features. However, initial cluster center selection remains a challenge. Zhan et al. [
32] optimized power allocation based on equivalent fuel consumption coefficients, improving fuel economy by 7.47%. Zhao et al. [
33] enhanced driving condition recognition in hydrogen fuel cell hybrid vehicles using a genetic algorithm-optimized support vector machine, improving fuel cell efficiency and battery longevity. Li et al. [
34] combined mode switching, adaptive thresholds, and historical data optimization via particle swarm algorithms, demonstrating superior fuel economy. Qin et al. [
35] employed a Markov model for speed prediction and developed a stochastic model predictive control strategy, achieving a 28.64% fuel economy gain compared to rule-based methods. Yang et al. [
36] utilized a radial basis function neural network for speed prediction, integrating DP for optimization. Guo et al. [
37] introduced an energy management strategy using a variable horizon speed prediction model and Q-learning for SOC trajectory optimization, yielding improved fuel economy in the simulations.
The existing power-following control strategies suffer from fixed key parameters, leading to suboptimal performance in complex driving conditions. As discussed earlier, employing optimization algorithms, such as particle swarm optimization, for real-time tuning introduces challenges related to parameter adjustment and computational complexity, making pure optimization-based approaches unsatisfactory. Similarly, reinforcement learning faces practical limitations due to the difficulties in regard to data acquisition, training, and hyperparameter tuning, hindering its direct application.
To address these issues, a hybrid approach is proposed to optimize the power-following control strategy. Initially, fuzzy control is employed to refine the control strategy; however, this alone is insufficient to achieve optimal performance. Considering key factors in terms of vehicle operation, particularly speed, a gated recurrent neural network, which is well-suited for speed prediction, is incorporated, based on recent advances in driving condition recognition. Instead of using predicted speed for real-time control computation, which is common in conventional studies where the control strategy is computed at every time step for the entire prediction horizon, significantly increasing the computational load, the proposed approach extracts key feature parameters of the prediction horizon. These parameters are then fed into a driving condition recognizer, which adjusts the power-following control strategy accordingly. This method substantially reduces computational complexity and enhances the feasibility of real-time implementation.
This paper proposes a fuzzy power-following energy management strategy based on driving condition recognition, aiming to improve fuel economy while ensuring the stability of the fuel cell operating state and battery SOC, thereby achieving optimal control. By utilizing a gated recurrent unit (GRU) neural network for speed prediction and employing k-means cluster analysis to establish a driving condition recognizer, the proposed strategy dynamically identifies the driving conditions and updates the key parameters of the power-following control strategy in real time, thereby enhancing its adaptability to varying operational conditions. Additionally, fuzzy control is incorporated to further refine the power demand adjustments. This strategy’s effectiveness is enhanced by its minimal computational requirements and rapid processing in regard to online applications. The key contributions of this paper are as follows.
A hybrid system for fuel cell vehicles was designed, involving the selection and design of hybrid powertrain parameters, and a corresponding model was established in Matlab/Simulink R2023b;
A fuzzy power-following control strategy based on driving condition recognition for fuel cell vehicles was proposed, which takes into account vehicle fuel economy and the fuel cell operating state, the battery’s SOC;
A GRU neural network speed prediction model was developed, and a driving condition recognizer was established using k-means cluster analysis. This enabled the online updating of the key parameters in the power-following control strategy, facilitating the real-time implementation of the proposed control strategy;
A comparative analysis with the traditional power-following control strategy and the single-method optimized power-following control strategy demonstrated the significant advantages of the proposed control strategy in terms of vehicle fuel economy and the fuel cell operating state, the battery’s SOC.
The remainder of this paper is organized as follows.
Section 2 presents the modeling of the hydrogen fuel cell vehicle system.
Section 3 elaborates on the conventional power-following control strategy and provides an introduction to the fuzzy control module and operating condition recognition module. In
Section 4, the proposed control strategy is validated through simulations for two representative driving cycles, CLTC-P and NEDC, which is followed by a discussion of the results. Finally,
Section 5 concludes the paper.
2. Hydrogen Fuel Cell Vehicle System Modeling
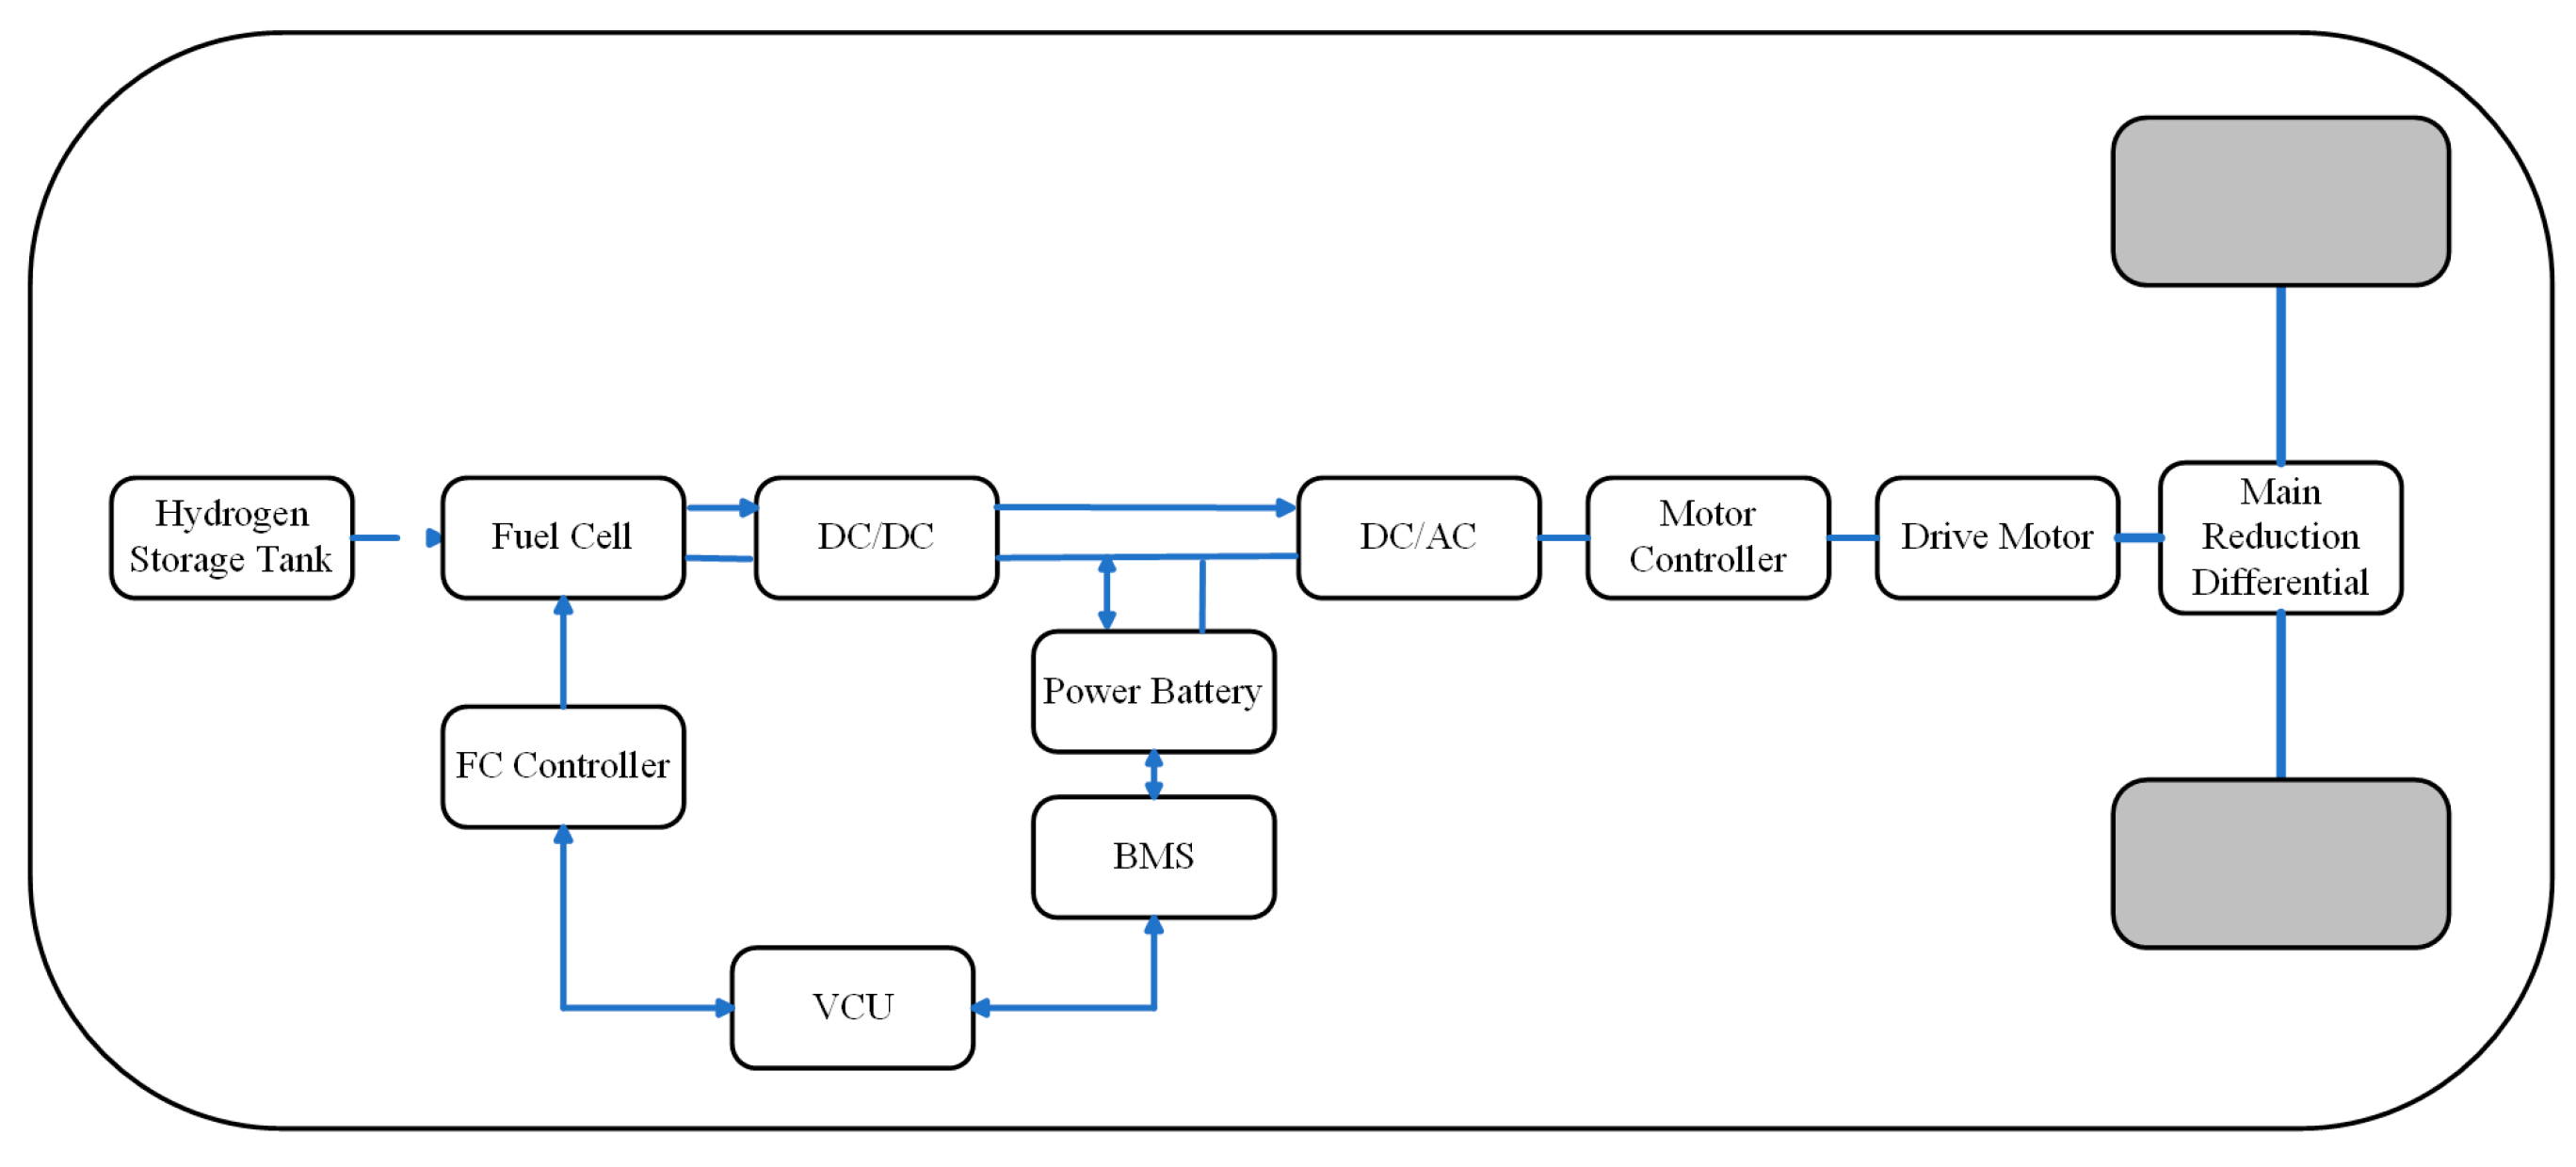
The hydrogen fuel cell vehicle studied, primarily consisting of a fuel cell system and a controller, a power battery system, a DC–DC converter, a drive motor system, and a reduction transmission mechanism, as shown in
Figure 1. The vehicle parameters are listed in
Table 1.
2.1. Automotive Dynamics Model
The following equation is used to build a system model based on vehicle dynamics theory:
In the formula:
is the driving force required during vehicle operation;
is the total vehicle mass;
is the road slope;
is the air resistance coefficient;
is the vehicle’s frontal area;
is the vehicle speed;
is the rotational mass conversion factor;
is the rolling resistance coefficient.
During vehicle operation, the power required by the motor is jointly supplied by the fuel cell and the power battery, as follows:
In the formula:
is the fuel cell output power;
is the power battery output power;
is the DC/DC converter efficiency;
is the DC/AC converter efficiency.
All the driving force required for vehicle operation is provided by the drive motor. At this time, the external output power of the drive motor is:
2.2. Fuel Cell Model
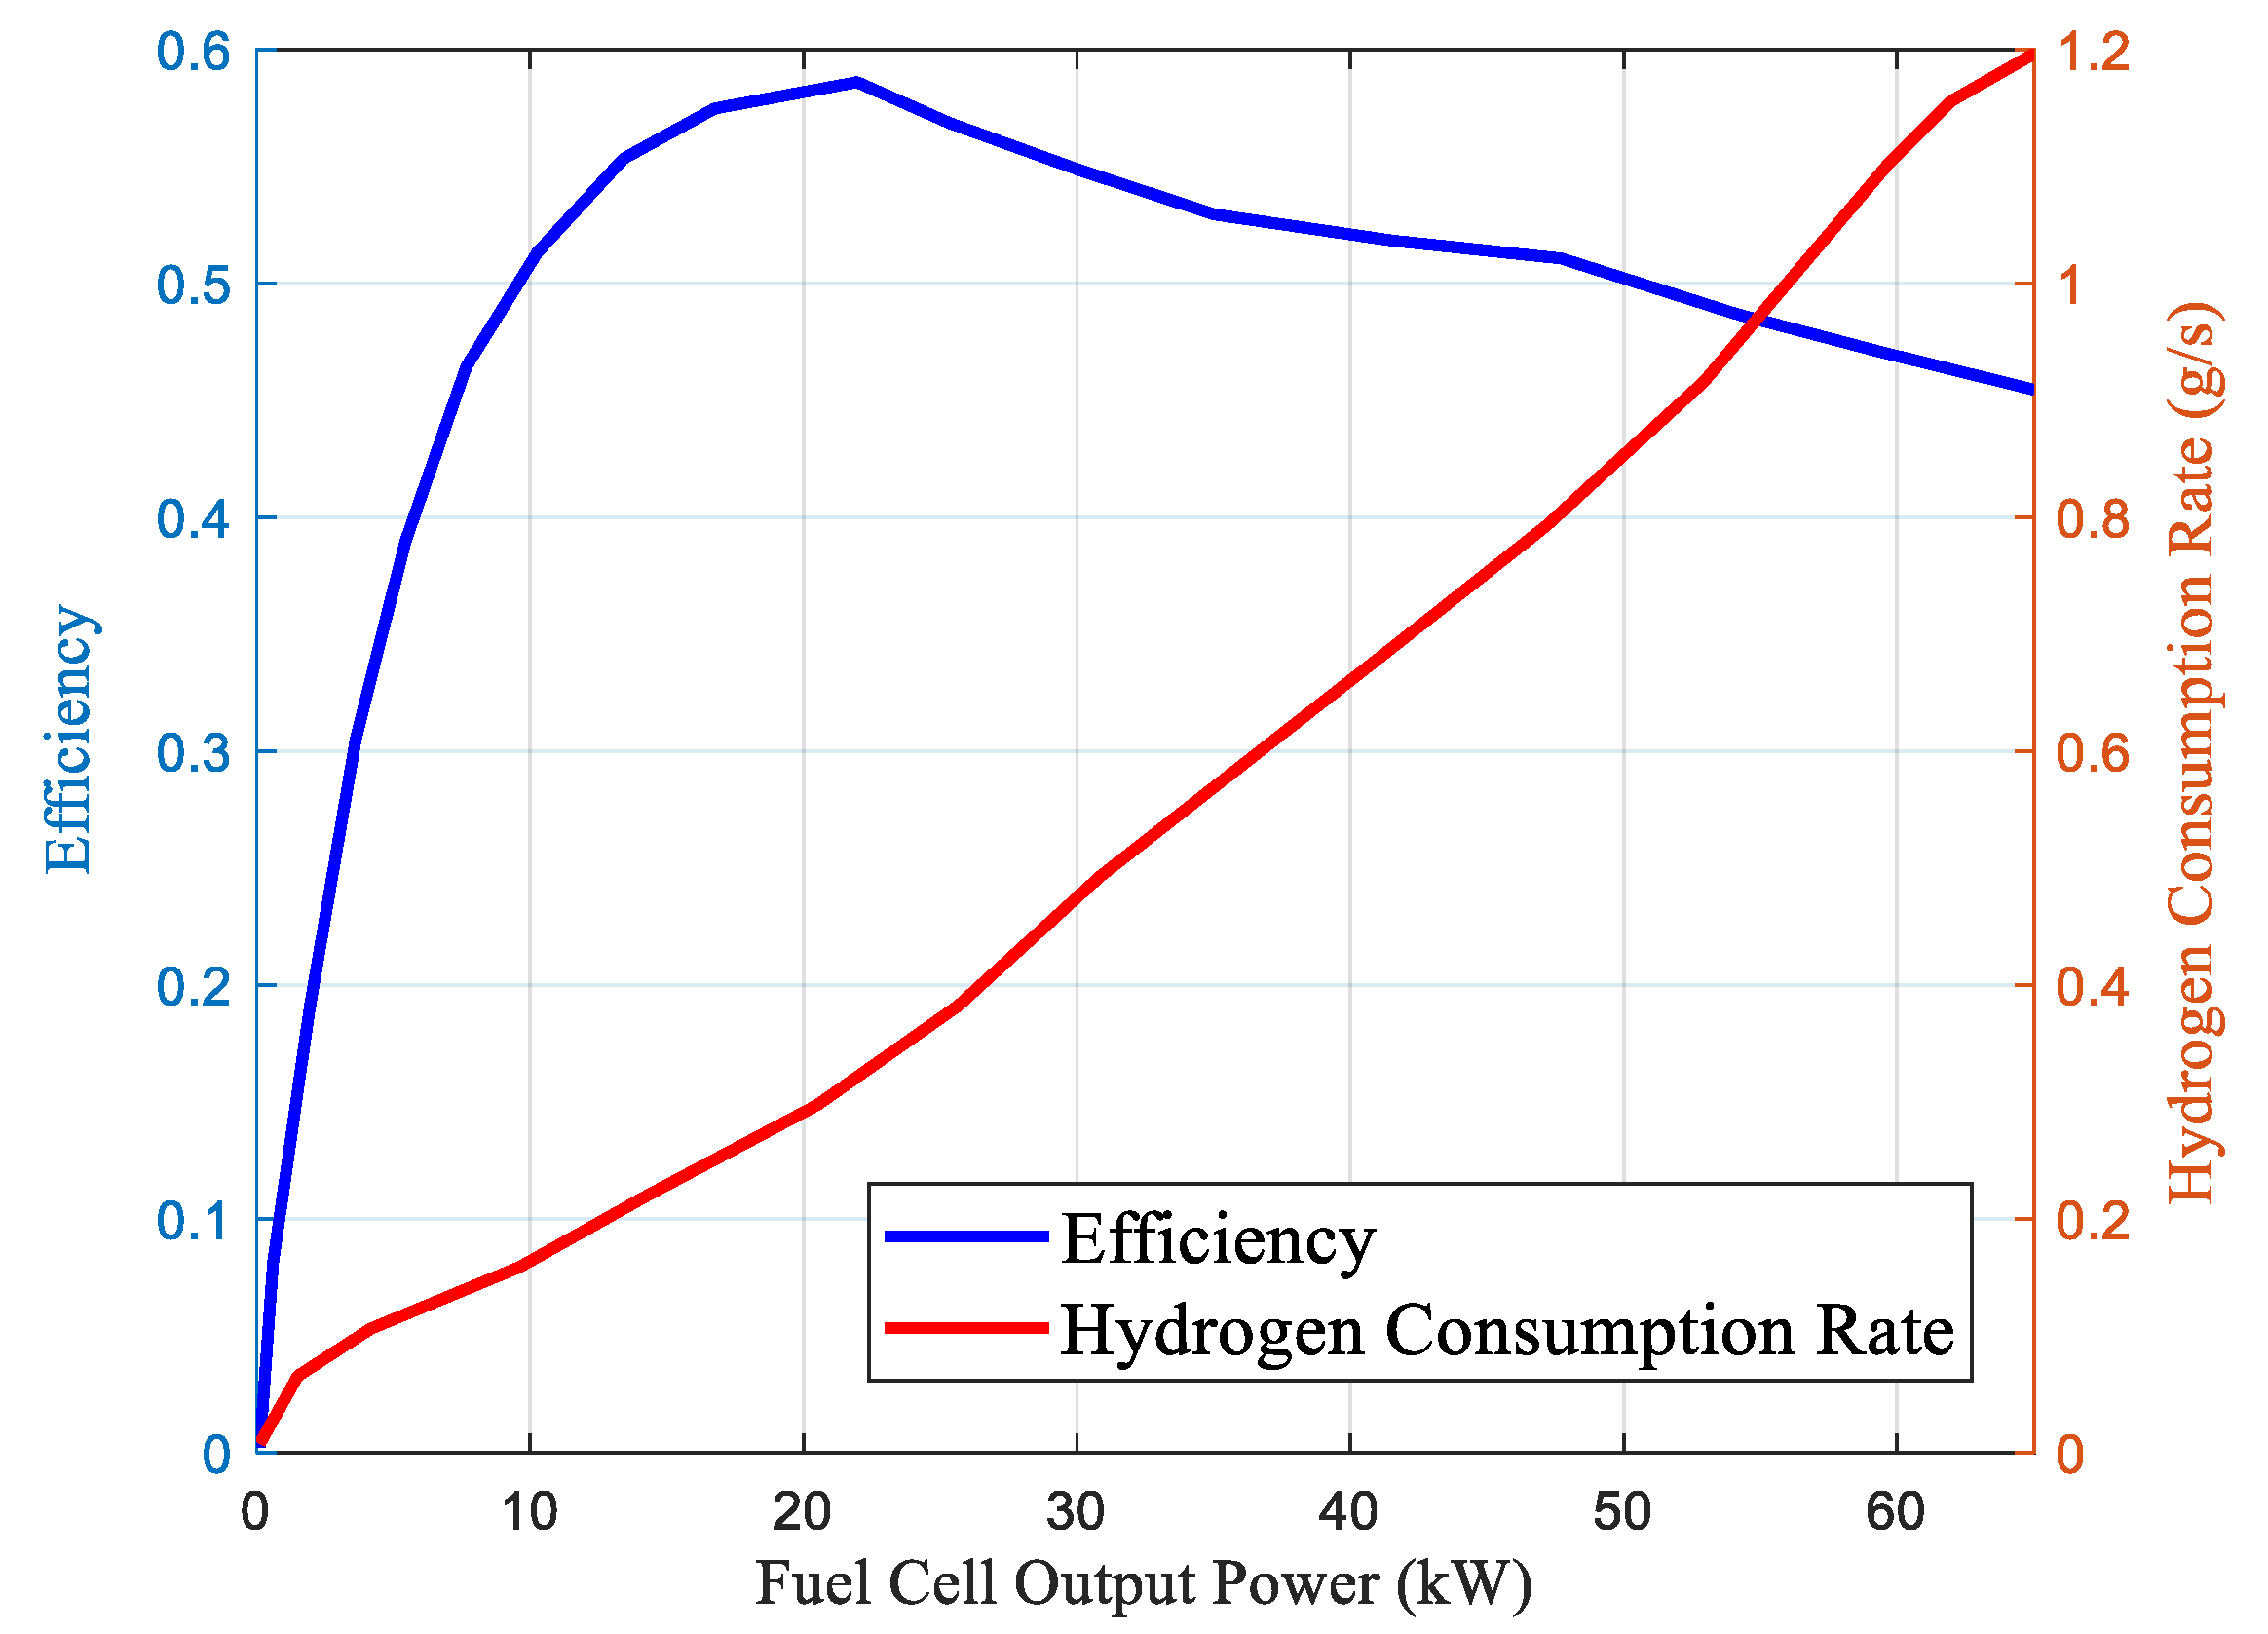
Fuel cells are the primary power source for the vehicle. During the design and research on vehicle energy management strategies, numerical modeling of fuel cell system efficiency and the hydrogen consumption rate are sufficient to accurately capture the dynamic characteristics of the fuel cell. The operating characteristics of the fuel cell were obtained by fitting the experimental data.
The expression for the hydrogen consumption rate of the fuel cell is:
In the formula:
is the molar mass of hydrogen;
is the number of electrons per hydrogen molecule;
is the fuel cell output current;
is Faraday’s constant.
The efficiency of the fuel cell system is defined as the ratio of the fuel cell system’s output power to the power consumed as the result of hydrogen consumption:
In the formula:
is the fuel cell system efficiency;
is the power consumed as a result of hydrogen consumption;
is the higher heating value of hydrogen.
The fuel cell system efficiency curve and the hydrogen consumption rate curve of the fuel cell system studied in this paper are shown in
Figure 2.
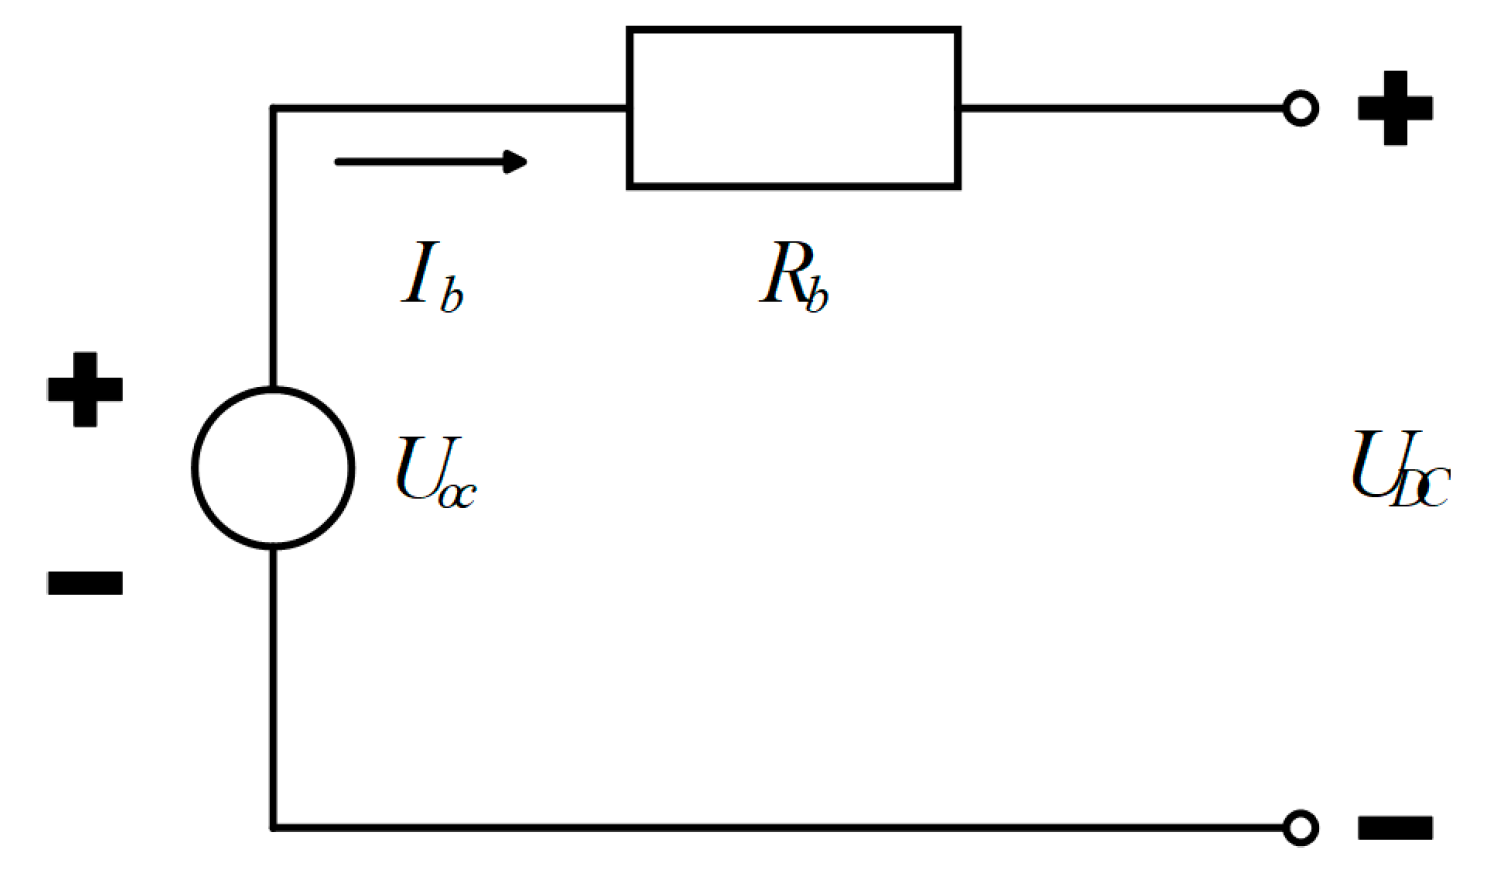
2.3. Power Battery Model
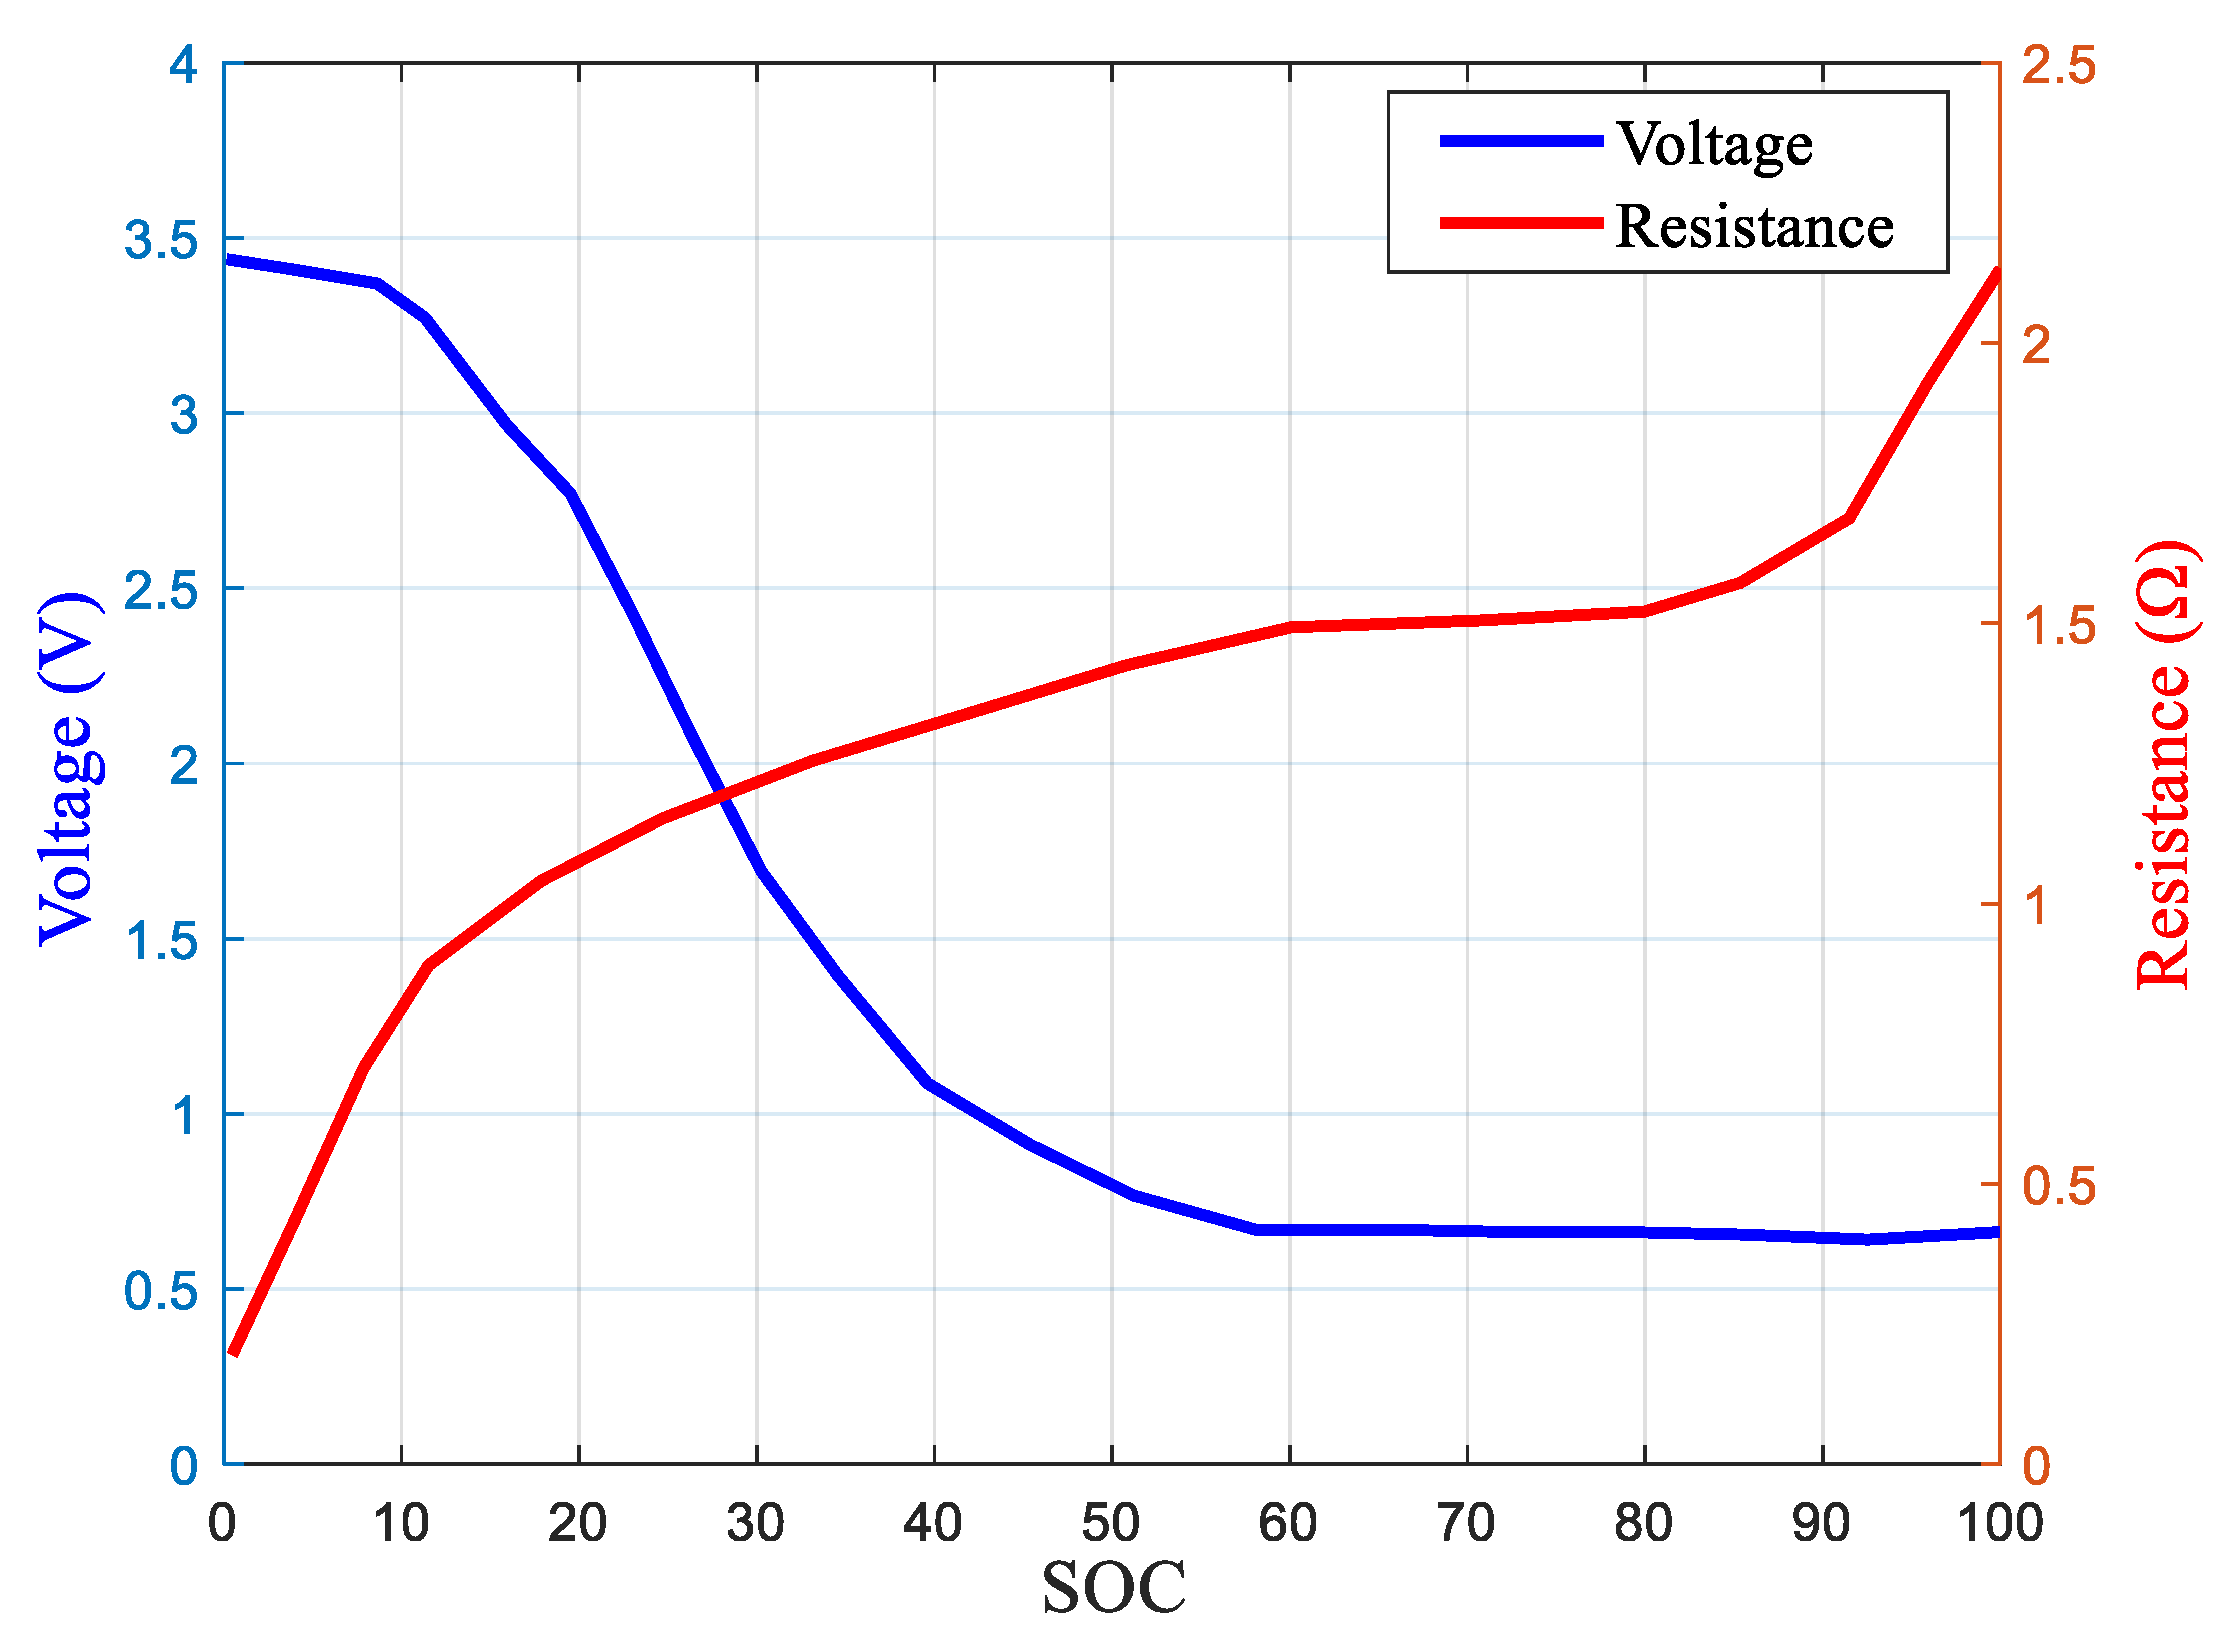
A lithium battery was chosen as the auxiliary power source for the studied vehicle, and a Rint model was established, as shown in
Figure 3. The relationship between the open-circuit voltage, internal resistance, and the state of charge (SOC) of a single lithium battery in the studied vehicle is shown in
Figure 4. The relationships between the parameters are as follows:
In the formula:
is the state of charge at a certain time;
is the initial state of charge;
is the maximum charge capacity of the fully charged battery;
is the open-circuit voltage;
is the output current;
is the output voltage;
is the internal resistance.
2.4. Motor Model
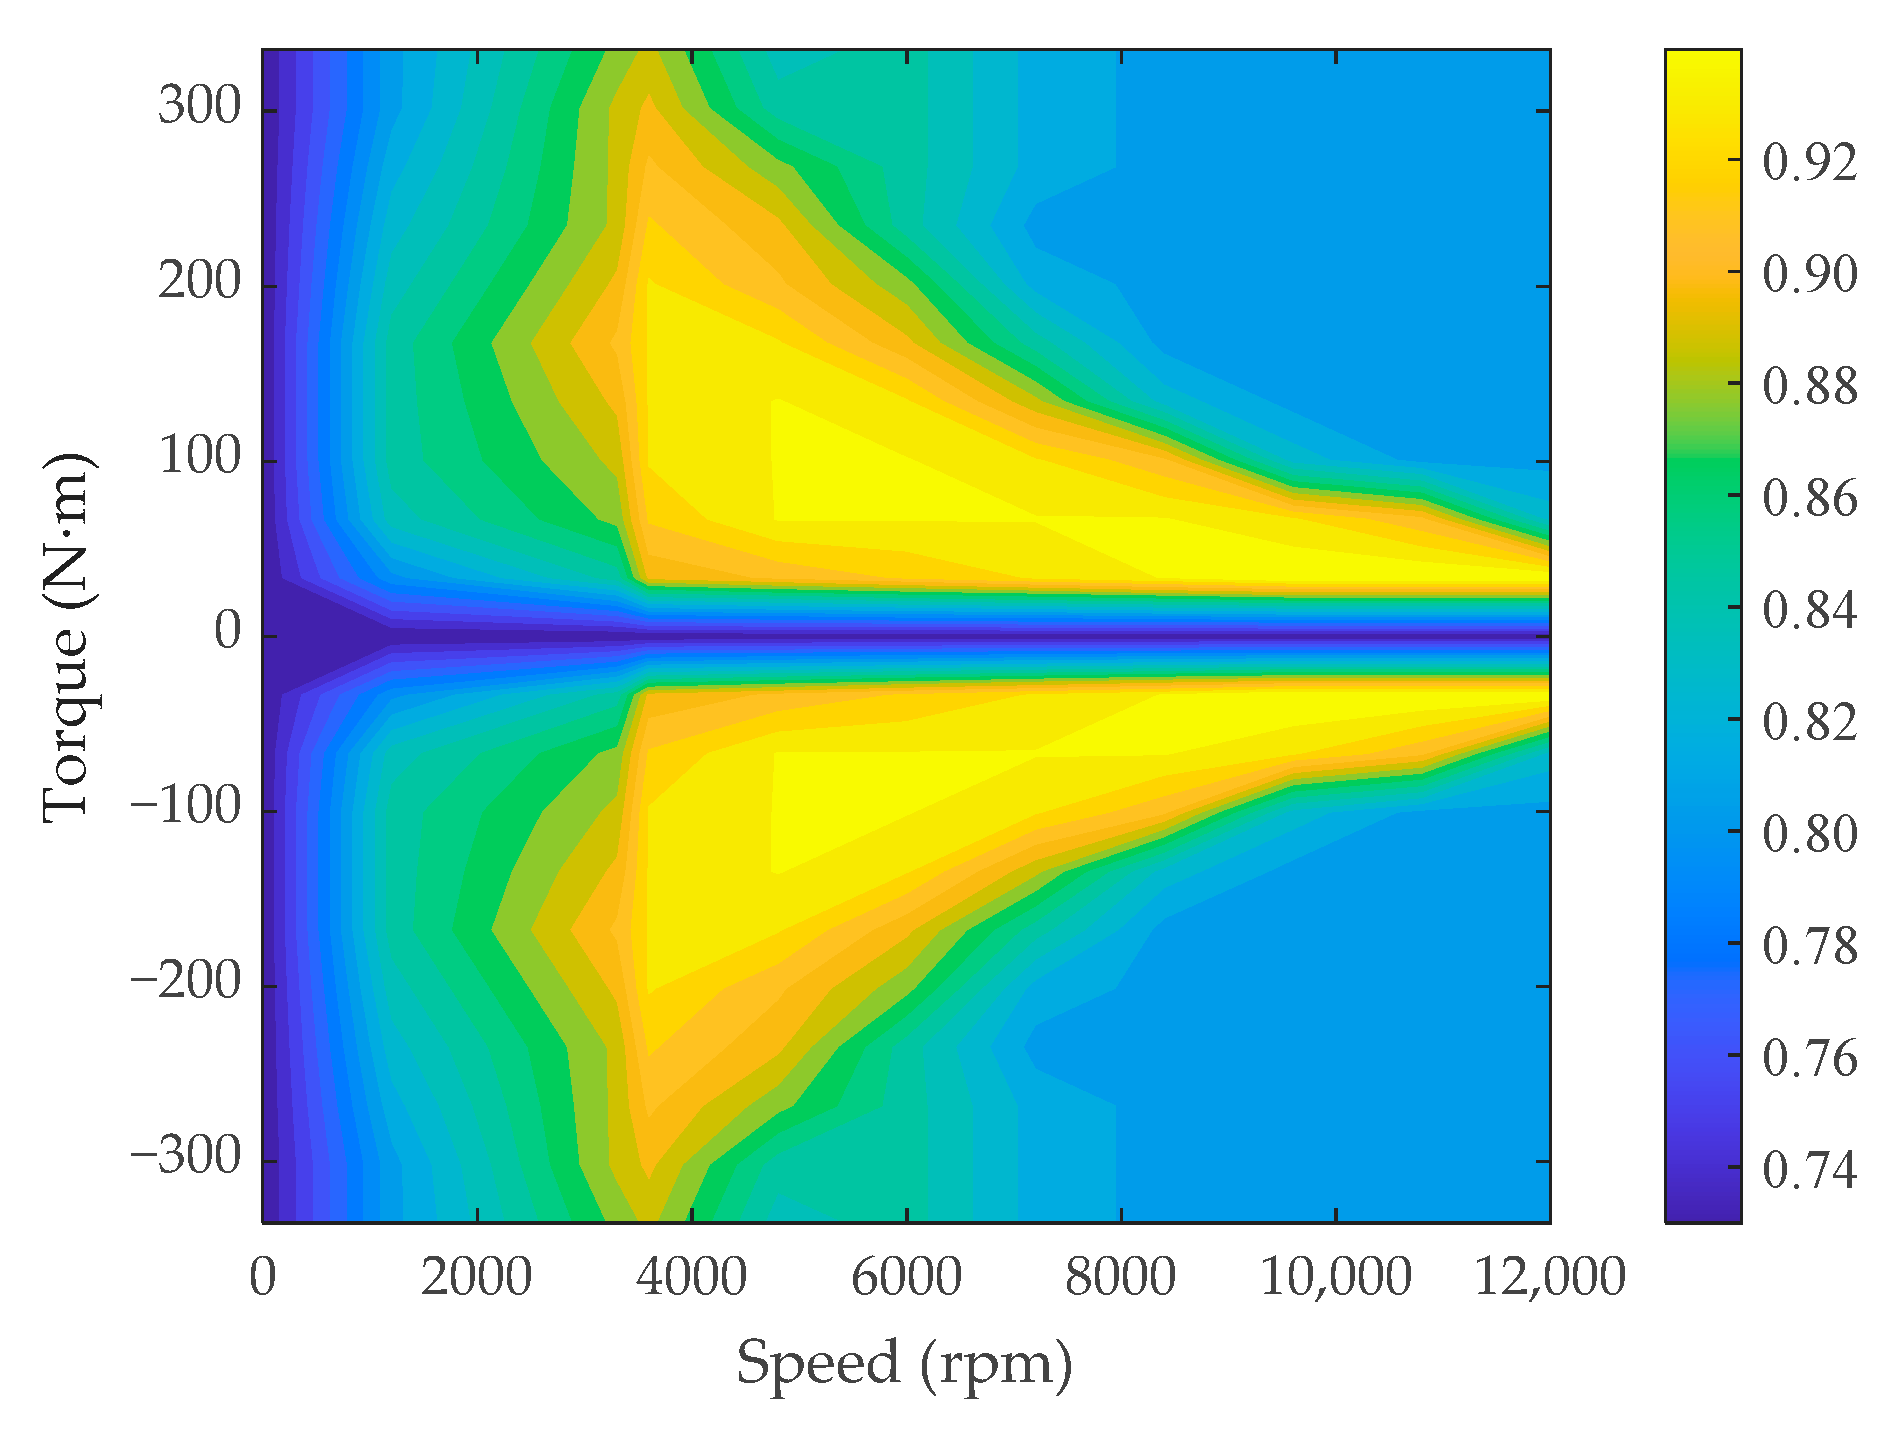
The motor model is established based on the motor efficiency map, as shown in
Figure 5. The motor efficiency is determined using a lookup table method, and the operating efficiency of the motor is as follows:
In the formula:
is the motor torque;
is the motor speed;
is the motor operating efficiency;
is the motor output power.
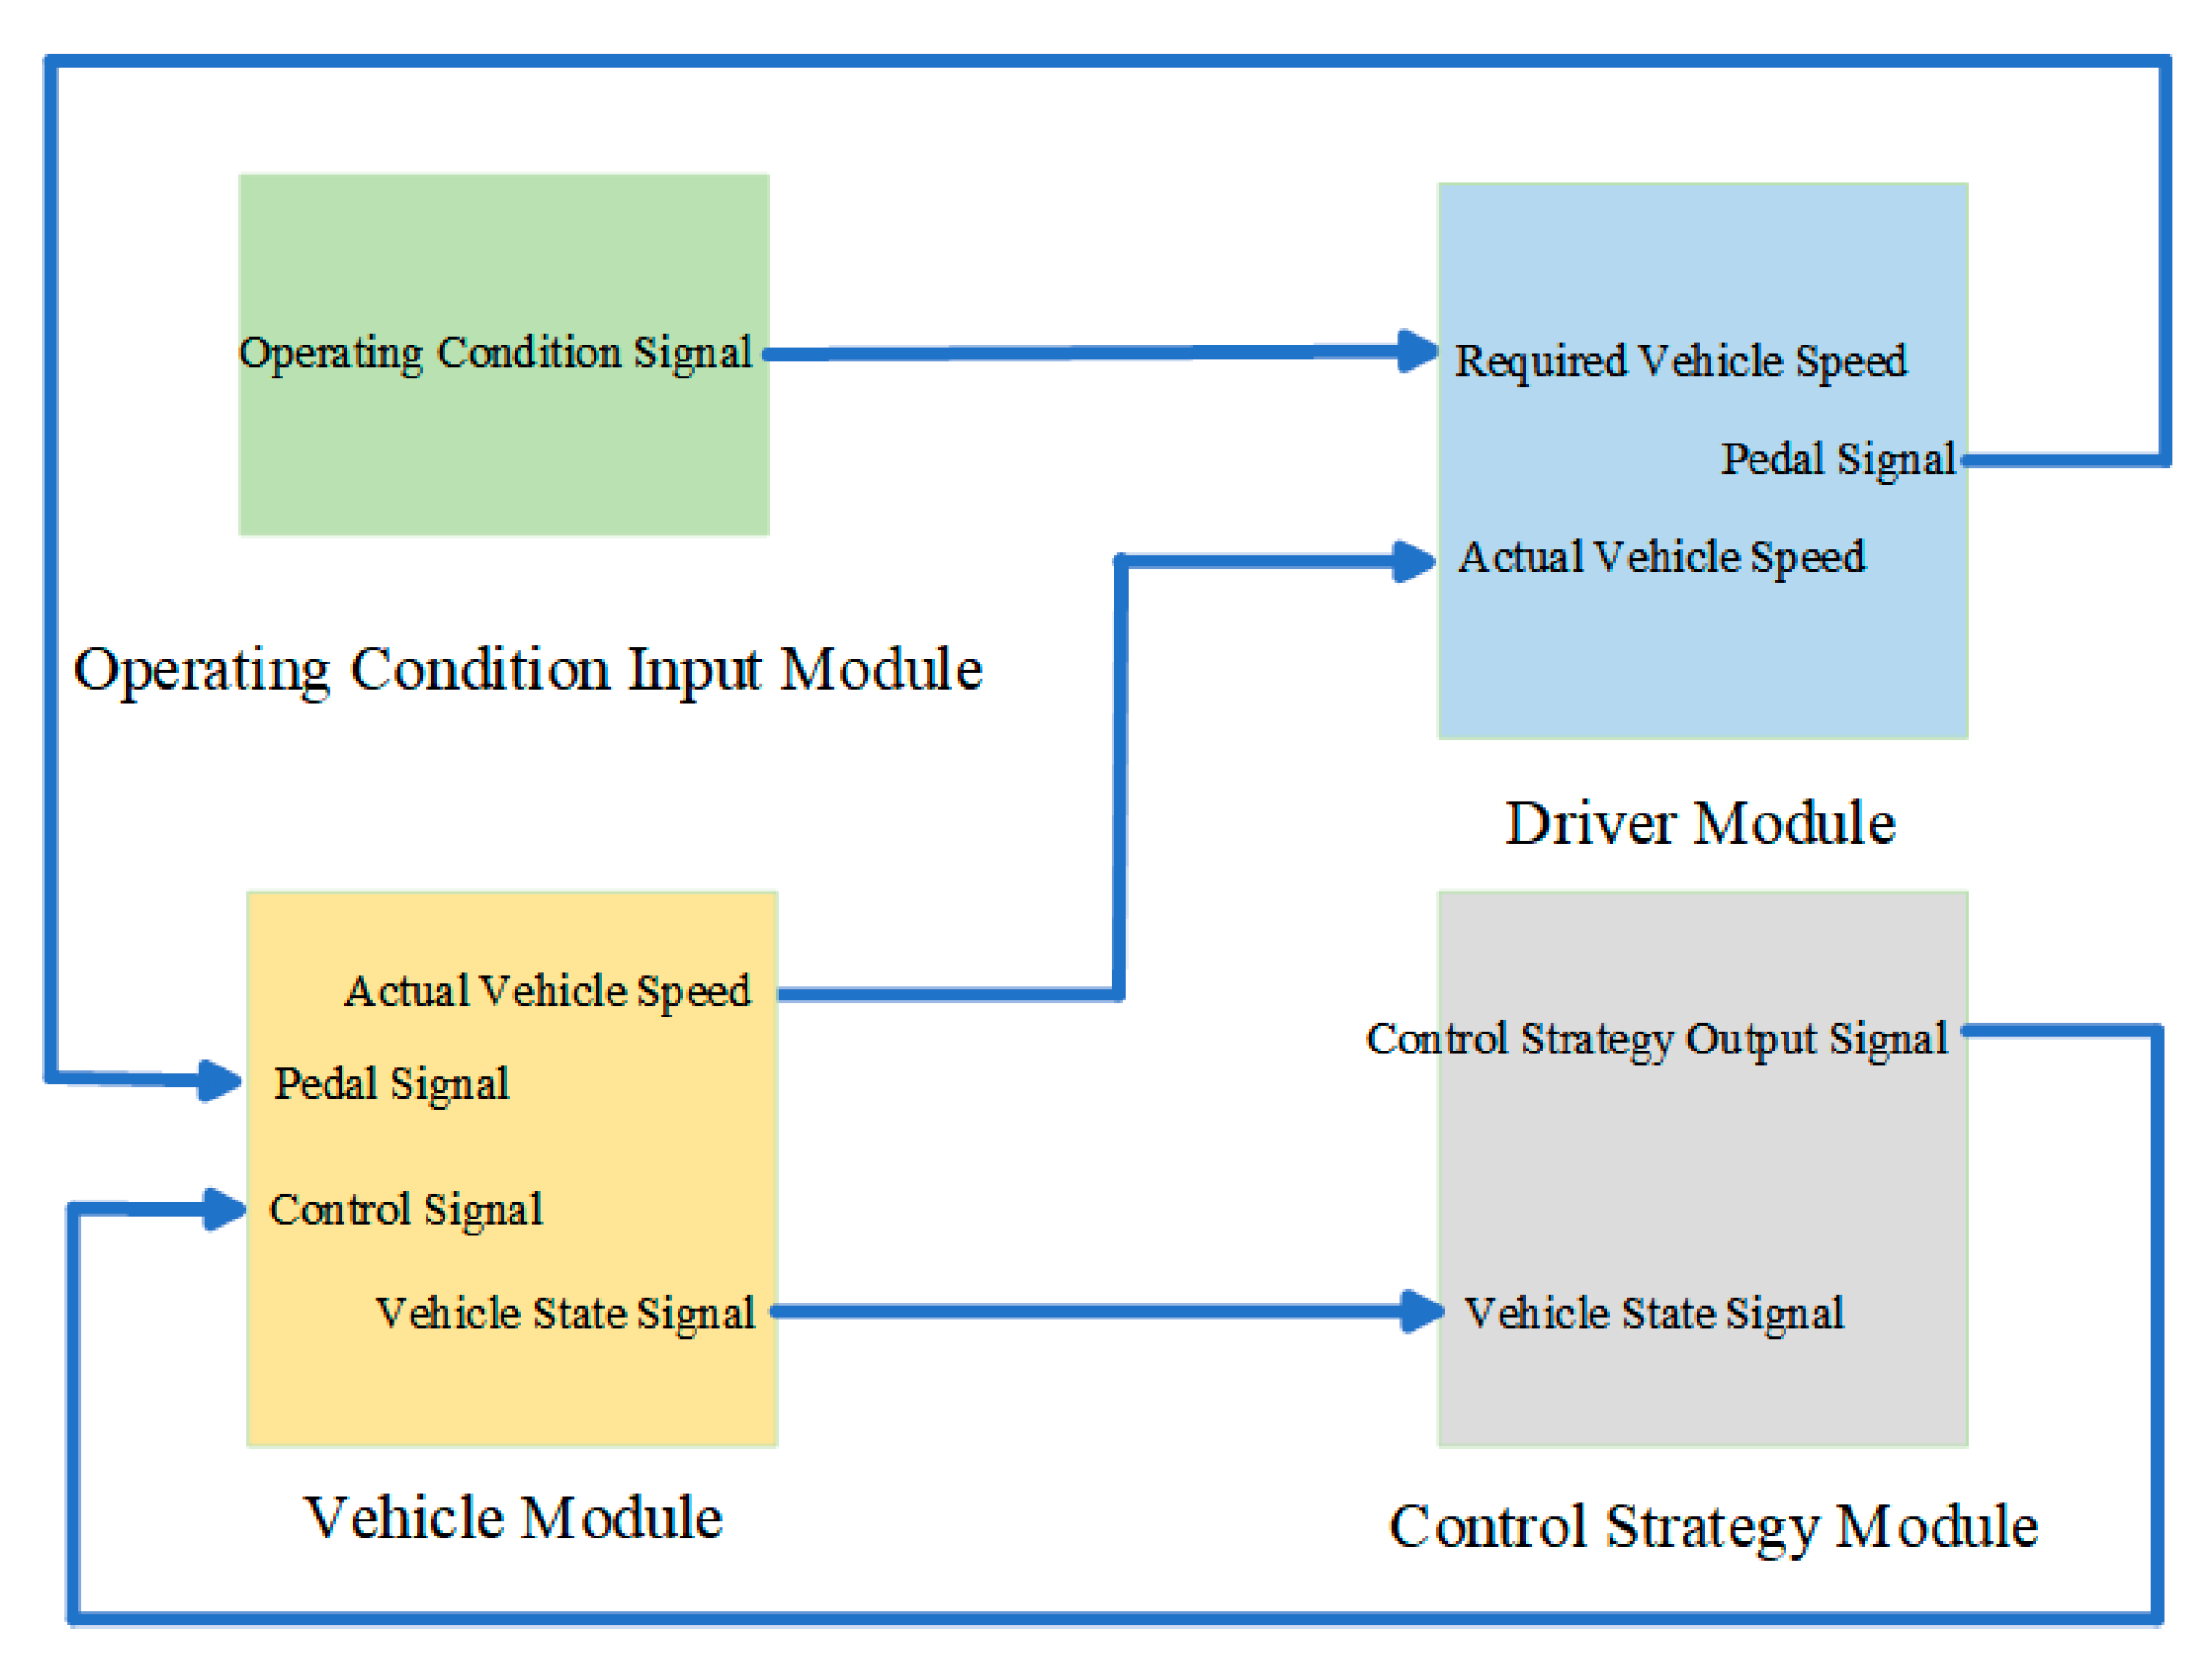
The related simulation model was built in MATLAB/Simulink, as shown in
Figure 6. The vehicle model primarily consists of four modules: the operating condition input module, the driver module, the vehicle module, and the control strategy module. The operating condition input module is responsible for providing the operating condition signals required for vehicle operation. These signals serve as inputs to the driver module to determine the actual operational demands of the vehicle. The driver module generates actual vehicle speed signals, based on the target speed and pedal signals provided by the operating condition input module. Additionally, this module provides feedback control signals to coordinate the dynamic response of the vehicle. The vehicle module simulates the actual operation of the vehicle. It receives the actual speed, pedal signals, and control signals from the driver module and converts them into vehicle state signals. These signals serve as inputs for the control strategy module to adjust the control strategy. The control strategy module outputs the corresponding control strategy signals, based on the state signals and control signals fed back by the vehicle module. The function of this module is to adjust the vehicle’s energy management strategy in real-time to achieve the efficient operation and dynamic stability of the vehicle.
3. Energy Management Control Strategy
3.1. Traditional Power-Following Control Strategy
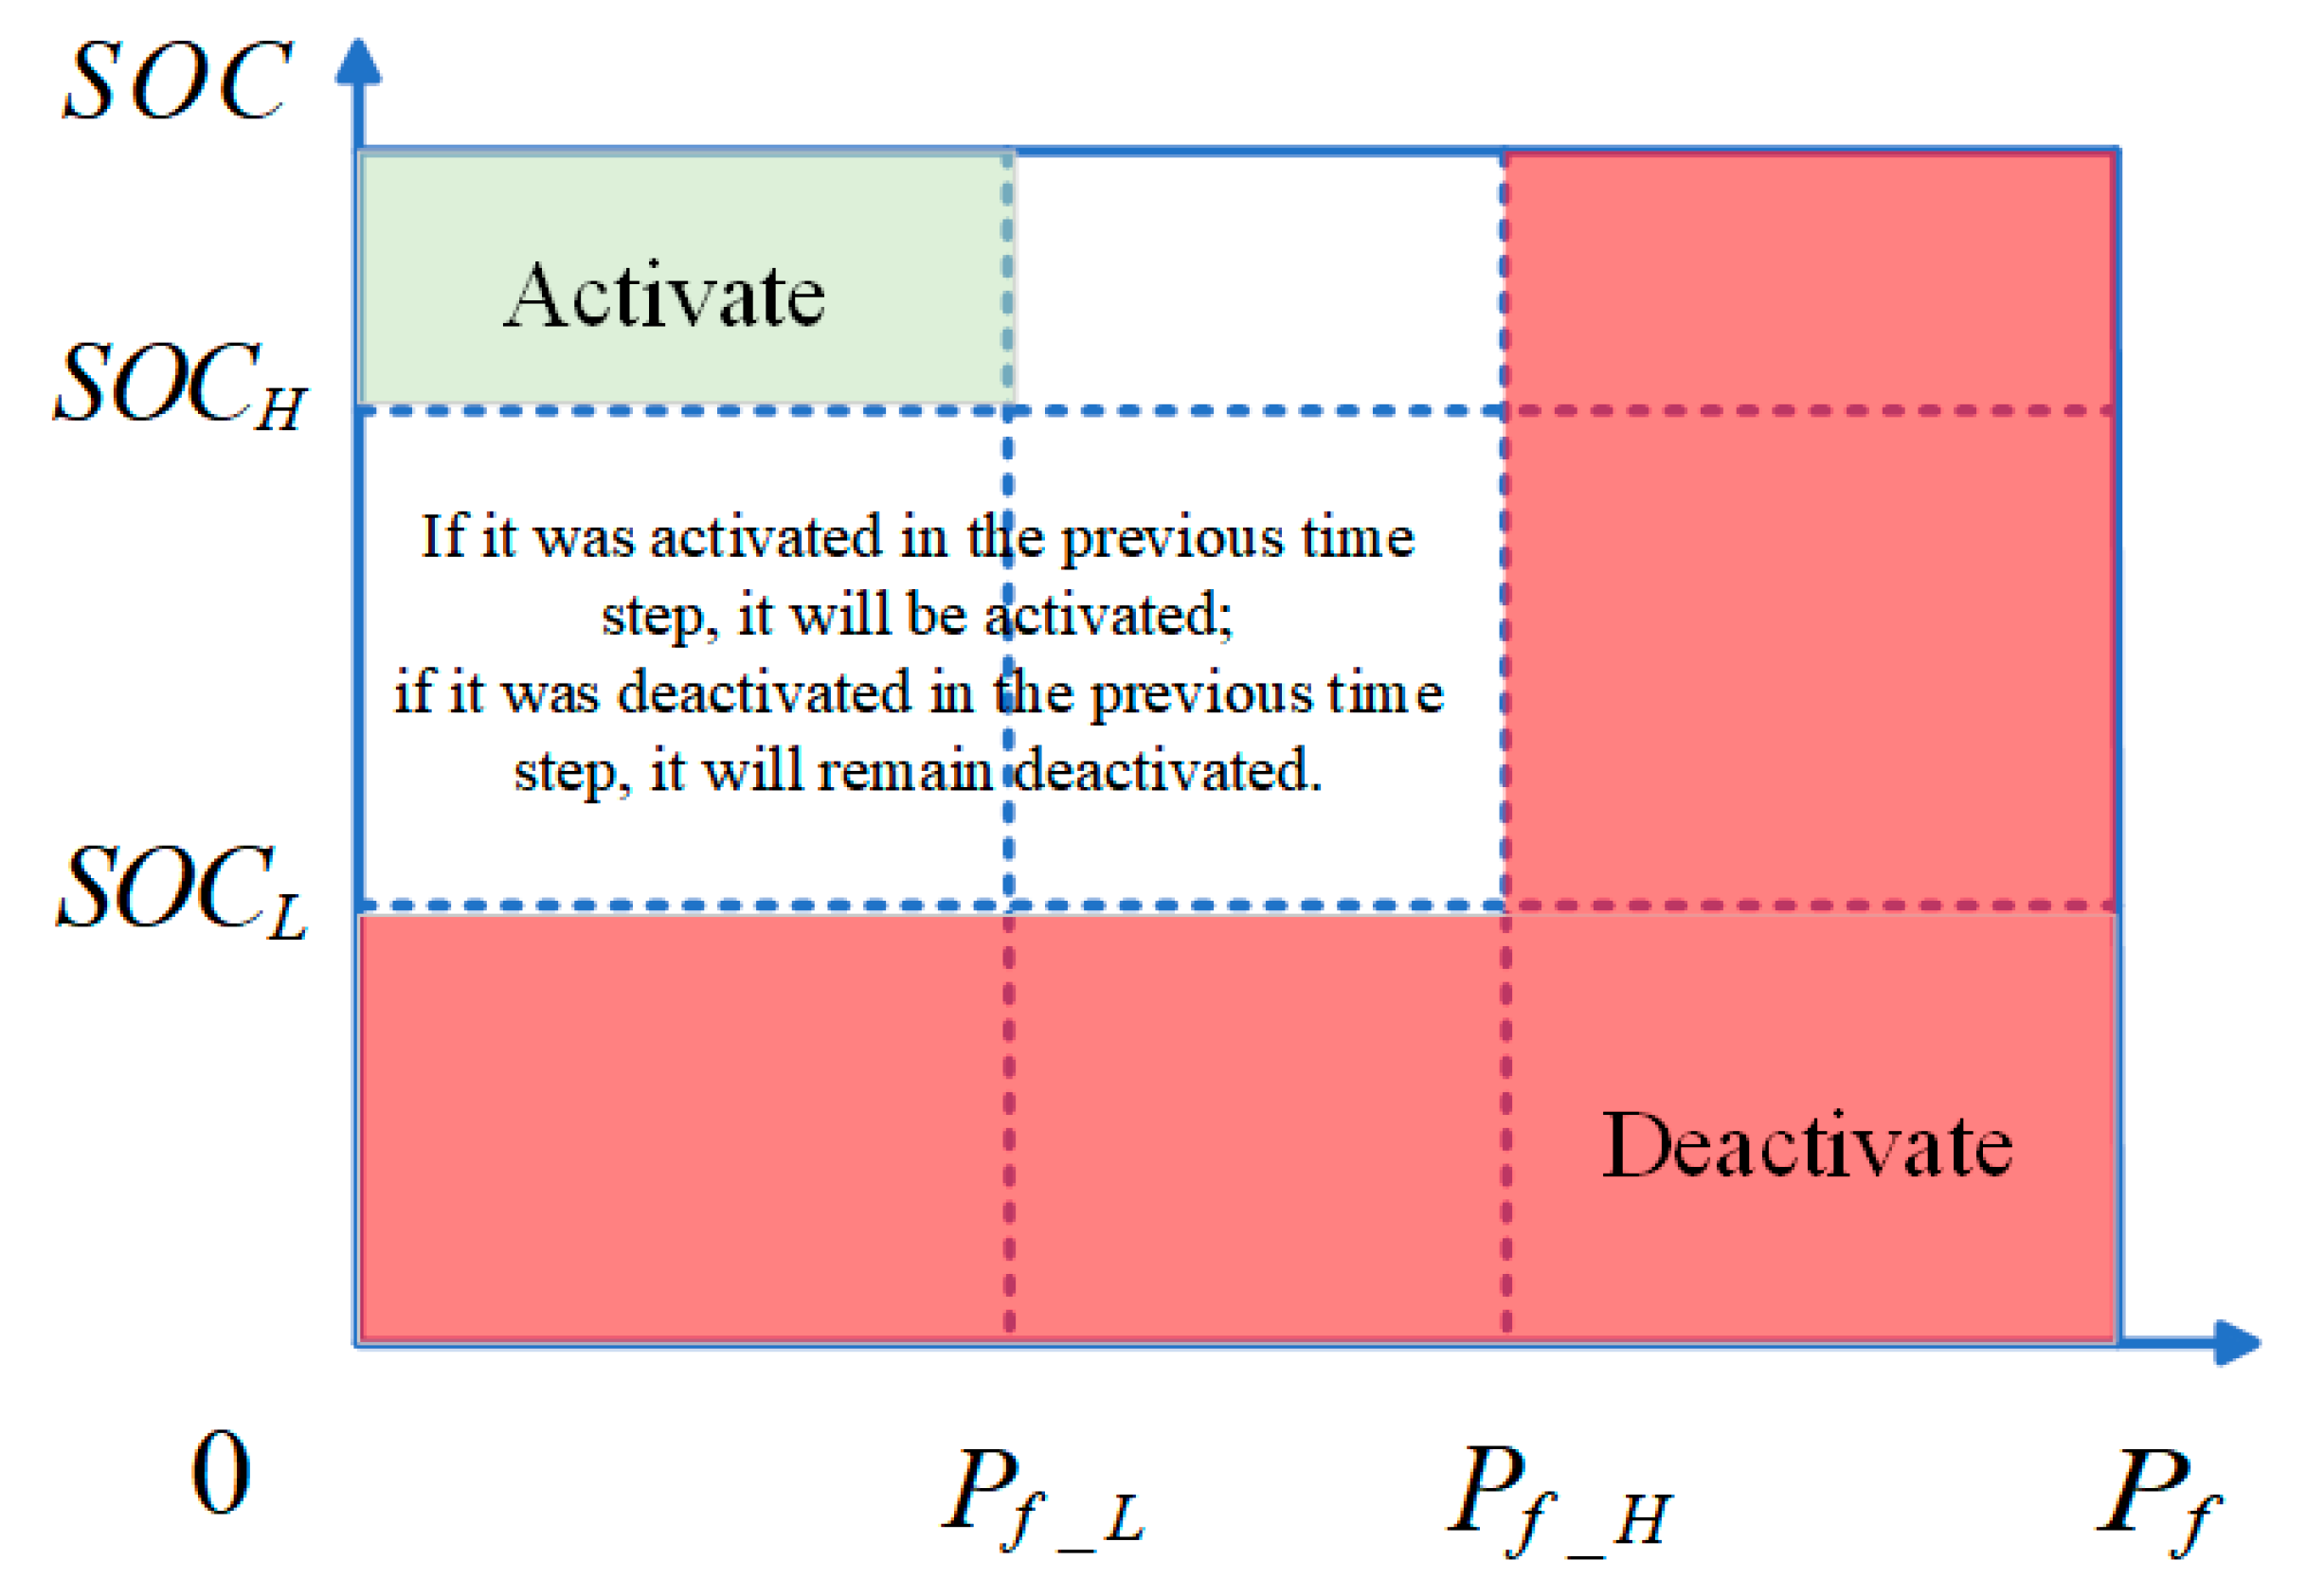
The power-following control strategy takes into account both the SOC of the battery and the power demand of the fuel cell. The fuel cell is activated when the fuel cell power demand exceeds a certain threshold or when the battery’s SOC falls below the set lower limit. Conversely, the fuel cell is deactivated when the power demand is below a set threshold and the battery’s SOC is above the set upper limit. The control strategy is shown in
Figure 7, and the calculation process for the output power of the fuel cell in the power-following control strategy is given by Equations (11) and (12).
In the formula:
is the required output power of the fuel cell;
is the required output power of the drive motor;
is the correction power for the fuel cell;
is the fuel cell correction factor;
is the upper limit of the battery’s state of charge;
is the lower limit of the battery’s state of charge;
is the current state of charge of the battery.
If the battery’s SOC is higher than the midpoint of and , the correction power is negative. In this case, the fuel cell and the battery jointly provide power to meet the motor’s power demand. If the battery’s SOC is lower than the midpoint of and , the correction power is positive. In this case, the fuel cell not only meets the motor’s power demand, but also charges the battery.
The existence of correction power primarily aims to maintain the battery’s SOC within an efficient range, optimize the operating point of the battery and, thereby, extend its service life. However, since the is a constant, during power correction, situations may arise where the fuel cell power corresponding to the motor’s power demand operates at high efficiency, but after correction, the operating point efficiency of the corrected fuel cell power decreases. Therefore, it can be seen that solely considering the battery’s SOC for power correction may degrade the operating point distribution of the fuel cell, thereby affecting the overall vehicle economy.
3.2. Fuzzy Control Strategy
Based on the above analysis, a fuzzy improvement method is proposed. During power correction, both the battery’s SOC and the power demand are considered simultaneously. This approach ensures SOC stability, while adjusting the fuel cell’s output power towards operating points with higher efficiency. The fuzzy control framework is shown in
Figure 8.
Triangular membership functions are adopted, which require only three parameters [a, b, c] to define their boundaries and peak position. Compared to smoother Gaussian functions or more complex asymmetric membership functions, triangular membership functions entail only simple piecewise linear operations, making them well-suited for systems with stringent real-time requirements.
When tuning the membership functions, primary adjustments are made to the membership functions of the fuel cell’s required power, whereas the membership functions for the battery’s SOC and the output correction coefficient are divided into equal intervals.
The formulation of the input membership function can be derived based on the power efficiency curve of the fuel cell. First, the power efficiency curve of the fuel cell is divided into different operating intervals, with the division criterion being the efficiency values. The three horizontal lines in
Figure 9 correspond to efficiency values of 0.46, 0.50, and 0.54, respectively. These three horizontal lines divide the fuel cell’s operating range into seven segments, with the intervals and midpoints listed in
Table 2.
When formulating the membership function for the fuel cell power, the seven segments defined here are used, and the midpoint of each segment corresponds to a membership value of 1. The corresponding fuzzy subsets are shown in
Table 3. Subsequently, the parameters related to the fuzzy subsets are manually adjusted and optimized based on the experience gained through simulation analysis, as shown in
Table 4.
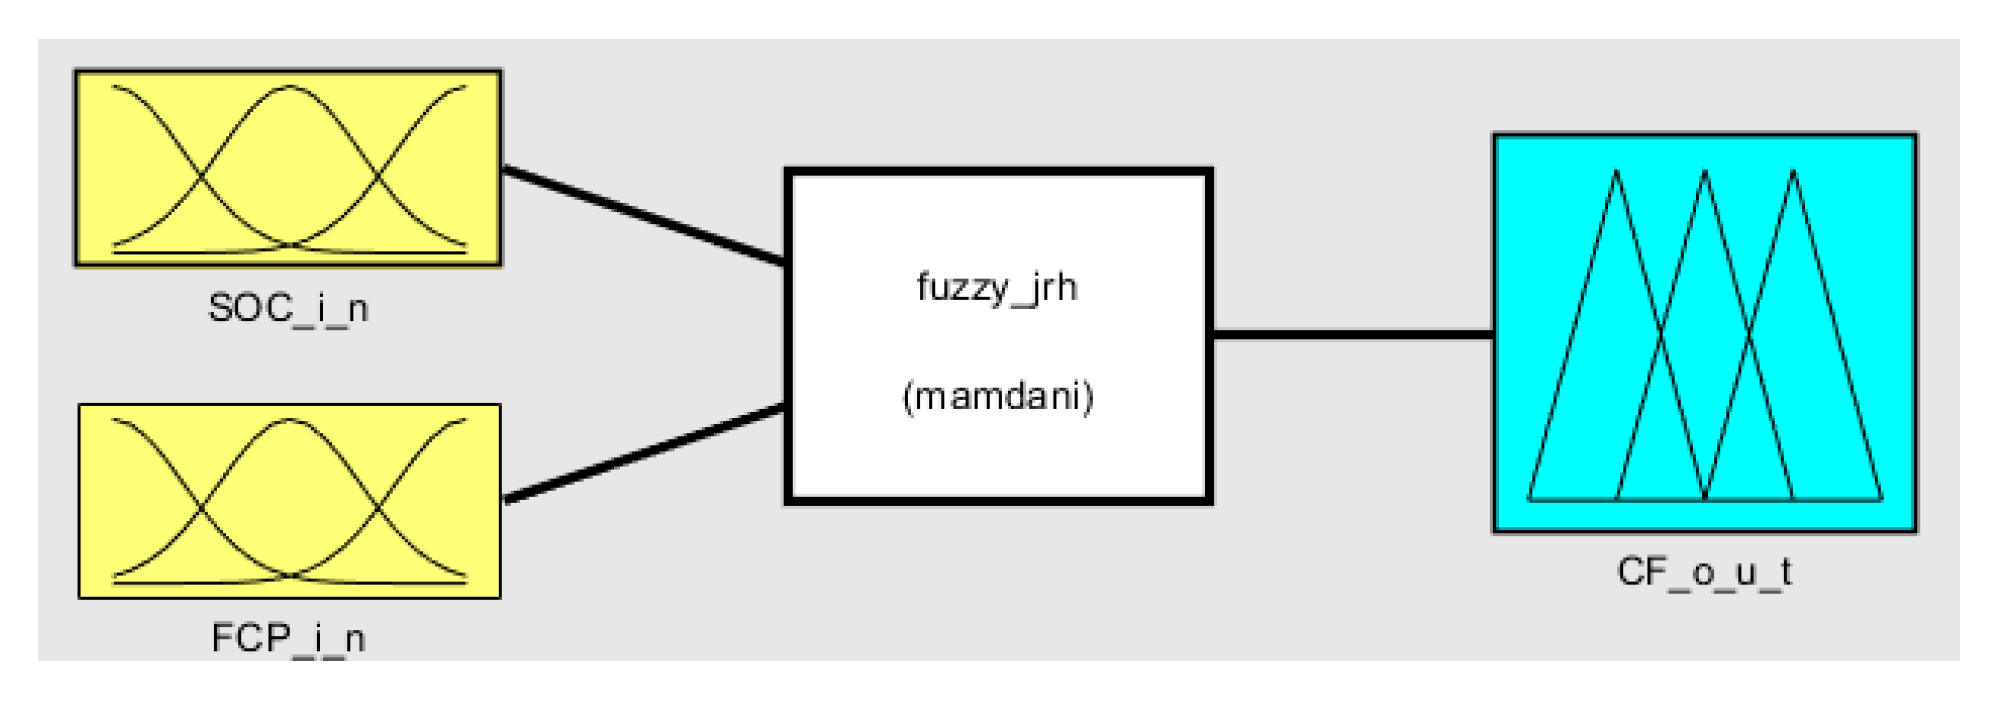
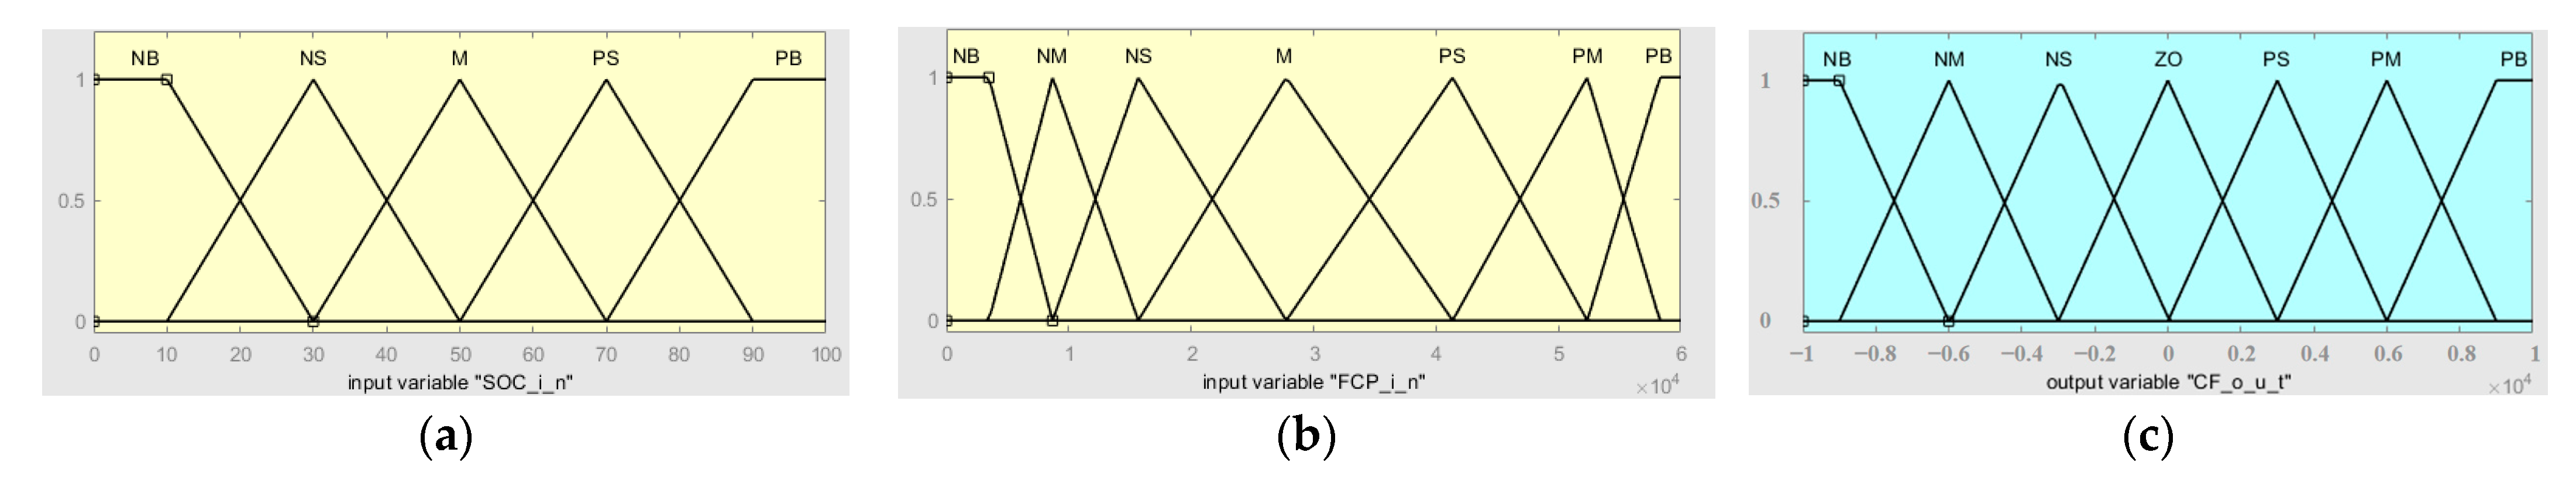
The correction factor is changed from a constant value to a variable fuzzy control output. The inputs for this fuzzy control system are the current SOC of the battery and the current power demand of the fuel cell. The membership functions are shown in
Figure 10; (a) and (b) represent the inputs, while (c) represents the output. The fuzzy control rule is shown in
Table 5.
The sign of the correction power is determined by the correction factor, and the formula for calculating the correction power is as follows:
As shown in
Figure 11, when the battery’s SOC and the fuel cell power demand are relatively low, a larger correction factor is applied to increase the actual output power of the fuel cell. This adjustment improves the efficiency corresponding to the operating point of the fuel cell. The additional output power from the fuel cell is used to charge the battery, ensuring that the SOC returns to the target value as quickly as possible. When the battery’s SOC and the fuel cell power demand are relatively high, a negative correction factor with a larger magnitude is applied to reduce the actual output power of the fuel cell. This adjustment also improves the efficiency corresponding to the operating point of the fuel cell, while the shortfall in power demand is supplemented by the battery.
3.3. Operating Condition Recognition
In practical simulation experiments, although the use of fuzzy control to optimize the power-following control strategy reduces battery SOC fluctuations, the improvement in fuel cell efficiency is not significant. Therefore, to further enhance the operating efficiency of the fuel cell, operating condition recognition is employed to optimize the key parameters in the power-following control strategy.
3.3.1. GRU Neural Network Prediction Model
To achieve operating condition recognition, the future vehicle speed should first be predicted. The historical vehicle speed exhibits nonlinear characteristics, and time series-based predictions have high accuracy. Therefore, a GRU neural network is used to predict the vehicle speed within a future time domain. The historical vehicle speed sequence is collected and input into the GRU speed prediction model to predict the driving speed within the future time domain,
. The abstract formula of the GRU speed prediction model is as follows:
In the formula:
represents the speed prediction model;
and denote the length of the historical vehicle speed sequence input into the prediction model and the length of the prediction domain, respectively;
and represent the input historical vehicle speed sequence and the output predicted vehicle speed sequence, respectively.
The training parameters of the GRU neural network are shown in
Table 6.
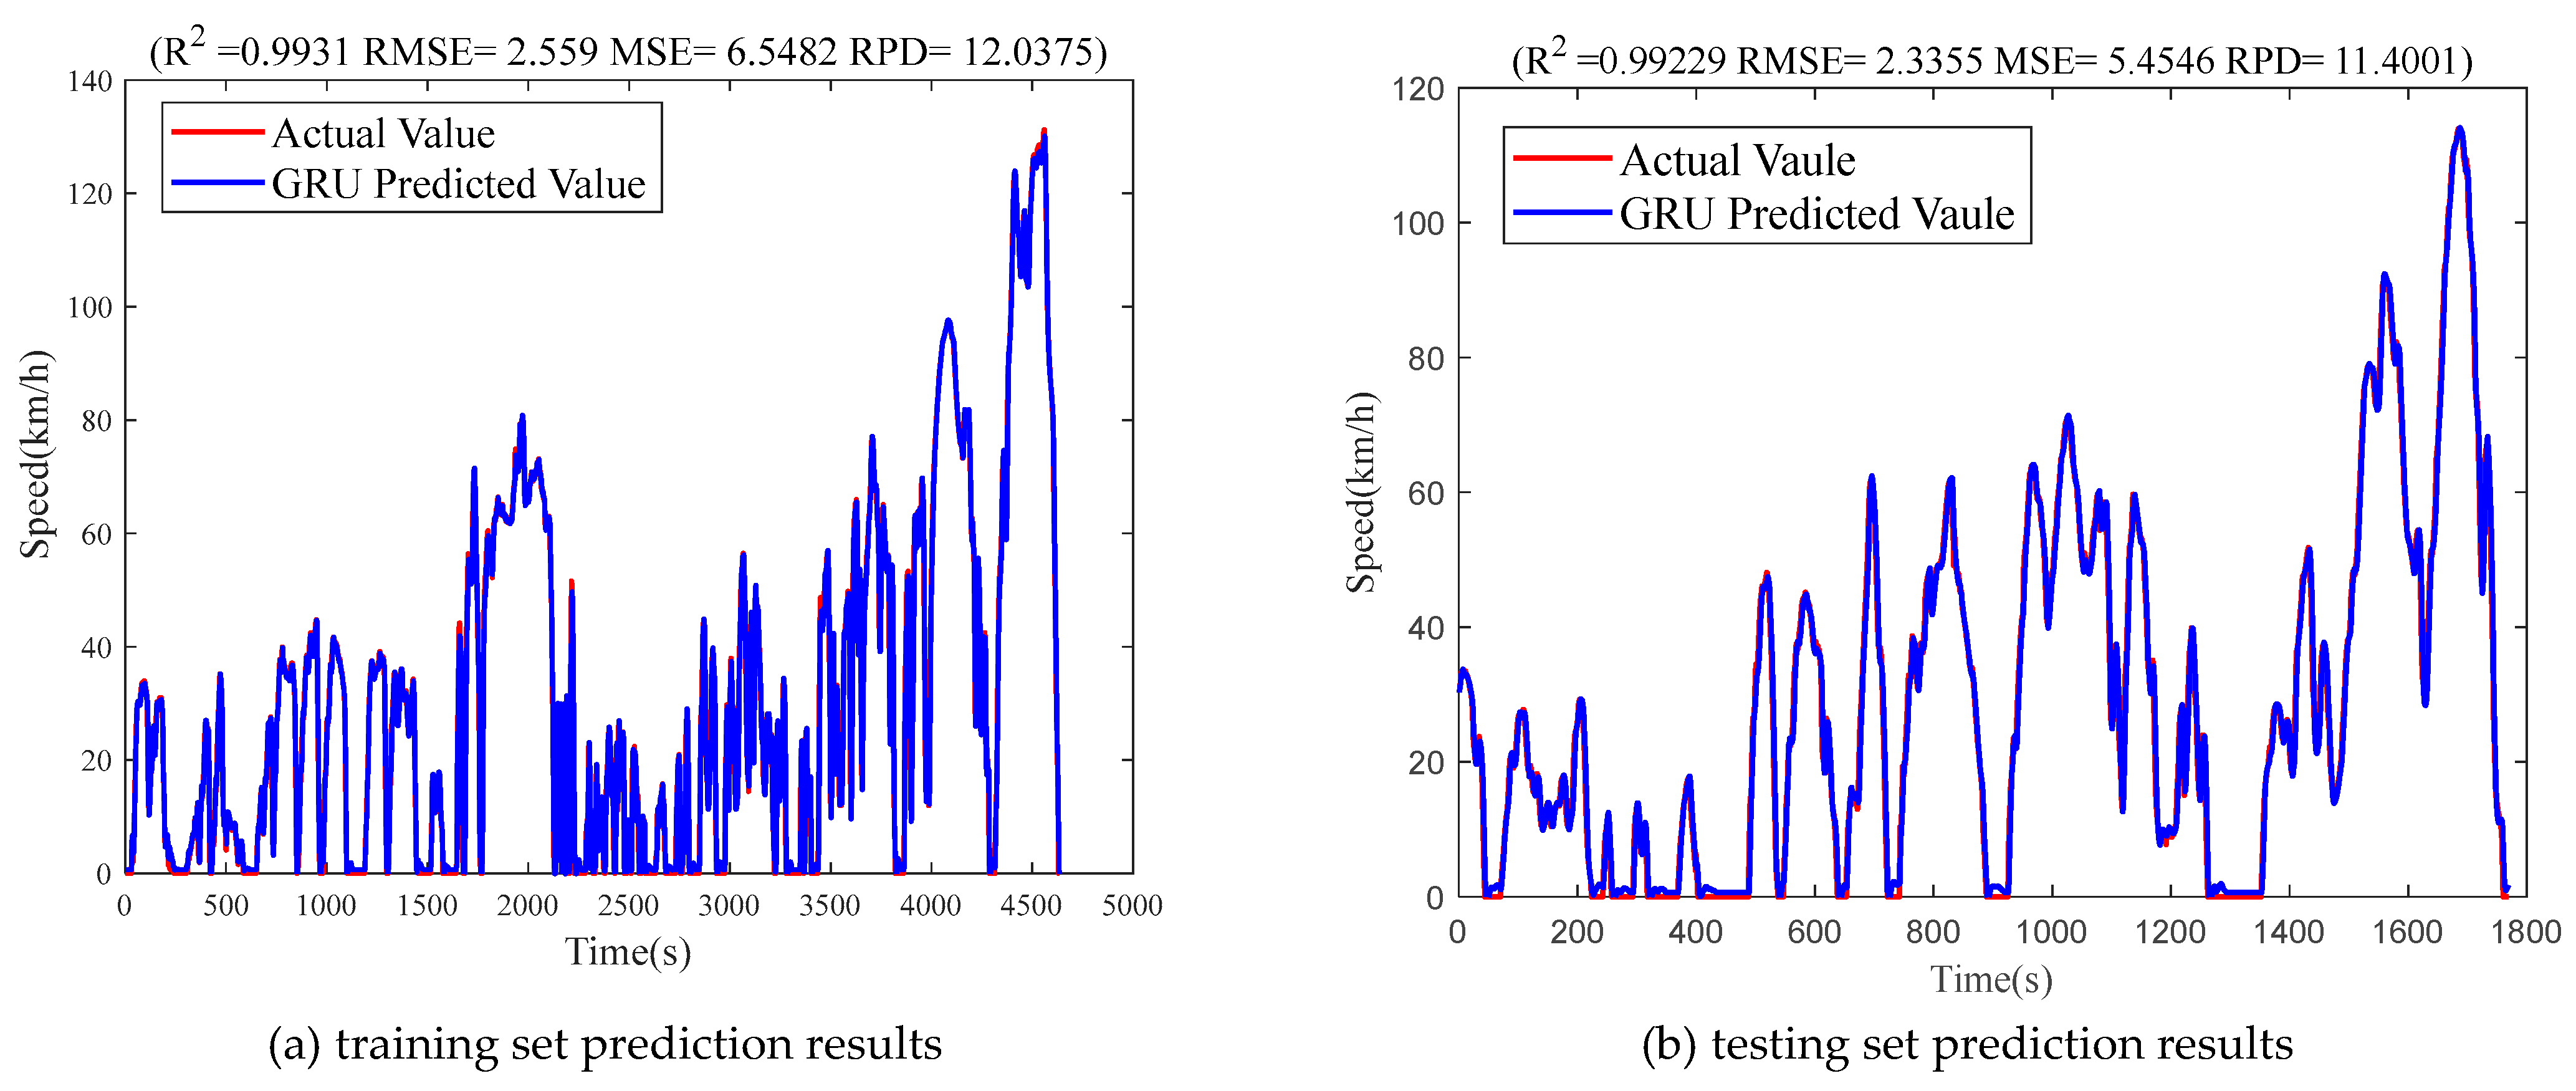
The training dataset for the GRU neural network consists of four driving cycles: NYCC, US06_HWY, WVUSUB, and WLTP. The testing dataset is based on the CLTC-P driving cycle.
The final prediction results are shown in
Figure 12. In the figure, (a) and (b) represent the results for the training set and the testing set, respectively. The root mean square error (RMSE) for the testing set is 2.3355, indicating that the trained GRU neural network performs well in regard to predicting the vehicle speed.
3.3.2. Operating Condition Recognition Model
The driving condition of a vehicle is an essential consideration when developing an energy management strategy. A k-means cluster analysis is performed on the driving condition data from the four driving cycles, namely NYCC, US06_HWY, WVUSUB, and WLTP, to achieve clustering and classification, thereby improving the operating condition recognition model.
A kinematic segment is defined as the vehicle speed sequence interval starting from an idle state and ending at the beginning of the next idle state. According to this definition, the road condition data are segmented into kinematic segments.
To accurately and comprehensively describe the characteristic differences between different kinematic segments, while avoiding information redundancy, eight feature parameters are determined: the maximum speed, acceleration time ratio, deceleration time ratio, maximum acceleration, average acceleration, idle time ratio, average deceleration, and speed standard deviation.
Based on the segmented kinematic segments and the identified feature parameters, k-means cluster analysis is applied to the processed data for clustering.
After k-means clustering, the feature parameters of the cluster centers for each type of driving condition were identified, as shown in
Table 7.
The highest speed in terms of the first type of driving condition is 86.34 km/h, and the idle time ratio is 4.34%. This condition is defined as a high-speed condition.
The highest speed in terms of the second type of driving condition is 63.73 km/h, and the idle time ratio is 15.46%. This condition is defined as a medium-speed condition.
The highest speeds in terms of the third and fourth types of driving conditions are 33.19 km/h and 26.73 km/h, respectively. However, the acceleration time ratio and deceleration time ratio in terms of the fourth type are higher than those of the third type. The fourth condition matches congested road conditions and is, thus, defined as a low-speed congested condition, while the third condition is defined as a low-speed free-flow condition.
The operating condition recognition model is established using the method for calculating the Euclidean proximity. By comparing the proximity of the kinematic segment in the predicted time domain to the cluster centers of various typical operating conditions, the vehicle’s driving state is determined. A greater proximity indicates that the current driving condition of the vehicle is closer to that particular type of typical condition.
The specific method is as follows:
In the formula:
represents the number of feature parameters within the driving condition ;
denotes the -th feature parameter within the driving condition ;
represents the processed feature parameter data in terms of the predicted time domain driving condition.
3.3.3. Key Parameter Optimization
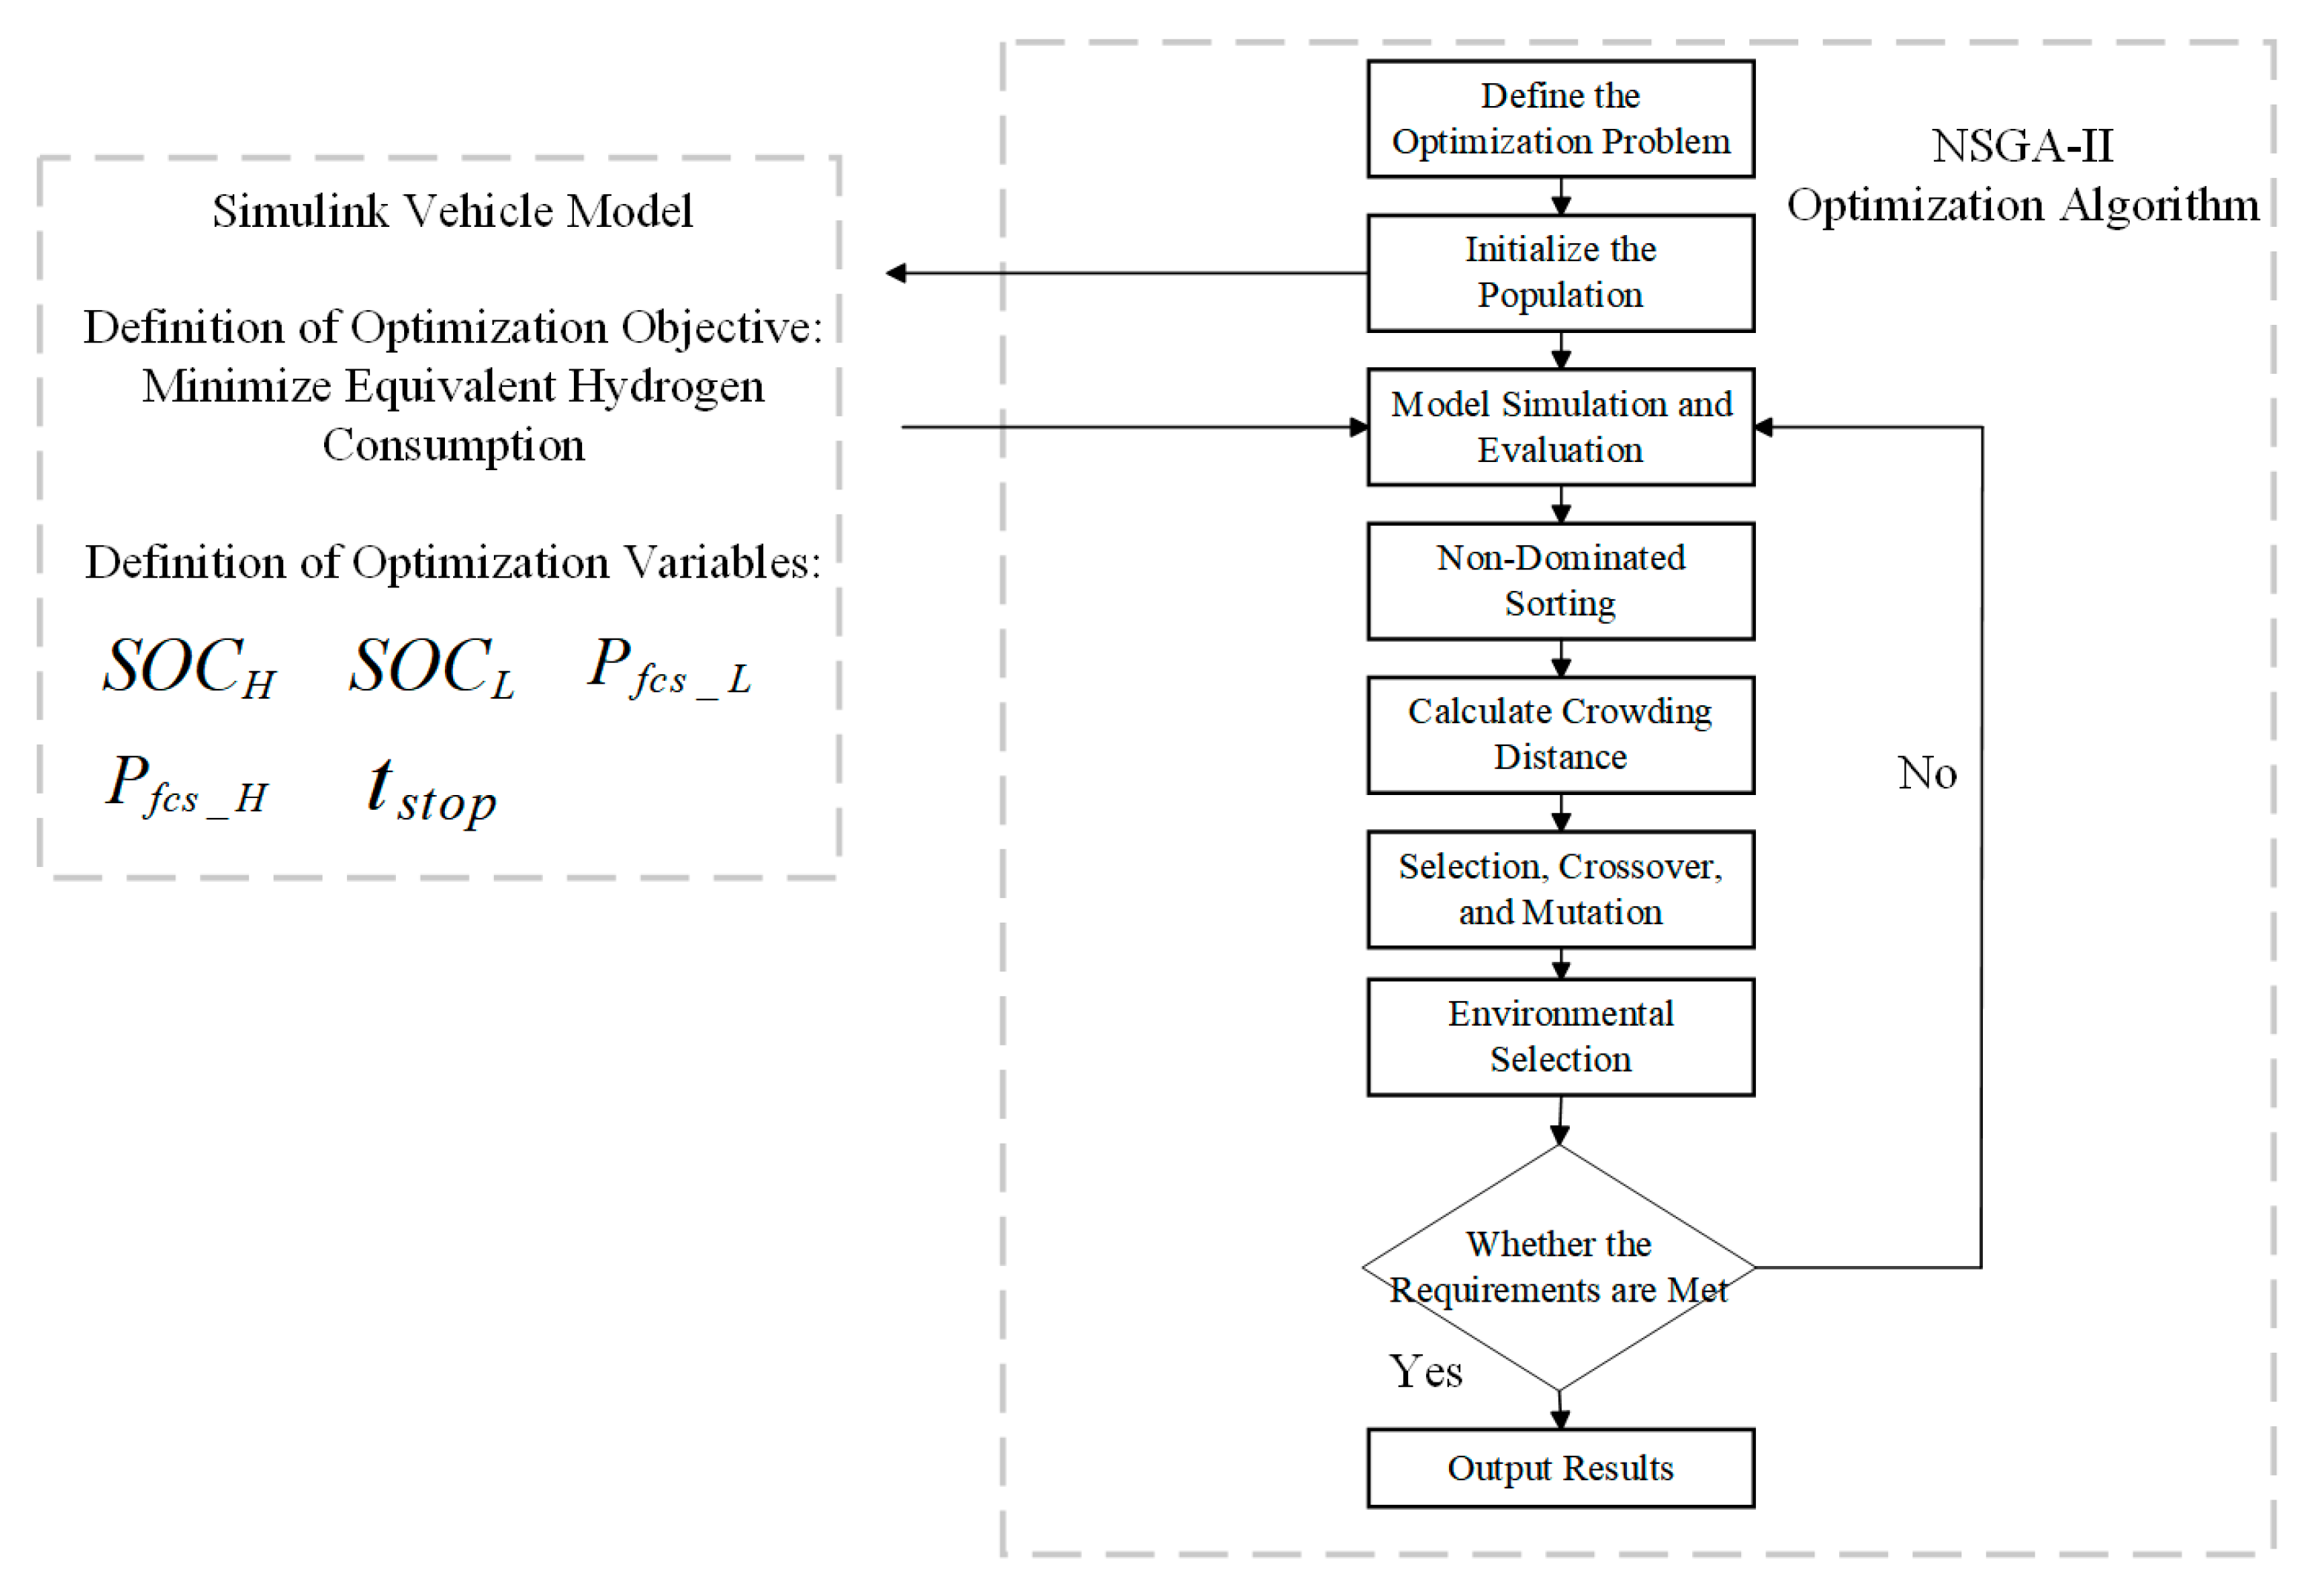
The selection of key parameters in regard to the energy management control strategy significantly impacts the economic performance of the vehicle. The optimization variables are first determined. For the power-following control strategy, four key control parameters are identified: the upper limit of the battery , the lower limit of the battery , the minimum power threshold of the fuel cell , and the maximum power threshold of the fuel cell .
In addition, the minimum shutdown time of the fuel cell, , is also a critical control parameter. When the shutdown time of the fuel cell is less than this value, the fuel cell cannot restart unless the power demand can not be met by the battery alone. This parameter effectively prevents frequent startups of the fuel cell.
The optimization process aims to minimize hydrogen consumption in fuel cell vehicles. A non-dominated sorting genetic algorithm (NSGA) is used to optimize the parameters in different operating conditions. The typical road condition data obtained from the clustering process mentioned above are shown in
Figure 13.
The key parameters in the power-following control strategy are optimized for four different driving conditions, and the optimization process is shown in
Figure 14.
The constraints are as follows:
The optimized parameters for different driving conditions are shown in
Table 8.
3.3.4. Online Control Strategy Calculation
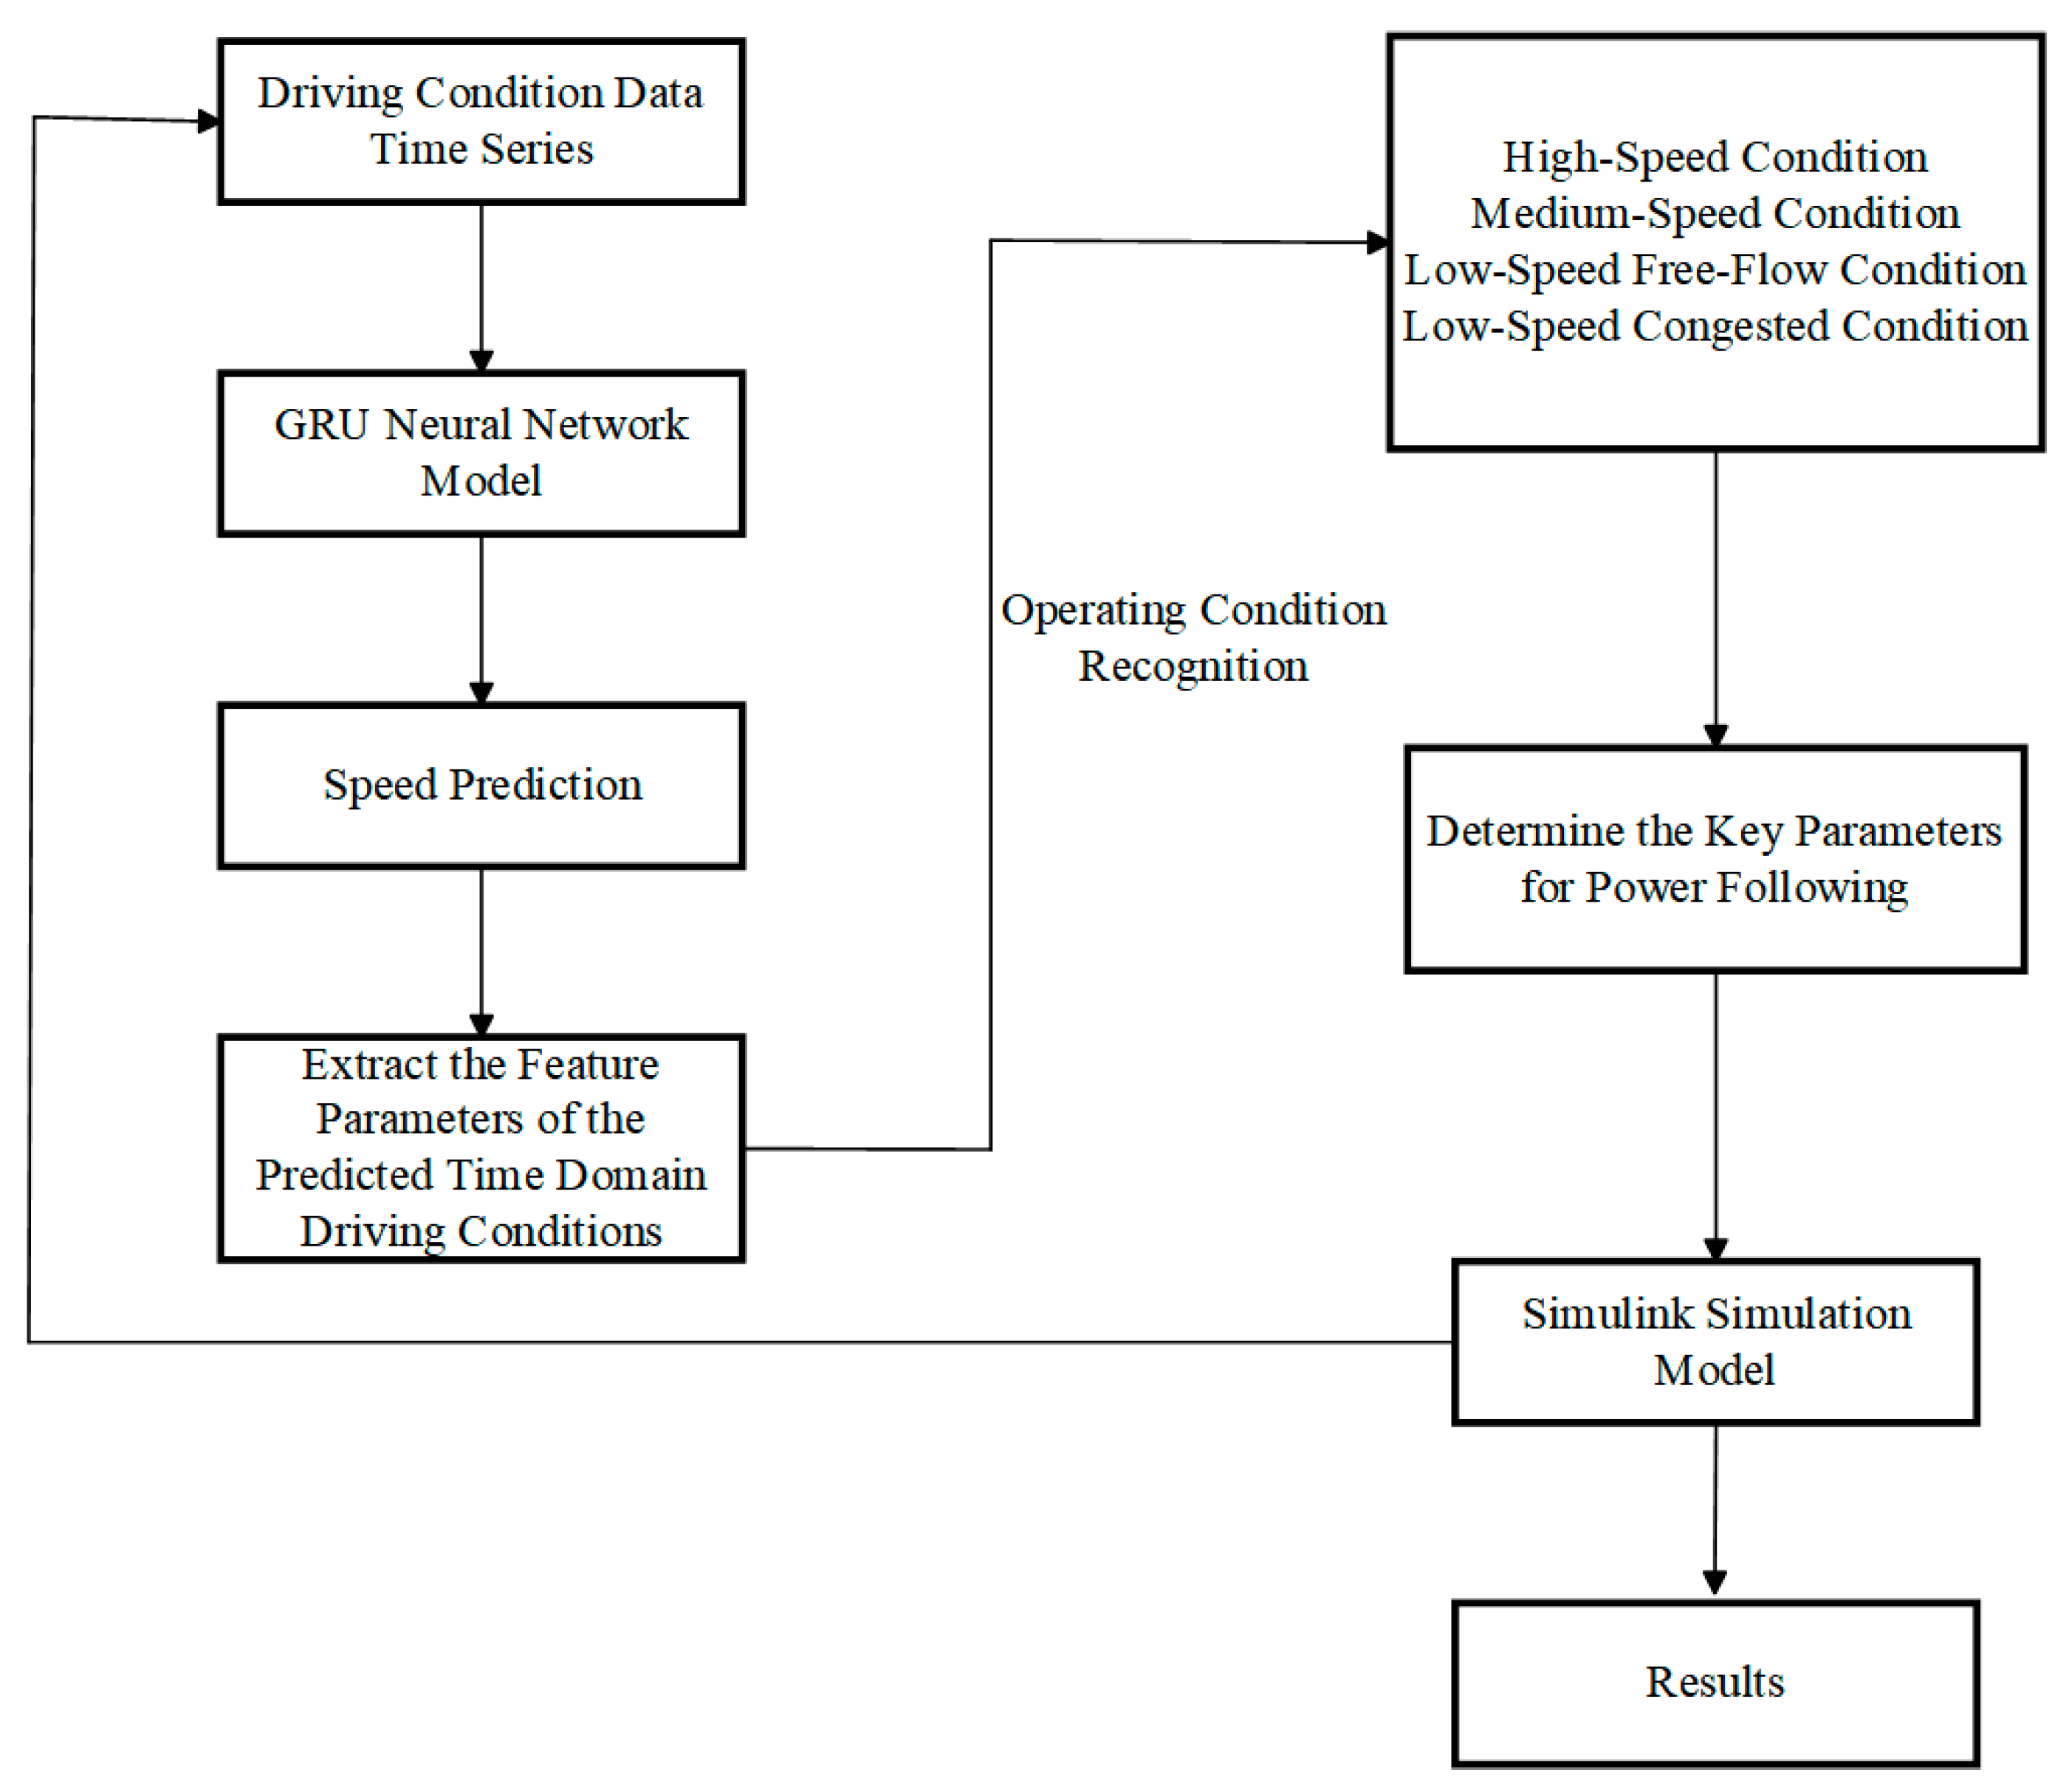
As shown in
Figure 15, using the vehicle speed prediction method, the driving characteristic parameters within the future predicted time domain of the rolling window can be obtained. By calculating the Euclidean proximity to the cluster centers of typical driving conditions, the category of the current condition can be determined. The power-following control parameters corresponding to this category are then selected for control in the next time step.
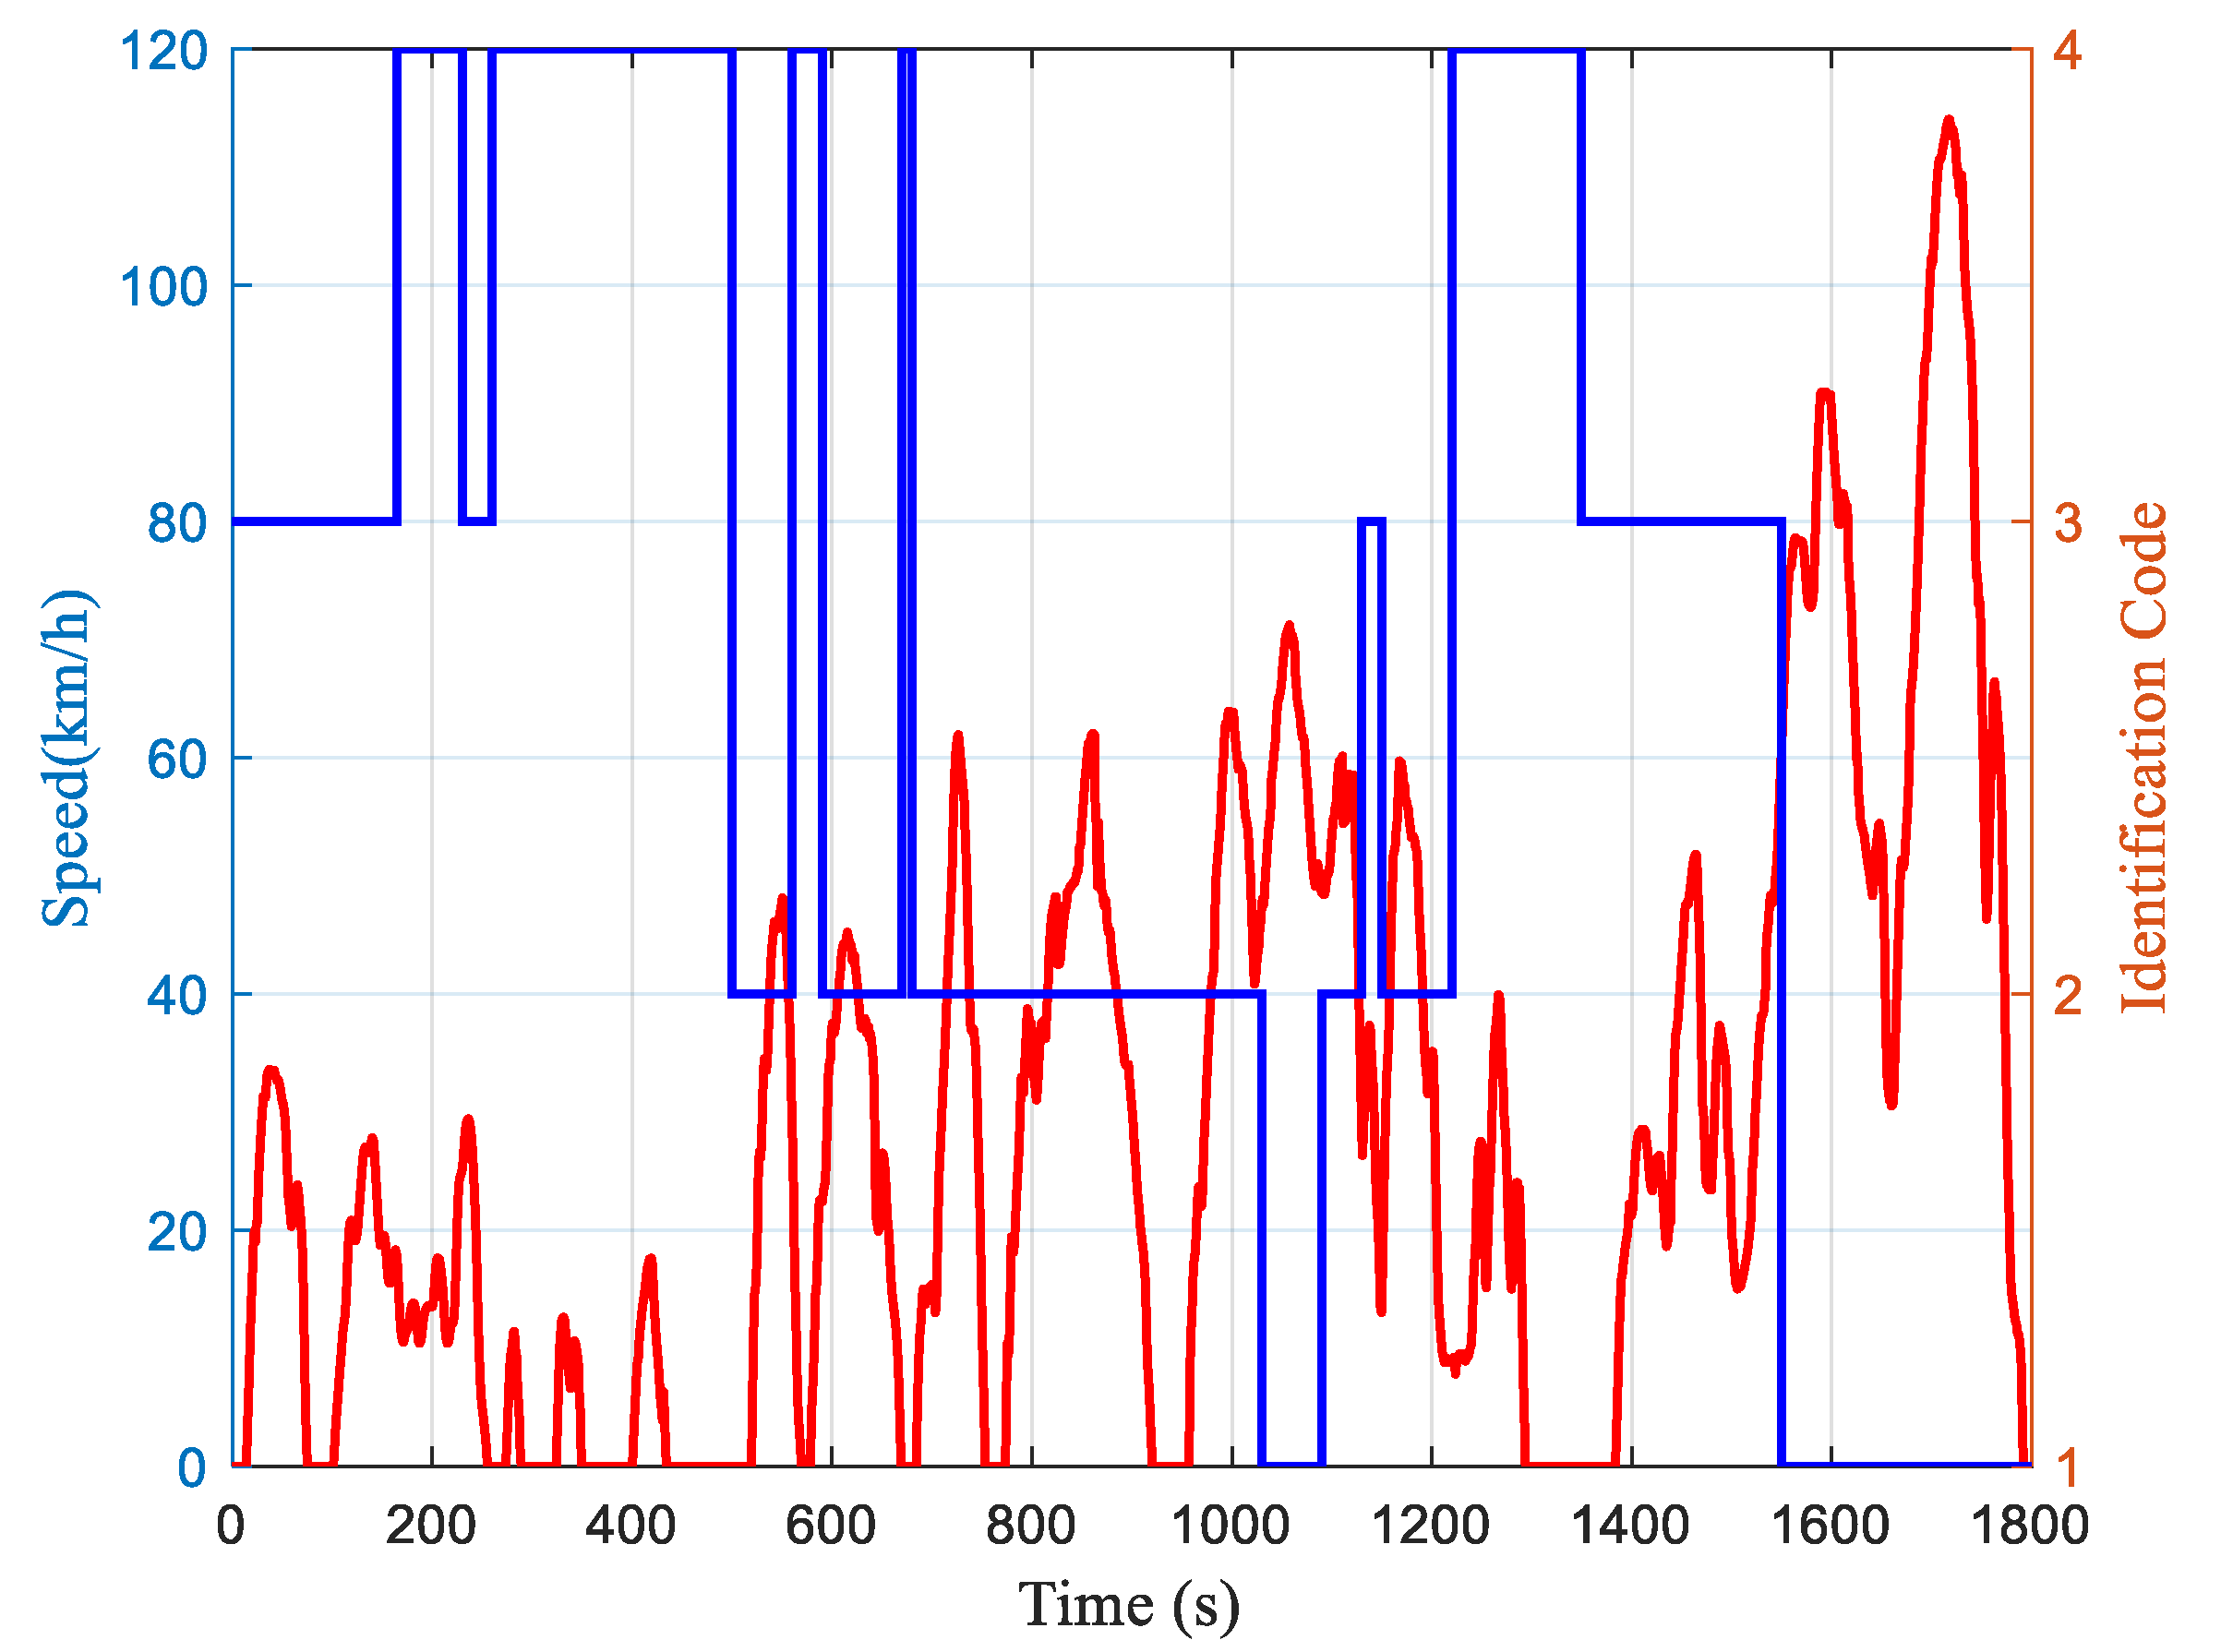
Operating condition recognition is performed using the CLTC-P driving cycle, and the adaptive rolling adjustment results for this condition are shown in
Figure 16. In
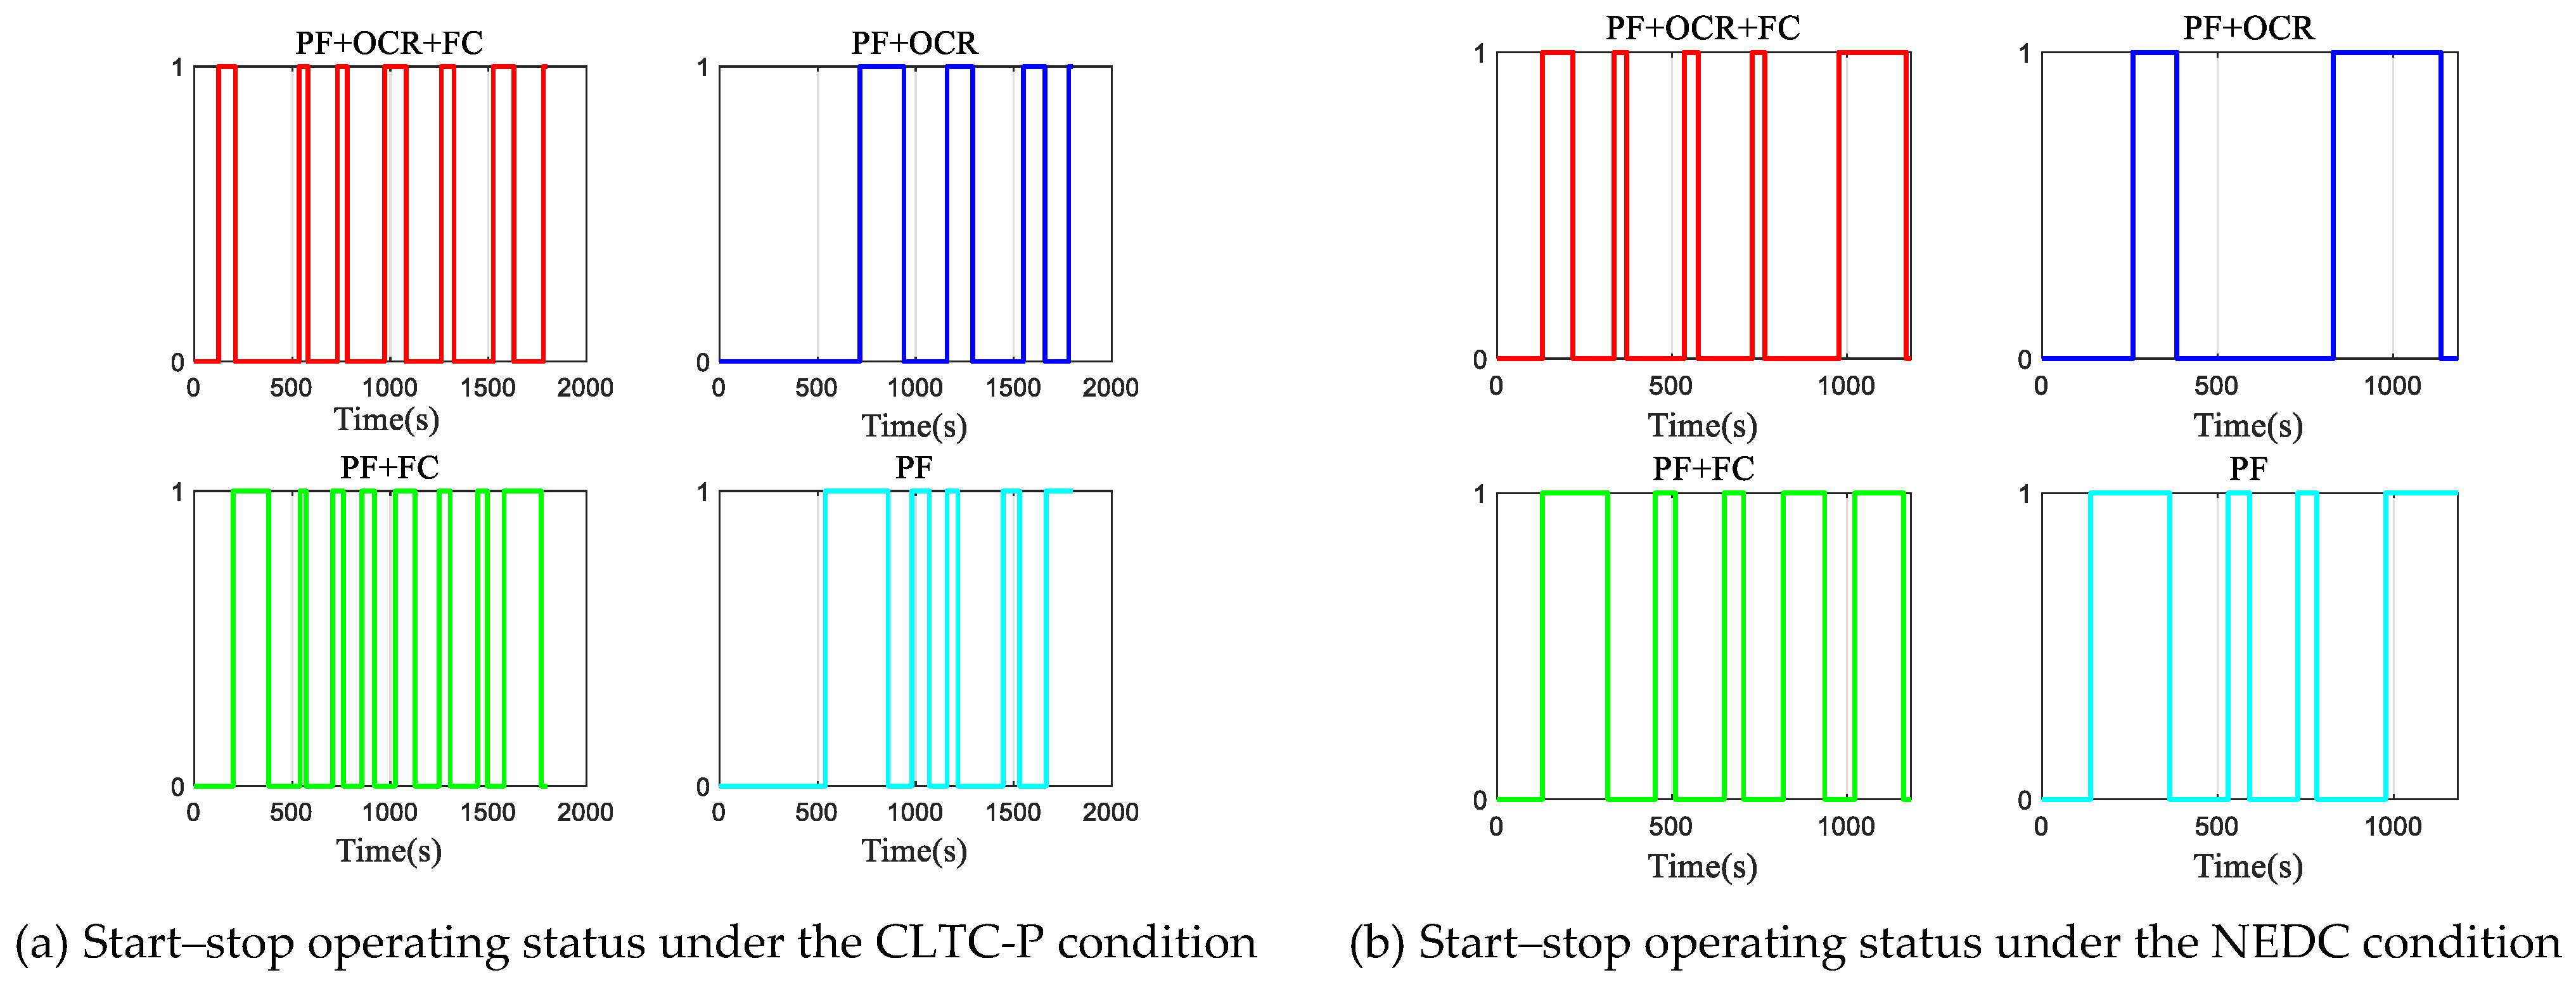
Figure 16, identification codes 1, 2, 3, and 4 represent high-speed conditions, medium-speed conditions, low-speed free-flow conditions, and low-speed congested conditions, respectively. From the figure, it can be observed that the periods 0–500 s and 1220–1550 s correspond to low-speed driving conditions, the period 500–1220 s represents medium-speed driving conditions, and the period 1550–1800 s corresponds to high-speed driving conditions.
4. Results and Discussion
The fuzzy control strategy and the operating condition recognition-based control strategy designed in this study are embedded into the Simulink vehicle model. The CLTC-P driving cycle and NEDC driving cycle are used to verify the rationality of the strategies. The simulation results are shown in
Figure 17,
Figure 18,
Figure 19 and
Figure 20.
4.1. Control Strategy Performance Discussion
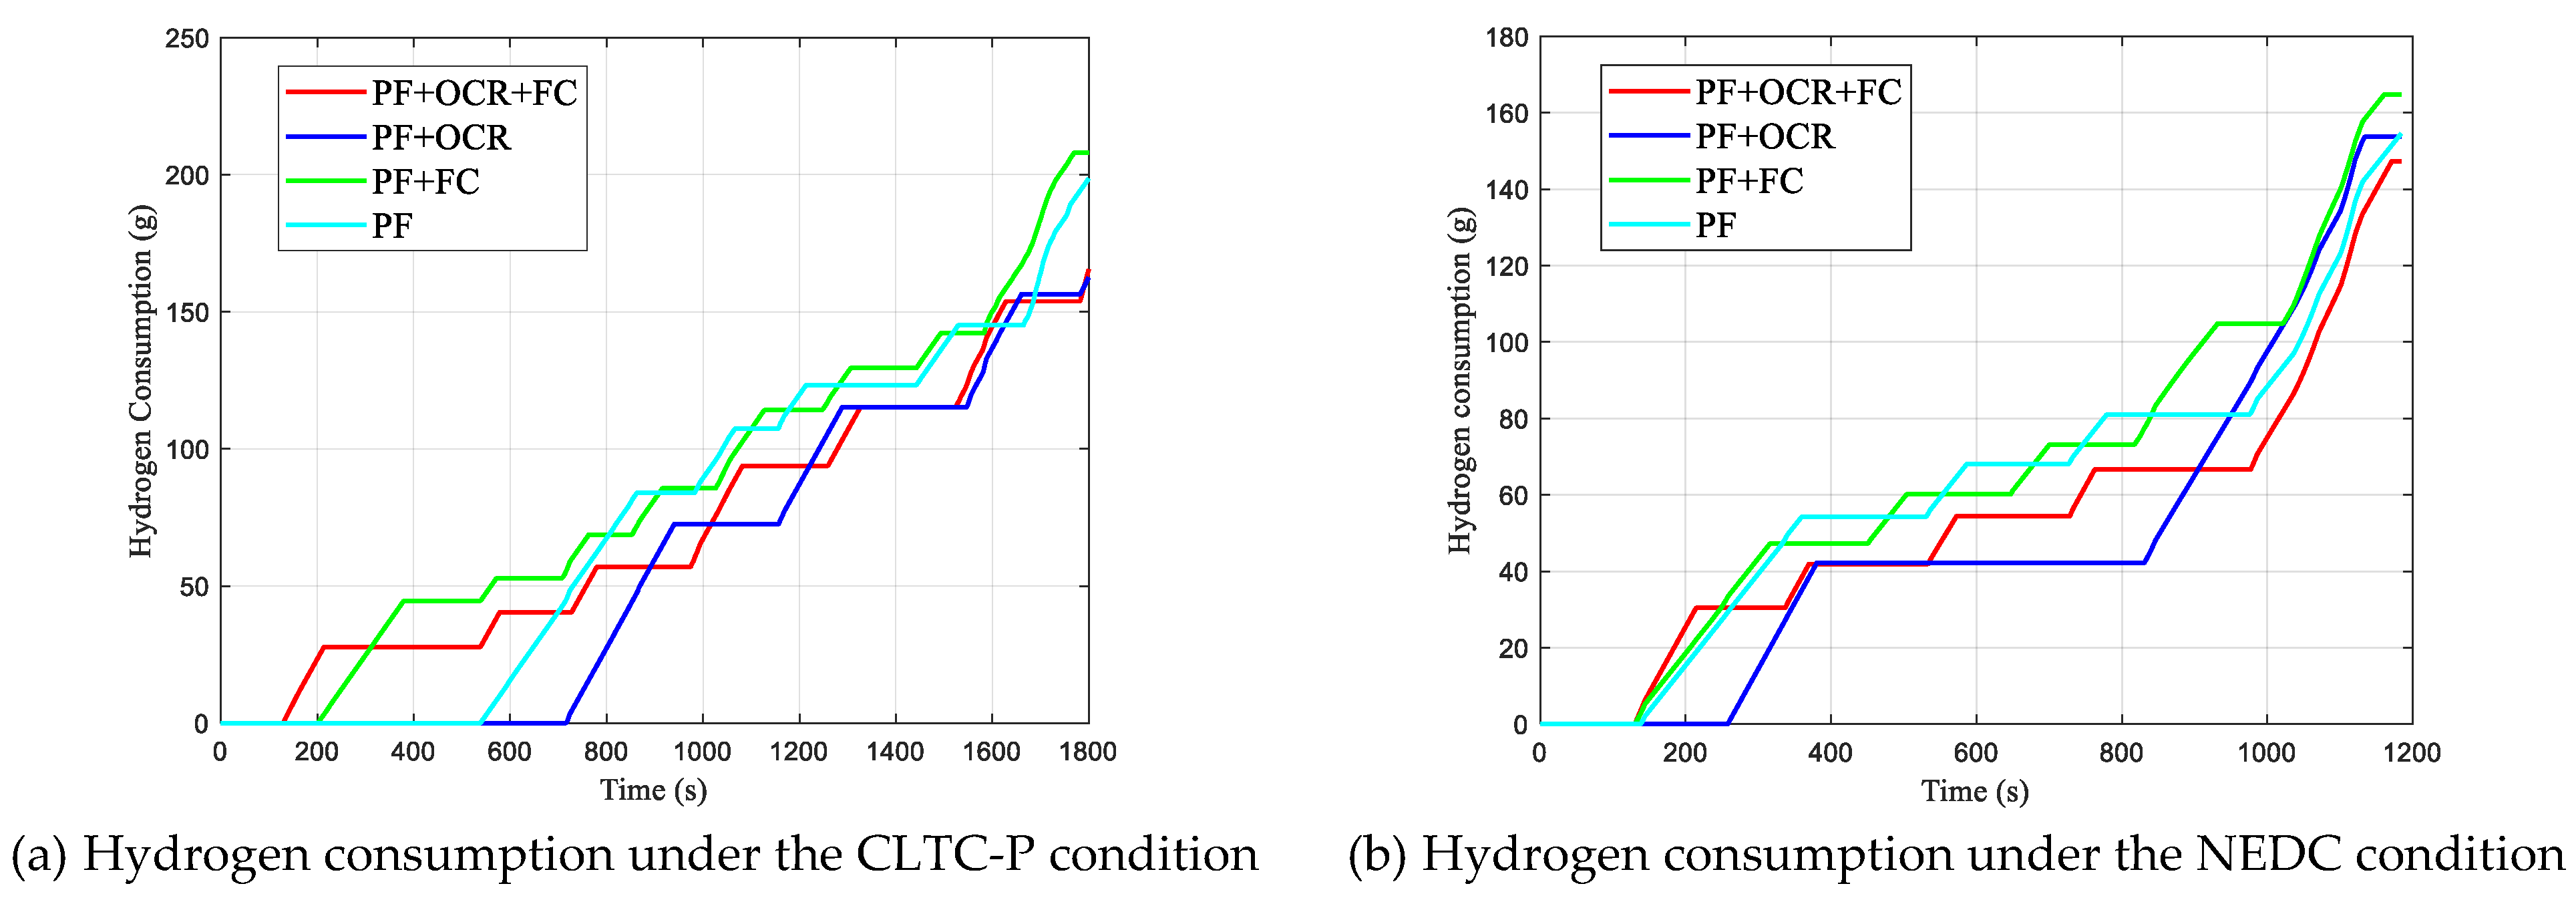
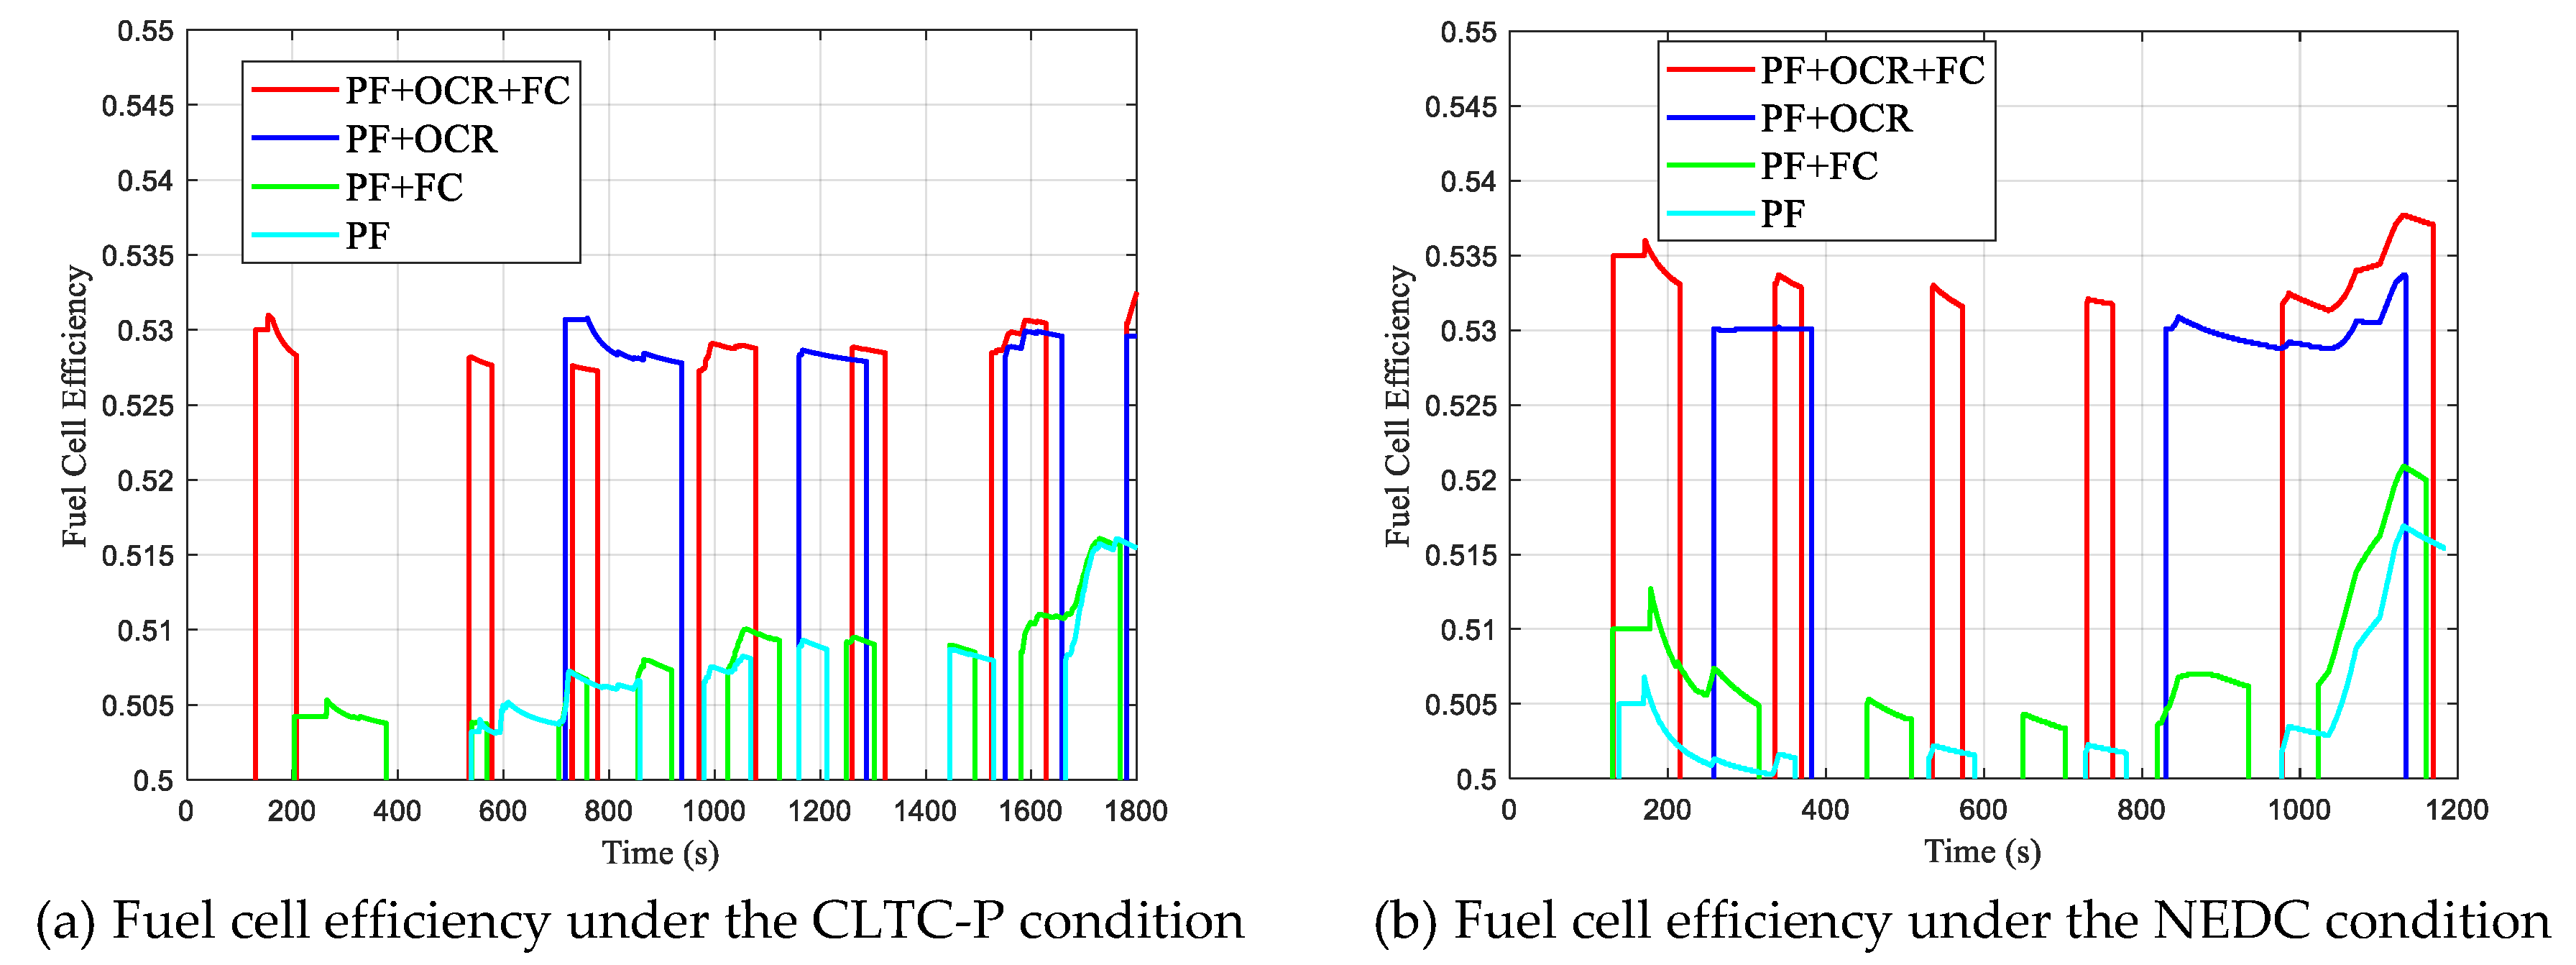
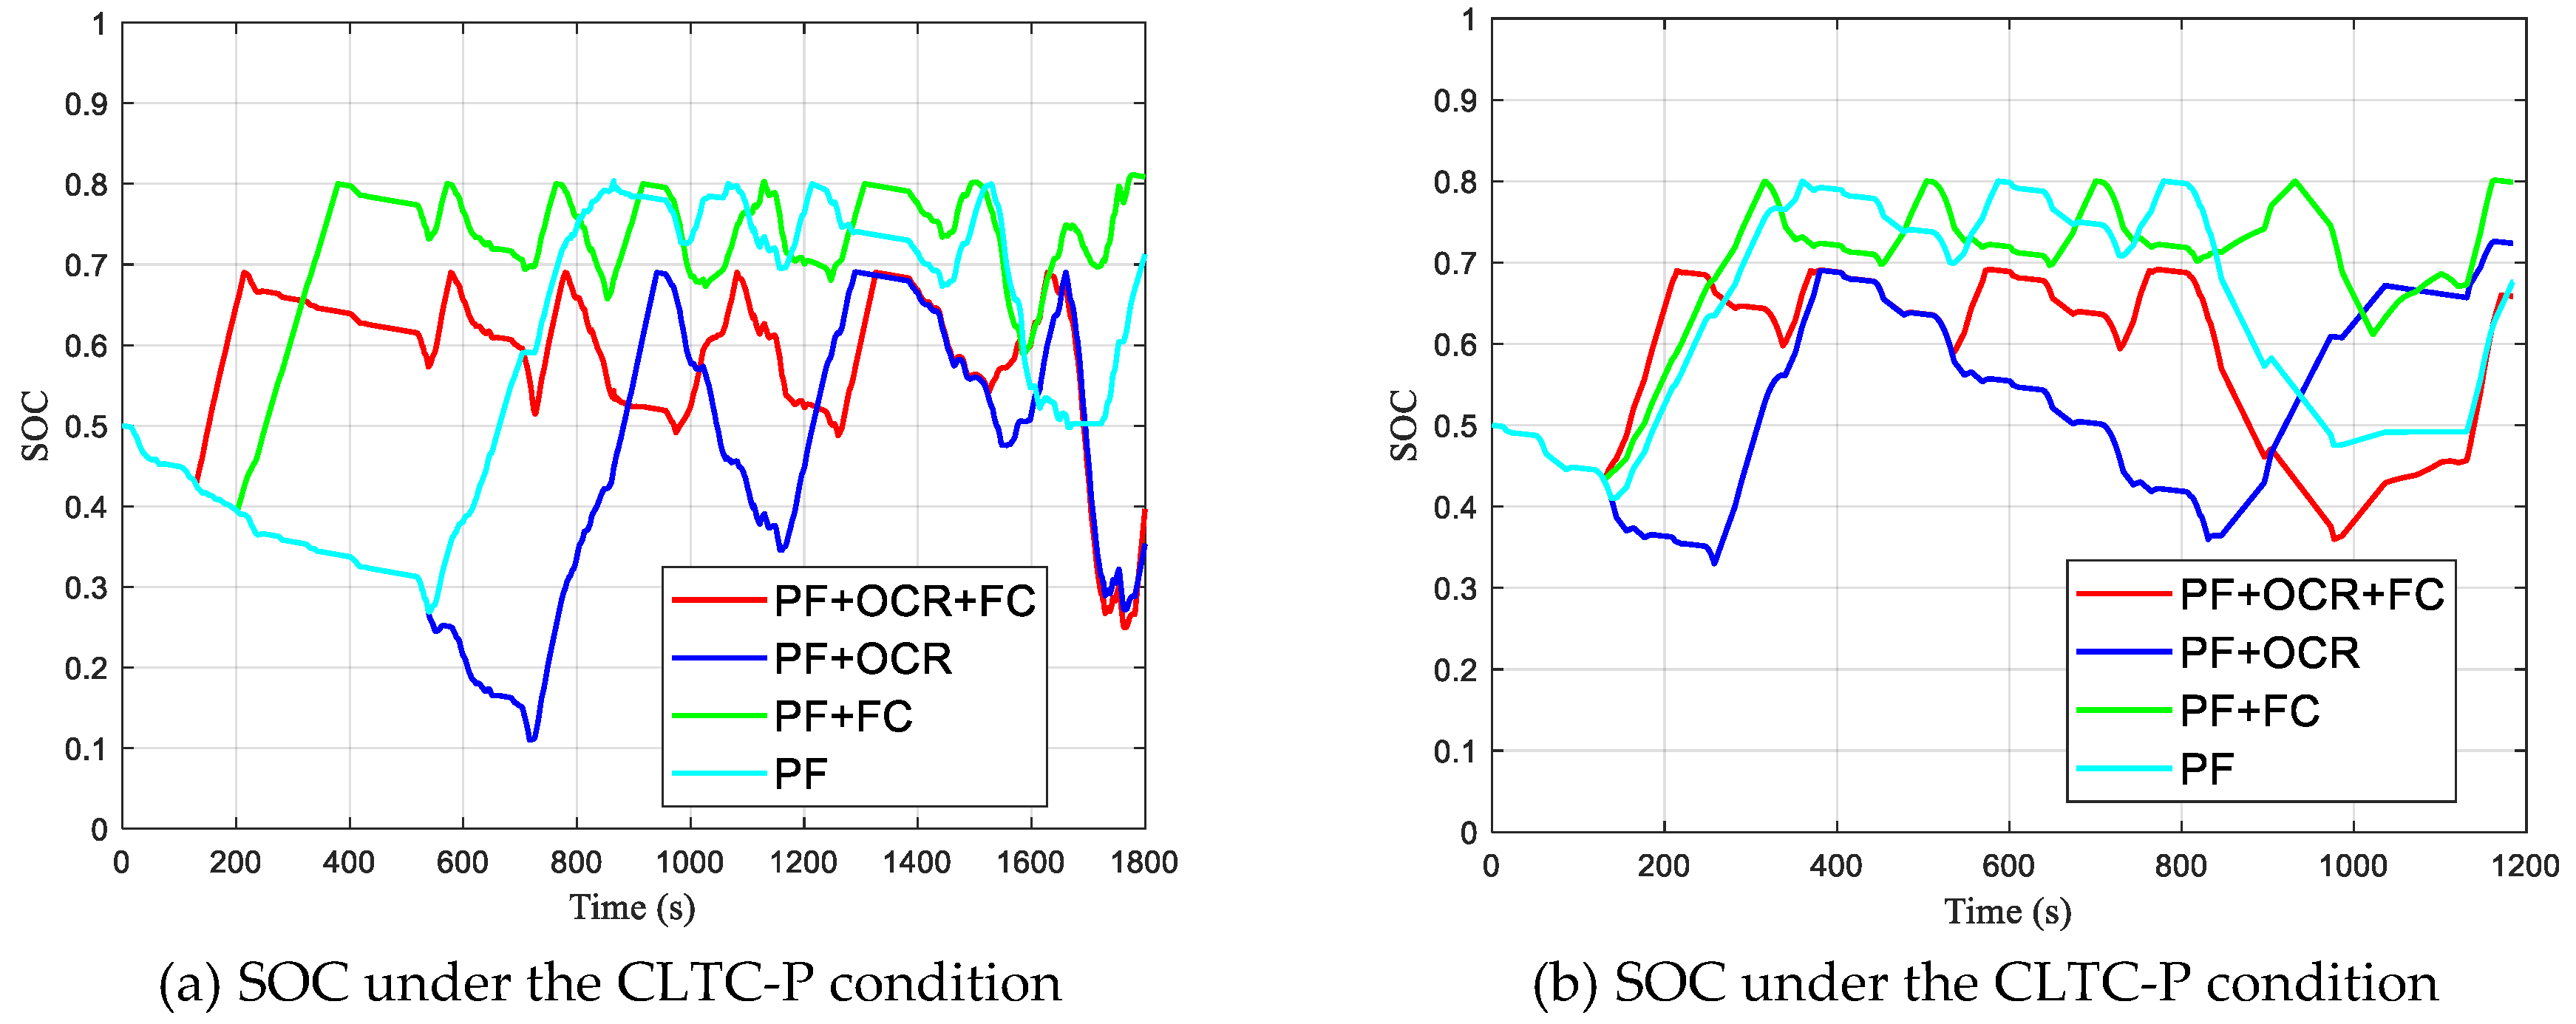
The overall hydrogen consumption, fuel cell efficiency, changes in the battery’s SOC, and fuel cell start–stop behavior for various strategies are shown in
Figure 17,
Figure 18,
Figure 19 and
Figure 20. In the figures, (a) and (b) represent the experimental results for the CLTC-P and NEDC driving cycles, respectively. PF represents the power-following control strategy, OCR stands for operating condition recognition optimization, and FC denotes fuzzy control optimization. The relevant data for each operating condition are shown in
Table 9 and
Table 10.
Figure 17 and
Figure 18 show that the OCR optimization strategy improves fuel cell efficiency and reduces hydrogen consumption for both the CLTC-P and NEDC driving cycle conditions. In regard to the CLTC-P driving cycle, the PF + OCR + FC strategy reduces the hydrogen consumption by 1.7%, 20.6%, and 16.6% compared to other strategies, while the fuel cell efficiency is improved by 0.03%, 4.09%, and 4.17%, respectively. In regard to the NEDC driving cycle, the hydrogen consumption decreases by 4.2%, 10.6%, and 4.7%, with corresponding fuel cell efficiency improvements of 0.8%, 4.8%, and 5.7%.
From the hydrogen fuel cell efficiency data presented in
Figure 18a, it is evident that, with the OCR optimization control strategy, the fuel cell efficiency remains consistently high throughout the entire operation. In contrast, when the OCR optimization is not applied, the fuel cell efficiency is relatively lower. Moreover, the fuel cell’s operating efficiency is influenced by variations in the driving conditions, specifically changes in speed, which correspond to fluctuations in power demand.
From
Figure 19a, it can be observed that during the initial low-speed phase (0–500 s), the application of the fuzzy control optimization strategy results in an increase in the battery’s SOC, effectively suppressing excessive battery discharge. Additionally, from
Figure 18a, it is evident that during the first 500 s, the fuzzy control optimization strategy allows the fuel cell to charge the battery, while without the fuzzy optimization, the battery’s SOC continuously decreases during the low-speed phase.
During the medium-speed phase (500–1220 s), increased power demand leads to higher battery discharge, causing frequent fuel cell start–stop cycles or excessive battery charge–discharge, resulting in SOC fluctuations. The FC optimization strategy reduces SOC fluctuations (0.65–0.8), but increases the number of fuel cell start–stop cycles to four. In contrast, the OCR strategy limits the fuel cell start–stop cycles to two, but causes severe SOC fluctuations (0.1–0.7). The combined FC + OCR strategy balances both of these aspects, with three fuel cell start–stop cycles and SOC fluctuations maintained within 0.5–0.7, optimizing system efficiency. During the high-speed phase (1550–1800 s), the fuel cell primarily charges the battery to meet high power demands.
Figure 20a illustrates the start–stop behavior of the fuel cell throughout the entire operational cycle. It can be observed that, with the combined application of OCR and FC optimization, the intervals between fuel cell start–stop events are more evenly distributed, and the fuel cell’s operating time remains more consistent. This approach avoids the issues typically seen with a purely power-following control strategy, where the fuel cell experiences either very short start–stop intervals or prolonged operating periods, which could lead to battery overcharging.
Although
Figure 17a shows that the PF + OCR control strategy achieves lower equivalent hydrogen consumption compared to the PF + OCR + FC control strategy, this is achieved at the cost of a significantly increased SOC fluctuation amplitude. A comparison of the SOC trajectories shown in
Figure 19a reveals that the PF + OCR + FC control strategy has greater advantages: it significantly reduces the SOC fluctuation amplitude. Using the PF + OCR control strategy, the maximum depth of the charge–discharge of the battery is 0.5834, whereas for the PF + OCR + FC control strategy, it is reduced to 0.4429, representing a 17.7% reduction in the maximum SOC fluctuation amplitude.
In regard to the NEDC driving cycle, the fuel cell’s operating efficiency, battery SOC variations, and start–stop behavior are similar to those observed for the CLTC-P cycle. However, a key difference is that the fuel cell achieves higher efficiency and lower hydrogen consumption in the NEDC cycle. This further highlights the instability of relying solely on the condition recognition optimization strategy, while demonstrating the robustness of the combined condition recognition and fuzzy control strategy.
4.2. Control Strategy HIL Testing
Building upon the previous offline simulation, further Hardware-in-the-Loop (HIL) simulation testing was conducted. The control performance in both offline and online environments was compared to verify the real-time ability of the control strategy. Additionally, this provided comprehensive validation for its subsequent implementation in real vehicles.
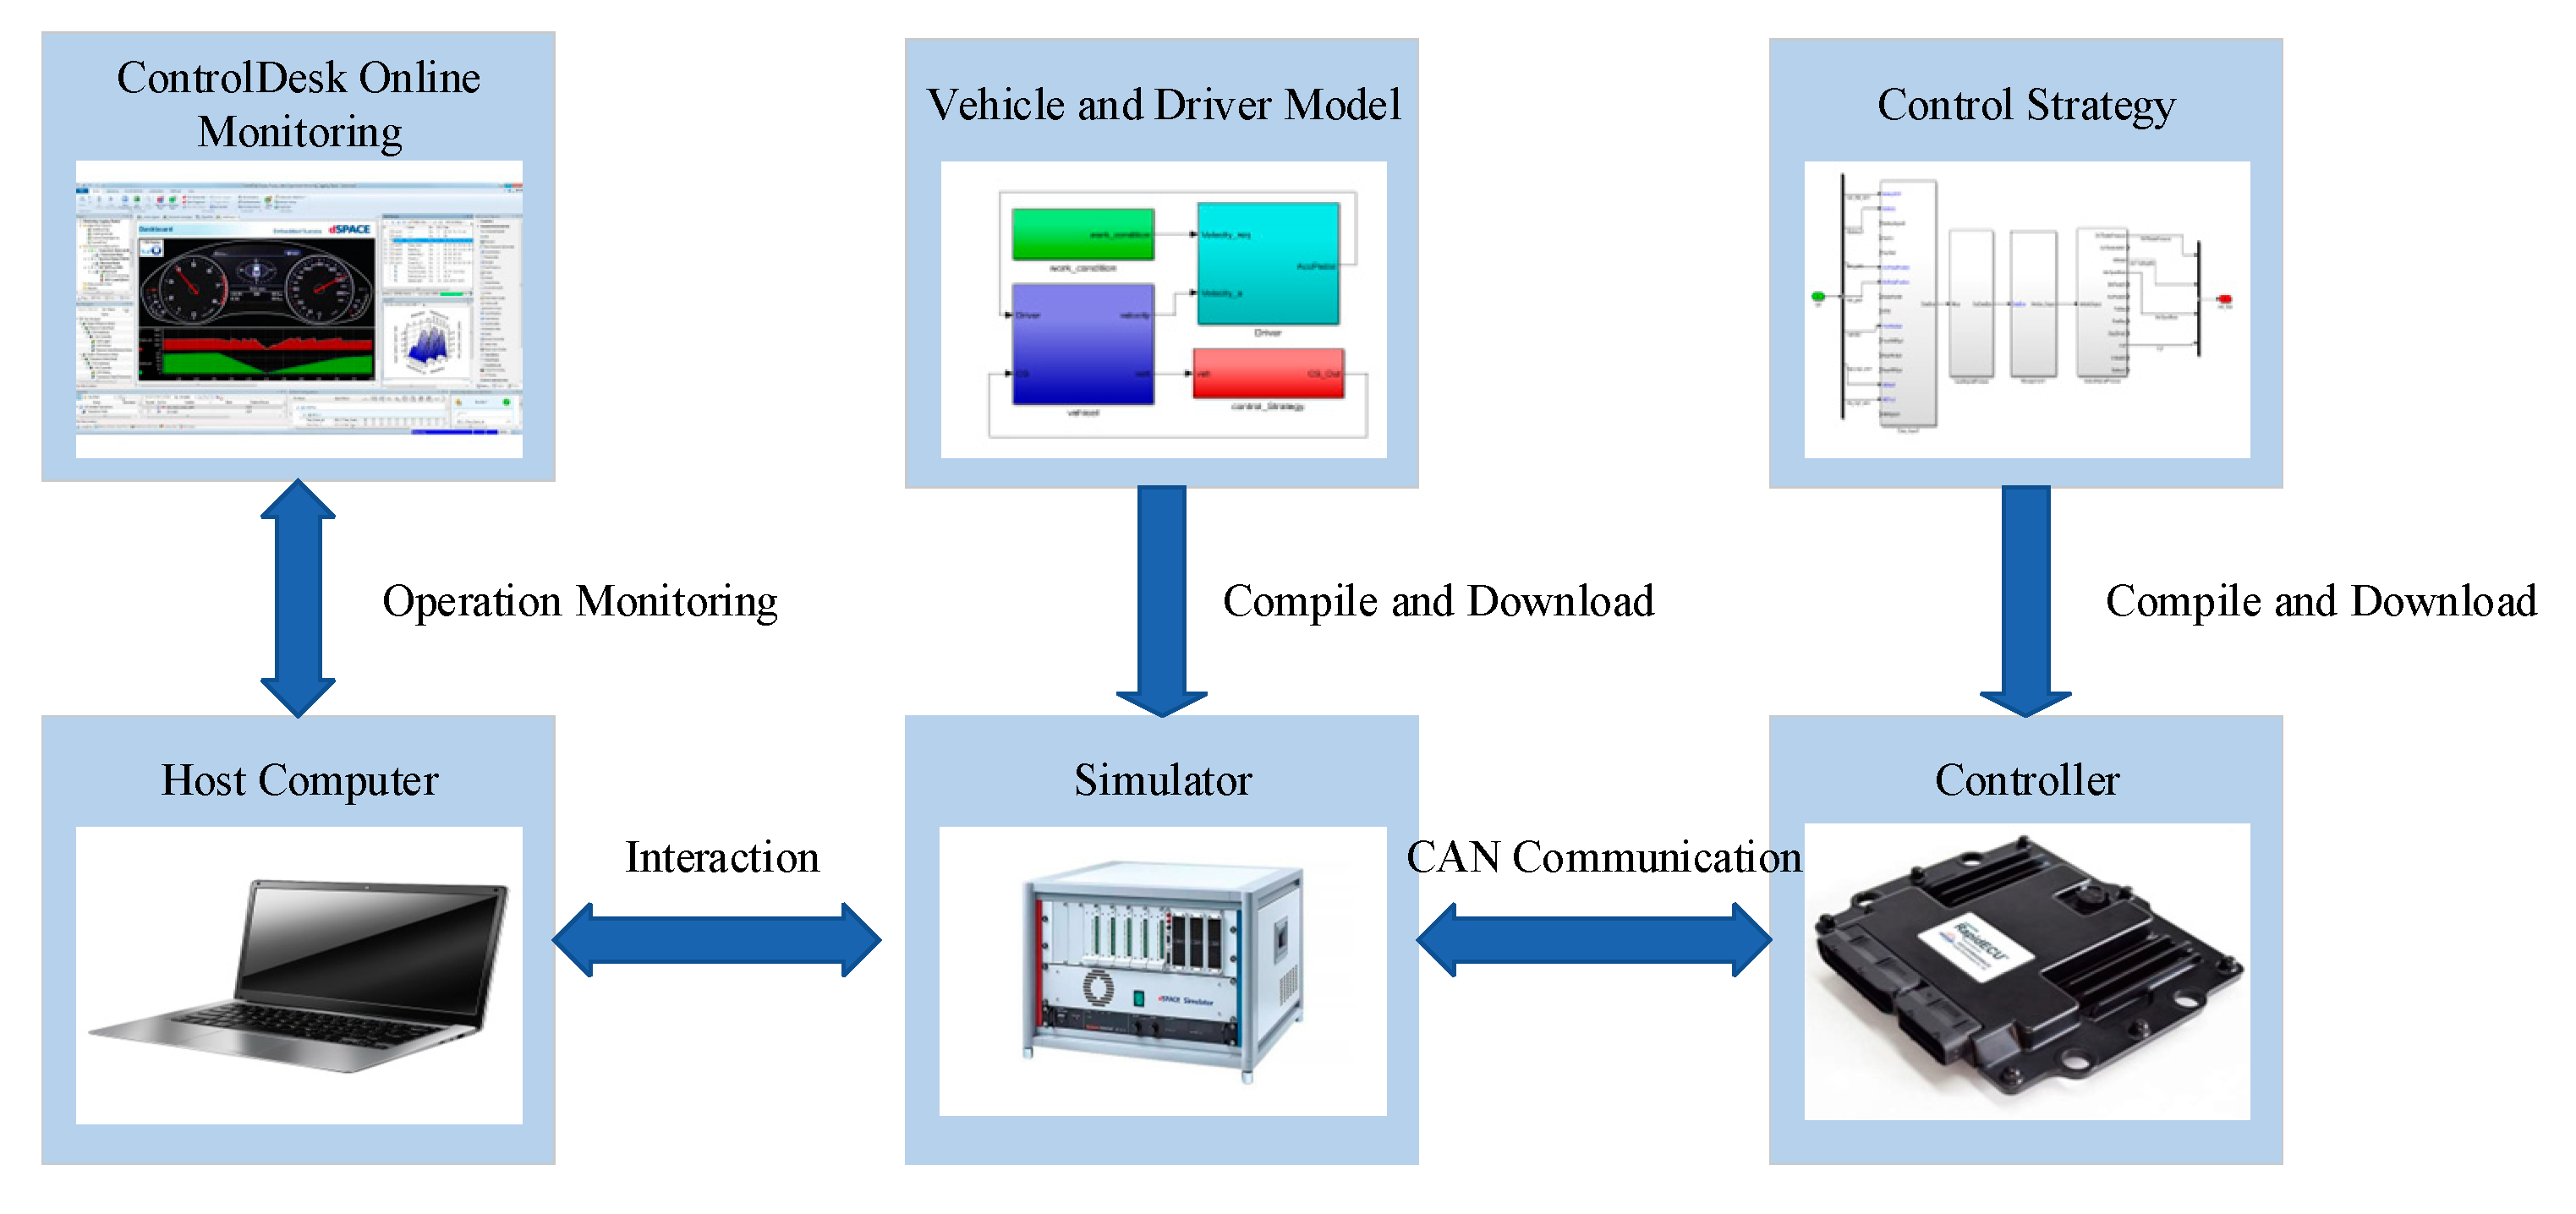
The Hardware-in-the-Loop (HIL) platform used in this study is shown in
Figure 21. Its main components include the dSPACE Simulator for real-time vehicle simulation, a host computer, and a controller. The control strategy is tested online using predefined driving conditions. To eliminate the influence of human operation on the simulation results and ensure consistency, a driver model is employed to achieve closed-loop simulation testing. The developed vehicle model and the PID-based driver model are integrated, compiled, and downloaded by the simulator, while the energy management strategy model is compiled and downloaded by the controller. The two systems communicate via the CAN bus, and the simulation process is operated and monitored using ControlDesk 7.1 software, installed on the host computer.
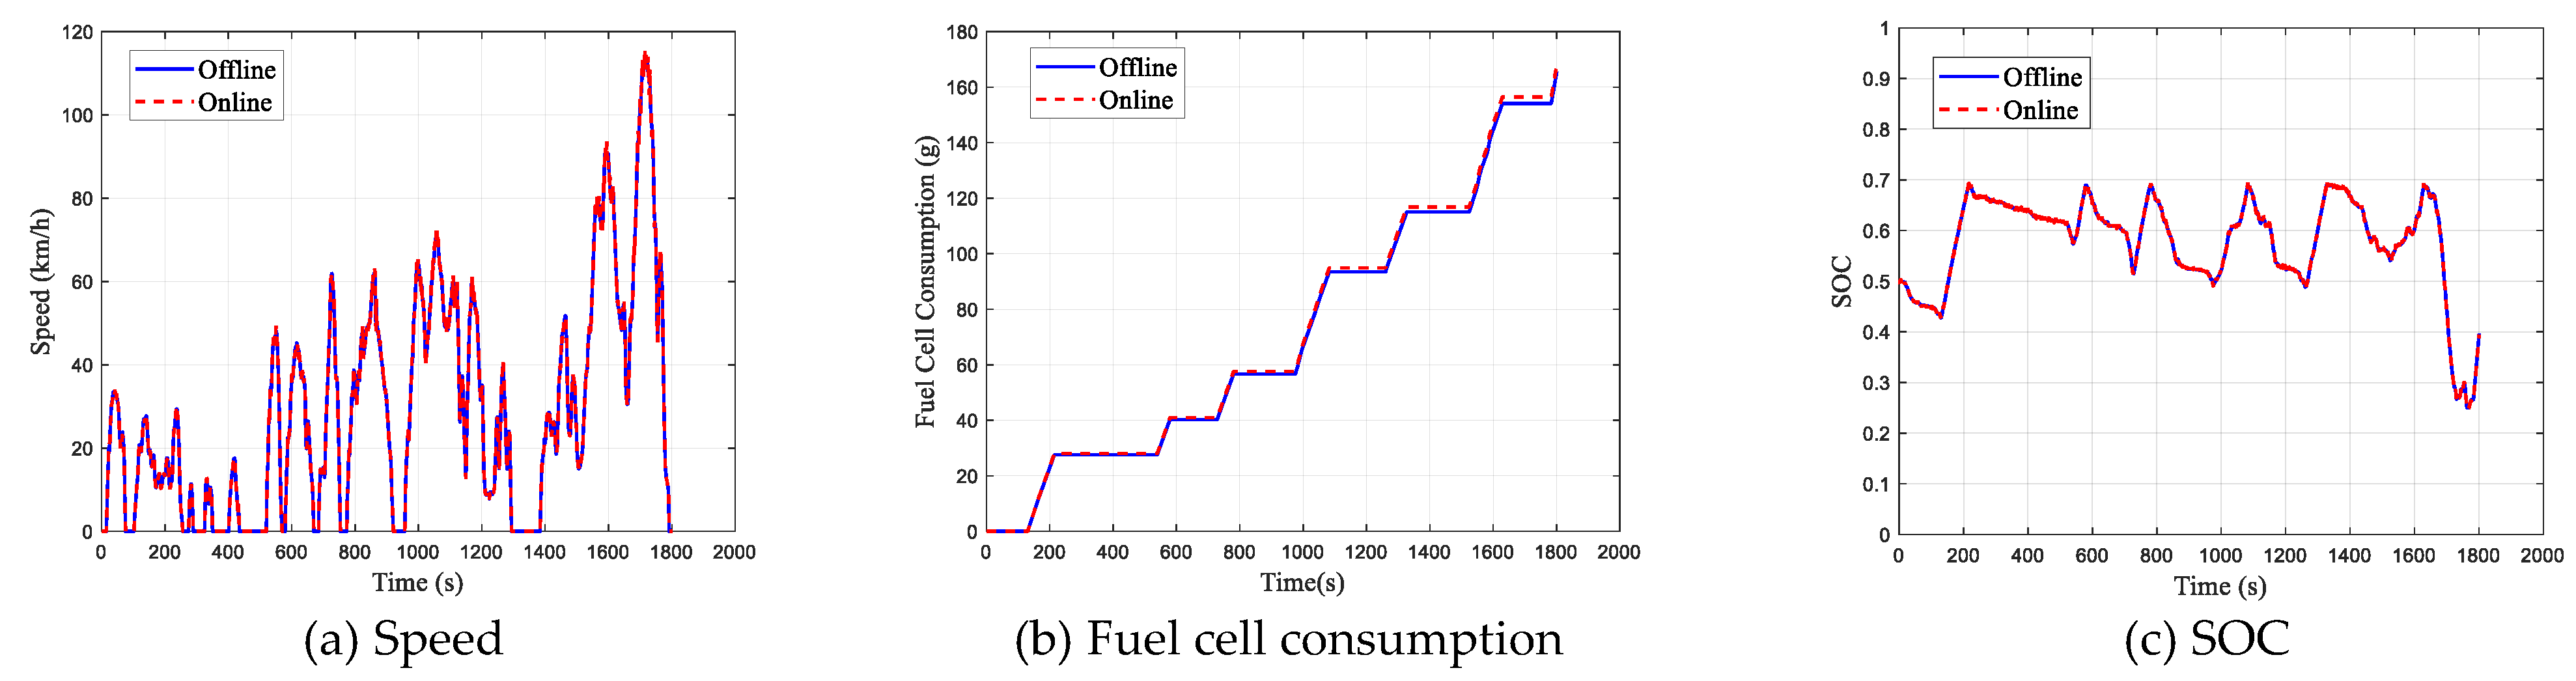
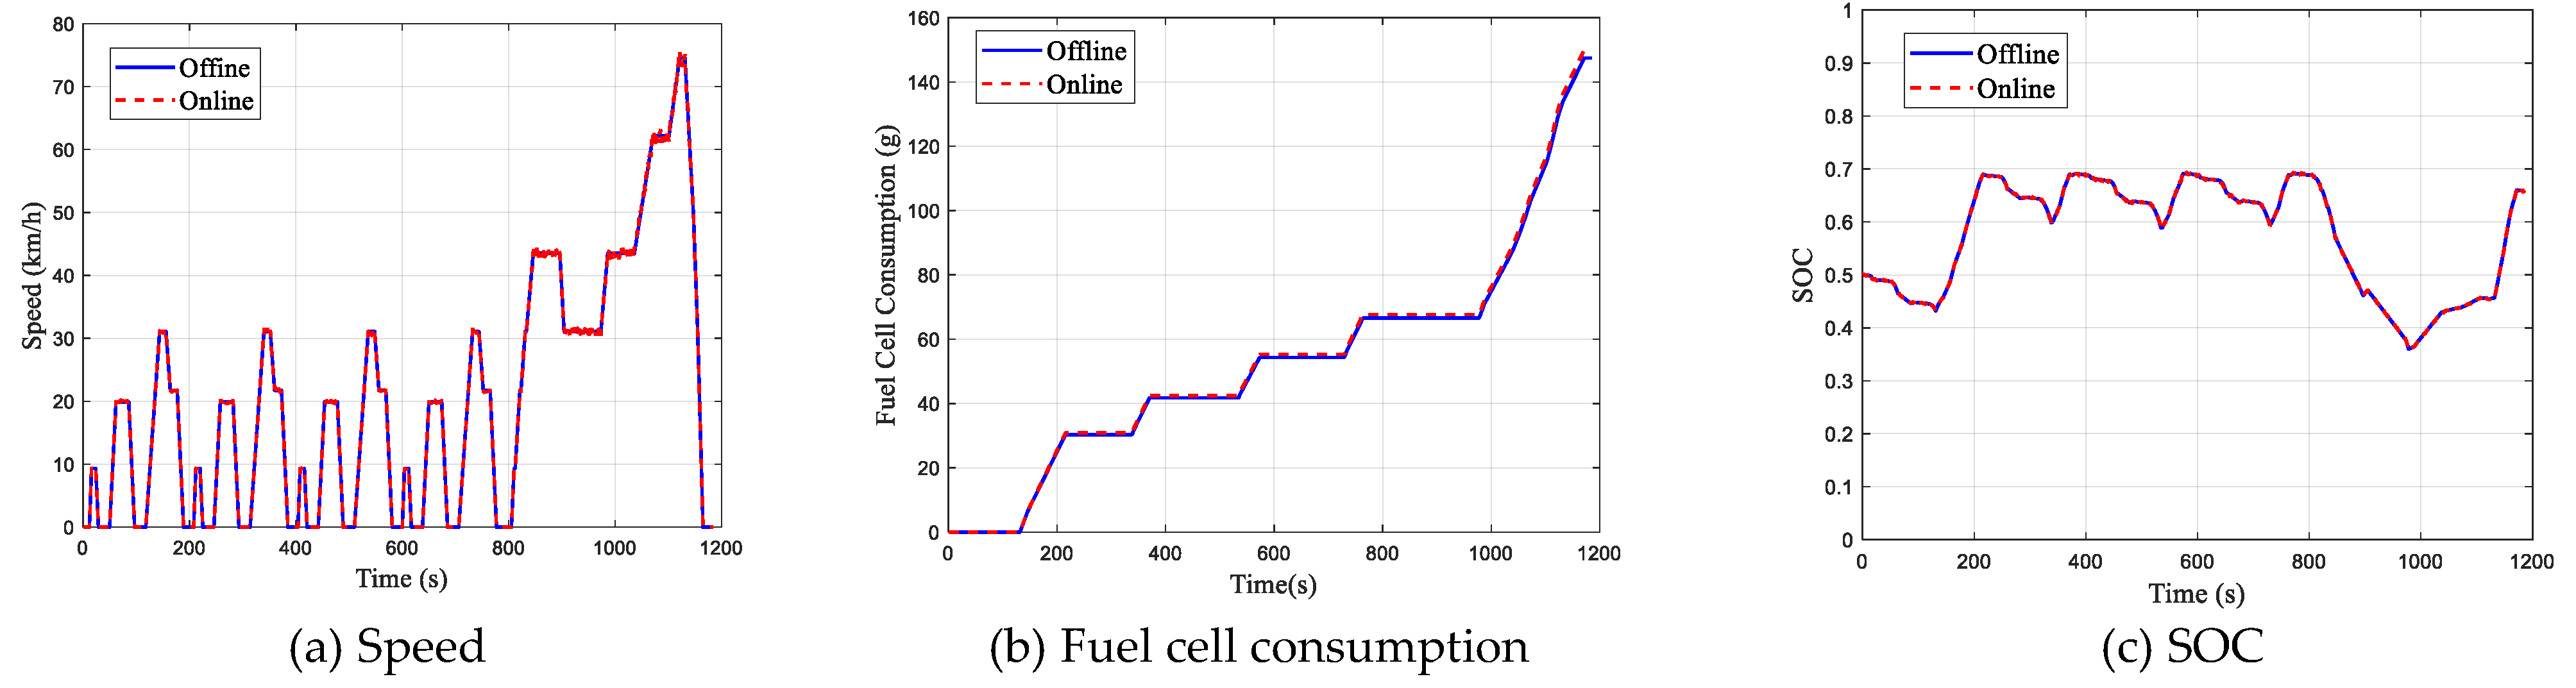
The final vehicle speed tracking performance results in the HIL test environment are shown in
Figure 22a and
Figure 23a. As observed from the figures, the vehicle speed follows the target speed well in the online test environment, indicating that the developed control strategy enables the vehicle to track the target speed in real-time, with good performance achieved.
Additionally, comparative analyses of fuel cell hydrogen consumption and the batteries’ SOC were conducted, demonstrating a high degree of similarity, as shown in
Figure 22b,c and
Figure 23b,c. Notably, the hydrogen consumption, serving as the primary evaluation metric, exhibited an error margin of less than 2%.
Therefore, the developed control strategy exhibits strong real-time performance and feasibility for in-vehicle implementation.
4.3. Control Strategy Scalability Discussion
The power-following control strategy regulates vehicle power demand based on the fuel cell system’s operational status, with adjustable control modules to accommodate various vehicle requirements and environments. References [
38,
39,
40,
41] utilize standalone fuzzy control, while references [
41,
42,
43,
44,
45] integrate condition recognition for optimization. By tuning key parameters, such as battery SOC limits, fuel cell operating thresholds, and start–stop intervals, the strategy adapts to different fuel cell systems and battery configurations. For instance, vehicles with a larger battery capacity can reduce fuel cell output, whereas those with smaller batteries may require higher fuel cell power.
This strategy is hardware agnostic, dynamically adjusting the power distribution based on real-time driving conditions, such as acceleration, cruising, and braking. Its flexibility ensures its applicability across diverse vehicle architectures, including hydrogen fuel cell vehicles (HFCVs), methanol fuel cell vehicles, and hybrid systems combining batteries and fuel cells.


