1. Introduction
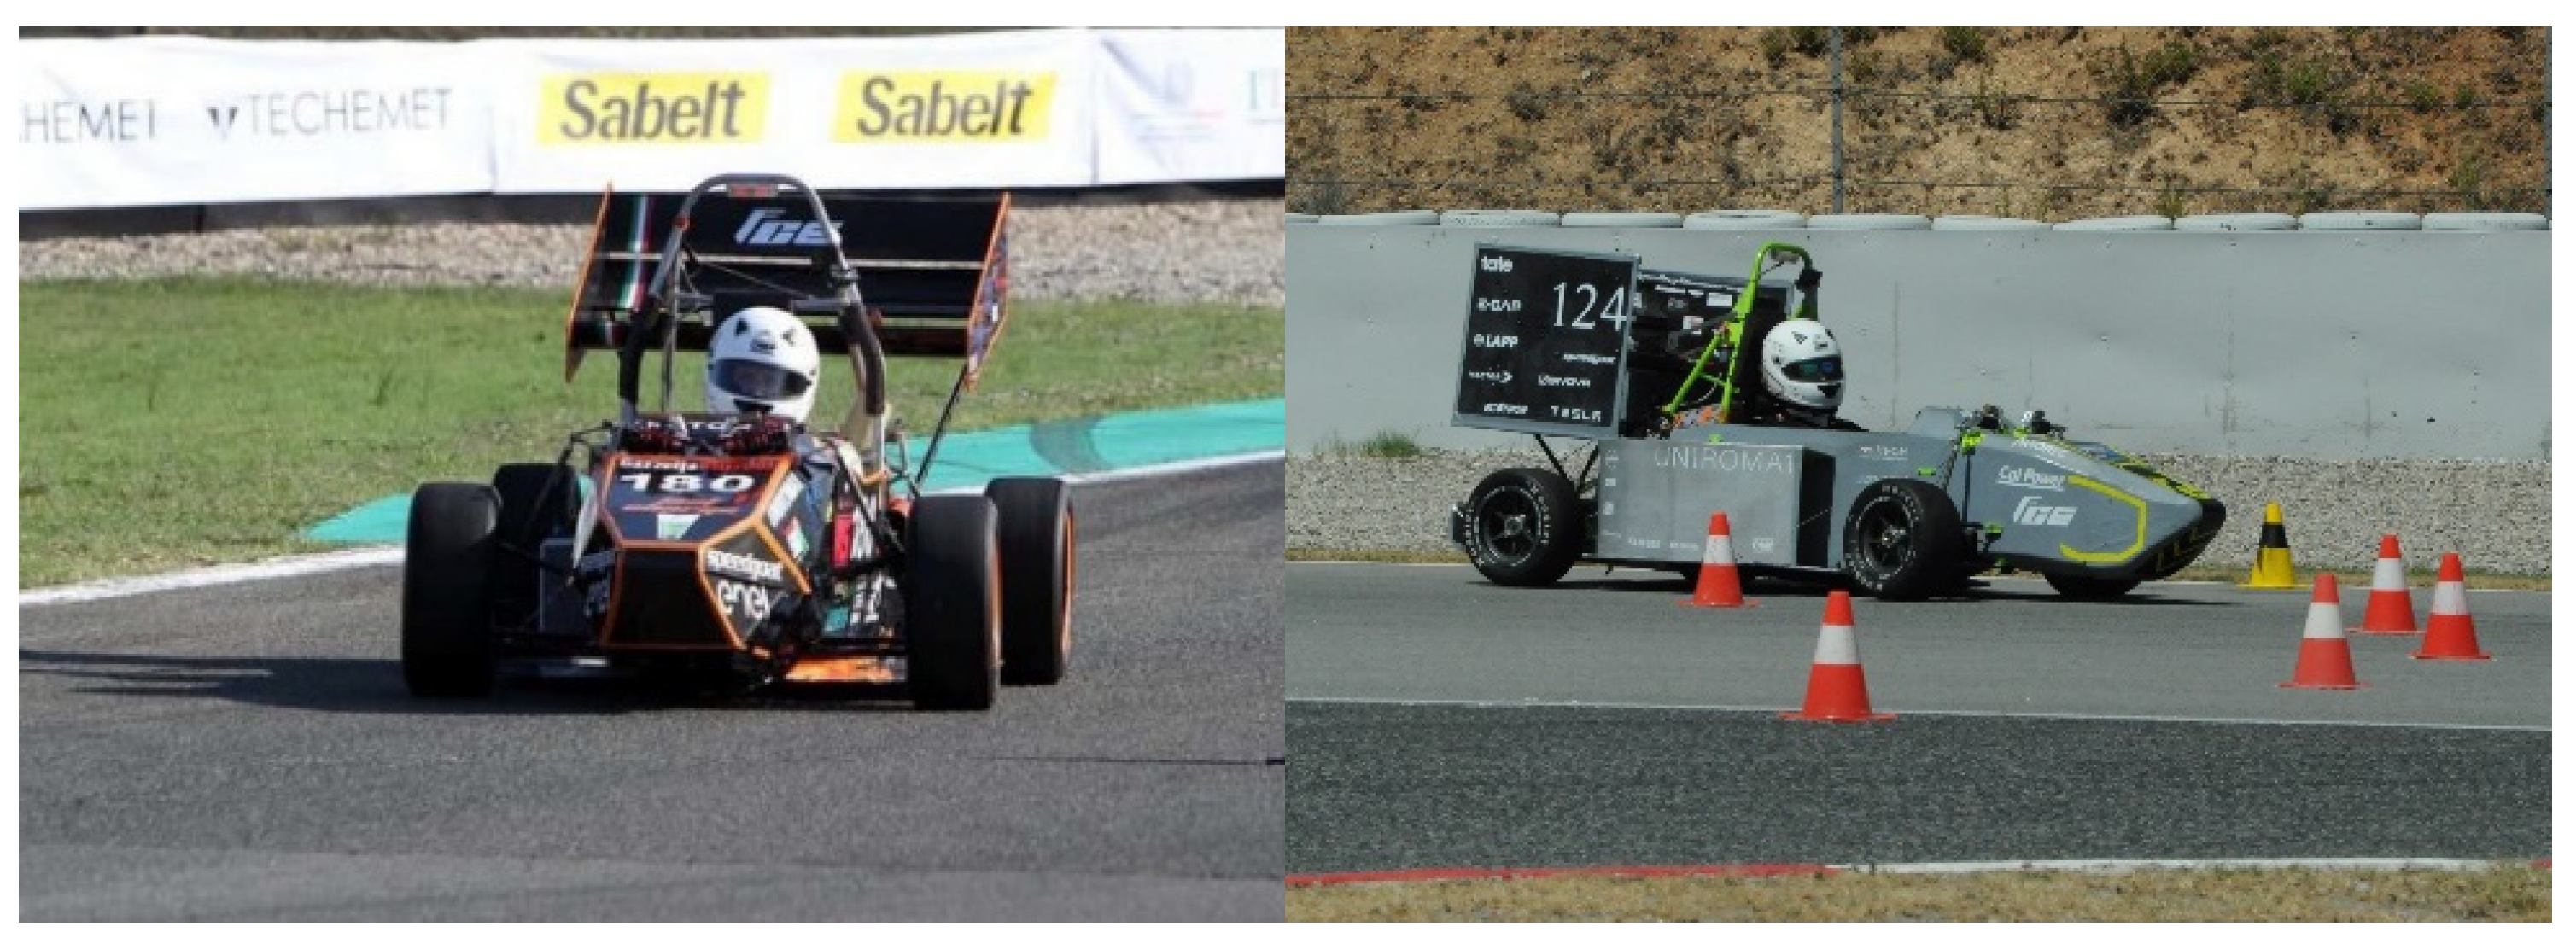
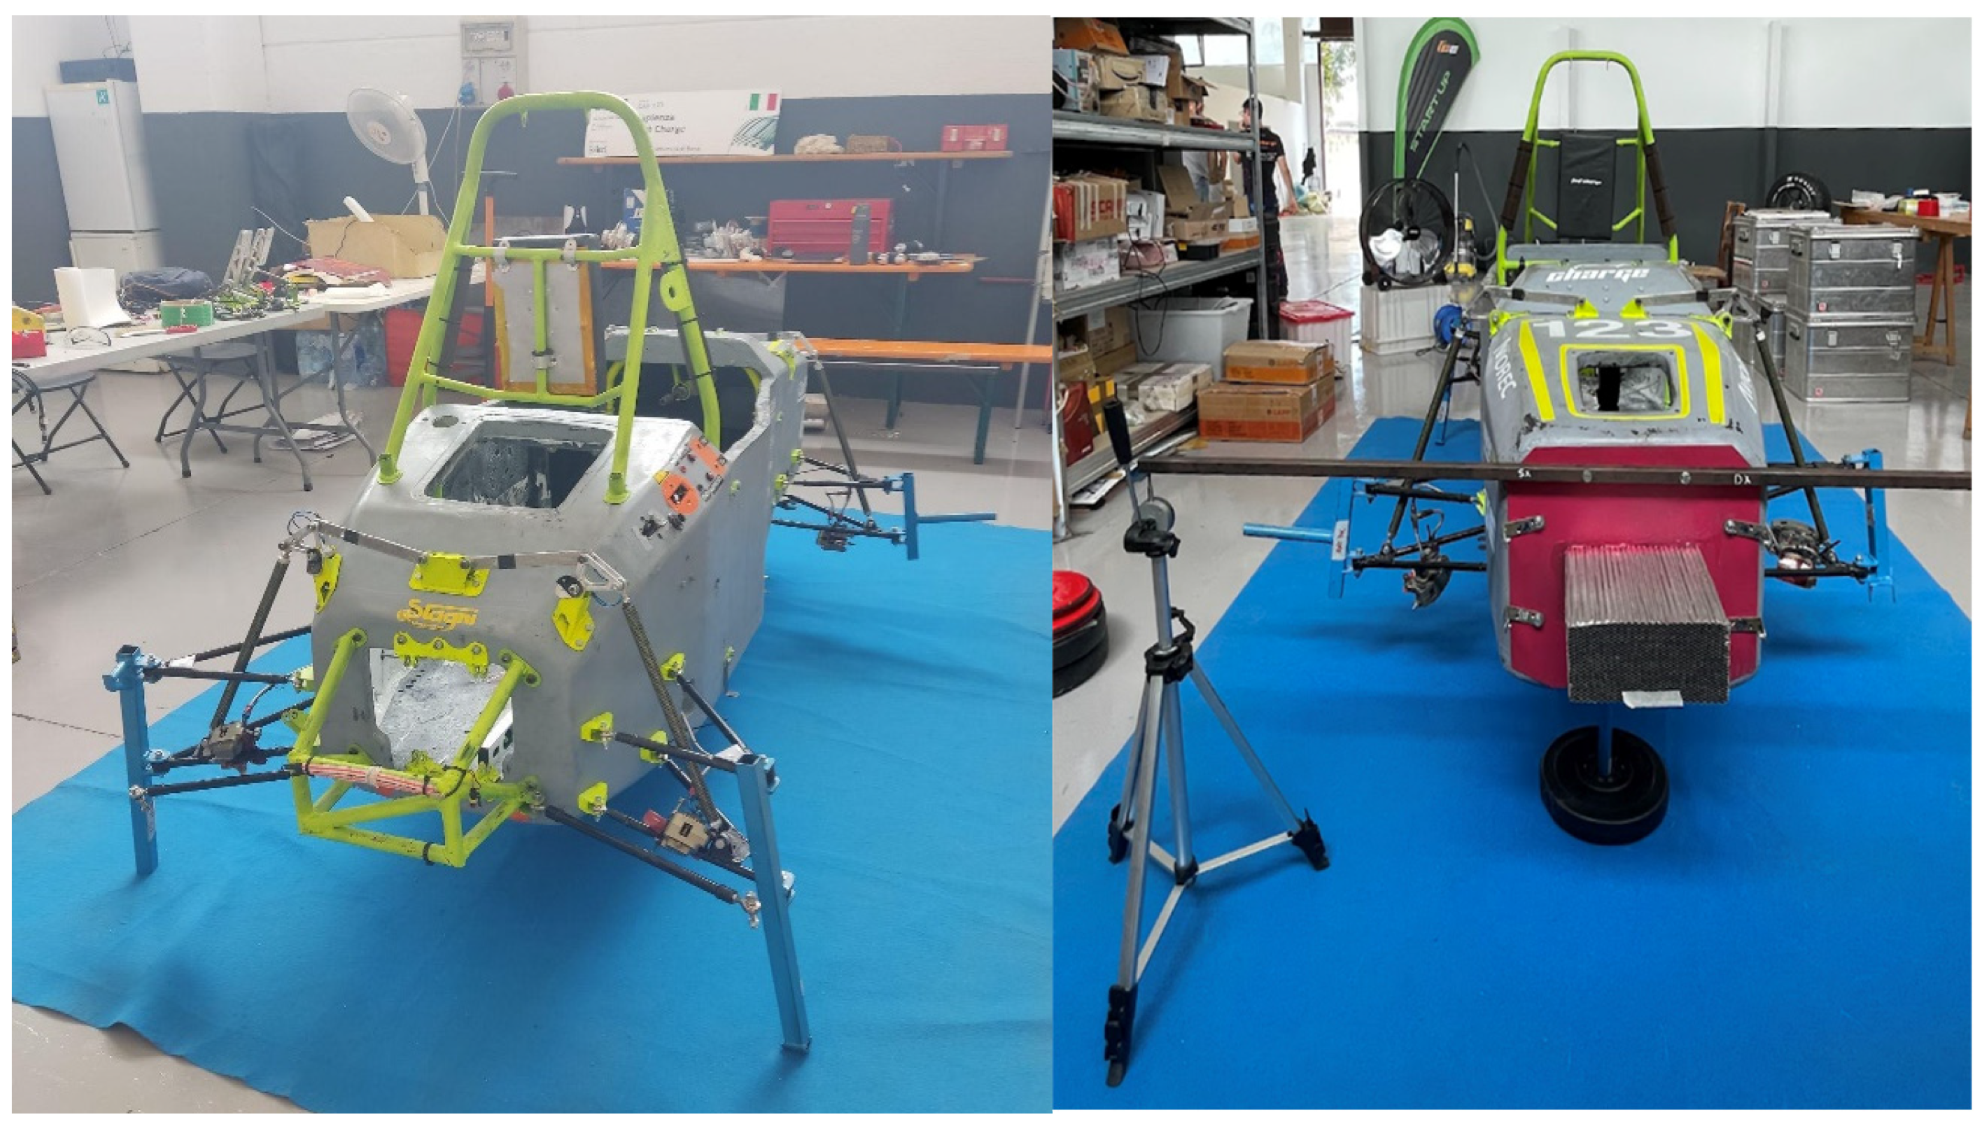
The proposed car design fulfills the Formula Student rules created by the SAE (Society of Automotive Engineers) and FSG (Formula Student Germany). Formula Student is an international championship where university students design and build a single-seater race car: electric, combustion and autonomous driving cars. The rules give the main guidelines to guarantee the safety of drivers. Formula Student competitions are constituted by static engineering events and track tests. The most important track test is the endurance test: a race of 22 km on a very technical track characterized by frequent acceleration, changes in direction and braking. The two cars considered in this paper (see
Figure 1) are from the “Sapienza Fast Charge” team.
The work presented here focuses on the FEM modeling of the two chassis for Formula SAE cars for the 2021 and 2023 seasons and on the experimental verification of the results obtained with FEM analysis. The comparison is particularly interesting because the two chassis use completely different design approaches and manufacturing technologies [
1,
2].
The first chassis, for the 2021 season, was built according to the philosophy of space-frame steel tube chassis, faithfully following the requirements of the SAE regulations in force for the championship. It is therefore a traditional construction, characterized by low material costs, simplicity of construction and ease of maintenance.
The second chassis, for the 2023 season, was the first chassis by the Sapienza Fast Charge team to be made entirely of carbon fiber, following the philosophy of an integral monocoque. The design philosophy was therefore completely different, as were the computing, design and manufacturing technologies. The carbon fiber laminated monocoque technology is certainly a more expensive solution in terms of materials, manufacturing, management and maintenance processes, thus representing a considerable challenge for a university student team. However, it allows for significantly higher mechanical performance in terms of lightness and/or chassis rigidity [
3,
4].
The comparison is particularly interesting given that the two cars, seasons 2021 and 2023, are completely identical in terms of all powertrain and aerodynamic kit components, with the actual differences concentrated exclusively on the two totally different chassis. The improvement in the performance of the entire vehicle will therefore be the result of the different mechanical performances of the two chassis exclusively.
Another aspect to consider is that the two chassis, 2021 and 2023, have approximately the same final weight (considering only the chassis), and therefore the different technology used is expected to give tangible results only in terms of the torsional and longitudinal stiffness of the overall chassis, a parameter that provides a great advantage to the entire suspension system responsible for managing the vehicle’s dynamics.
The work proposed here therefore has several objectives. The first is to create two effective FEM models capable of providing valid information during the design phase for two different technologies for constructing a Formula SAE-type chassis. The second is to directly compare a space-frame-type steel tube chassis and a chassis with virtually identical geometric and mechanical characteristics, but constructed as a carbon fiber monocoque.
The results obtained are in line with expectations and represent a useful benchmark for similar motorsport applications.
2. Vehicle Description
The 2021 rolling chassis is an S235JR steel tube space-frame structure with A-arms and push rod suspensions; hubs and uprights are made from Ergal aluminum alloy, with 13” wheels with magnesium alloy rims and Pirelli slick tires. The total vehicle weighs 256 kg without the driver payload, the battery pack alone weighs 56 kg, and the motor and inverter weigh 20 kg. The overall weight distribution is 50:50 considering a 75 kg driver and the aerodynamic kit made of a rear wing and undertray with diffusers.
The 2023 chassis is a complete carbon fiber monocoque sandwich made of different types of carbon fiber and a honeycomb core (aramid or aluminum) depending on the considered section. The rollover protection is given by two roll hoops made of S235JR steel tubes. The push rod suspension system is composed of A-arms attached to the monocoque with steel plate supports. The hubs and upright are made of Ergal aluminum alloy with a single nut and 10” wheels with magnesium alloy rims and Hoosier slick tires. The complete vehicle weighs 252 kg without the driver on board, with the same components featured in the 2021 car.
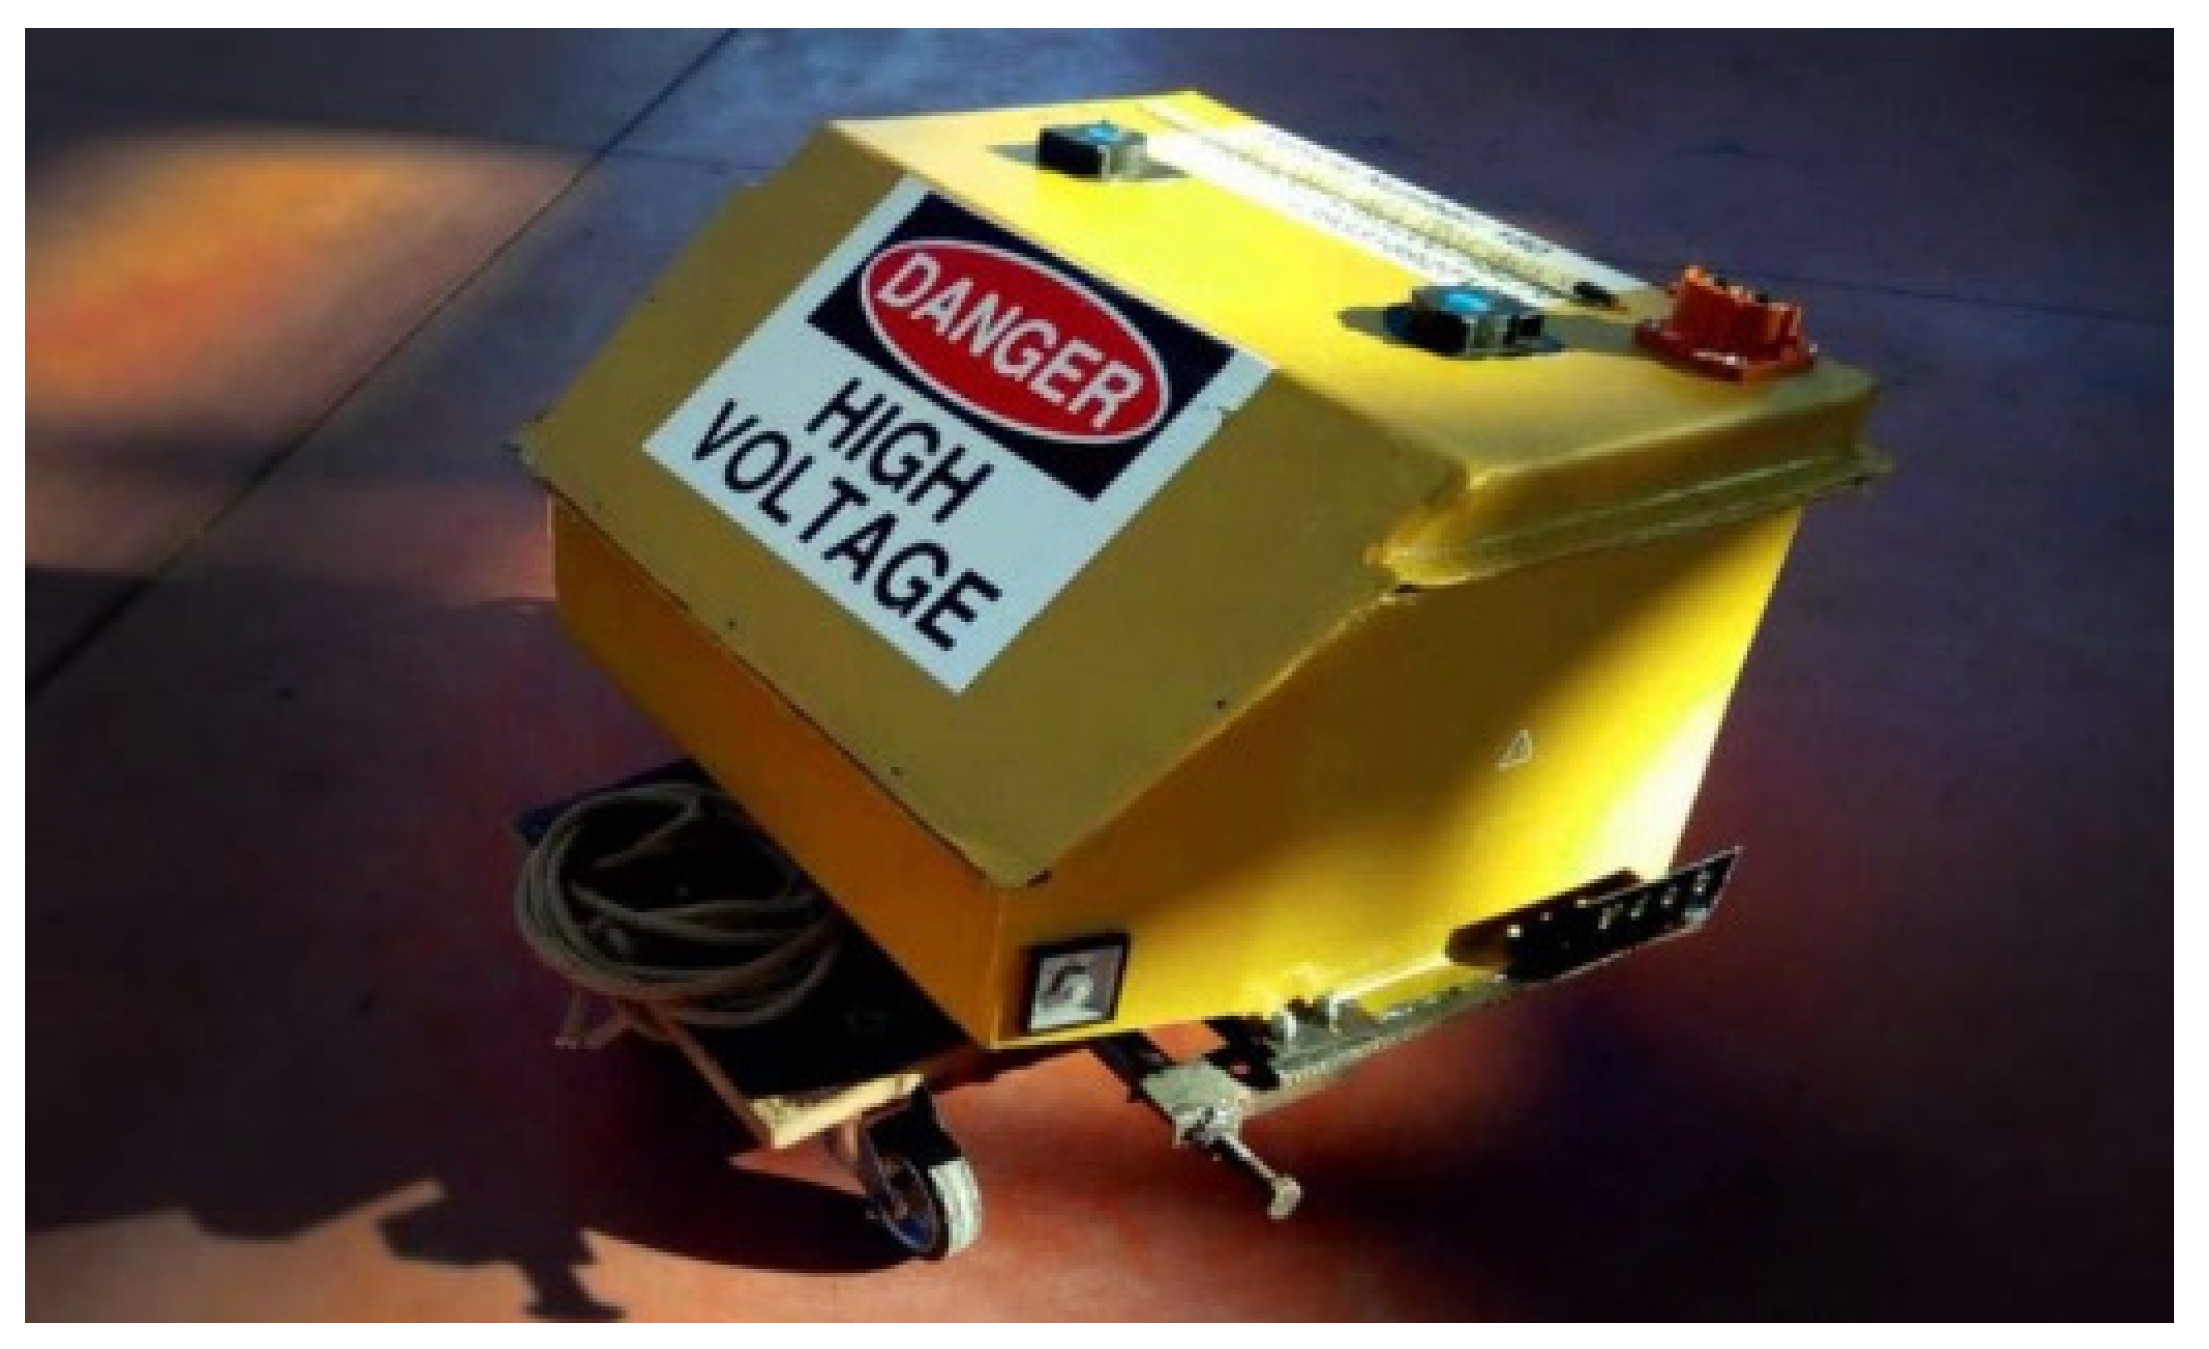
The cars are equipped with an 8.2 kWh energy storage (see
Figure 2) in a 108s7p configuration using Li-ion cylindrical cells, with a 450 V maximum voltage. The energy storage container is built from carbon and Kevlar fibers to enhance the power-to-weight ratio and guarantee excellent electric insulation, flame resistance and mechanical properties. Electronics and safety systems are partially commercial and partially the team’s design: the Vehicle Control Unit, specific for automotive applications, is programmable with MATLAB-Simulink (Matlab2024), and the Battery Management System (BMS) is commercial but with firmware modified by the team. The BMS allows us to monitor and log the temperatures and voltage of each cell in parallel.
The full electric powertrain is made up of a permanent magnet axial flux motor that delivers 100 kW and 240 Nm; it is connected to the wheels with a chain transmission with an 11/45 pinion/crown ratio and an adjustable Limited Slip Differential. The electric drive is managed by a 450 V electronic inverter with canbus line communication and a Vehicle Control Unit and data logging system. As already explained, the main objective of this case study is to simulate the torsional stiffness of the chassis and validate it with a test.
2.1. Description of 2021 Chassis
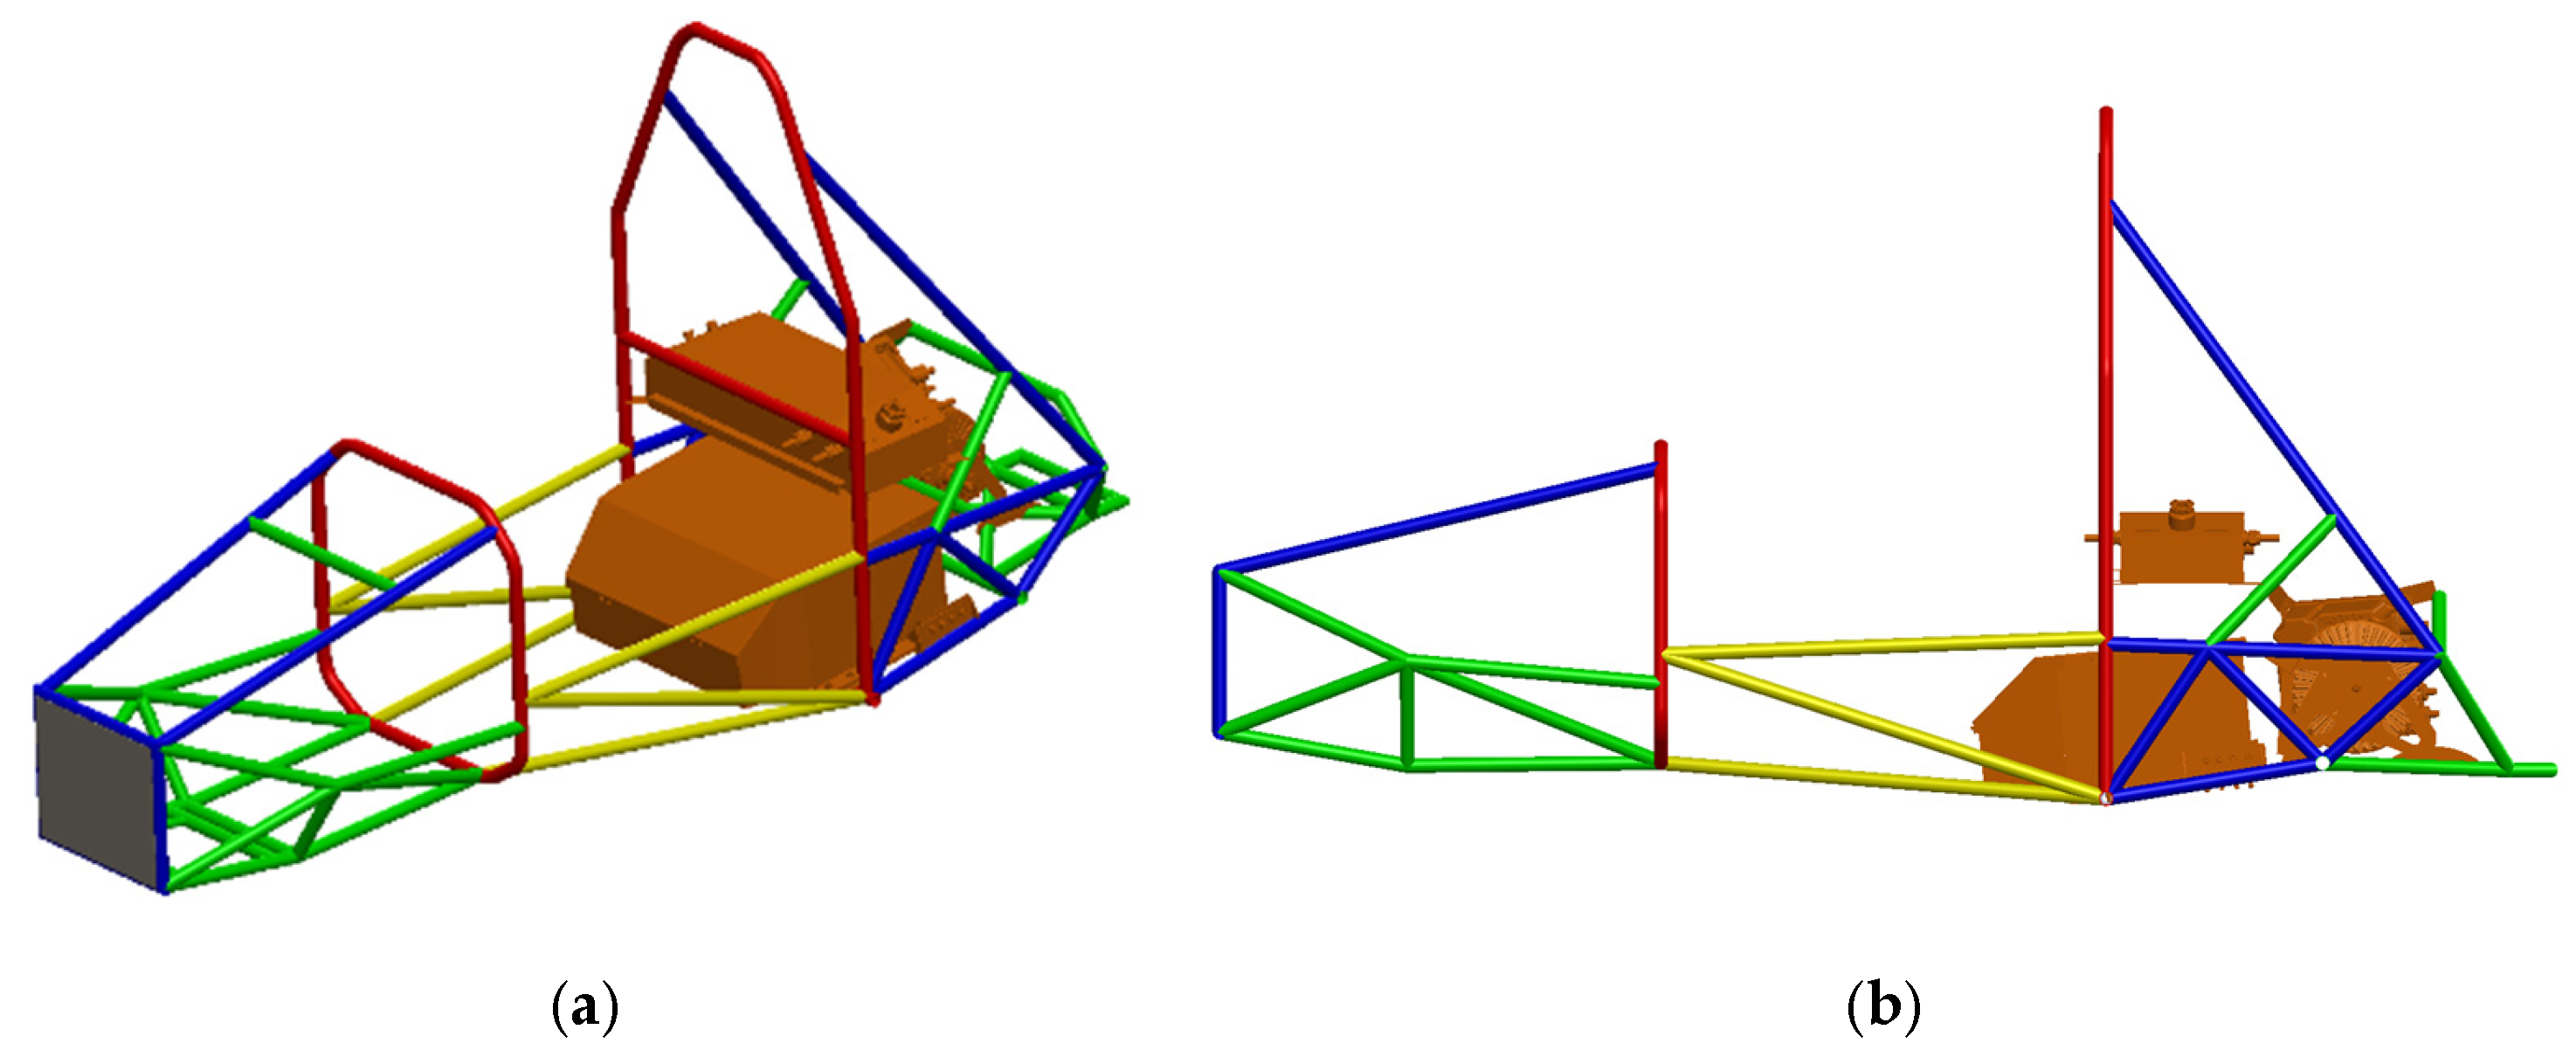
The 2021 frame is made up of S235JR carbon alloy tubes of various thicknesses according to the rules’ requirements and the loads imposed on the frame. The tubes that make up the frame are shown in
Table 1 with a color reference in
Figure 3a,b. Suspension attachments are realized with 2mm steel plates welded directly to the chassis. The entire welding process is carried out using MAG (Metal Active Gas) arc welding with an Ar/CO
2 mixture.
2.2. Description of 2023 Chassis
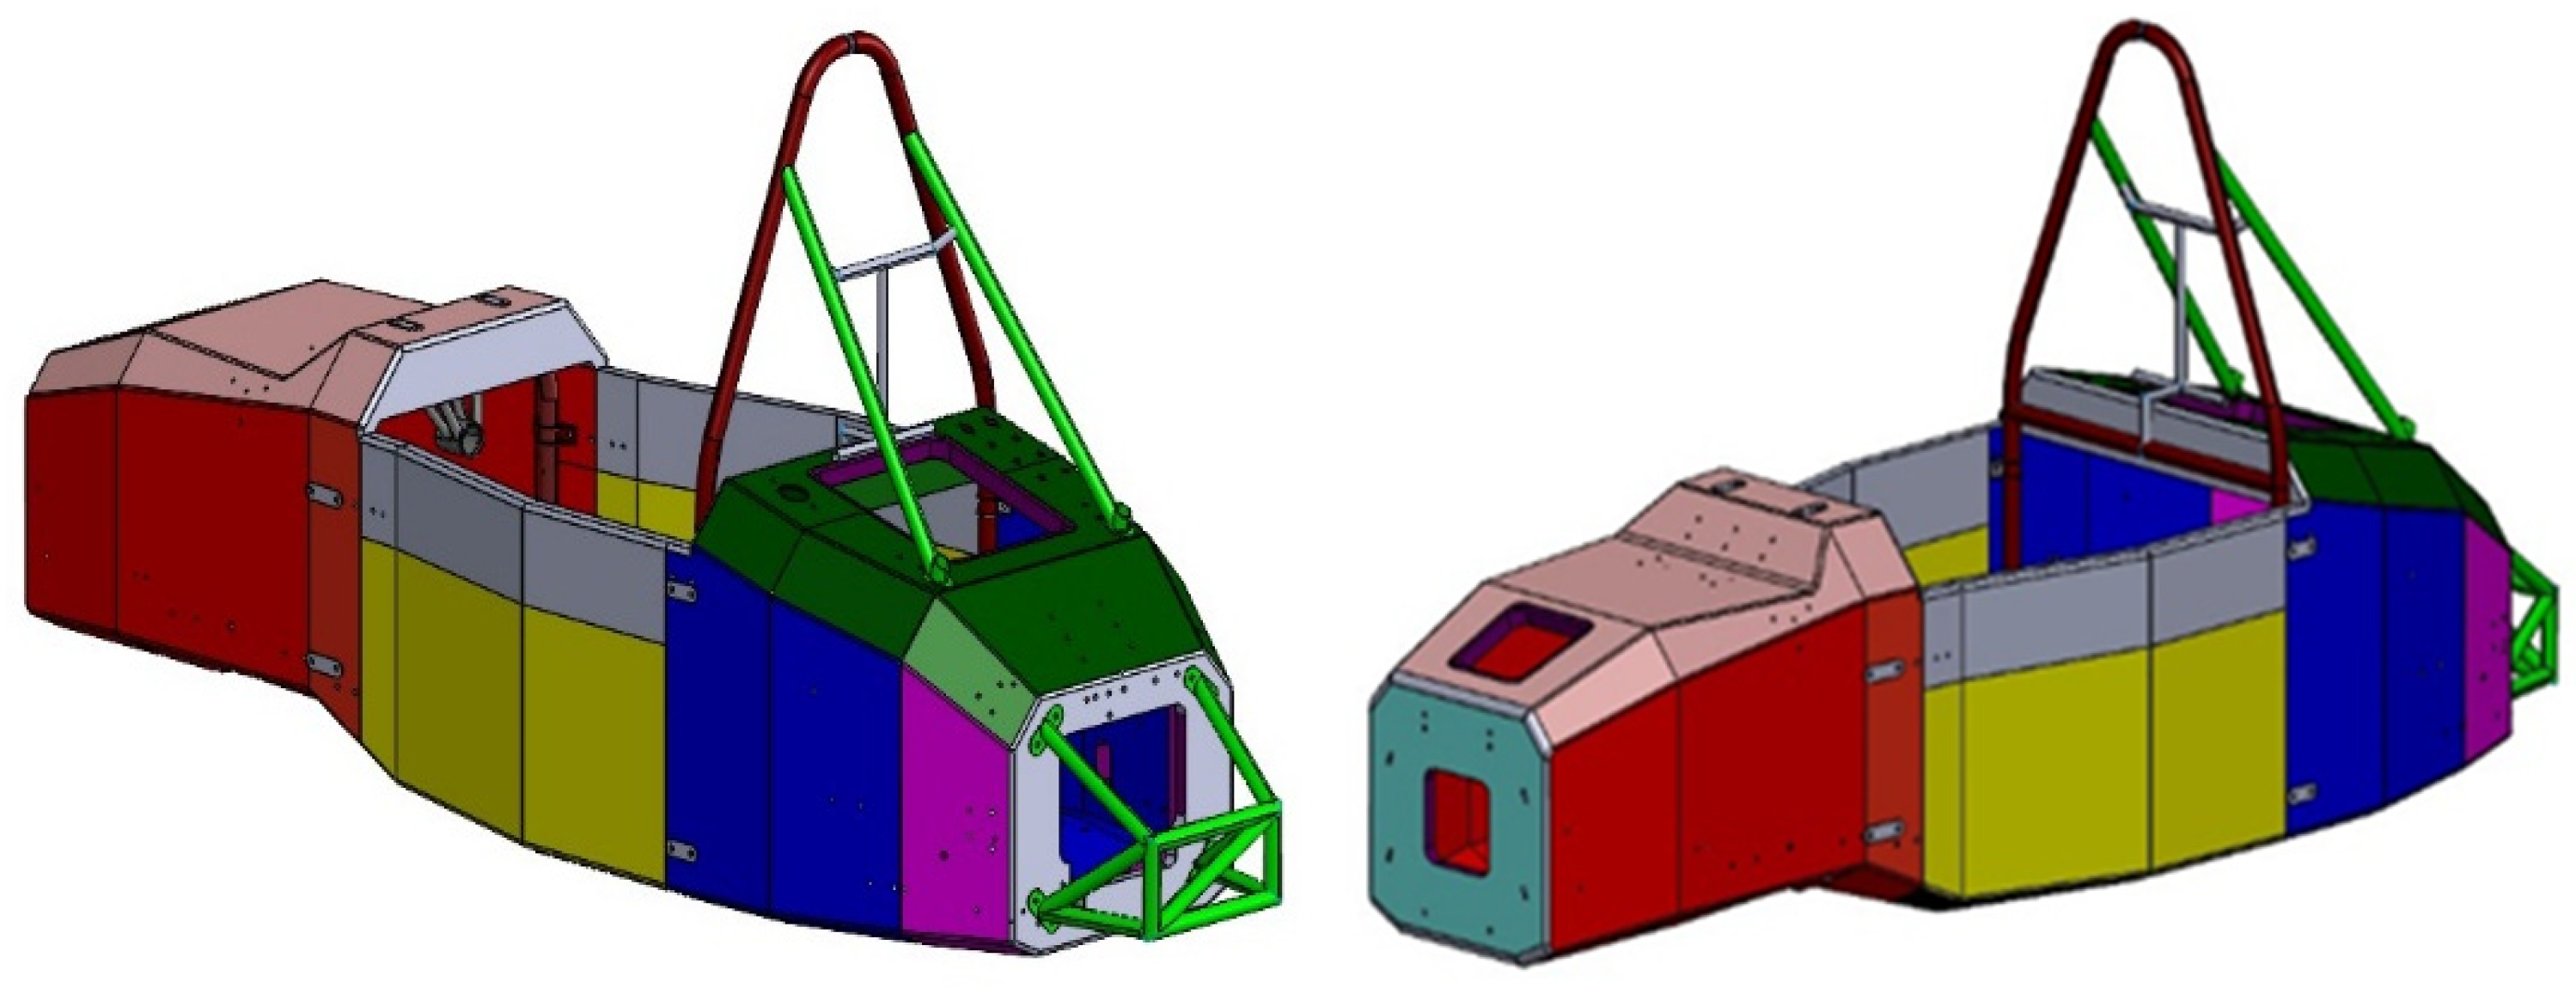
The 2023 chassis (
Figure 4) is made with a sandwich laminate of carbon skins and a honeycomb core. The layup was designed according to the rules and the stresses imposed by various elements of the car such as the suspension, battery pack, differential, motor and safety roll bars (roll hoop). The materials used are reported in
Table 2 and
Table 3.
2.3. Suspension Description
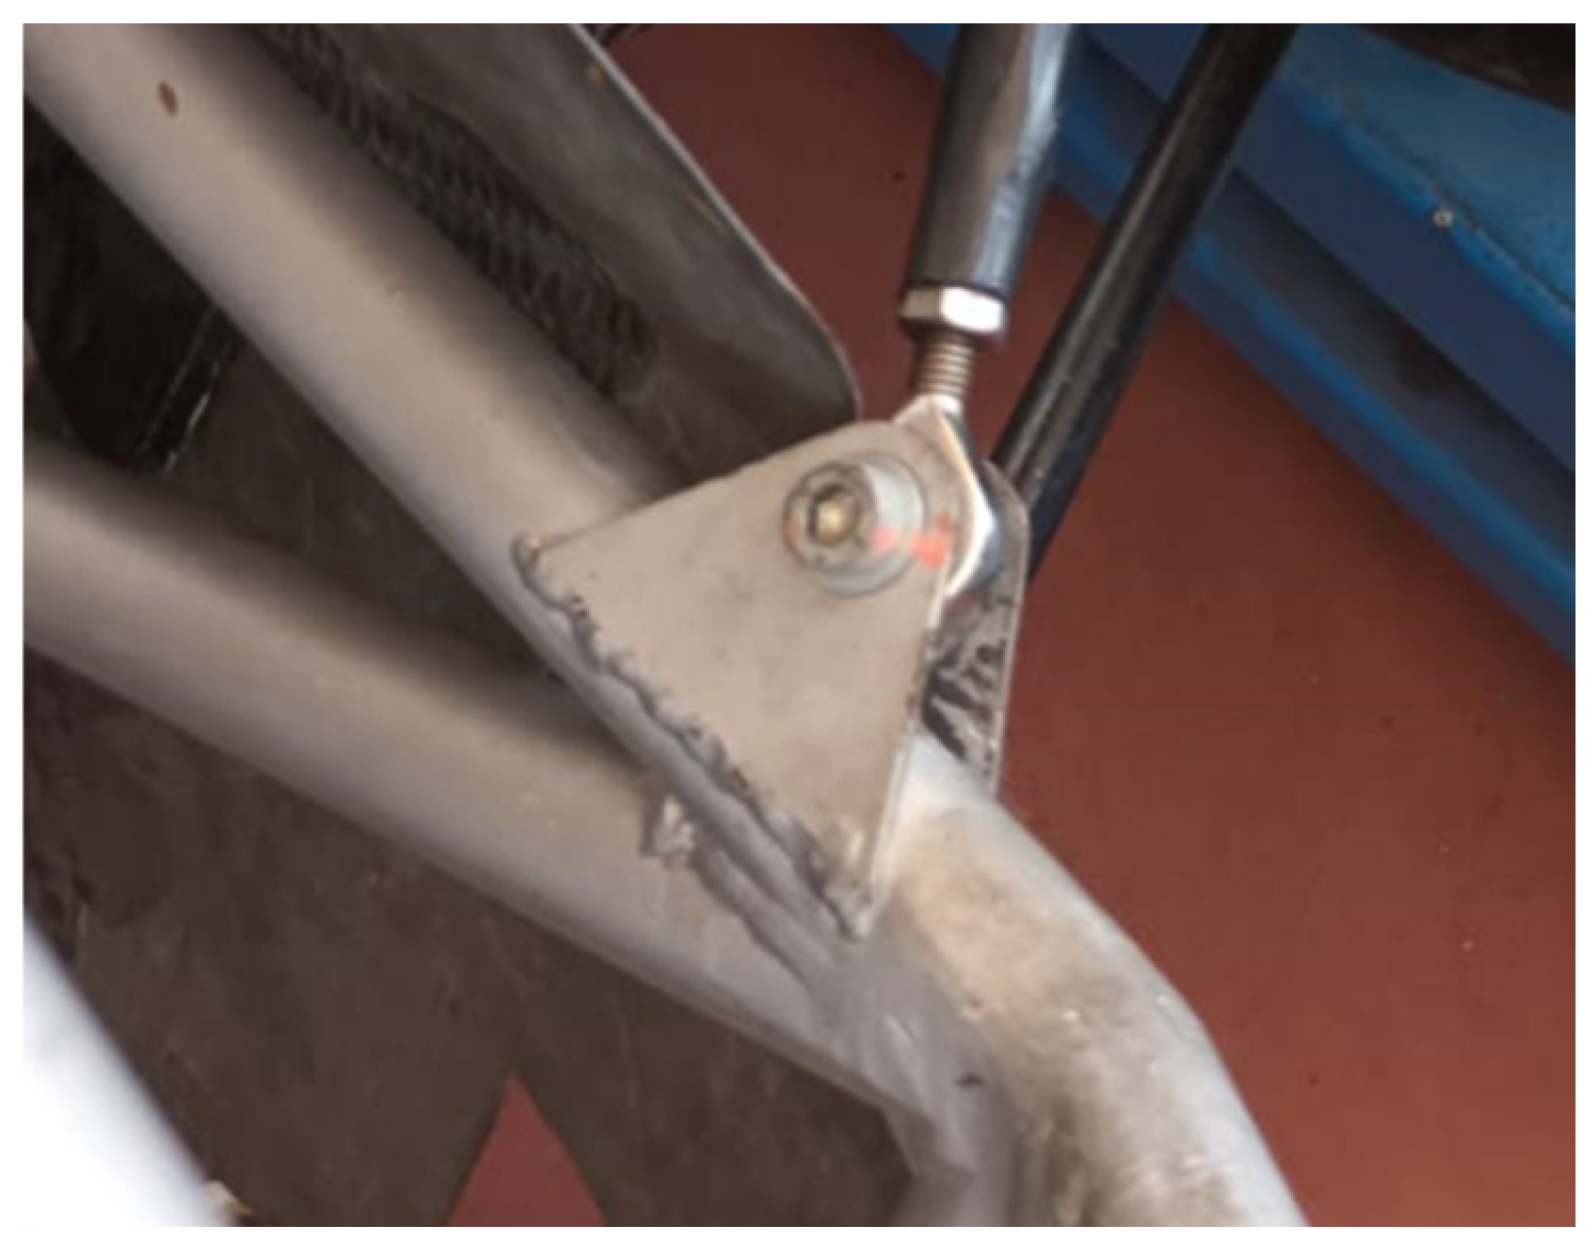
For both cars, the suspension system includes double wishbones in a push rod configuration. The arms are made with steel tubes welded with a continuous wire MAG welding process. The suspension system includes Öhlins TTX25 shock absorbers, specifically adapted for this category of cars, with the possibility of adjusting pre-load and hydraulics in compression and rebound (high and low speed). The 2021 car is equipped with front and rear anti-roll bars with adjustable stiffness. The bars are made of harmonic steel bars that work with milled Ergal knives that can be adjusted in 3 positions (obtaining 3 different stiffness values for the front and 3 for the rear). These components are not present in the 2023 car so they will not be considered in the calculations leading to the final stiffness test. The 2021 car wheel assemblies consist of Ergal hubs and uprights and 13” aluminum alloy rims. The rims are connected to the hub by 4 bolts. To connect the suspension arms to the frame, 2mm steel supports were used, welded to the tube frame (see
Figure 5), accurately triangulated to ensure optimal load distribution on the frame tubes. In this way it is possible to consider the suspension supports as perfectly non-deformable.
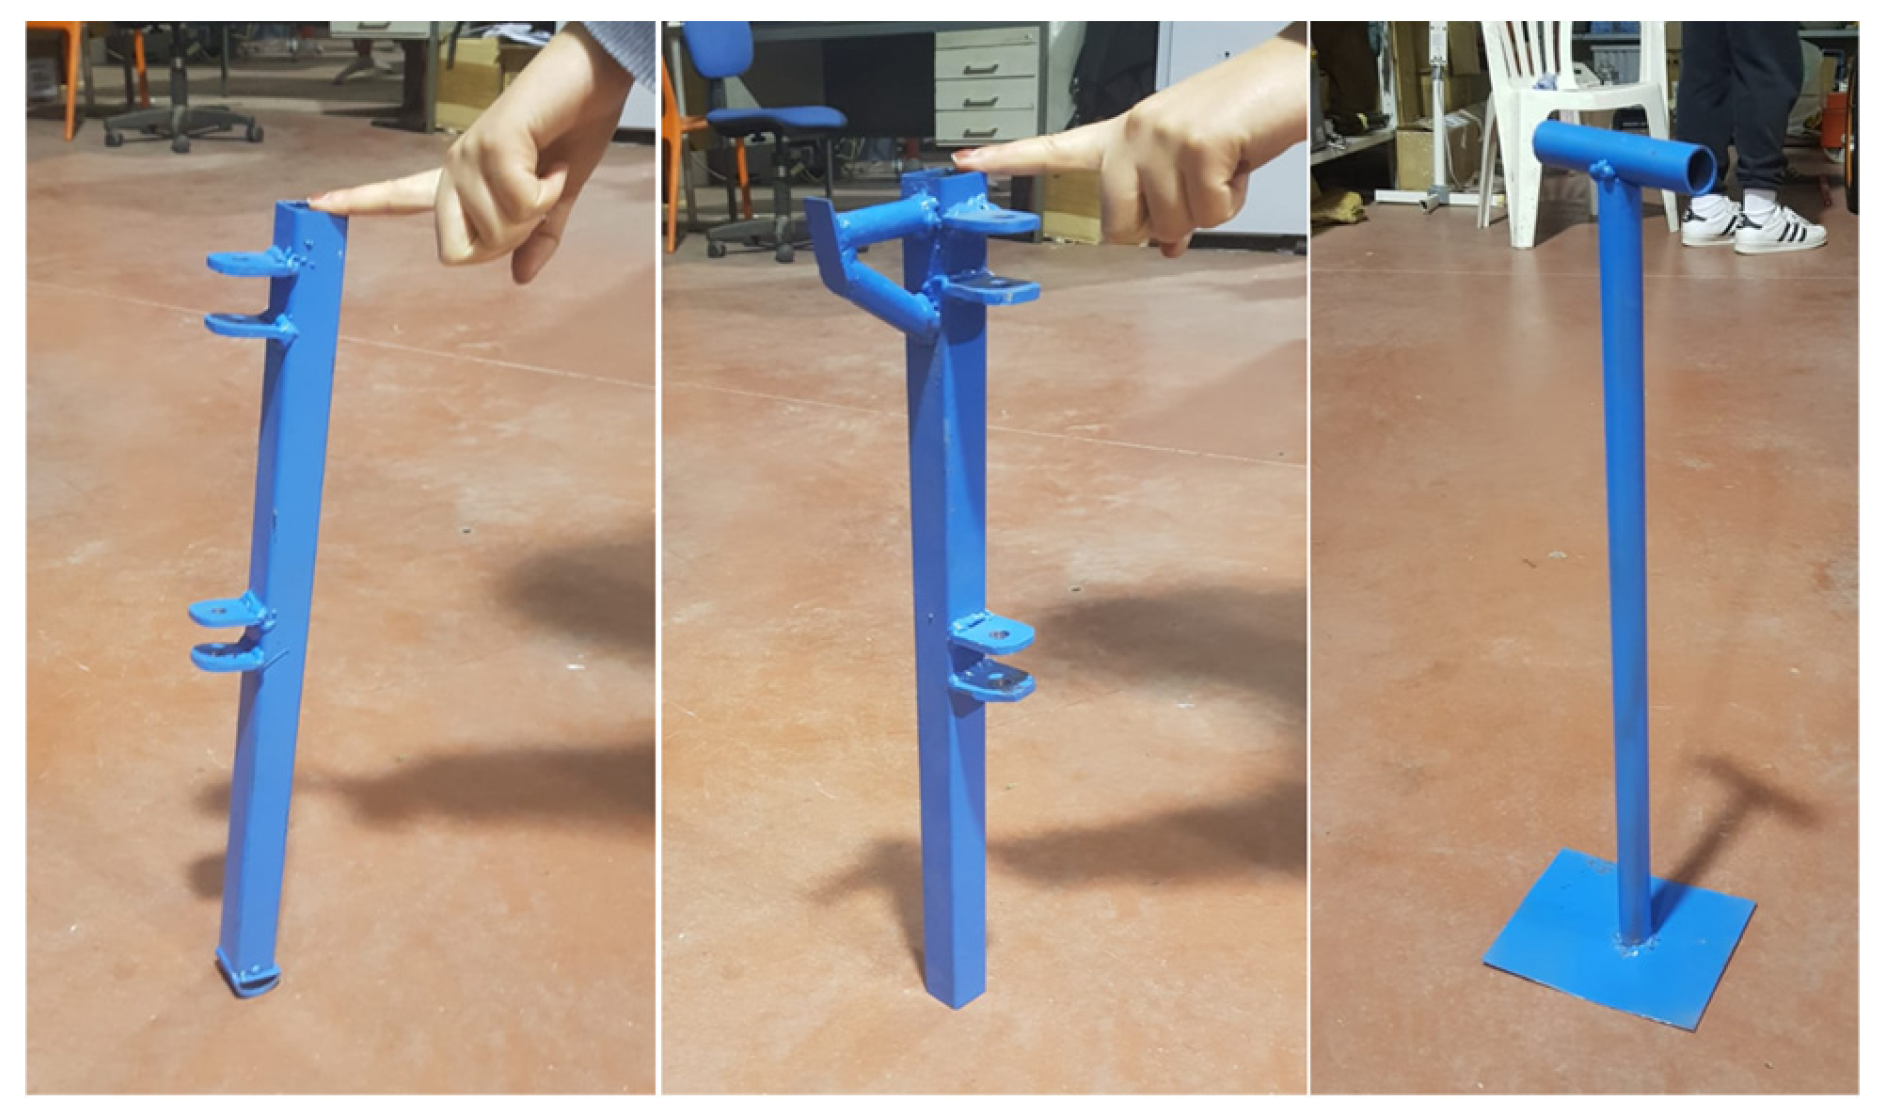
The 2023 car is characterized by a wheel assembly consisting of an Ergal hub and uprights and 10” magnesium alloy rims. The rims are connected to the hub via a single nut. To connect the suspension system to the frame, special steel supports were created to be bolted to the monocoque. An example of the support is shown in
Figure 6.
3. The 2021 and 2023 Chassis Simulation
In this analysis, only the structural elements of the frame were considered. Components that, although structurally important and contributing to the overall torsional rigidity of the vehicle assembly, were not considered.
3.1. The 2021 Chassis Simulation
To perform simulations and measurements of frame stiffness, the system is schematized by rigidly constraining the rear wheels and applying torque to the front wheels, considering that the forces applied to the frame are those resulting from wheel–asphalt interaction [
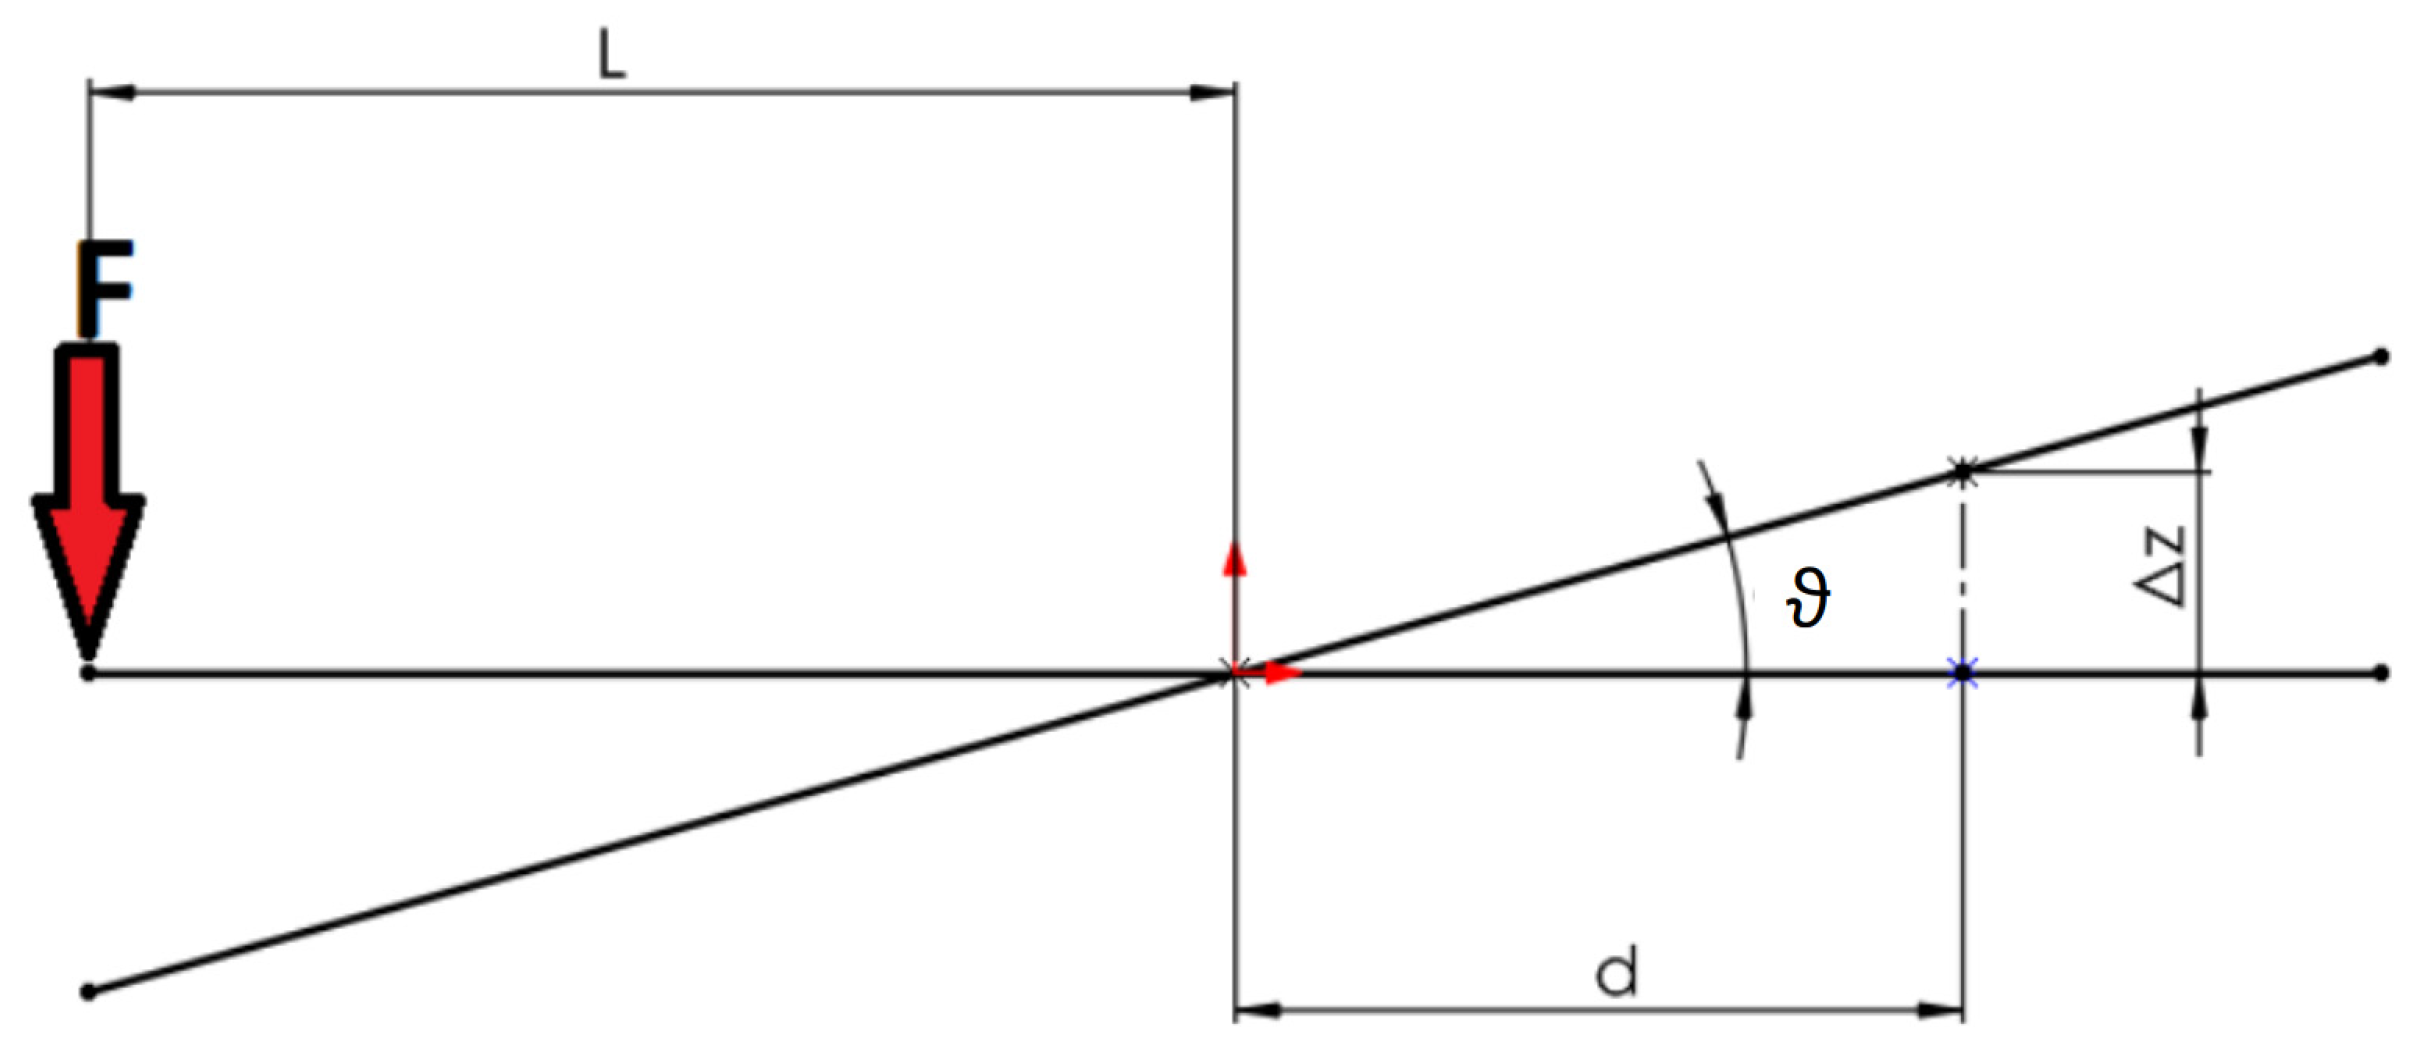
5]. For the analysis, a fulcrum is applied on which the frame rests to characterize the point of rotation of the front section, where the displacement is measured. To measure torsional stiffness, knowing the force F applied to the wheel hub at a distance L from the frame’s torsion axis, a measuring instrument is positioned at a distance d from the torsion axis to measure the vertical deformation Δz, as shown in
Figure 7 below. The displacement Δz is measured at a distance d from the axis of rotation; point d represents a point on the chassis that can be easily measured with a linear comparator in both the simulation and the experimental setup, thus preventing the deformation of the suspension arms from influencing the result [
6].
In this way, the angle ϑ and the resulting torsional stiffness J can be calculated.
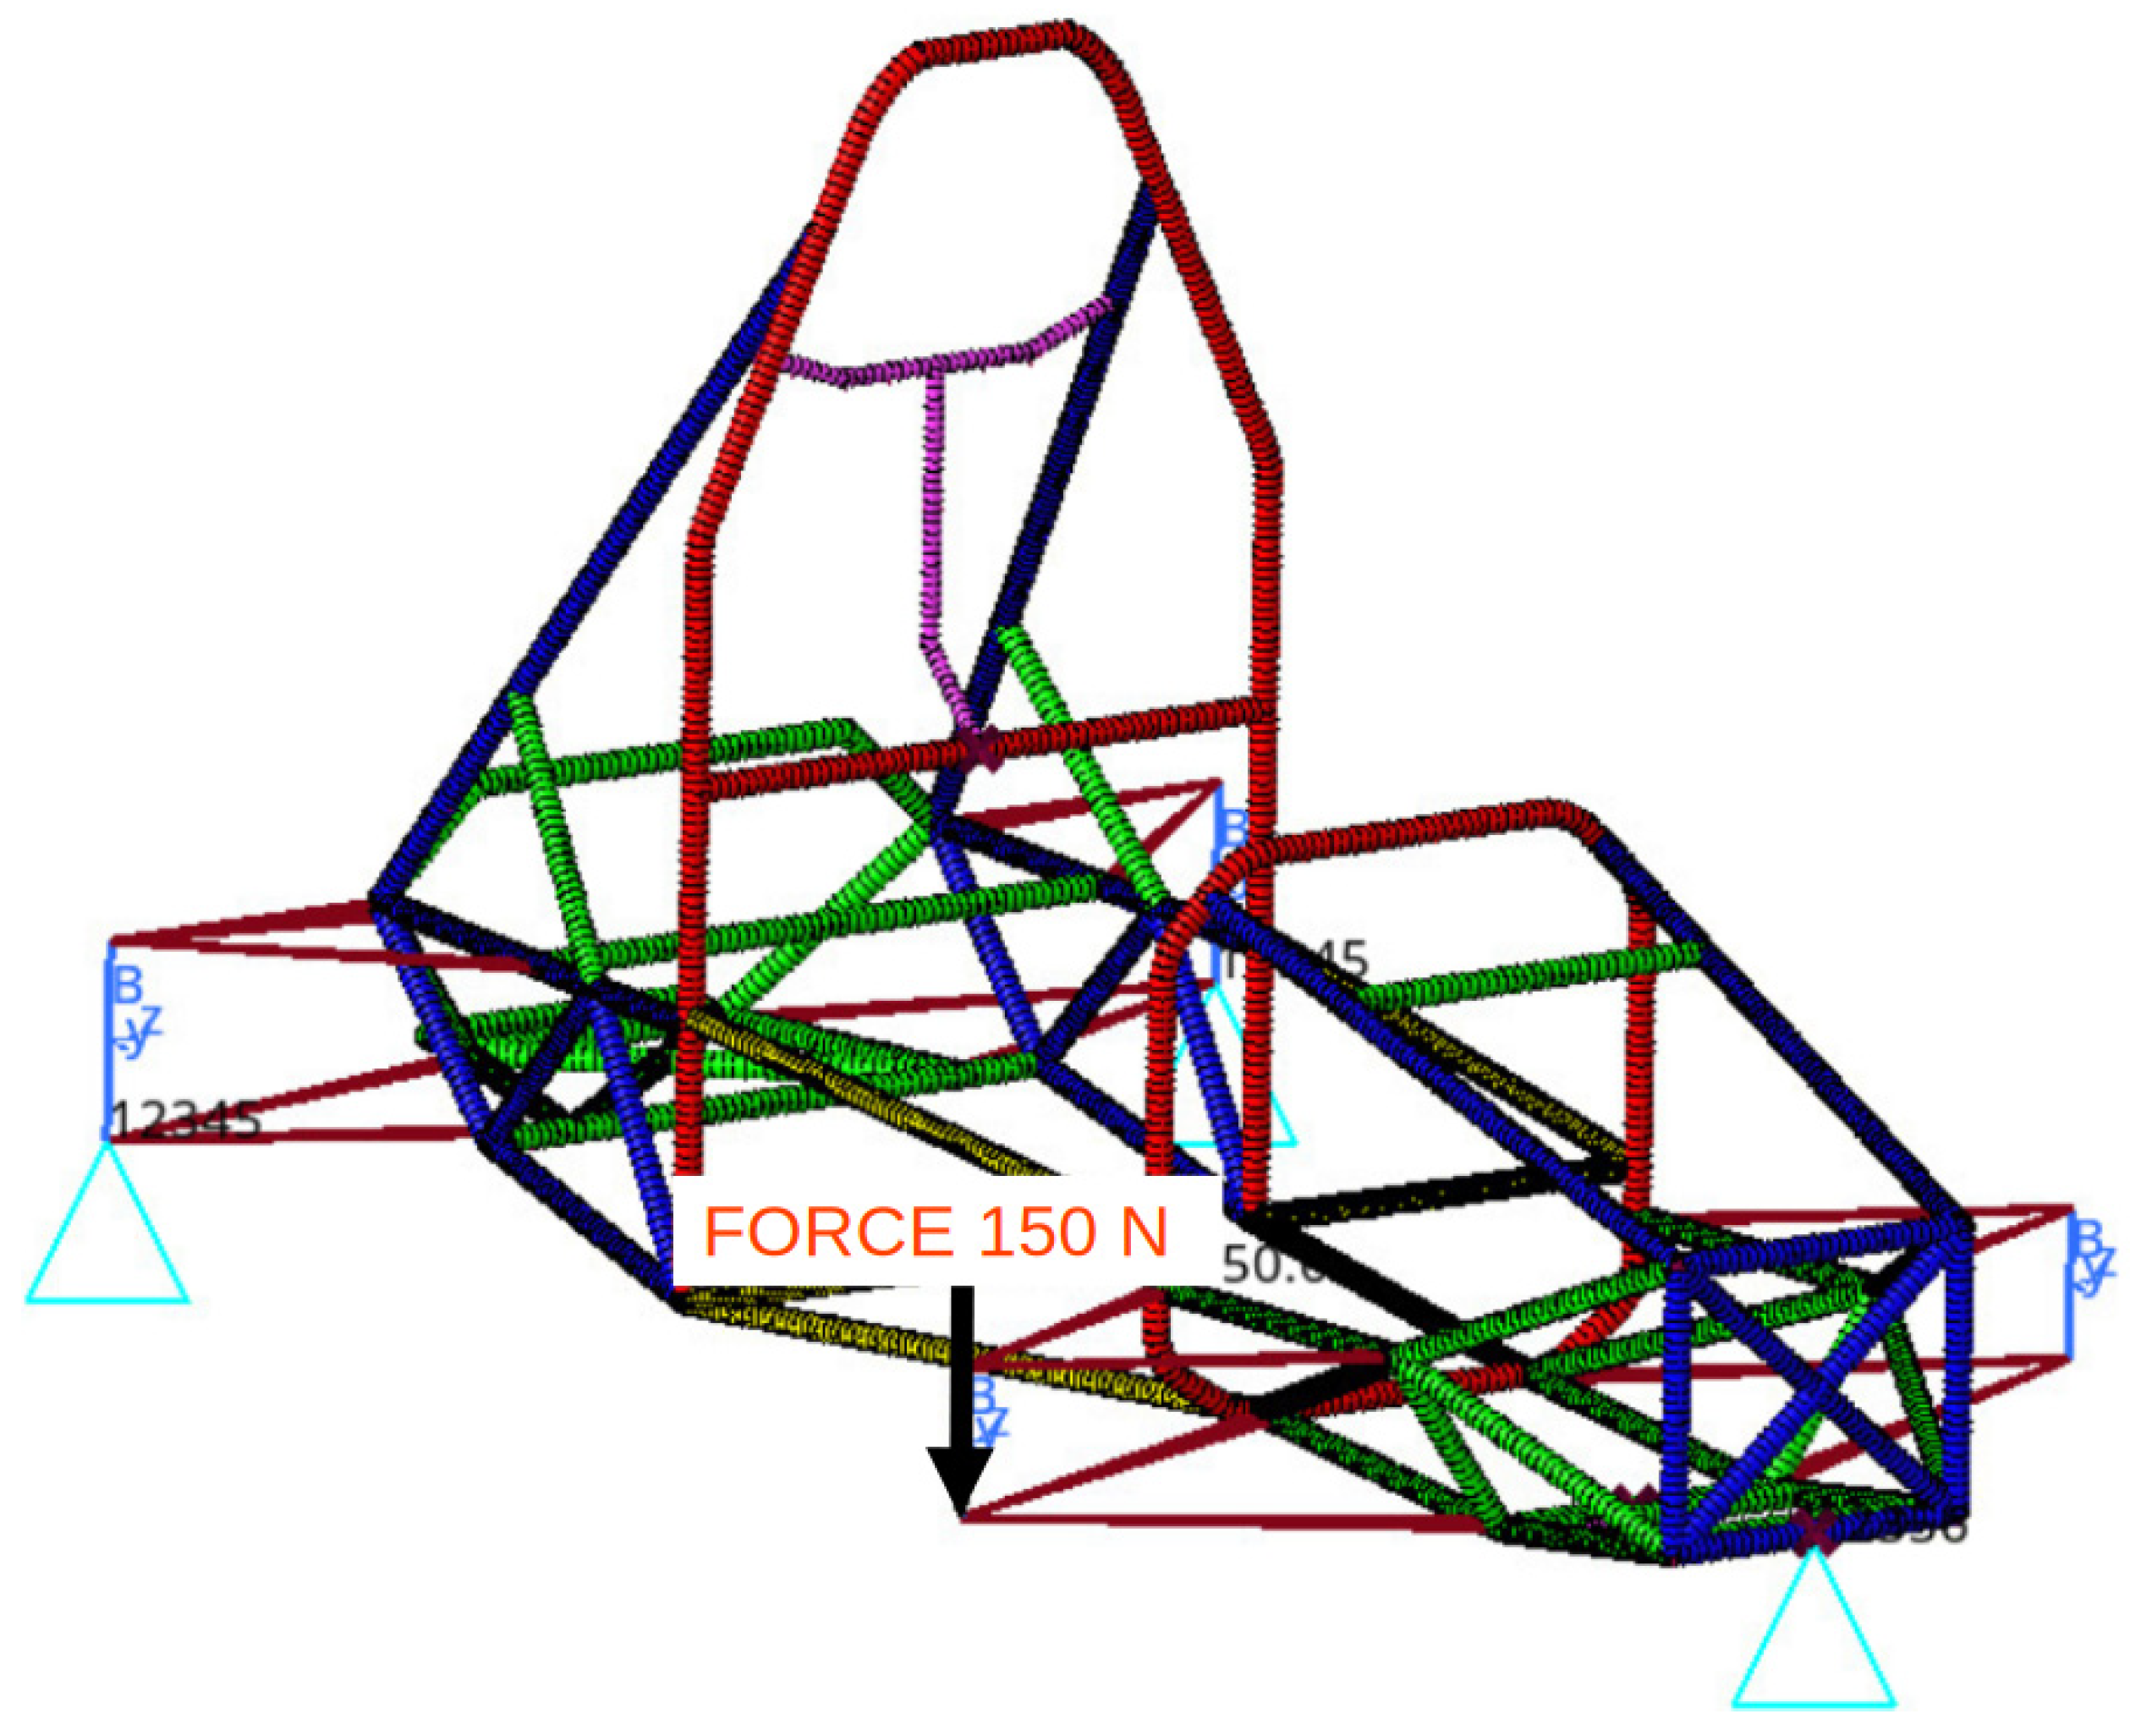
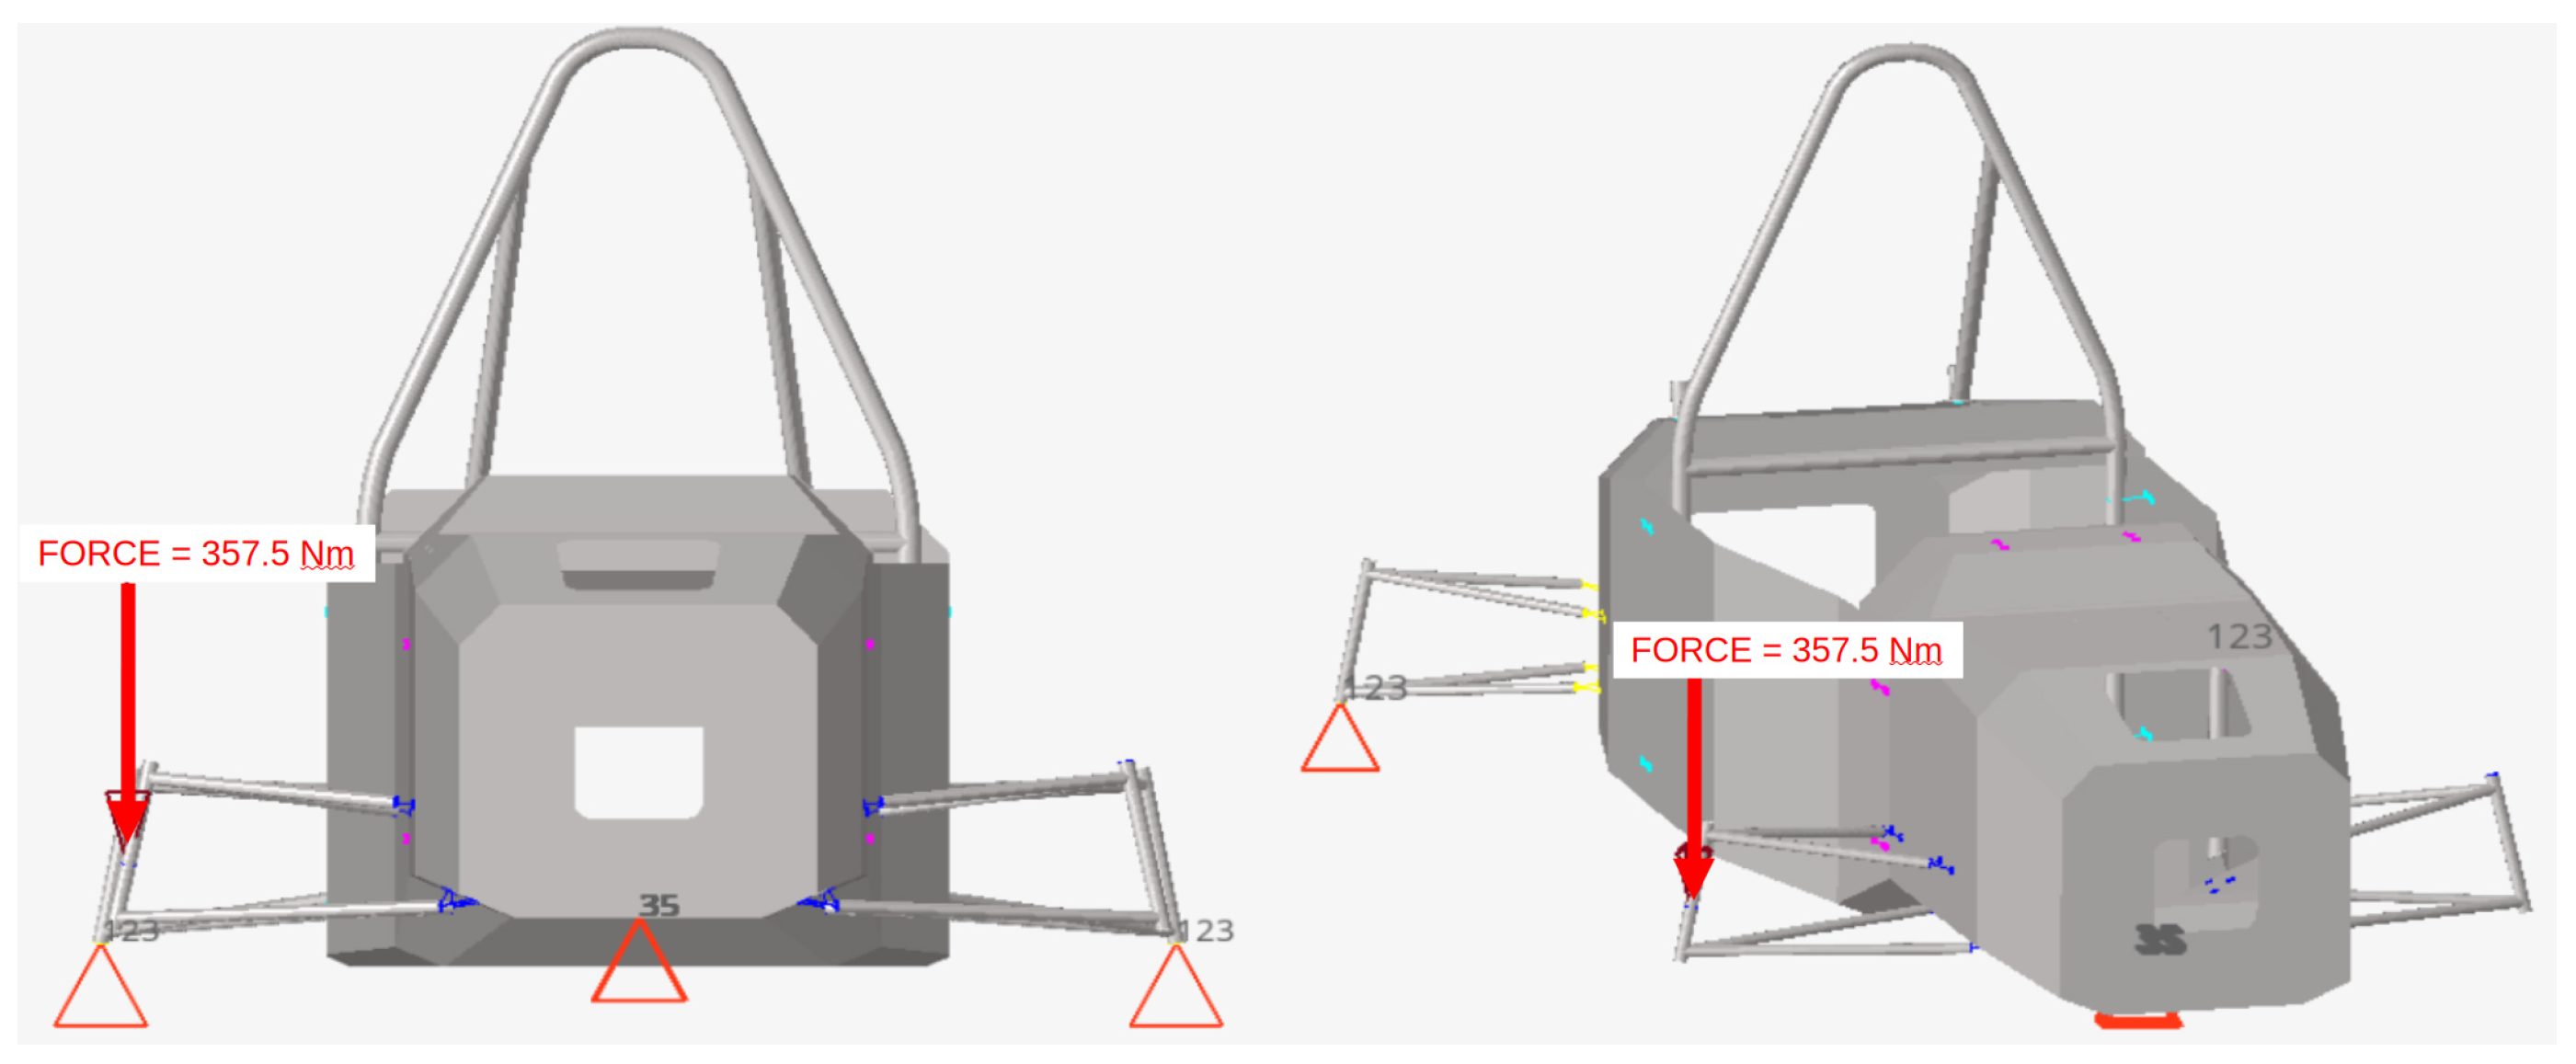
To set up the simulation numerically, the forces exchanged between the suspension and the chassis during the car’s operating conditions were taken into account. The suspensions are equipped with linear potentiometers to measure the linear displacement of the shock absorber rod. The springs used are 250 pounds/inch, so it was decided to apply a downward vertical force of approximately 150 N, in line with the actual forces. The simulation configuration applied is shown in
Figure 8. A linear static simulation was used, appropriate to the experimental configuration used. The suspension arms are considered indefinitely rigid.
The results of the simulations are shown in
Table 4; an average torsional stiffness J of 946.9 Nm for the 2021 frame has been calculated.
3.2. The 2023 Chassis Simulation
For the 2023 monocoque, as for the 2021 space frame, only the structural elements of the chassis were considered. The simulation mesh is optimized by diversifying the areas of laminates (2D mesh) and the tubular structure such as roll hoops and arms (3D mesh) with denser mesh in the points of interest [
7,
8]. A dedicated function was used for composites to define a laminate by the zone approach, in which each zone is defined independently from the others, but skins belonging to the same layer can be put in communication. For each area, the previous stratification is used through tests carried out on damaged structures.
The simplifications adopted consist of considering the suspension arms indefinitely rigid, in addition to the points of force application, as in the 2021 simulation model. Once the mesh was defined, constraints and loads were applied. To facilitate the experimental test, the lateral translational motions of the end part of the hub carrier were constrained. In addition, since a front support for the monocoque is provided in the experimental test as a pivot point, vertical translations and rotation along the transverse and vertical axes in the lower and front areas of the frame are constrained [
9,
10].
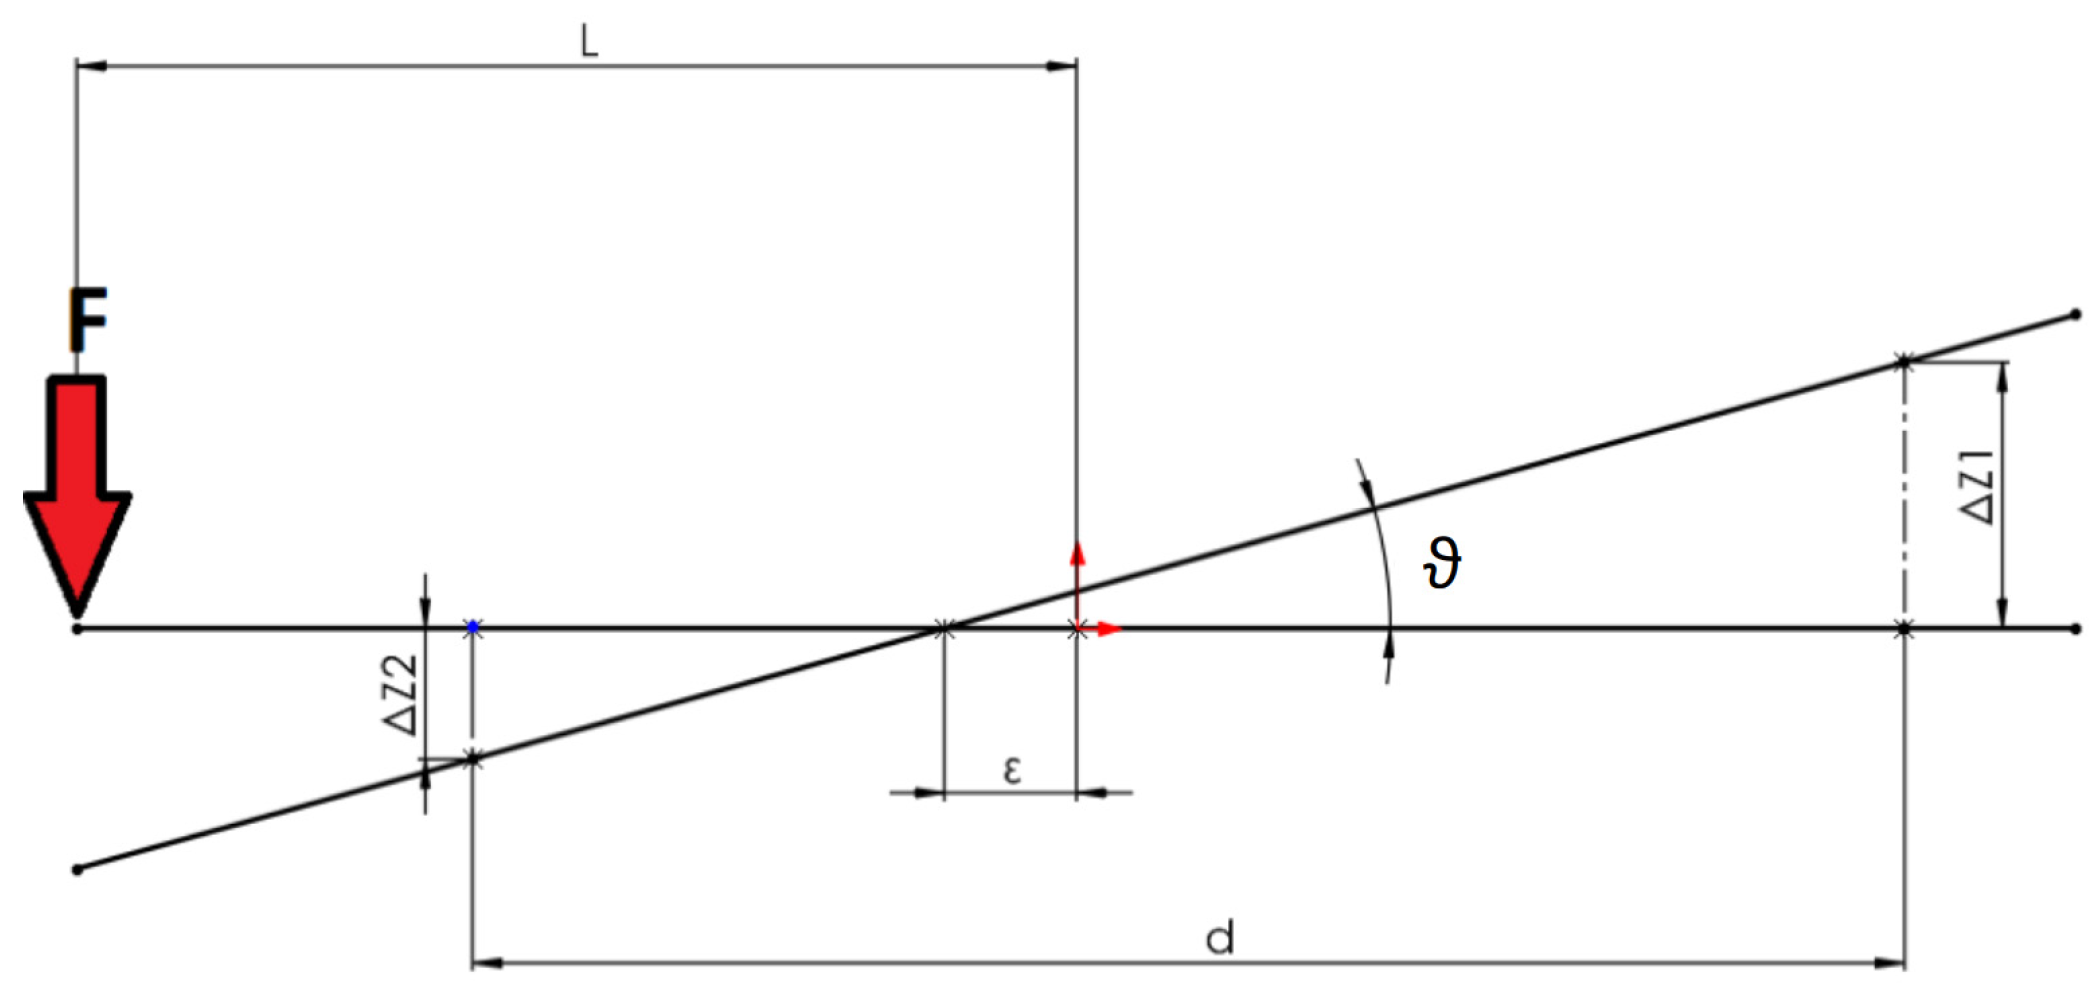
To replicate the deformation case of the experimental test, a downward-directed vertical load F is applied at the right front hub carrier. Based on the applied force and knowing the distance L of the force application point (where the front hub carrier is placed) from the centerline of the vehicle, the torque applied to the monocoque can be derived. A further refinement was made with respect to the 2021 model: the non-coincidence of the axis of rotation with the centerline of the frame, which deviates by a certain ε, is considered. To determine the torsion angle ϑ
ant of a section, it is necessary to evaluate the displacement of two points of the frame, Δz1 and Δz2, at the same height and diametrically opposite at distance d. The scheme used for the calculation is shown in
Figure 9.
To derive a curve of torsional displacement, simulations are performed with a gradually increased load. The previously described simulation setup is shown in
Figure 10. A static linear simulation, appropriate for our experimental setup, was used [
11].
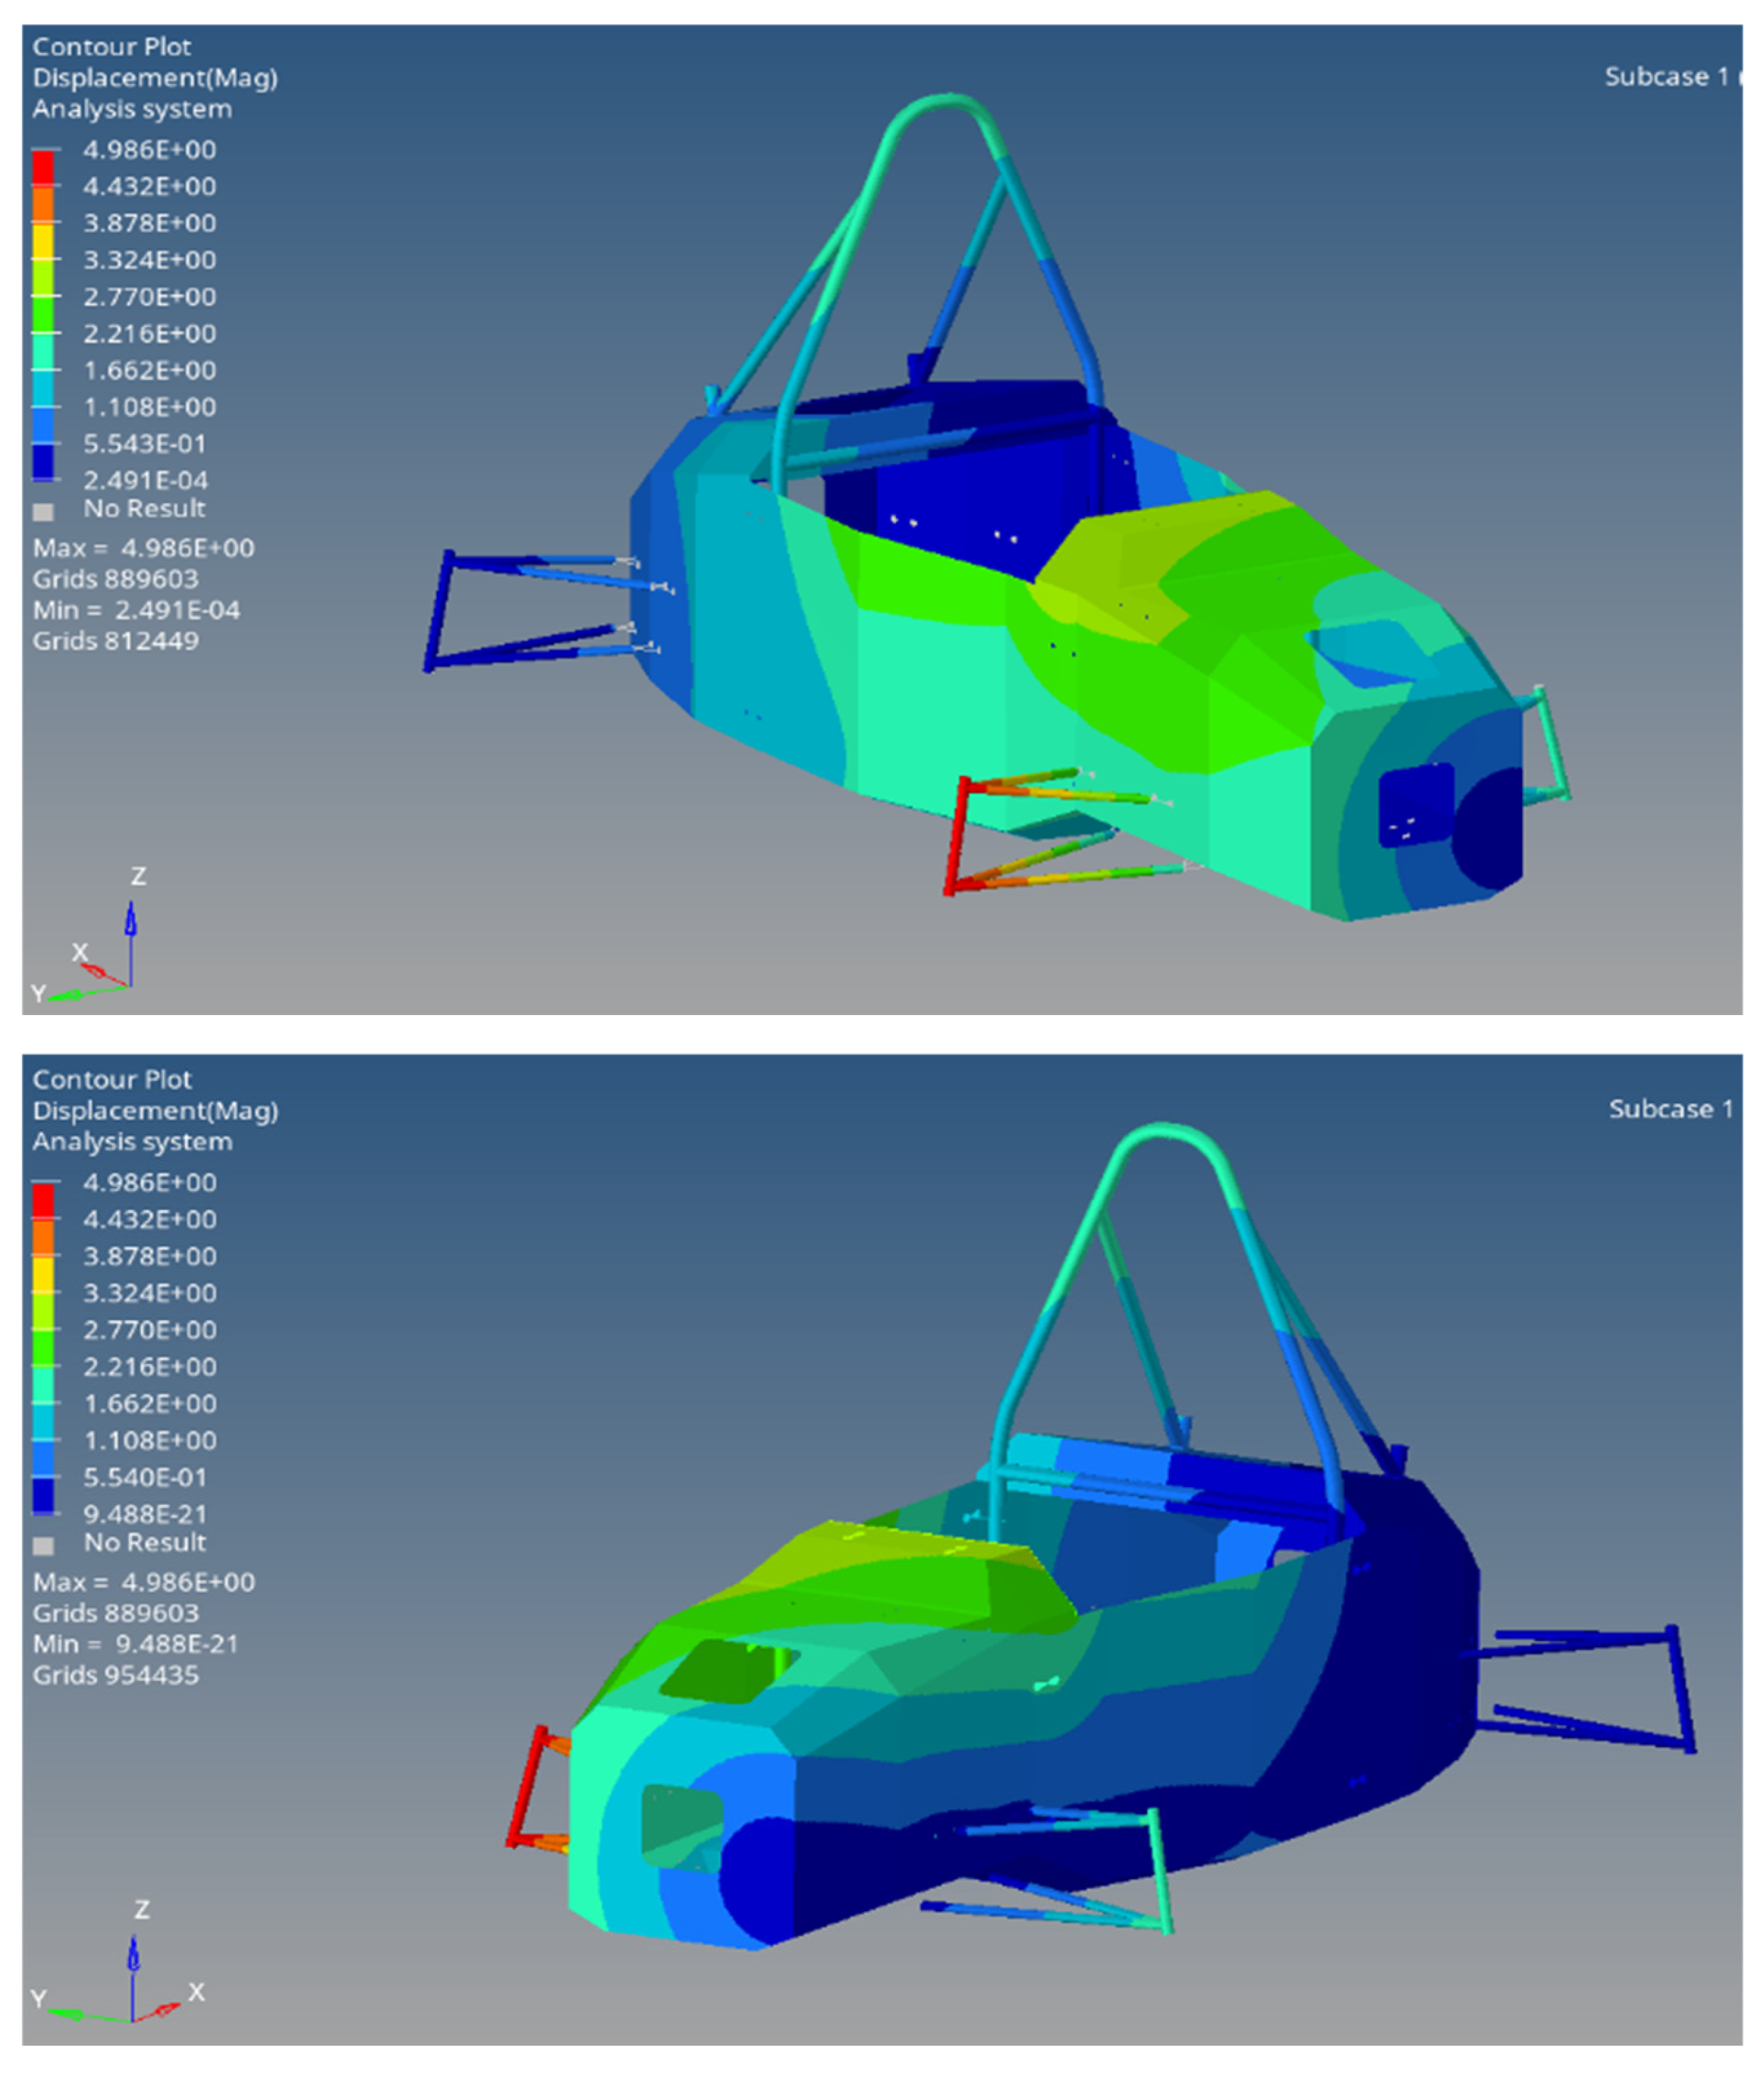
The results of the simulations are reported in
Table 5 and shown in
Figure 11. An average torsional stiffness J of 3591.1 Nm/deg is obtained for the 2023 monocoque [
12,
13].
4. The 2021 and 2023 Experimental Validation
The experimental validation of the numerical results was conducted using the method defined below. The tubular frame was prepared in such a way as to replicate the scheme adopted for the numerical simulation as closely as possible. Therefore, the wheel assemblies were removed, the hub supports were replaced with simplified versions, and roll bars were taken into consideration. Furthermore, to avoid also considering the torsion component caused by the compression and extension of the spring–shock absorber assemblies, the latter were replaced by aluminum bars of the same length as the static configuration of both the front and rear springs. The vehicle was positioned so that the simplified hub supports could rest on the tailgate used for the test.
4.1. The 2021 Chassis Testing Campaign
Simplified steel wheel supports were used to secure the frame at the rear. The left support is locked so that it cannot lift vertically, while the rear right support is positioned on the base plate. In this way, when force is applied to the front right (to generate torque), there is no detachment of the rear left support from the bridge, but both rear wheel supports remain fixed as simulated.
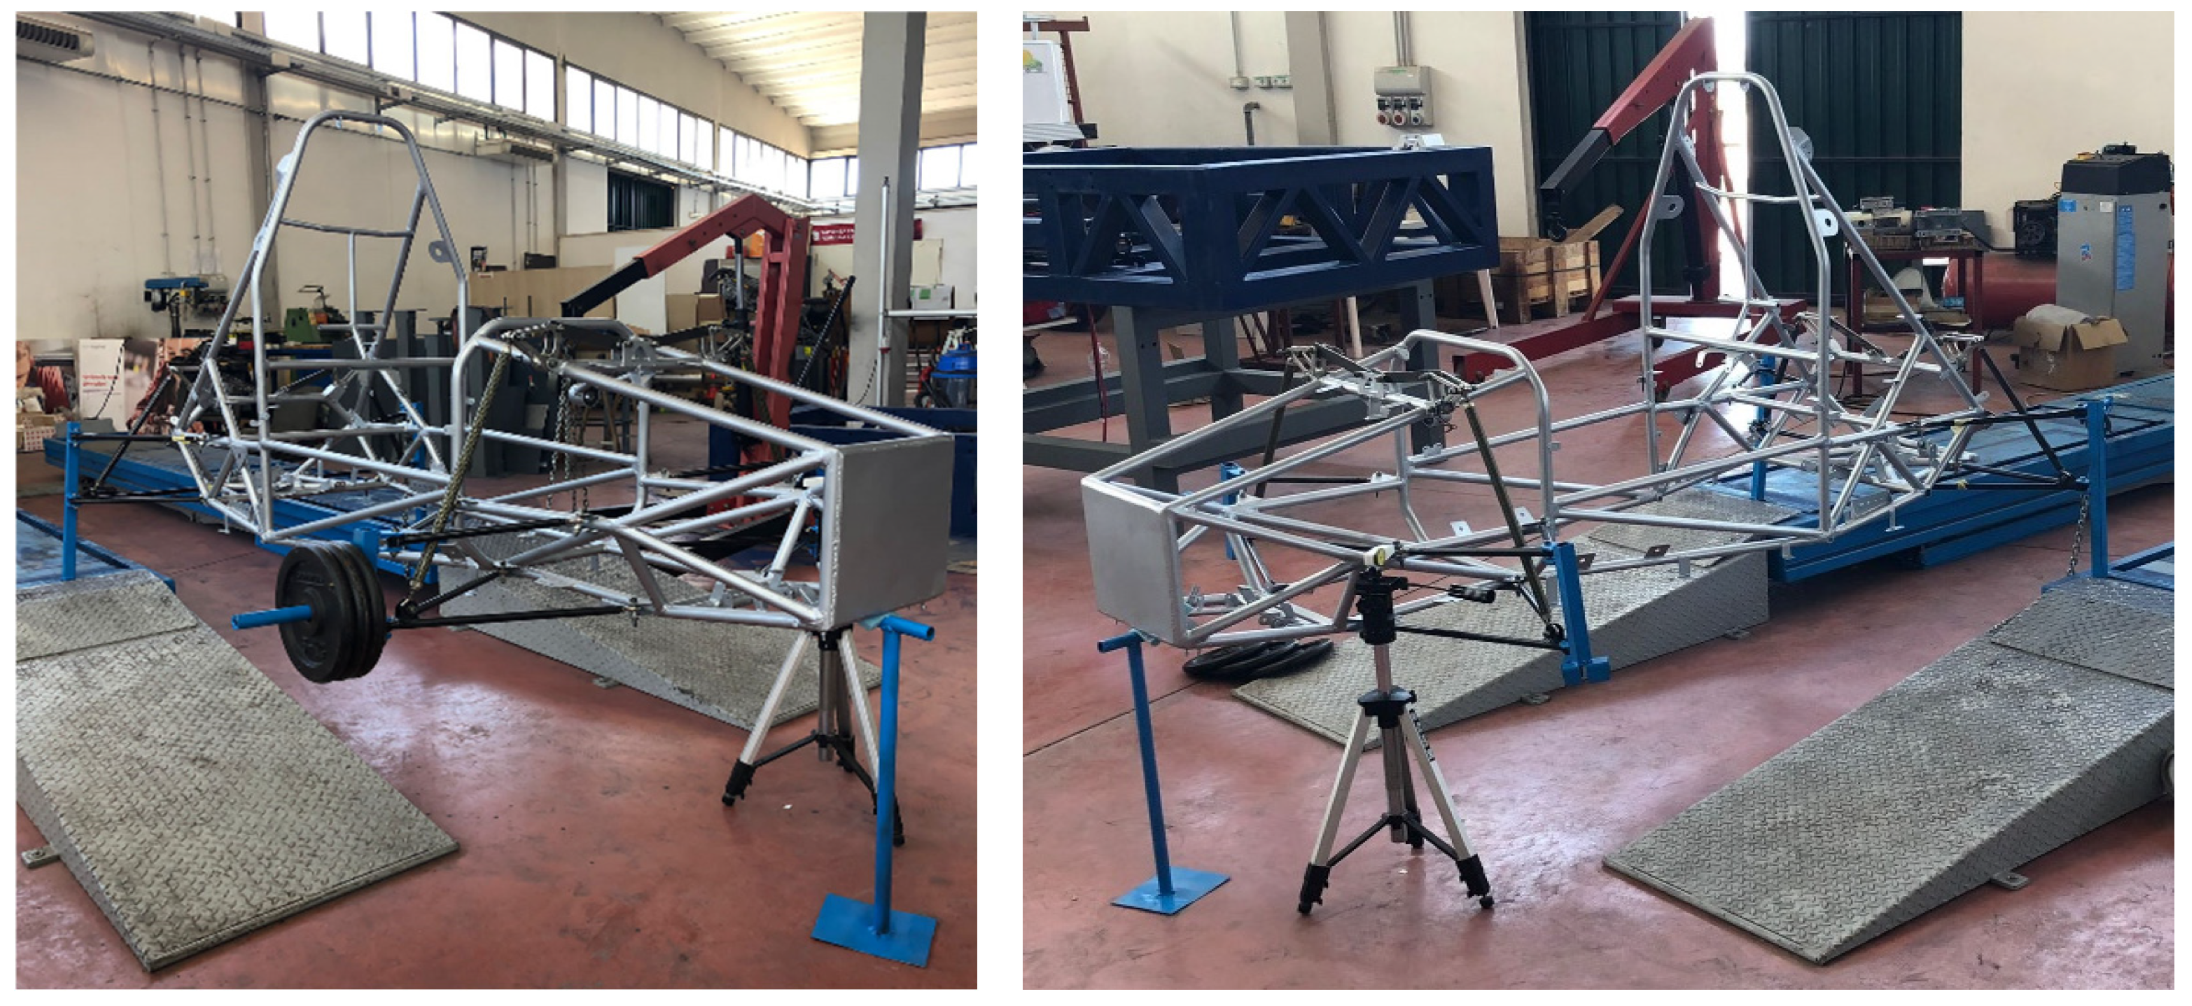
Instead, a simplified cylindrical hub carrier attached to the right front lower and upper wishbone was used to apply torque on the chassis, while the left front was left free. To provide a front pivot point to the frame, a steel stand positioned at the extreme front section was used. The described experimental test setup is shown in
Figure 12,
Figure 13 and
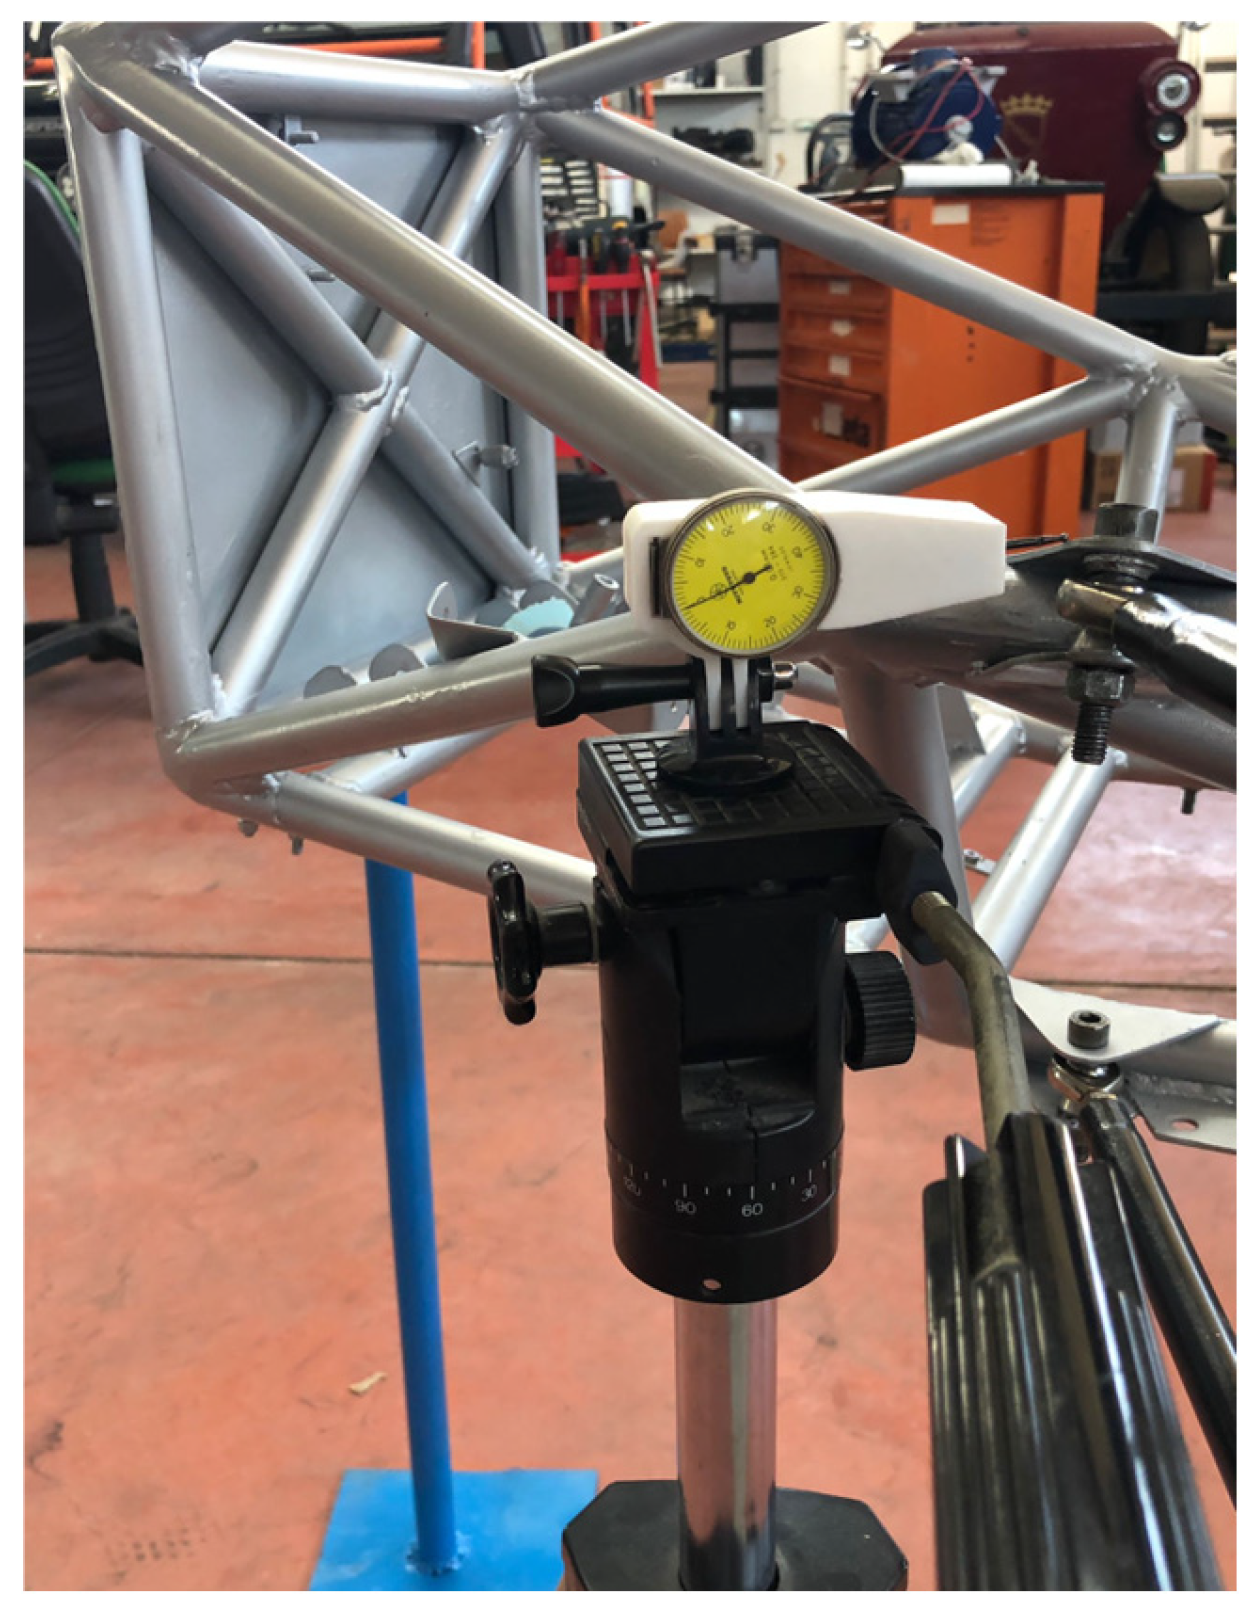
Figure 14. Measurements were made using a centesimal dial indicator (with error to the nearest hundredth of a millimeter) resting on a tripod, as shown in
Figure 15. The tip of the dial indicator is put in contact with the front support of the upper arm of the left front wheel assembly, measuring the displacement along the vertical direction as the tubular chassis is rotated.
Given the expected modest value of stiffness (consideration made following the value obtained by FEM simulation), it is not necessary to apply excessive weight to obtain measurable displacement with acceptable error from the comparator. Three tests were performed by applying three different weights: 5 kg, 10 kg and 15 kg (
Figure 16). For each test, 10 measurements were taken to reduce the error. The data obtained are shown below in
Table 6,
Table 7 and
Table 8.
The average of the measurements taken during the test yielded a J stiffness of 952.69 Nm/deg (see
Table 9). Compared with the value obtained from the simulations, which is 946.86 Nm/deg, there is a higher value in the experimental test. Thus, the simulation stiffness value has a very small error of 0.6%.
4.2. The 2023 Chassis Testing Campaign
The experimental test was conducted using the method already tested to evaluate the torsional stiffness of the 2021 tubular space frame described in the previous section. The mechanical setup of the test bench is identical to that used for the 2021 chassis. The experimental test setup is shown in
Figure 17.
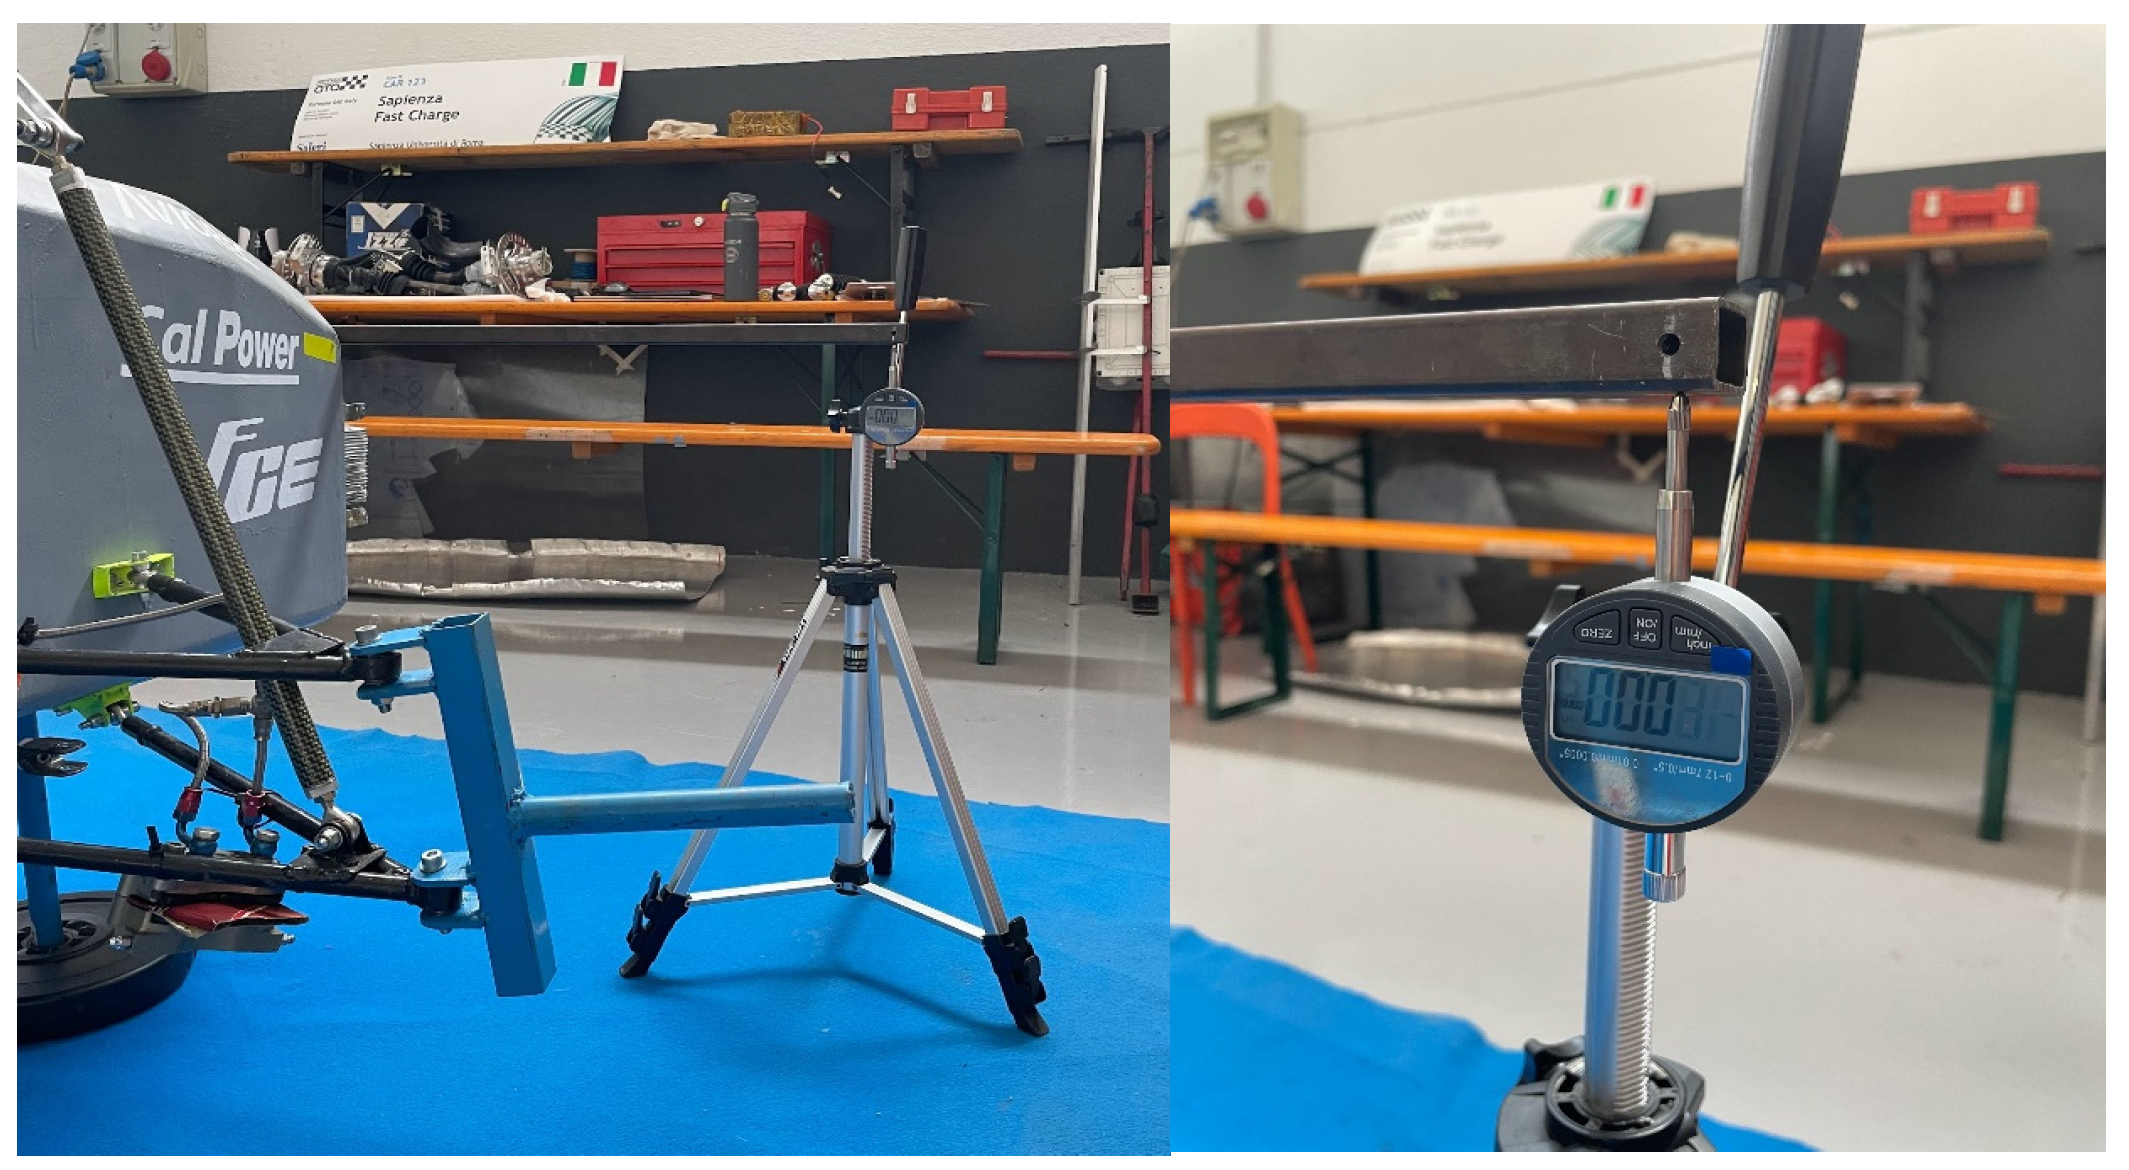
Measurements were made using the centesimal dial indicator already described, as shown in
Figure 18. The tip of the dial indicator can compress or extend while measuring vertical displacement.
Since the monocoque has greater stiffness than the tubular space frame, a weight composition equivalent to 35 kg total was used. The measurement was made using a 1.4 m long steel bar, to increase the measuring arm and have a smaller percentage error despite a non-high weight (this consideration was made by checking the displacements in the FEM). The comparator measures the vertical displacement at the extreme point of the previously defined bar by compressing and extending (
Figure 19).
Measurements were taken at the extreme front section of the frame. Four measurements were taken for the two analyzed sections to reduce the error. The data obtained are shown below in the following
Table 10. The measurements show an average stiffness of 3724.63 Nm/deg. Compared with the value obtained from the simulations, which is 3591.10 Nm/deg, there is a higher value in the experimental test. Therefore, the simulation results in a lower stiffness value with an error of 3.6%.
The error percentage is acceptable, and the causes are the setup of the FEM carried out, which is even more complicated when using composite materials, and the possible human error regarding the construction of the frame as well as the quality of the materials, potentially differing from the values given in the datasheet and therefore in the simulation. For the purpose of demonstrating the goodness of the method, the same calculations were performed with the report applied to the 2021 frame and the result was a torsional stiffness of 3371.83 Nm/deg, which shows an error of 9.5 percent.
5. Conclusions
The experimental test confirmed the validity of the simulations performed using FEM analysis. By evolving the computational system with respect to the actual test configuration, the error between the FEM and test was reduced from 9.5% to 3.6%. Based on these results, it will be possible to optimize the chassis structure in order to make the most of the properties of the materials used and the geometries.
The stiffness of a race car chassis is crucial to the vehicle’s dynamic behavior because it improves road holding, allows for more precise suspension control, and ensures better predictability of the car’s behavior. A stiffer chassis allows the wheel angles to remain constant even during cornering and acceleration, thus optimizing tire contact with the ground. Chassis stiffness affects vehicle dynamics for the following technical reasons:
− Suspension control: A stiff chassis ensures that most of the deformation is absorbed by the suspension. This allows for more precise control of the characteristic angles of the wheels (such as camber and toe), which remain constant regardless of stress.
− Predictable behavior: Chassis stiffness makes the vehicle’s behavior more predictable and easier for the driver to control. If the chassis flexes, the wheel angles change unpredictably, making the car more difficult to handle.
− Road holding: Maintaining the correct wheel angles is essential for maximizing grip. A rigid chassis ensures that the tires always maintain optimal contact with the ground, improving road holding when cornering.
− Performance: For race cars, light weight and high rigidity are key objectives. Lightweight materials with a high stiffness-to-weight ratio are preferred to achieve the best performance without compromising the overall weight of the car.
− Safety: In addition to performance, a rigid chassis offers greater protection to occupants in the event of an accident by distributing impact forces over a more resistant structure.
The main result of the research presented here has been achieved: the numerical calculation procedure for the stiffness of Formula Student-type frames has been experimentally validated, allowing design modifications and developments to be studied by quickly verifying their influence on the stiffness of the new frame [
14,
15].
A realistic comparison was also made between the two frames, the 2021 frame with space-frame technology and the 2023 frame with a carbon fiber monocoque [
16,
17]. The results obtained, both in simulation and experimentally, clearly show that the monocoque frame has 350% greater torsional stiffness than the space-frame type. This result was obtained with the two bare chassis having the same weight. This result allows us to start designing a new, optimized, lighter monocoque chassis, which will certainly have even more than adequate torsional stiffness for the application.
Author Contributions
Conceptualization, R.C., L.M.; methodology, R.C., L.M., C.D.F., D.B. and M.G.; software, D.B., C.D.F., M.G.; validation, L.M.; formal analysis, D.B., C.D.F., M.G.; investigation, R.C., L.M., C.D.F., D.B. and M.G.; resources, L.M.; data curation, R.C., L.M., C.D.F., D.B. and M.G.; writing—original draft preparation, R.C.; writing—review and editing, R.C. and L.M.; visualization, R.C.; supervision, R.C. and L.M.; project administration, L.M.; funding acquisition, L.M. All authors have read and agreed to the published version of the manuscript.
Funding
This research received no external funding.
Data Availability Statement
No new data were created or analyzed in this study. Data sharing is not applicable to this article.
Conflicts of Interest
The authors declare no conflicts of interest.
Abbreviations
The following abbreviations are used in this manuscript:
| BMS | Battery Management System |
| d | Diameter [m] |
| F | Force [N] |
| FBH | Front Bulk Head |
| FEM | Finite Element Method |
| FSG | Formula Student Germany |
| J | Torsional Stiffness [Nm/deg] |
| L | Length [m] |
| M | Torque [Nm] |
| MAG | Metal Active Gas |
| MH | Main Hoop |
| SAE | Society of Automotive Engineers |
| SIS | Side Impact Structure |
| UD | Unidirectional |
| W | Woven |
| WP | Woven |
| z | Quote [m] |
| Greek symbol | |
| ε | Eccentricity |
| ϑ | Angle [deg] |
References
- Stefani, N.C. Numerical and Experimental Analysis of the Stiffness of FSAE Car Frames. Master’s Thesis, Università degli Studi di Padova, Padova, Italy, 2017. [Google Scholar]
- Bortoluzzi, L.I.; Shommer, A.; Martins, M.; Buenos, A.A. Formula SAE Chassis Design to Improve Suspension Tuning; Federal University of Santa Maria-Brazil: Santa Maria, Brazil, 2016; SAE Technical Paper Series 2016-36-0239. [Google Scholar] [CrossRef]
- Chambers, A.E.; Rodriguez, S.A.; Walsh, R.M.; Wootton, D.; The Cooper Union. Development of a Test Stand for Determining the Torsional Rigidity of a Formula SAE Space Frame. In Proceedings of the 2016 ASEE Annual Conference & Exposition, New Orleans, LA, USA, 26–29 June 2016. [Google Scholar] [CrossRef][Green Version]
- Barbosa, L.F.F.M.; Tomazini, J.E.; Martins, M.S.; Moreira, L.R.R.Q.; Hori, M.Y.T. Finite Element and Experimental Analysis of the Torsional Stiffness of a Chassis of a Baja SAE Prototype. In Proceedings of the 25th SAE BRASIL International Congress and Display, Sao Paolo, Brazil, 7–8 October 2016. SAE International Conference Paper 2016-36-0124. [Google Scholar] [CrossRef]
- Mishra, S. Application of Carbon Fibers in Construction. J. Mech. Constr. Eng. 2022, 2, 1–7. [Google Scholar] [CrossRef]
- Riley, W.B.; George, A.R. Design, analysis, and testing of a Formula SAE car chassis. In Proceedings of the 2002 SAE Motorsports Engineering Conference and Exhibition; 2002. [Google Scholar] [CrossRef]
- Carter, J.B. Fabrication Techniques of Tubular Structures from Braided Preimpregnated Rovings. Presented at Composites in Manufacturing 4, Anaheim, CA, USA, 9–12 December 1985; American Society of Mechanical Engineers (ASME): New York, NY, USA, 1985. Paper EM85-100. [Google Scholar]
- Gay, D.; Hoa, S.V. Composite Materials: Design and Applications, 2nd ed.; CRC: Boca Raton, FL, USA, 2007; Volume XIV, 548p. [Google Scholar]
- Barbero, E.J. Introduction to Composite Materials Design; Taylor and Francis: New York, NY, USA, 1999; Volume XVII, 336p. [Google Scholar]
- Miravete, A. (Ed.) 3-D Textile Reinfocements in Composite Materials; Woodhead Publishing Limited: Cambridge, UK, 1999. [Google Scholar]
- Mouritz, A.P.; Bannister, M.K.; Falzon, P.J.; Leong, K.H. Review of applications for advanced three-dimensional fibre textile composites. Compos. Part A Appl. Sci. Manuf. 1999, 30, 1445–1461. [Google Scholar] [CrossRef]
- Chandan, S.N.; Vinayaka, N.; Sandeep, G.M. Design, Analysis and Optimization of Race Car Chassis for its Structural Performance. Int. J. Eng. Res. Technol. 2016, 5, 361–367. [Google Scholar] [CrossRef]
- Oymak, Y.A.; Feyzullahoğlu, E. Formula Student Race Car Chassis Design and Analysis. J. Adv. Res. Nat. Appl. Sci. 2021, 7, 201–218. [Google Scholar] [CrossRef]
- Goyal, P.; Mehta, S. Impact of structural reinforcements on chassis rigidity. J. Mines Met. Fuels 2021, 73, 1651–1662. [Google Scholar]
- 15. Hazimi, H.; Ubaidillah; Setiyawan, A.E.P.; Ramdhani, H.C.; Saputra, M.Z.; Imaduddin, F. Vertical bending strength and torsional rigidity analysis of formula student car chassis. In Proceedings of the 3rd International Conference on Industrial, Mechanical, Electrical, and Chemical Engineering; Surakarta, Indonesia, 13–14 September 2017, AIP Publishing: Melville, NY, USA, 2018; Volume 1931, p. 030050. [Google Scholar]
- Farabi, J. The design and analysis of multiple monocoque hassis for Formula Student (FS) racecar. Int. J. Mechatron. Autom. Res. 2021, 3, 19–32. [Google Scholar]
- Lee, C.; Park, J. Numerical investigation of torsional stiffness in motorsport chassis design. Comput. Mech. 2020, 62, 298–312. [Google Scholar]
Figure 1.
The 2021 and 2023 cars on the left and right, respectively.
Figure 1.
The 2021 and 2023 cars on the left and right, respectively.
Figure 2.
The 8.2 kWh car’s energy storage.
Figure 2.
The 8.2 kWh car’s energy storage.
Figure 3.
Isometric (a) and lateral (b) view of 2021 chassis.
Figure 3.
Isometric (a) and lateral (b) view of 2021 chassis.
Figure 4.
Views of 2023 monocoque chassis.
Figure 4.
Views of 2023 monocoque chassis.
Figure 5.
Welding points of suspension connections.
Figure 5.
Welding points of suspension connections.
Figure 6.
Example of 2023 car supports.
Figure 6.
Example of 2023 car supports.
Figure 7.
Angle definition in the 2021 chassis simulation.
Figure 7.
Angle definition in the 2021 chassis simulation.
Figure 8.
Chassis space frame and applied force for the simulation.
Figure 8.
Chassis space frame and applied force for the simulation.
Figure 9.
Angle definition in the 2023 chassis simulation.
Figure 9.
Angle definition in the 2023 chassis simulation.
Figure 10.
Simulation setup for the 2023 monocoque chassis.
Figure 10.
Simulation setup for the 2023 monocoque chassis.
Figure 11.
Simulation contour results.
Figure 11.
Simulation contour results.
Figure 12.
The 2021 space-frame chassis test rig.
Figure 12.
The 2021 space-frame chassis test rig.
Figure 13.
Suspension supports.
Figure 13.
Suspension supports.
Figure 14.
Suspension support assembly.
Figure 14.
Suspension support assembly.
Figure 15.
Instrument setup.
Figure 15.
Instrument setup.
Figure 16.
Load application.
Figure 16.
Load application.
Figure 17.
The 2023 chassis setup.
Figure 17.
The 2023 chassis setup.
Figure 18.
Instrument assembly.
Figure 18.
Instrument assembly.
Figure 19.
Assembling 2023 chassis with 35 kg load.
Figure 19.
Assembling 2023 chassis with 35 kg load.
Table 1.
Elements of 2021 chassis.
Table 1.
Elements of 2021 chassis.
| Color | Material | Thickness (mm) | External Diameter (mm) |
|---|
| Green | S235JR | 1.5 | 25 |
| Blue and Yellow | S235JR | 2.0 | 25 |
| Red | S235JR | 2.5 | 25 |
Table 2.
Monocoque fiber specifications.
Table 2.
Monocoque fiber specifications.
| Material | Density | Thickness
(mm) | Young Modulus
E1 (GPa) | Ultimate Tensile Strength
E1 (MPa) |
|---|
| Woven (W) | 200 g/m2 | 0.23 | 54.8 | 773.5 |
| Woven (WP) | 630 g/m2 | 0.65 | 58.6 | 918.1 |
| Unidirectional (UD) | 170 g/m2 | 0.20 | 115 | 765 |
Table 3.
Monocoque core specifications.
Table 3.
Monocoque core specifications.
| Material | Density | Thickness (mm) |
|---|
| Aluminum Honeycomb | 83.3 kg/m3 | 4.7625 (cell) |
| Aramid Honeycomb | 48 kg/m3 | 3.175 (cell) |
Table 4.
Simulation conditions.
Table 4.
Simulation conditions.
| d [mm] | 260 | 160 |
| L [mm] | 600 |
| F (N) | 50 | 100 | 150 | 50 | 100 | 150 |
| | 0.15 | 0.3 | 0.44 | 0.085 | 0.17 | 0.26 |
| Δz [mm] | 0.033 | 0.066 | 0.096 | 0.030 | 0.060 | 0.093 |
| ϑ | 30 | 60 | 90 | 30 | 60 | 90 |
| M [Nm] | 907.57 | 907.57 | 928.20 | 985.60 | 985.60 | 966.64 |
| J [Nm/deg] | 0.15 | 0.3 | 0.44 | 0.085 | 0.17 | 0.26 |
| Jmed [Nm/deg] | 946.86 |
Table 5.
Simulation results.
Table 5.
Simulation results.
| | 1 | 2 | 3 | 4 | 5 | 6 | 7 |
|---|
| d [mm] | 491.44 | 491.44 | 491.44 | 491.44 | 491.44 | 491.44 | 491.44 |
| L [mm] | 568.5 | 568.5 | 568.5 | 568.5 | 568.5 | 568.5 | 568.5 |
| F [N] | 1000 | 1200 | 1400 | 1600 | 1800 | 2000 | 2200 |
| Δz1 [mm] | 1.137 | 1.364 | 1.591 | 1.819 | 2.046 | 2.274 | 2.501 |
| Δz2 [mm] | 0.2211 | 0.2653 | 0.3096 | 0.3537 | 0.398 | 0.4421 | 0.4863 |
| Results |
| [deg] | 0.15834 | 0.18996 | 0.22159 | 0.25331 | 0.28494 | 0.31666 | 0.34828 |
| M [Nm] | 568.5 | 682.2 | 795.9 | 909.6 | 1023.3 | 1137 | 1250.7 |
| J [Nm/deg] | 3590.44 | 3591.37 | 3591.85 | 3590.88 | 3591.31 | 3590.6 | 3591.1 |
| Jmed [Nm/deg] | | 3591.1 |
Table 6.
Results of 5 kg weight load.
Table 6.
Results of 5 kg weight load.
| 5 kg Weight Load |
|---|
| Test number | 1 | 2 | 3 | 4 | 5 |
| d [mm] | 260 | 260 | 260 | 260 | 260 |
| L [mm] | 660 | 660 | 660 | 660 | 660 |
| F [N] | 49.05 | 49.05 | 49.05 | 49.05 | 49.05 |
| Δz [mm] | 0.12 | 0.15 | 0.13 | 0.12 | 0.15 |
| Experimental Results |
| θ [deg] | 0.0264 | 0.0331 | 0.0286 | 0.0264 | 0.0331 |
| M [Nm] | 32.373 | 32.373 | 32.373 | 32.373 | 32.373 |
| J [Nm/deg] | 1224.2 | 979.36 | 1130.03 | 1224.2 | 979.37 |
| Test number | 6 | 7 | 8 | 9 | 10 |
| d [mm] | 260 | 260 | 260 | 260 | 260 |
| L [mm] | 660 | 660 | 660 | 660 | 660 |
| F [N] | 49.05 | 49.05 | 49.05 | 49.05 | 49.05 |
| Δz [mm] | 0.14 | 0.14 | 0.13 | 0.13 | 0.11 |
| Experimental Results |
| θ [deg] | 0.0309 | 0.0309 | 0.0286 | 0.0286 | 0.0242 |
| M [Nm] | 32.373 | 32.373 | 32.373 | 32.373 | 32.373 |
| J [Nm/deg] | 1049.31 | 1049.31 | 1130.03 | 1130.03 | 1335.49 |
Table 7.
Results of 10 kg weight load.
Table 7.
Results of 10 kg weight load.
| 10 kg Weight Load |
|---|
| Test number | 1 | 2 | 3 | 4 | 5 |
| d [mm] | 675 | 675 | 675 | 675 | 675 |
| L [mm] | 98.1 | 98.1 | 98.1 | 98.1 | 98.1 |
| F [N] | 0.3 | 0.3 | 0.3 | 0.32 | 0.32 |
| Δz [mm] | 260 | 260 | 260 | 260 | 260 |
| Experimental Results |
| θ [deg] | 0.0661 | 0.0661 | 0.0661 | 0.0705 | 0.0705 |
| M [Nm] | 66.218 | 66.218 | 66.218 | 66.218 | 66.218 |
| J [Nm/deg] | 1001.62 | 1001.62 | 1001.62 | 939.02 | 939.02 |
| Test number | 6 | 7 | 8 | 9 | 10 |
| d [mm] | 675 | 675 | 675 | 675 | 675 |
| L [mm] | 98.1 | 98.1 | 98.1 | 98.1 | 98.1 |
| F [N] | 0.31 | 0.31 | 0.31 | 0.32 | 0.32 |
| Δz [mm] | 260 | 260 | 260 | 260 | 260 |
| Experimental Results |
| θ [deg] | 0.0683 | 0.0683 | 0.0683 | 0.0705 | 0.0705 |
| M [Nm] | 66.218 | 66.218 | 66.218 | 66.218 | 66.218 |
| J [Nm/deg] | 969.31 | 969.31 | 969.31 | 939.02 | 939.02 |
Table 8.
Results of 15 kg weight load.
Table 8.
Results of 15 kg weight load.
| 15 kg Weight Load |
|---|
| Test number | 1 | 2 | 3 | 4 | 5 |
| d [mm] | 690 | 690 | 690 | 690 | 690 |
| L [mm] | 147.15 | 147.15 | 147.15 | 147.15 | 147.15 |
| F [N] | 0.49 | 0.5 | 0.5 | 0.49 | 0.49 |
| Δz [mm] | 260 | 260 | 260 | 260 | 260 |
| Experimental Results |
| θ [deg] | 0.108 | 0.1102 | 0.1102 | 0.108 | 0.108 |
| M [Nm] | 101.534 | 101.534 | 101.534 | 101.534 | 101.534 |
| J [Nm/deg] | 940.3 | 921.49 | 921.49 | 940.3 | 940.3 |
| Test number | 6 | 7 | 8 | 9 | 10 |
| d [mm] | 690 | 690 | 690 | 690 | 690 |
| L [mm] | 147.15 | 147.15 | 147.15 | 147.15 | 147.15 |
| F [N] | 0.49 | 0.49 | 0.49 | 0.49 | 0.48 |
| Δz [mm] | 260 | 260 | 260 | 260 | 260 |
| Experimental Results |
| θ [deg] | 0.108 | 0.108 | 0.108 | 0.108 | 0.1058 |
| M [Nm] | 101.534 | 101.534 | 101.534 | 101.534 | 101.534 |
| J [Nm/deg] | 940.3 | 940.3 | 940.3 | 940.3 | 959.89 |
Table 9.
Average J values.
Table 9.
Average J values.
| 5 kg average J [Nm/deg] | 1123.13 |
| 10 kg average J [Nm/deg] | 966.89 |
| 15 kg average J [Nm/deg] | 938.49 |
Table 10.
The 2023 experimental results.
Table 10.
The 2023 experimental results.
| | Measurement 1 | Measurement 2 | Measurement 3 | Measurement 4 |
|---|
| d front [mm] | 700 | 700 | 700 | 700 |
| d cent [mm] | 700 | 700 | 700 | 700 |
| L [mm] | 610 | 610 | 610 | 610 |
| F [N] | 333.2 | 333.2 | 333.2 | 333.2 |
| Δz front dx [mm] | 0.88 | 0.89 | 0.88 | 0.88 |
| Δz front sx [mm] | 0.72 | 0.73 | 0.72 | 0.73 |
| Δz front [mm] | 1.6 | 1.62 | 1.6 | 1.61 |
| Δz cent dx [mm] | 0.63 | 0.65 | 0.62 | 0.63 |
| Δz cent sx [mm] | 0.52 | 0.51 | 0.5 | 0.5 |
| Δz cent [mm] | 1.15 | 1.16 | 1.12 | 1.13 |
| d front [mm] | 700 | 700 | 700 | 700 |
| Results |
| θ front [deg] | 0.0655 | 0.0663 | 0.0655 | 0.0659 |
| θ front [deg] | 0.0471 | 0.0474 | 0.0458 | 0.0462 |
| M [Nm] | 203.252 | 203.252 | 203.252 | 203.252 |
| J front [Nm/deg] | 3103.99 | 3065.67 | 3103.99 | 3084.71 |
| J front average [Nm/deg] | 3089.59 |
| J cent [Nm/deg] | 4318.6 | 4284.58 | 4437.37 | 4398.16 |
| J cent average [Nm/deg] | 4359.68 |
| Average Values |
| J med [Nm/deg] | 3724.63 |
| Disclaimer/Publisher’s Note: The statements, opinions and data contained in all publications are solely those of the individual author(s) and contributor(s) and not of MDPI and/or the editor(s). MDPI and/or the editor(s) disclaim responsibility for any injury to people or property resulting from any ideas, methods, instructions or products referred to in the content. |
© 2025 by the authors. Published by MDPI on behalf of the World Electric Vehicle Association. Licensee MDPI, Basel, Switzerland. This article is an open access article distributed under the terms and conditions of the Creative Commons Attribution (CC BY) license (https://creativecommons.org/licenses/by/4.0/).
