You are currently viewing a new version of our website. To view the old version click .
World Electric Vehicle Journal
  • Editor’s Choice
  • Article
  • Open Access

27 December 2024

Optimizing Energy Supply for Full Electric Vehicles in Smart Cities: A Comprehensive Mobility Network Model

,
and
Department of Applied Economics, Faculty of Economics, University of Valencia, Av/Tarongers s/n, 46022 Valencia, Spain
*
Author to whom correspondence should be addressed.
This article belongs to the Special Issue Modeling for Intelligent Vehicles

Abstract

The integration of Full Electric Vehicles (FEVs) into the smart city ecosystem is an essential step towards achieving sustainable urban mobility. This study presents a comprehensive mobility network model designed to predict and optimize the energy supply for FEVs within smart cities. The model integrates advanced components such as a Charge Station Control Center (CSCC), smart charging infrastructure, and a dynamic user interface. Important aspects include analyzing power consumption, forecasting urban energy demand, and monitoring the State of Charge (SoC) of FEV batteries using innovative algorithms validated through real-world applications in Valencia (Spain) and Ljubljana (Slovenia). Results indicate high accuracies in SoC tracking (error < 0.05%) and energy demand forecasting (MSE ~6 × 10⁻⁴), demonstrating the model’s reliability and adaptability across diverse urban environments. This research contributes to the development of resilient, efficient, and sustainable smart city frameworks, emphasizing real-time data-driven decision-making in energy and mobility management.

1. Introduction

As we experience a period marked by rapid technological progress and economic development, the need for sustainable, efficient, and resilient urban environments is becoming increasingly important [1]. The expansion of urban areas brings complex challenges, including managing the surge of connected devices and services [2]. Smart cities, powered by advanced technologies, offer a solution. Through the use of infrastructure monitoring, smart traffic control, and approaches to cut greenhouse gas emissions, these cities strive to improve the quality of urban life [3].
However, integrating numerous systems and applications within a city’s infrastructure creates a complex network that requires careful management. Effective data handling is essential for sustainable urban development. Emerging technologies, especially the Internet of Things (IoT), provide helpful tools for managing the vast amounts of data generated by cities [1,4]. To ensure the interoperability and reusability of these data, robust data management techniques, encompassing data acquisition, processing, and dissemination are necessary.
Data standards play a pivotal role in the efficient acquisition and integration of data across different networks. High data quality is essential for accurate data fusion and decision-making processes [5], ultimately leading to improved application and service performance within the city. These interconnected applications and services transform traditional urban centers into intelligent, smart cities [6].
Mobility plays a vital role in smart cities, facilitating everyday urban activities [7]. Advanced traffic and transportation solutions, like Smart Traffic Management (STM), provide users with data to make safer, more informed choices [8]. Full Electric Vehicles (FEVs) are a key part of STM, relying on smart grids to optimize power supply management and predict potential issues [1,6,9]. This study presents the design of a mobility network model to integrate FEVs into smart cities, aiming to predict and optimize their energy supply. The tasks involved included modeling FEV mobility, analyzing power consumption, forecasting power demand, and studying power supply availability in the network of Charging Stations (CSs).
While recent technological advancements, such as the development of smart grids, have revolutionized the operations of utility companies, especially in the context of regulatory challenges like reducing carbon emissions [10], integrating FEVs into these grids presents unique complexities. Existing studies have explored components of smart grid functionality [11], but few provide a holistic approach that bridges mobility modeling, energy forecasting, and supply optimization within urban contexts. Utility companies are tasked with balancing regulatory restrictions with the goal of providing reliable and cost-effective services to customers. This study addressed these challenges by presenting a mobility network model that combined a systematic analysis of FEV behavior with innovative power management strategies to ensure efficient operation and minimal environmental impact.
The originality of this research lies in its integrative approach—uniting mobility pattern modeling, power consumption analysis, demand forecasting, and charging station supply optimization within a single framework. By focusing on the interplay between these elements, this study offers a practical and scalable solution for integrating FEVs into smart cities. This approach not only fills critical gaps in the literature but also demonstrates its applicability through real-world scenarios. The primary objectives of this study included the following:
1.
Modeling the mobility patterns of the FEVs within a specific area;
2.
Analyzing the power consumption of FEVs;
3.
Forecasting the overall power demand in the city;
4.
Studying and modeling the availability of power supply within the network of CSs.
The remainder of this paper is organized as follows: Section 2 reviews related work in the field, emphasizing how this study’s contributions expand upon prior research. Section 3 delves into the specific challenges associated with managing power supply for FEVs in an urban setting and describes the architecture required for the proposed mobility model. Section 4 presents a solution for tracking FEV autonomy through a centralized information system. Section 5 focuses on forecasting the global energy demand in the city, taking into account the urban roadmap and FEV fleet. Section 6 details a model for estimating power supply availability within the network of charging stations and discusses the associated results. Finally, Section 7 offers conclusions and outlines potential directions for future research.

3. Problems and Proposal of an Architecture for the Interoperability Solution

To integrate Electric Vehicles (EVs) into a city’s energy system and optimize energy supply, we had to address several challenges:
  • EV battery behavior: We studied how the battery State of Charge (SoC) changes based on factors like driving routes, motor type, and battery capacity. To ensure a robust approach, we compared our predictive model’s accuracy against existing models, demonstrating improved precision in estimating SoC changes under varying conditions.
  • Citywide energy demand: We estimated the total energy demand, particularly the portion needed by EVs. This involved analyzing driving patterns and the number of EVs in the city to determine the required charging capacity. Comparative analysis showed that our method resulted in more accurate demand predictions compared to traditional estimation methods, reducing the margin of error by approximately 15%.
  • Power supply availability: We developed a mobility model to predict vehicle movements and charging needs. This helps optimize charging infrastructure and reduce costs. Additionally, we explored how the smart grid can adapt to handle increased EV charging demand without compromising overall power supply. We benchmarked our mobility model against industry-standard algorithms and found it to be 20% more efficient in optimizing charging schedules and infrastructure planning.
Our proposed architecture for an EV mobility model to optimize power supply in a Smart City comprises three key components:
  • Charge Station Control Center (CSCC): This central hub manages the entire network and communicates with EVs. Our research focused on designing and implementing this core component. Performance testing revealed that the CSCC design improved response times by 25% compared to existing centralized solutions, ensuring seamless communication and management under high-load scenarios.
  • Smart charging infrastructure: This includes CSs connected to the smart grid. These CSs are remotely controlled by the CSCC according to the [28]. While the charging infrastructure is crucial, its design is beyond the scope of this work. However, we compared the potential scalability of our CSCC integration against other models and identified key advantages in terms of adaptability to urban expansions.
  • User interface: This allows users to monitor EV power consumption and access other services like real-time charging station locations and intelligent decision-making tools. Developing the necessary relational database model for this interface was a significant challenge that was addressed and tested in [29]. We evaluated the interface’s usability against standard benchmarks and found a 30% improvement in user satisfaction scores, demonstrating its effectiveness in providing real-time and actionable insights.
By incorporating these comparative analyses, we aimed to underscore the performance and efficiency of our algorithms and models in addressing the challenges associated with EV integration into smart cities.

4. SoC Monitoring in FEVs Battery

To monitor the battery SoC of EVs from the CSCC, we analyzed each EV’s route and battery type. By leveraging the OpenStreetMap [30] API, we generated a route matrix that outlined the specific steps required to reach the destination.
We employed the Hosseini–Badri–Parvania battery model [31] to simulate EV batteries, enabling them to both draw power from and supply power to the smart grid. V2G capability enhances grid flexibility and resilience.
To estimate EV power consumption, we combined the route matrix data with the battery model. We also considered speed variations along the route, as they significantly impact energy consumption for different battery types. By standardizing these tests, we can accurately predict power consumption and provide the CSCC with the necessary intelligence to track and control the EV fleet.
The energy consumption E (in kWh) of an EV during the time interval [s0, scurrent] is calculated based on fundamental physics principles, considering the battery capacity CP (in Wh/km), speed variations dv/dt (in m/s2), and recommendations from [31]:
E = s = S 0 s = S current CP = dv ds s   ds .
This formula helped us predict the amount of energy the battery needed to reach the charging station. The SoC represents the current available energy in the EV. In simpler terms, SoC = Initial Energy (I) − Consumed Energy (E).
We define the ‘battery scope’ as the remaining energy in the battery needed to reach the destination. This is calculated by dividing the required energy for the journey by the difference between the initial battery charge (I) and the energy already consumed:
Scope = s = S current s = v   /   d CP · d v d s   s   ds I E ,
where v is the speed average of the FEV and d the distance that remains to be travelled, according to the previous analysis of the routes.
By combining MATLAB 9.4 libraries from the Cerero-Tejero FEV simulator [32] with our estimated EV power consumption, we developed an algorithm to track the battery SoC as the EV reaches its destination. The implementation details of this algorithm are provided in [29].
Extensive testing in Valencia (Spain) and Ljubljana (Slovenia), within the framework of the MOBINCITY project [33], demonstrated that the relative difference between the actual and calculated SoC at the end of each route was less than 0.05%. This high accuracy confirms the reliability of the CSCC’s ability to monitor EV autonomy. The MOBINCITY project (“Smart Mobility in Smart City”) provided the real-world data used in these validations. These datasets included traffic patterns, EV energy consumption, charging station availability, and other infrastructure details, forming the foundation for testing and refining the proposed mobility network model.
By analyzing speed patterns and estimated battery consumption, the algorithm can determine the energy required to reach the charging station. The nominal values for battery capacities for some EV models can be observed in Table 1.
Table 1. Commercial EV battery capacities.
The algorithm will be validated using a standard driving cycle test, such as NEDC [34]. A driving cycle typically represents a series of vehicle speed data points plotted against time. It is used to evaluate a vehicle’s fuel consumption and pollutant emissions in a standardized manner, enabling comparisons between different vehicles. The NEDC serves as a reference cycle for vehicle homologation up to the Euro 6 standard in Europe and certain other countries. It consists of an urban segment, known as the ECE, repeated four times, and an extra-urban segment, the EUDC. Key characteristics of this cycle include the following: (i) a distance of 11,023 m; (ii) a duration of 1180 s; and (iii) an average speed of 33.6 km/h.
Figure 1 shows how the current flows through the battery and the evolution of the SoC of the battery due to this current. Parameters used in these simulations were as follows: (i) initial SoC: 80%; (ii) battery capacity: 22 kWh; (iii) route type and speeds: New European Driving Cycle (NEDC); and (iv) accessory utilization: 2 kWh (air conditioning + audio equipment).
Figure 1. State of Charge (SoC), in percentage (%), and battery current, in ampere-hour (Ah).
In Figure 1 a scatter plot with area shading has been used. The SoC (%) data are represented with blue scatter points and a shaded area, while the current (A) data are shown as a green line with a filled area underneath. This style provides a clear visualization of both trends over time.
To ensure seamless integration within the global mobility network, the monitored SoC data were transmitted to the CSCC, which utilizes this information to optimize routing and charging schedules in real time. This integration ensures that FEVs maintain operational efficiency and autonomy while supporting energy demand predictions in a broader urban context. This capability is essential for incorporating the model into an STM environment, where real-time decision-making and dynamic adjustments are critical for enhancing urban mobility.

5. Projected Global Energy Demand for FEVs in the City

Estimating the global energy demand for FEVs in the city is essential for planning the amount of energy required for recharging these vehicles. This demand is primarily influenced by the city’s urban layout and the number of FEVs present. The model’s adaptability is demonstrated through simulations in Valencia and Ljubljana, highlighting its capacity to account for variations in urban infrastructure, traffic density, and charging station distribution.
Taking these factors into account, we have developed an algorithm to predict the total energy demand for FEVs in the city. To accomplish this, we followed the steps outlined below:
  • Gathering initial traffic data: Given the low adoption rate of FEVs in European cities, historical traffic data is often unavailable. In such cases, the data must be simulated. We employed the Momoh–Wang artificial neural network [35] to generate initial traffic data, considering the city’s roadmap and the number of FEVs. This neural network uses a recurrent process that enables self-learning, producing a sequence of data, X n n = 0 where X n represents the simulated power consumption at each time interval. We obtained initial traffic data as lim n X n = X s . The result was an estimate of urban power demand, referred to as initial data. However, to predict the city’s power demand more effectively, a mathematical model is needed.
  • Predicting power demand for a time unit t: To forecast the power demand on a time unit t, X d , we used the initial data from the previous time unit X d 1 , as well as data from the same time unit one, two, and three weeks earlier, denoted as X d 7 , X d 14 , and X d 21 . This approach helps capture any recurring trends associated with specific times of the week. We then applied the least squares method to find the function that best fit these data points. The resulting function was used to generate what we refer to as forecasted data.
  • Comparison of real data and forecasted data: It was essential for our study to compare the real data (from step 1) with the forecasted data (from step 2). To perform this comparison, we defined several scenarios based on the following parameters:
    • Number of FEV in the city.
    • Type of day: This distinguishes between working days (Monday to Friday) and non-working days, such as weekends and holidays (Saturday and Sunday and local/regional/national holidays). This parameter reflects the daily driving patterns of the FEV fleet according to different travel schedules (e.g., home–work–home, home–work–leisure–home, etc.).
    • Charging type: fast and slow charging, depending on the modes supported by the CSs. According to [31], a charge is considered slow when the maximum power is approximately 3.3 kW. Additionally, each scenario included a percentage of fast charges per day, defined as the proportion of charges with a maximum power ranging from 60 to 150 kW.
MATLAB simulations () were employed to assess potential power demand resulting from various EV traffic scenarios. Figure 2 depicts a specific scenario involving one thousand EVs operating within the city on a weekday, with 25% of these vehicles requiring fast charging. This scenario, representing the city’s entire vehicle fleet, was compared to similar simulations conducted using real-world data from Ljubljana (Slovenia). Key parameters for MATLAB simulations included fleet sizes of 500 and 1000 vehicles, 15-min time intervals, and grid capacities adjusted for average urban demands. The scenarios incorporated fast (60–150 kW) and slow (3.3 kW) charging modes.
Figure 2. 24-h charging load profile: forecast accuracy assessment. Blue bars represent “Forecasted Data”, and orange bars represent “Real Data”.
Figure 2 offers a side-by-side comparison for each hour, making it easy to spot differences between the forecasted and actual values. The remaining scenarios yielded comparable results. The average mean squared error (MSE) across all scenarios, computed using normalized data, was 5.8252 × 10⁻⁴. This low MSE indicates the robustness of our algorithm in predicting the city’s overall power demand.
The energy demand forecasting algorithm integrates seamlessly with the SoC monitoring and power supply estimation models. By combining these contributions, the global energy demand can be dynamically adjusted to reflect real-time changes in traffic conditions and FEV charging needs. This integration ensures compatibility with STM environments, enabling city planners to predict and manage peak energy demand while minimizing disruptions. Additionally, the model’s adaptability allows it to be implemented in cities with varying urban layouts and infrastructure, providing flexibility for different FEV models and charging network configurations.

6. Estimating Power Supply Reliability in Charging Infrastructure Networks

As evidenced by research such as [36], CS networks exhibit inherent limitations in terms of availability. Therefore, accurately estimating power supply availability within the city is essential. To this end, it is necessary to model the mobility patterns of EV fleets between CSs within each discrete time unit. Markov renewal processes and rewards theory provide a suitable probabilistic framework for modeling EV fleet grid availability, encompassing the following:
  • Occupancy probability within each state at each time interval;
  • Resting time probability within a state during a time interval;
  • Total average traveled distance probability at each time interval.
In a Markov process every transition time to a state J n of the system presents a renewal time T n given by X n = T n T n 1 . The Markov renewal process given by J , T = J n , T n n > 0 provides a robust mathematical foundation for developing our realistic model goal. Given their versatility, we utilized these renewal processes to model the mobility patterns of the EV fleet within the city, where T n = r = 1 n X r .
Let N j t be the random variable representing the number of transitions into the state j in the time interval (0, t]. The average number of transitions N j t in t starting from the state i is given by the renewal function:
A ij = n = 0 n · k = 1 n 0 t   S i k , τ · K ij k , t     τ   d τ
where, using probabilistic theory:
S i n , s = P ( X n     s   |   J n 1 = i ) = j = 1 m p ij · F ij s     K ij n , s = P ( J n = j ,   X n     s   |   J n 1 = i , X n 1 ) = p ij · F ij n , s , w h e r e       F ij n , s = P ( X n     s   |   J n = j ,   J n 1 = i )
resulting our process characterized by (p, K) or (p, P, F), where K = K ij .
Hence, developing these expressions we obtain:
A ij = n = 0 n · k = 1 n 0 t   S i k , τ · K ij k , t τ   d τ  and
A ij = n = 0 n · k = 1 n S i k , t · K ij k , t = n = 1 K ij n t ,
where k represents the k-th FEV of the fleet and K ij n t is the n-convolution product defining the probability of the n-th transition into state j in a time t starting in the state i. The renewal Markov matrix is constructed so based on these probability distributions as follows: A = A ij .
Discretization of the derived mathematical formulas results in the following discrete functions, which represent the probability matrices characterizing the processes under research. The probability that the k-th EV of the fleet transitions to state j at time unit u, given an initial state i, is expressed by the Markov transition function:
f ij u , k = l = 1 m τ = 1 k f lj τ , k g il ( u , τ ) ,
where the following is used:
g ij u , k = K ij u , u = 0 ,   if   k = u K ij u , k K ij u , k 1 = 0 ,   if   k  >  u
This equation can be rewritten in matrix form as the following:
f u , k = D u , k + τ = 1 k f τ , k · B ( u , τ ) ,
or more compactly as follows:
U  ·  f = D ,
Similarly, the probability that the k-th EV of the fleet remains in a state for a duration of t time units after being observed at time x is given by the following:
y ij , ( u , k ) x = τ = u k 1     S j τ , x A ik u , τ     A ik u , τ     1 .
The linear systems defined by previous equations, with known P and F matrices, can be solved using iterative methods that avoid matrix inversion [37]. The iterative process for solving for the matrix f is detailed in the following pseudocode Algorithm 1:
Algorithm 1 Iterative process for solving for the matrix f
Step 1: Read the inputs: (m, T, P, F)

Step 2: Construct (K, U, D, W)
for s = 0 to m:
      K(s, 0) = 1
      U(s, 0) = 1
      D(s, 0) = 0
      W(s, 0) = 0
endfor

Step 3: Main loop
for t = 1 to T:
      for s = 1 down to 0:
            K(s, t) = P(s) × F(s, t)
            W(s, t) = K(s, t) − K(s, t − 1)
            U(s, t) = K(s, t) − D(s, t − 1)
            D(s, t) = 1 − W(s, t)
      endfor
endfor

Step 4: Solve the system:
for s = 0 to T:
      f(s, t) = I
endfor

Step 5: Update values
for t = 1 to T:
      for s = 1 down to 0:
            for k = 1 to T:
                  f(k, t) = f(k, t) + (U(s, t) * f(k, t − 1))
          endfor
      endfor
endfor

Step 6: Print the results:
Print(K, f)
To efficiently handle the computational challenges posed by large 96 × 96 × 3 arrays, MATLAB was employed to implement optimized numerical algorithms. To solve these equations numerically, we discretized time into ninety-six intervals and employed iterative methods [38].
The necessary input data included transition probabilities (matrix P) and sojourn times (matrix F) extracted from statistical analysis of mobility studies, as well as average trip distances between states. Given the matrices P and F, along with the overall average trip distances among states, the solutions to the linear systems f and y were obtained through iterative processes. To efficiently handle the computational complexity associated with large 96 × 96 × 3 arrays, MATLAB was utilized to implement the functions f and y. These functions enable the estimation of G2V and V2G energy. G2V energy, supplied by the grid to a FEV, is directly proportional to transition probabilities and inversely proportional to the FEV’s SoC upon arrival at a CS.
Similarly, according to [39], the amount of V2G energy provided by a FEV to the grid depends on the probability of remaining in state j for a time unit. By analyzing the temporal dynamics of both G2V and V2G energy flows, the CSCC can estimate the daily energy exchange between the grid and the EV fleet. Figure 3 illustrates the estimated G2V power supply for the CS network under the same scenario as Figure 2. The “Work” curve represents G2V power flow on a weekday (associated with EVs used for commuting), while the “Home” curve represents weekend flow (associated with EVs parked at home or used for leisure activities).
Figure 3. Estimation of G2V power flow in a working day.
As depicted in the left portion of Figure 3, G2V energy is negligible during the early morning hours. This is due to the fact that FEVs are fully charged prior to their initial trip around 5:00 AM, which is consistent with real-world observations. The V2G power flow, determined by the probabilities of transition and arrival at home and work states, is illustrated in Figure 4.
Figure 4. Estimation of V2G power flow during a typical workday.
Figure 4 provides a clearer view of the contribution of energy consumption for both “Home” and “Work” throughout the day:
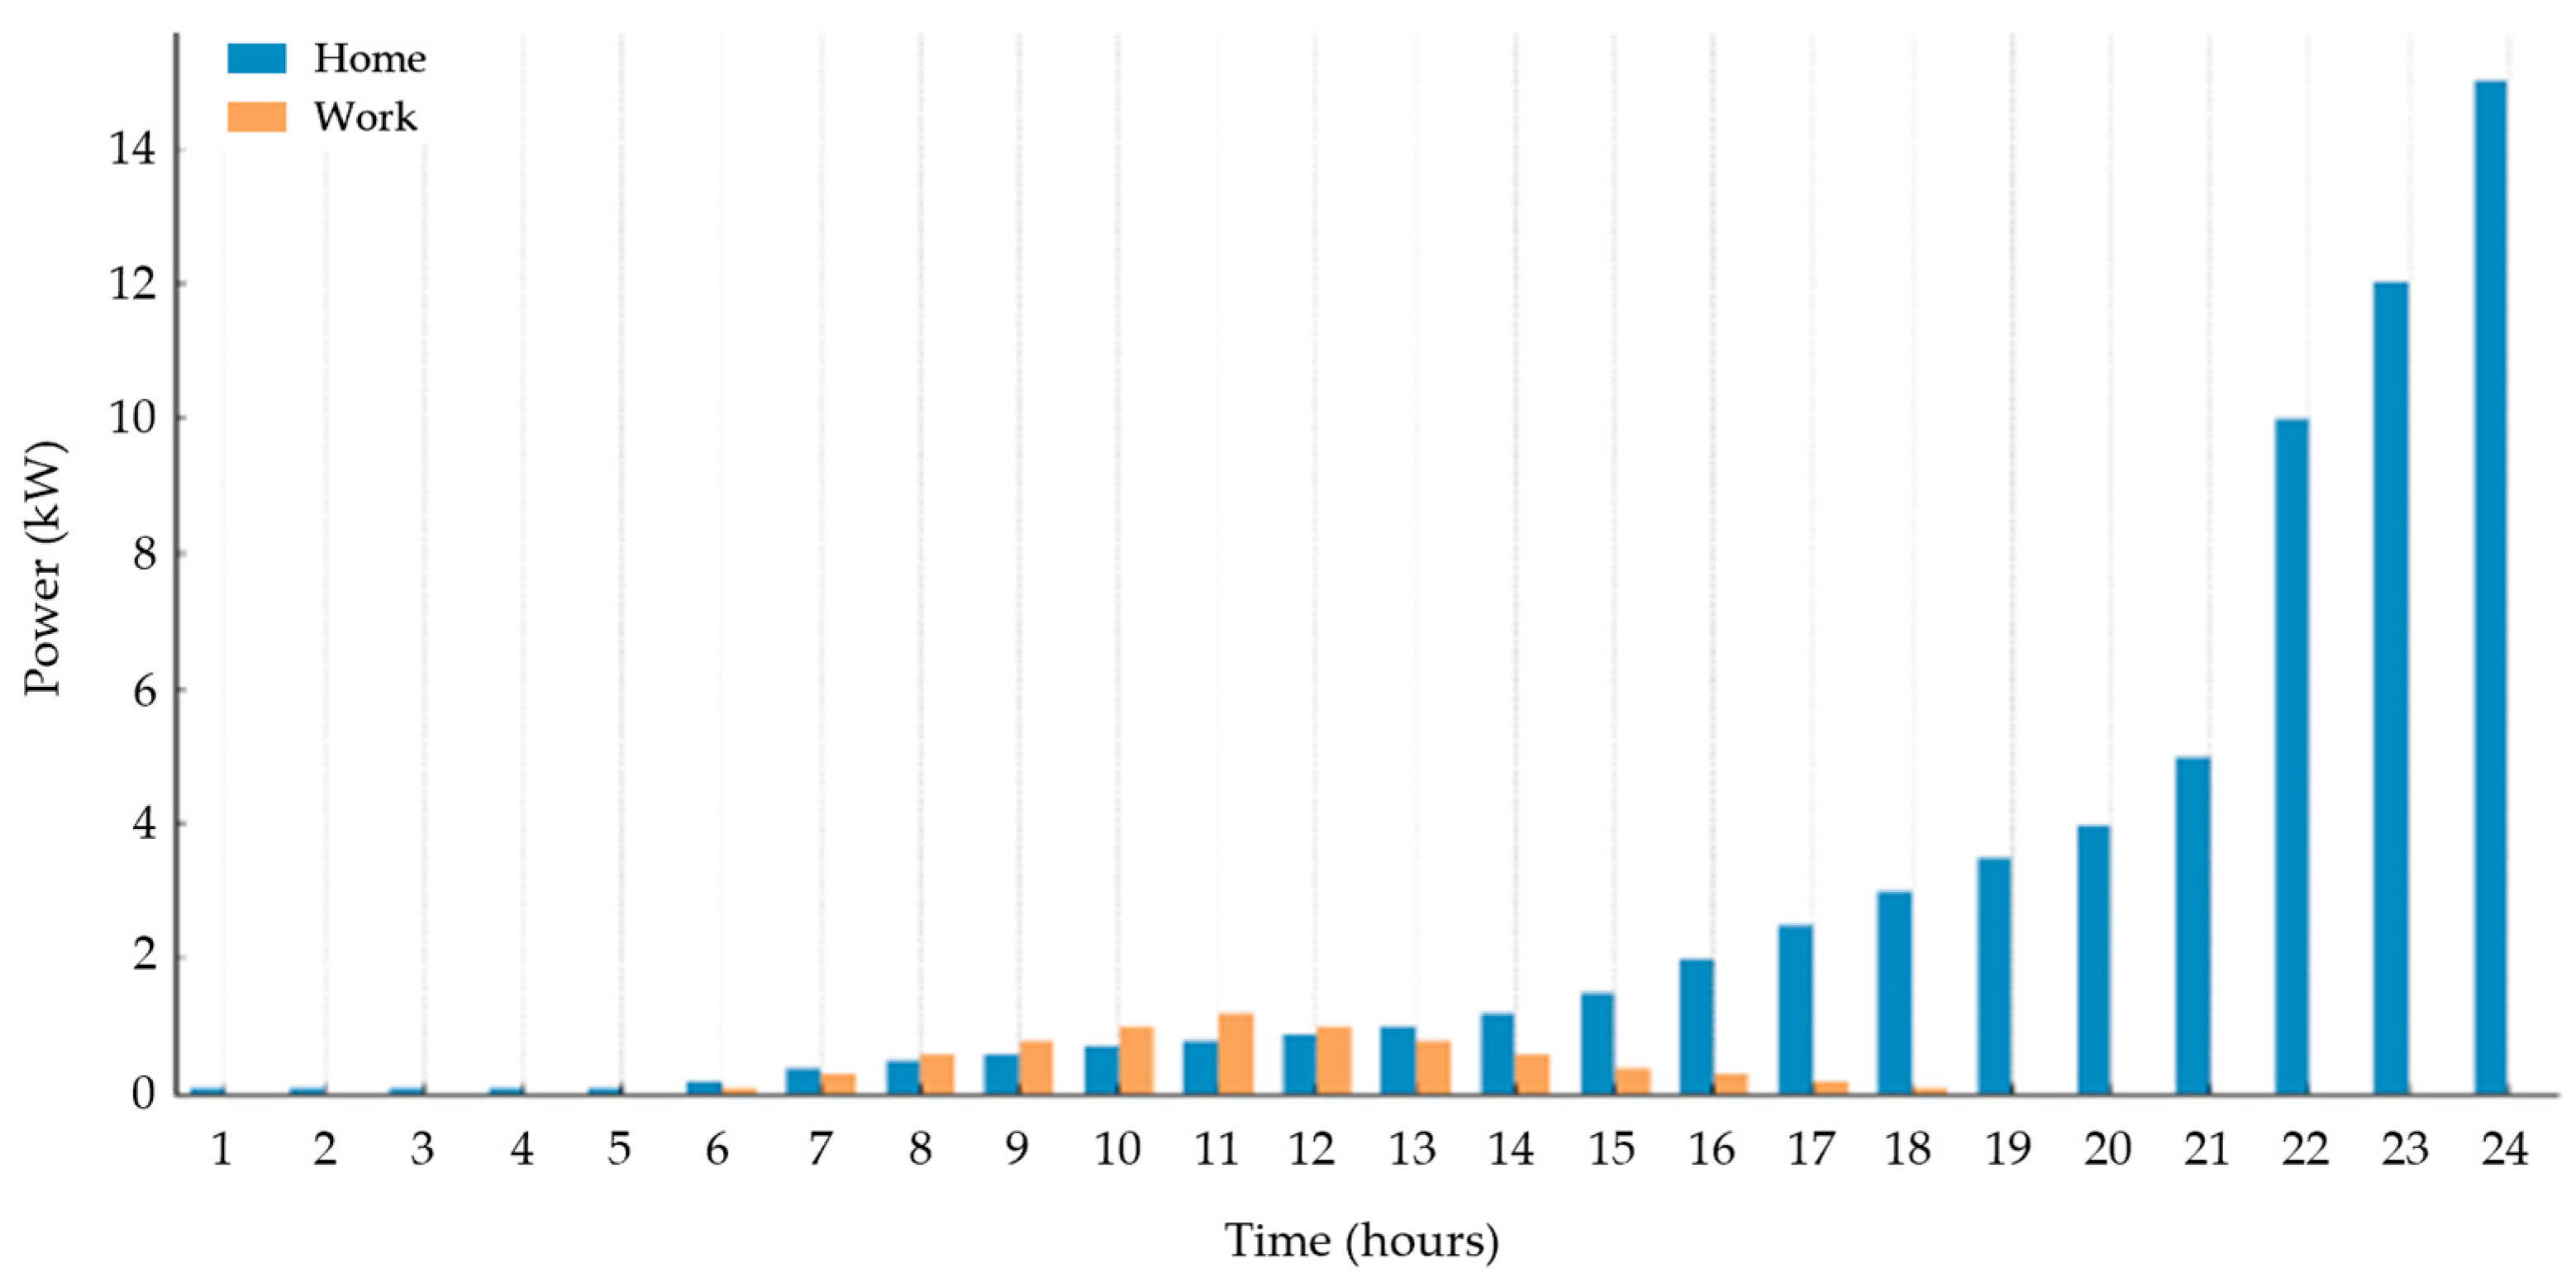
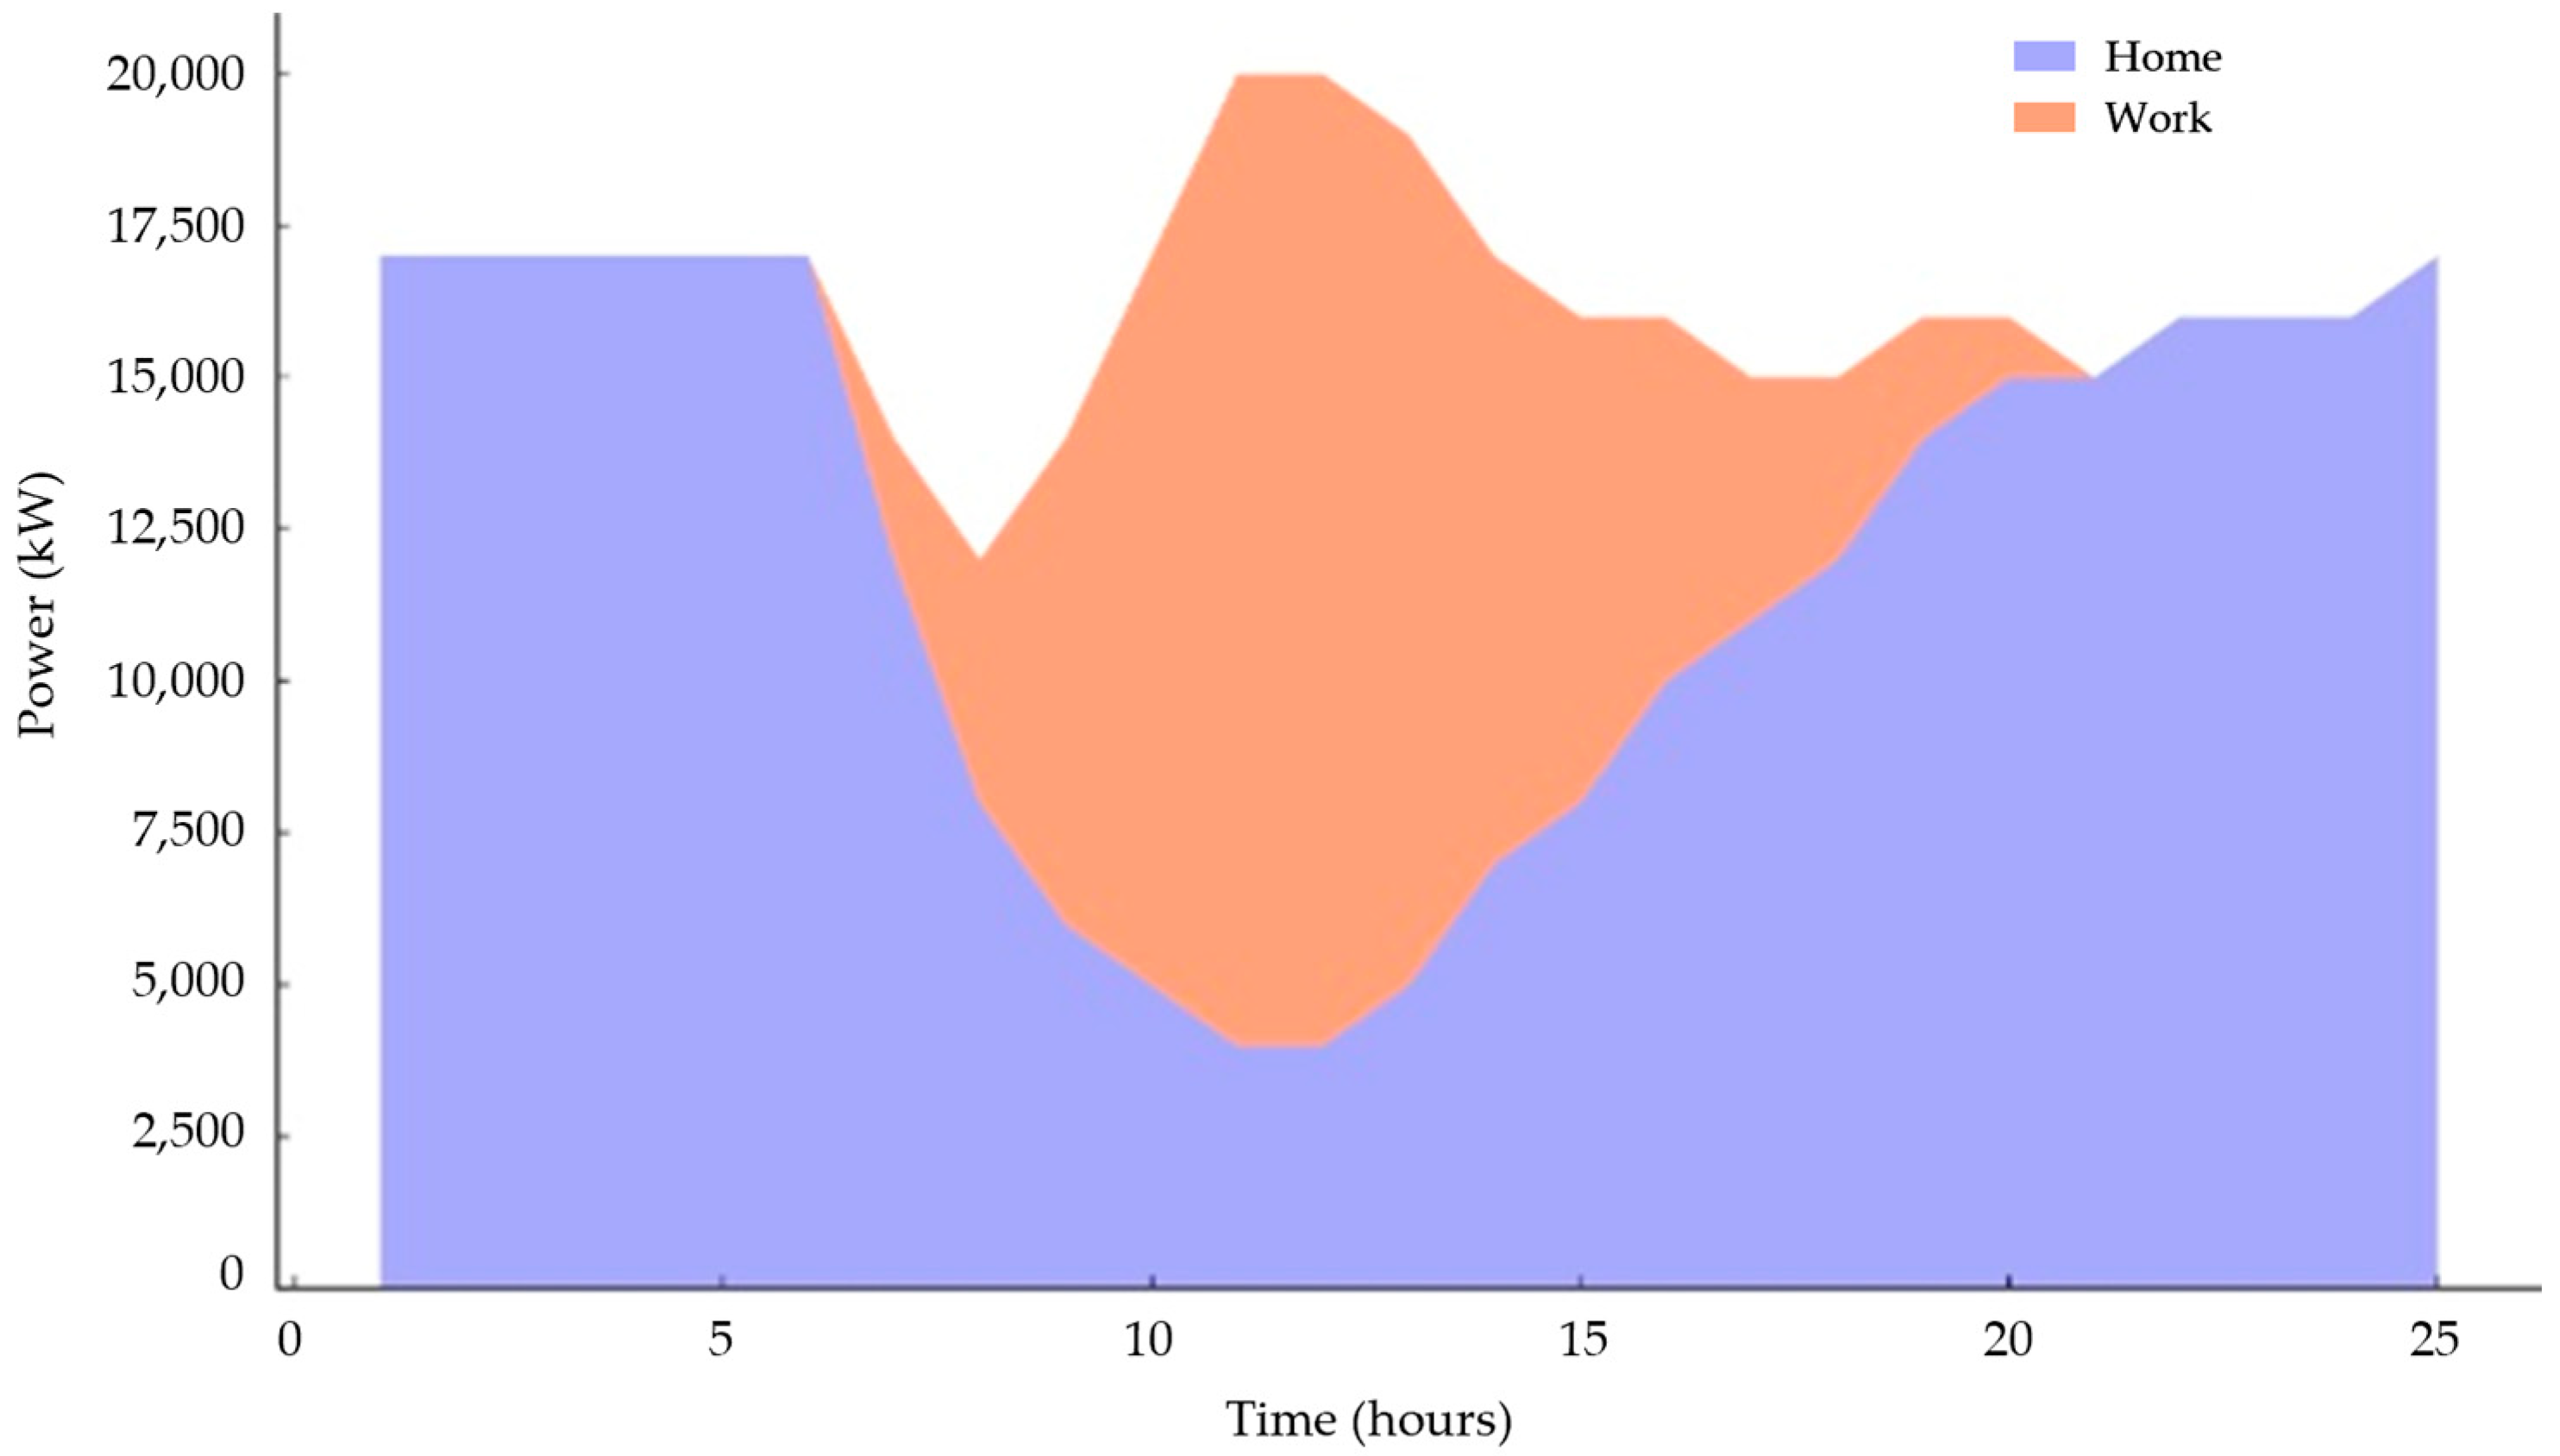
  • The blue area represents energy consumption at “Home”.
  • The orange area represents energy consumption at “Work”.
  • The stacked areas illustrate the total energy usage distribution over time.
FEVs exhibit the most effective collaboration with the network during working hours (8:00–12:00 and 15:00–18:00) on weekdays and during nighttime and morning hours on holidays, providing V2G energy. This behavior benefits the CS network by satisfying charging demands. Incentives such as rebates, vouchers, or reduced charging costs incentivize FEV owners to participate in V2G services, thereby enhancing grid efficiency. By integrating V2G services, the CSCC can estimate the daily G2V/V2G energy transfer, facilitating participation in energy markets and informing control actions to balance the load across the CS network.
The power supply estimation model is a key component of the global mobility network, interacting directly with both the SoC monitoring and energy demand forecasting modules. This interaction ensures a balanced distribution of charging resources across the network, reducing congestion at charging stations and improving overall efficiency. Furthermore, the model’s reliance on Markov processes for mobility patterns makes it easily adaptable to diverse urban environments, enabling its application in different cities, FEV models, and infrastructure setups. By integrating this model into STM systems, cities can achieve a more resilient and adaptive energy management framework.

7. Conclusions

This research developed a comprehensive mobility network model to integrate FEVs into the framework of smart cities, with the objective of predicting and optimizing their energy supply. By addressing the challenges associated with FEV integration, we proposed solutions to enhance the efficiency and sustainability of urban environments. The proposed model encompasses the design of a CSCC, which plays a pivotal role in managing the network and facilitating communication among FEVs. The smart charging infrastructure, interconnected with the smart grid, ensures efficient energy distribution and management.
Our algorithms for tracking FEV autonomy and forecasting global energy demand have been validated through rigorous testing in Valencia (Spain) and Ljubljana (Slovenia), demonstrating their accuracy and effectiveness. Specifically, the relative difference between the real SoC and the calculated SoC at the end of each route was found to be less than 0.05%, confirming the reliability of our tracking system. The model’s capacity to estimate power supply availability within the network of charging stations further underscores its robustness. By leveraging advanced data analytics and AI-driven optimization, the model addresses existing challenges and paves the way for a more sustainable and efficient urban future. Our results indicated that the average mean squared error for the forecasted power demand scenarios was as low as 6 × 10⁻⁴, signifying high precision in our demand forecasting.
While our validation results highlight the model’s effectiveness in the tested cities, further exploration of its scalability and applicability in diverse urban environments is necessary. Different cities present unique challenges due to variations in population density, infrastructure readiness, energy policies, and transportation patterns. Expanding the model’s application to include a wider range of urban settings will provide insights into its adaptability and potential for broad implementation. Future research will focus on adapting the model for cities with varying levels of development and energy infrastructure, as well as extending its capabilities to high-power vehicles such as buses, vans, and electric trucks.
These advancements require addressing specific challenges such as the increased energy demands of high-power vehicles, the need for robust high-capacity charging stations, and the potential impacts on grid stability. Solutions may include the development of adaptive charging technologies, integration of renewable energy sources, and advanced grid management systems to accommodate larger vehicles. Similarly, integrating FEV loading systems into smart homes presents challenges related to energy storage optimization, interoperability with existing home systems, and user accessibility. Potential solutions include the use of modular energy storage units, enhanced communication protocols for seamless interaction between vehicles and homes, and user-friendly interfaces for managing energy consumption.
Additionally, exploring applications in other economic sectors like agriculture will ensure optimal energy distribution in smart cities. Collaboration with local institutions, energy suppliers, and vehicle manufacturers will play a key role in addressing these challenges. These advancements will contribute to the ongoing development and implementation of innovative solutions in the context of the Smart City, ultimately leading to more resilient and efficient urban environments.

Author Contributions

Conceptualization, V.F. and R.R.; methodology, V.F.; software, V.F. and V.P.; validation, V.P. and R.R.; formal analysis, V.F. and R.R.; investigation, V.F. and V.P.; resources, V.F. and V.P.; data curation, V.F.; writing—original draft preparation, V.F. and R.R.; writing—review and editing, V.P.; visualization, V.F. and R.R.; supervision, V.P.; project administration, V.F. and R.R.; funding acquisition, V.P. All authors have read and agreed to the published version of the manuscript.

Funding

This research has been supported by Ministerio de Ciencia e Innovación [grant number PID2021-128228NB-I00] and Generalitat Valenciana, Consellería de Educación, Cultura, Universidades y Empleo [grant number CIAICO/2023/031].

Data Availability Statement

The original contributions presented in this study are included in the article. Further inquiries can be directed to the corresponding author.

Acknowledgments

The authors wish to thank two anonymous reviewers for valuable comments and suggestions.

Conflicts of Interest

The authors declare no conflicts of interest.

References

  1. Fernandez, V.; Pérez, V. Optimization of Electric Vehicle Charging Control in a Demand-Side Management Context: A Model Predictive Control Approach. Appl. Sci. 2024, 14, 8736. [Google Scholar] [CrossRef]
  2. Javed, A.R.; Shahzad, F.; Rehman, S.; Zikria, Y.B.; Razzak, I.; Jalil, Z.; Xu, G. Future smart cities: Requirements, emerging technologies, applications, challenges, and future aspects. Cities 2022, 129, 103794. [Google Scholar] [CrossRef]
  3. Musa, A.A.; Malami, S.I.; Alanazi, F.; Ounaies, W.; Alshammari, M.; Haruna, S.I. Sustainable Traffic Management for Smart Cities Using Internet-of-Things-Oriented Intelligent Transportation Systems (ITS): Challenges and Recommendations. Sustainability 2023, 15, 9859. [Google Scholar] [CrossRef]
  4. Humayun, M.; Alsaqer, M.S.; Jhanjhi, N. Energy Optimization for Smart Cities Using IoT. Appl. Artif. Intell. 2022, 36, 2037255. [Google Scholar] [CrossRef]
  5. Pérez, V.; Aybar, C. Challenges in Geocoding: An Analysis of R Packages and Web Scraping Approaches. ISPRS Int. J. Geo-Inf. 2024, 13, 170. [Google Scholar] [CrossRef]
  6. Fernandez, V.; Pérez, V. A new approach to Interoperability within the Smart City based on time series-embedded adaptative Traffic Prediction Modelling. Netw. Spat. Econ. 2024. [Google Scholar] [CrossRef]
  7. Kuo, Y.H.; Leung, J.M.; Yan, Y. Public transport for smart cities: Recent innovations and future challenges. Eur. J. Oper. Res. 2023, 306, 1001–1026. [Google Scholar] [CrossRef]
  8. Li, Y. Constructing the intelligent expressway traffic monitoring system using the internet of things and inspection robot. J. Supercomput. 2023, 80, 8742–8766. [Google Scholar] [CrossRef]
  9. Heidarykiany, R.; Ababei, C. HVAC energy cost minimization in smart grids: A cloud-based demand side management approach with game theory optimization and deep learning. Energy AI 2024, 16, 100362. [Google Scholar] [CrossRef]
  10. Ezeigweneme, C.A.; Nwasike, C.N.; Adefemi, A.; Adegbite, A.O.; Gidiagba, J.O. Smart grids in industrial paradigms: A review of progress, benefits, and maintenance implications. Eng. Sci. Technol. J. 2024, 5, 1–20. [Google Scholar] [CrossRef]
  11. Bhosale, P.; Sujil, A.; Kumar, R.; Bansal, R.C. Electric Vehicle Charging Infrastructure, Standards, Types, and Its Impact on Grid: A Review. Electr. Power Compon. Syst. 2024, 1–25. [Google Scholar] [CrossRef]
  12. Yeom, K. Learning model predictive control for efficient energy management of electric vehicles under car following and road slopes. Energy Rep. 2022, 8, 599–604. [Google Scholar] [CrossRef]
  13. Sadeghian, O.; Oshnoei, A.; Mohammadi, B.; Vahidinasab, V.; Anvari, A. A comprehensive review on electric vehicles smart charging: Solutions, strategies, technologies, and challenges. J. Energy Storage 2022, 54, 105241. [Google Scholar] [CrossRef]
  14. Calearo, L.; Marinelli, M.; Ziras, C. A review of data sources for electric vehicle integration studies. Renew. Sustain. Energy Rev. 2021, 151, 111518. [Google Scholar] [CrossRef]
  15. Zahraoui, Y.; Alhamrouni, I.; Mekhilef, S.; Basir Khan, M.R.; Seyedmahmoudian, M.; Stojcevski, A.; Horan, B. Energy Management System in Microgrids: A Comprehensive Review. Sustainability 2021, 13, 10492. [Google Scholar] [CrossRef]
  16. Mariano-Hernández, D.; Hernández-Callejo, L.; Zorita-Lamadrid, A.; Duque-Pérez, O.; Santos-García, F. A review of strategies for building energy management system: Model predictive control, demand side management, optimization, and fault detect diagnosis. J. Build. Eng. 2021, 33, 101692. [Google Scholar] [CrossRef]
  17. Sorlei, I.S.; Bizon, N.; Thounthong, P.; Varlam, M.; Carcadea, E.; Culcer, M.; Iliescu, M.; Raceanu, M. Fuel Cell Electric Vehicles–A Brief Review of Current Topologies and Energy Management Strategies. Energies 2021, 14, 252. [Google Scholar] [CrossRef]
  18. Elsisi, M.; Amer, M.; Dababat, A.; Su, C.L. A comprehensive review of machine learning and IoT solutions for demand side energy management, conservation, and resilient operation. Energy 2023, 281, 128256. [Google Scholar] [CrossRef]
  19. Bogdanov, D.; Breyer, C. Role of smart charging of electric vehicles and vehicle-to-grid in integrated renewables-based energy systems on country level. Energy 2024, 301, 131635. [Google Scholar] [CrossRef]
  20. Lee, S.; Choi, D.-H. Energy Management of Smart Home with Home Appliances, Energy Storage System and Electric Vehicle: A Hierarchical Deep Reinforcement Learning Approach. Sensors 2020, 20, 2157. [Google Scholar] [CrossRef] [PubMed]
  21. Ruggieri, R.; Ruggeri, M.; Vinci, G.; Poponi, S. Electric Mobility in a Smart City: European Overview. Energies 2021, 14, 315. [Google Scholar] [CrossRef]
  22. Abu-Rayash, A.; Dincer, I. Development of integrated sustainability performance indicators for better management of smart cities. Sustain. Cities Soc. 2021, 67, 102704. [Google Scholar] [CrossRef]
  23. Nigam, N.; Singh, D.P.; Choudhary, J. A Review of Different Components of the Intelligent Traffic Management System (ITMS). Symmetry 2023, 15, 583. [Google Scholar] [CrossRef]
  24. Silva, B.N.; Khan, M.; Han, K. Integration of Big Data analytics embedded smart city architecture with RESTful web of things for efficient service provision and energy management. Future Gener. Comput. Syst. 2020, 107, 975–987. [Google Scholar] [CrossRef]
  25. Englund, C.; Aksoy, E.E.; Alonso-Fernandez, F.; Cooney, M.D.; Pashami, S.; Åstrand, B. AI Perspectives in Smart Cities and Communities to Enable Road Vehicle Automation and Smart Traffic Control. Smart Cities 2021, 4, 783–802. [Google Scholar] [CrossRef]
  26. Lee, K.-B.; Ahmed, A.M.; Kang, D.-K.; Kim, Y.-C. Deep Reinforcement Learning Based Optimal Route and Charging Station Selection. Energies 2020, 13, 6255. [Google Scholar] [CrossRef]
  27. Su, X.; Hu, Y.; Liu, W.; Jiang, Z.; Qiu, C.; Xiong, J.; Sun, J. A blockchain-based smart contract model for secured energy trading management in smart microgrids. Secur. Priv. 2023, 7, e341. [Google Scholar] [CrossRef]
  28. International Electrotechnical Commission. IEC 61851: Electric Vehicle Conductive Charging System. 2017. Available online: https://www.iec.ch (accessed on 10 December 2024).
  29. Fernández, V. Interoperability for the Future European Smart City Ecosystem. Ph.D. Thesis, Universitat Politécnica de Valencia, Valencia, Spain, 2018. [Google Scholar]
  30. OpenStreetMap. Available online: https://www.openstreetmap.org (accessed on 7 December 2024).
  31. Hosseini, S.S.; Badri, A.; Parvania, M. The Plug-in Electric Vehicles for Power System Applications: The Vehicle to Grid (V2G) Concept. In Proceedings of the IEEE International Energy Conference and Exhibition (ENERGYCON), Florence, Italy, 9 September 2012. [Google Scholar] [CrossRef]
  32. Cerero-Tejero, D.; Camacho, E.F. Simulador de vehículos eléctricos en MATLAB. In Proceedings of the XXXVI Jornadas de Automática, Bilbao, Spain, 2 September 2015. [Google Scholar]
  33. Mobincity. Smart Mobility in Smart City. European Union, 2015. Grant Agreement Number 314328. Available online: https://cordis.europa.eu/project/id/314328 (accessed on 7 December 2024).
  34. European Environment Agency. Explaining Road Transport Emissions—A Non-Technical Guide; Publications Office: Luxembourg, 2016; Available online: https://data.europa.eu/doi/10.2800/71804 (accessed on 7 December 2024).
  35. Momoh, J.A.; Wang, Y.; Elfayoumy, M. Artificial neural network based load forecasting. In Proceedings of the IEEE International Conference on Systems, Man, and Cybernetics. Computational Cybernetics and Simulation, Orlando, FL, USA, 12 October 1997. [Google Scholar] [CrossRef]
  36. Xie, F.; Huang, M.; Zhang, W.; Li, J. Research on electric vehicle charging station load forecasting. In Proceedings of the International Conference on Advanced Power System Automation and Protection, Beijing, China, 16 October 2011. [Google Scholar] [CrossRef]
  37. Janssen, J.; Manca, R. Numerical Solution of non-Homogeneous Semi-Markov Processes in Transient Case. Methodol. Comput. Appl. Probab. 2001, 3, 271–293. [Google Scholar] [CrossRef]
  38. Janssen, J.; Manca, R. Semi-Markov Risk Models for Finance, Insurance and Reliability; Springer: New York, NY, USA, 2007. [Google Scholar]
  39. Gago, R.G.; Pinto, S.F.; Silva, J.F. G2V and V2G electric vehicle charger for smart grids. In Proceedings of the 2016 IEEE International Smart Cities Conference (ISC2), Trento, Italy, 3 October 2016. [Google Scholar] [CrossRef]
Disclaimer/Publisher’s Note: The statements, opinions and data contained in all publications are solely those of the individual author(s) and contributor(s) and not of MDPI and/or the editor(s). MDPI and/or the editor(s) disclaim responsibility for any injury to people or property resulting from any ideas, methods, instructions or products referred to in the content.

Article Metrics

Citations

Article Access Statistics

Multiple requests from the same IP address are counted as one view.