1. Introduction
Autonomous driving development primarily follows two directions: cooperative vehicle systems and individual vehicle intelligence. Compared to individual vehicle intelligence, cooperative vehicle technologies not only reduce vehicle production and R&D costs but also optimize the overall transportation network by enabling the seamless data exchange between vehicles and roadside systems. Cooperative vehicle infrastructure technology refers to the integration and coordination of vehicles with surrounding infrastructure systems through advanced communication technologies [
1]. This approach allows vehicles to exchange data with infrastructure components such as traffic signals, road sensors, and control centers to enhance traffic management and safety. The goal of cooperative vehicle infrastructure technology is to create a more intelligent transportation network by leveraging real-time information sharing, which can support applications such as adaptive traffic control, vehicle-to-everything (V2X) communication, and automated driving systems. By improving the interaction between vehicles and infrastructure, cooperative vehicle infrastructure technology aims to reduce traffic congestion, improve road safety, and enhance the overall efficiency of transportation systems. Currently, cooperative vehicle technology has emerged as the leading path for automated driving development in China.
The implementation and application of cooperative vehicle infrastructure systems are influenced by various factors, including key technologies, policies and regulations, capital markets, and public attitudes [
2]. Among these, key technologies, policies and regulations, and capital markets represent the supply-side conditions for cooperative vehicle infrastructure technology, while public attitudes reflect the demand-side impact. The ultimate service recipients of cooperative vehicle infrastructure technology are users, and its potential value can only be realized when users are willing to accept and use this technology. In the early stages of introducing cooperative vehicle infrastructure technology to the market, there is a growing focus on exploring the public’s intention to use this technology and the factors influencing it.
2. Literature Review
2.1. Factors Influencing Autonomous Driving Acceptance
Currently, most research on the willingness to use autonomous driving is based on surveys of user characteristics, such as gender, age, and income groups [
3] surveyed the willingness to use shared autonomous vehicles of Shanghai residents, and found that males, married individuals, high-income earners, highly educated individuals, freelancers, carpool commuters, and those under the age of 18 have a stronger willingness to use autonomous vehicles. Similarly, a large-scale citizen survey by Liljmo et al. [
4] indicated that males, highly educated individuals, users living in densely populated areas, and households without cars have a more positive attitude toward autonomous vehicles. In summary, research on the acceptance of autonomous driving based on user characteristics generally yields similar conclusions.
However, user acceptance of autonomous driving technology is influenced not only by user characteristics but also by psychological factors, such as trust in technology, perceived risks, and personal attitude. Therefore, researchers have incorporated these psychological factors into their studies alongside user characteristics. For example, Ren introduced three additional factors, perceived risk, service quality, and social impact, alongside users’ socioeconomic characteristics to analyze users’ choice regarding shared autonomous vehicles [
5]. Lajunen and Sullman surveyed elderly drivers’ preferences for various levels of autonomous vehicles based on criteria such as safety, credibility, enjoyment, reliability, comfort, ease of use, and attractiveness [
6]. Their approach provided a more reasoned perspective when examining users’ acceptance of autonomous vehicles.
2.2. Technology Acceptance Theories
Previous studies on autonomous driving acceptance often relied on a basic data analysis without strong theoretical foundations, limiting their ability to uncover complex relationships among influencing factors. To address this, researchers have incorporated established technology acceptance theories, such as the Technology Acceptance Model (TAM), Theory of Planned Behavior (TPB), and Unified Theory of Acceptance and Use of Technology (UTAUT). Among these, the TAM model has been widely adopted [
7]. For instance, Li et al. extended the TAM by importing external variables to create a research framework for autonomous vehicle acceptance [
8]. Zhang et al. utilized the TAM to investigate the impact of initial trust and perceived risk on the public acceptance of autonomous driving [
9]. Wei et al. integrated cognitive theory with the TAM, introducing privacy concerns and privacy loss variables to develop an acceptance model for autonomous driving technology [
10].
But most research on autonomous driving acceptance has primarily concentrated on individual vehicle intelligence, with only recent studies delving into the acceptance of cooperative vehicle infrastructure autonomous driving. Li et al. established an extended TAM for the driver acceptance of cooperative vehicle infrastructure technology by incorporating variables such as warning service quality, distraction perception, personal innovativeness, and trust [
11]. Zhang et al. introduced five factors, including trust, perceived safety risk, perceived privacy risk, reliability, and social influence, into the basic framework of the TAM to construct an extended model for the acceptance of cooperative vehicle infrastructure technology [
12]. However, studies in this area are still relatively scarce.
The literature review reveals a notable research gap in the acceptance of cooperative vehicle infrastructure technology. Existing studies tend to be structurally limited and lack an in-depth analysis of inter-factor interactions. Therefore, this paper constructs a more comprehensive acceptance model and employs structural equation modeling and the Bayesian network model for quantitative analysis, examining user acceptance, the impact of various factors, and their interactions.
The subsequent sections are organized as follows:
Section 3 presents the extended TAM construction.
Section 4 covers the data collection and analysis.
Section 5 utilizes the structural equation model to assess the variable relationships and significance.
Section 6 employs the Bayesian network model to prioritize the influencing factors. Finally,
Section 7 summarizes the research findings and offers policy recommendations.
3. Model Construction
3.1. Development of Hypotheses
The basic TAM is proposed by Davis [
13]. It comprises four basic variables: perceived usefulness (PU), perceived ease of use (PEU), attitude (ATT), and intention to use (IU). But the basic model has limitations as it does not consider subjective norm factors, which represent the influence of external individuals or groups on decision-making. To address these limitations, this paper introduces external variables of social influence (SI). Furthermore, considering the feature of the technology, two more external variables, facilitating conditions (FC) and individual innovation (II), are incorporated to extend the model.
3.2. Basic Variables
Perceived usefulness reflects the extent to which the technology enhances individual work efficiency, while perceived ease of use reflects the ease or difficulty of individual use of the technology. Attitude refers to the user’s positive or negative feelings toward the new technology, while intention to use represents the likelihood of the user engaging in purchasing or using the new technology. Building upon the basic TAM, the paper raises the following path hypotheses:
H1: Perceived ease of use has a significant positive effect on perceived usefulness.
H2: Perceived ease of use has a significant positive effect on the public’s attitude.
H3: Perceived usefulness has a significant positive effect on the public’s attitude.
H4: Perceived usefulness will significantly influence the intention to use the cooperative vehicle infrastructure technology.
H5: The public’s attitude toward the technology significantly influences their intention to use.
3.3. Extended Variables
Social influence (SI): This refers to the influence of important or influential individuals on an individual’s willingness to use when making decisions [
14]. This can include the opinions of friends and relatives, recommendations from experts or authorities, and so on. The two hypotheses are proposed in this paper:
H6: Social influence has a significant positive effect on perceived usefulness.
H7: Social influence has a significant positive effect on perceived ease of use.
Individual innovation (II): The individual innovation is defined as the willingness of users to try out a new technology [
14,
15,
16]. Users with a higher willingness to innovate are typically more willing to be early adopters and experiment with new technologies when they become available. The paper makes the following hypotheses:
H8: Individual innovation has a significant positive effect on perceived usefulness.
H9: Individual innovation has a significant positive effect on user attitudes.
H10: Individual innovation has a significant positive effect on perceived ease of use.
Facilitating conditions (FC): Facilitating conditions represent the extent to which individuals perceive existing conditions as supportive of using new technology [
14]. The completeness of the infrastructure and related regulatory policies will greatly impact the public adoption of cooperative vehicle infrastructure technology. The following hypotheses are proposed:
H11: Facilitating conditions significantly influence user attitude.
H12: Facilitating conditions significantly influence user intention to use.
3.4. Model Framework
The paper presents 12 path hypotheses and constructs an extended Technology Acceptance Model. The model framework is illustrated in
Figure 1.
4. Data Collection
4.1. Data Description
As the variables in the model are unobservable and cannot be directly measured or observed, these variables are considered latent variables. Measurement items have been established for each latent variable to indirectly assess the magnitude of these latent variables (
Table 1). The questionnaire was structured using a Likert scale, which asked respondents to rate their level of agreement with various statements related to the acceptance of cooperative vehicle infrastructure technology. The statements were designed to measure latent variables such as perceived usefulness, perceived ease of use, social influence, and facilitating conditions, in accordance with the extended TAM model. A total of 264 valid responses were collected. The questionnaire included both close-ended and open-ended questions to ensure a comprehensive understanding of user acceptance. The use of a Likert scale enabled the measurement of the degrees of agreement, providing insights into the respondents’ attitudes and intentions to use the technology.
It should be noted that we have supplemented the explanation of the survey results by providing detailed information regarding the respondents, the time, and the location of the survey, as follows:
Respondents: The respondents included professionals and individuals with relevant knowledge of Cooperative Vehicle Infrastructure Technology.
Survey Timeframe: The survey was conducted between December 2023 and February 2024.
Survey Location: The respondents were surveyed in Nanjing, Chengdu, and Shanghai, China.
Sampling Methodology: Due to the emerging nature of the technology, a non-probability sampling method was employed, focusing on individuals likely to be early adopters or influencers in this field.
In addition, the distribution information of the respondents’ gender, age, and place of residence is shown in
Figure 2.
4.2. Data Analysis
Reliability is used to assess the consistency and dependability of the data, which is typically evaluated using Cronbach’s coefficient (Cronbach’s ∂) and Composite Reliability (CR). When both coefficients are greater than 0.6, it indicates good reliability of the data. The calculation results in
Table 2 demonstrate good reliability of the questionnaire data.
4.3. Validity Analysis
Validity assesses how accurately measurement items represent variable attributes. It includes convergent and discriminant validity. Convergent validity is assessed through standardized loadings and Average Variance Extracted (AVE). Good convergent validity is indicated when both of these values exceed 0.5. Discriminant validity is assessed based on the square root of AVE compared to the correlations with other latent variables. When the square root of AVE is greater than the correlations with other latent variables, it indicates good discriminant validity. The computation results in
Table 2 and
Table 3 demonstrate that the data meet the requirements for both convergent and discriminant validity.
5. Structural Equation Model
The Structural Equation Model (SEM) is a statistical method that analyzes the relationships between variables based on their covariance matrix. It consists of two main components: the measurement model and the structural model. The measurement model describes the relationships between observed variables and latent variables, while the structural model represents the relationships among latent variables.
5.1. Model Fit Analysis
The paper evaluates the fit of the model by calculating fit indicators to assess the compatibility between the questionnaire data and the model hypotheses.
Table 4 shows that all model parameter values meet the critical threshold, indicating a good model fit between the questionnaire data and the proposed model.
5.2. Path Hypotheses Testing
Table 5 summarizes the results for the 12 path hypotheses. The
p-value reflects the significance of each path, with three (H2, H4, and H11) supported at a 0.05 confidence level, and all others at a 0.001 confidence level.
Among the new variables introduced in this study, social influence significantly impacts perceived usefulness (β = 0.313,
p < 0.001) and perceived ease of use (β = 0.451,
p < 0.001). Personal innovation not only affects perceived usefulness (β = 0.344,
p < 0.001) and perceived ease of use (β = 0.305,
p < 0.001) but also positively influences attitude (β = 0.305,
p < 0.001). Facilitating conditions have a positive impact on perceived ease of use (β = 0.139,
p < 0.05) and behavioral intention (β = 0.135,
p < 0.001).
Figure 3 displays the results of the hypothesis testing.
5.3. Bayesian Network
The paper introduces Bayesian networks (BNs) to determine the priority of each influencing factor. A Bayesian network is a directed acyclic graph composed of nodes representing variables and directed edges connecting these nodes. In this study, nodes represent the influencing factors of the intention to use cooperative vehicle infrastructure technology, and directed edges represent the hypothesized relationships between variables. The basic form of the joint probability distribution in Bayesian theory is as follows:
where
represents random variables,
is the prior probability of
,
is the set of parent nodes of
, and
is the conditional probability of each observed variable under its parent nodes.
To enhance the reproducibility of the study, we clarified the assignment of variables into specific states. The variables were assigned to three categories—low, medium, and high—based on their factor loadings from the Structural Equation Model (SEM) analysis. The K-means clustering method was employed to group the variables into these three states, ensuring that each category represented distinct intervals based on the frequency distribution of the data. The prior probabilities for these states were calculated from the observed data, and then used in the Bayesian network for further analysis. The prior probabilities for each node were then calculated based on the frequency of states for each node. Then, the prior probabilities of the independent variables were input into the BN model, followed by model updating using the Expectation Maximization algorithm to calculate conditional probability distributions.
Figure 4 displays the updated network model. The updated network model achieved an accuracy of approximately 85% in predictions. In the context of behavioral and social science research, this level of accuracy is generally considered high, as models dealing with human behavior and decision-making often encounter a greater degree of variability. For comparison, similar studies in technology acceptance modeling have reported accuracies ranging from 70% to 85%. Therefore, while the model’s accuracy is robust, it reflects the inherent complexities of predicting user behavior regarding emerging technologies such as cooperative vehicle infrastructure.
6. Results Analysis
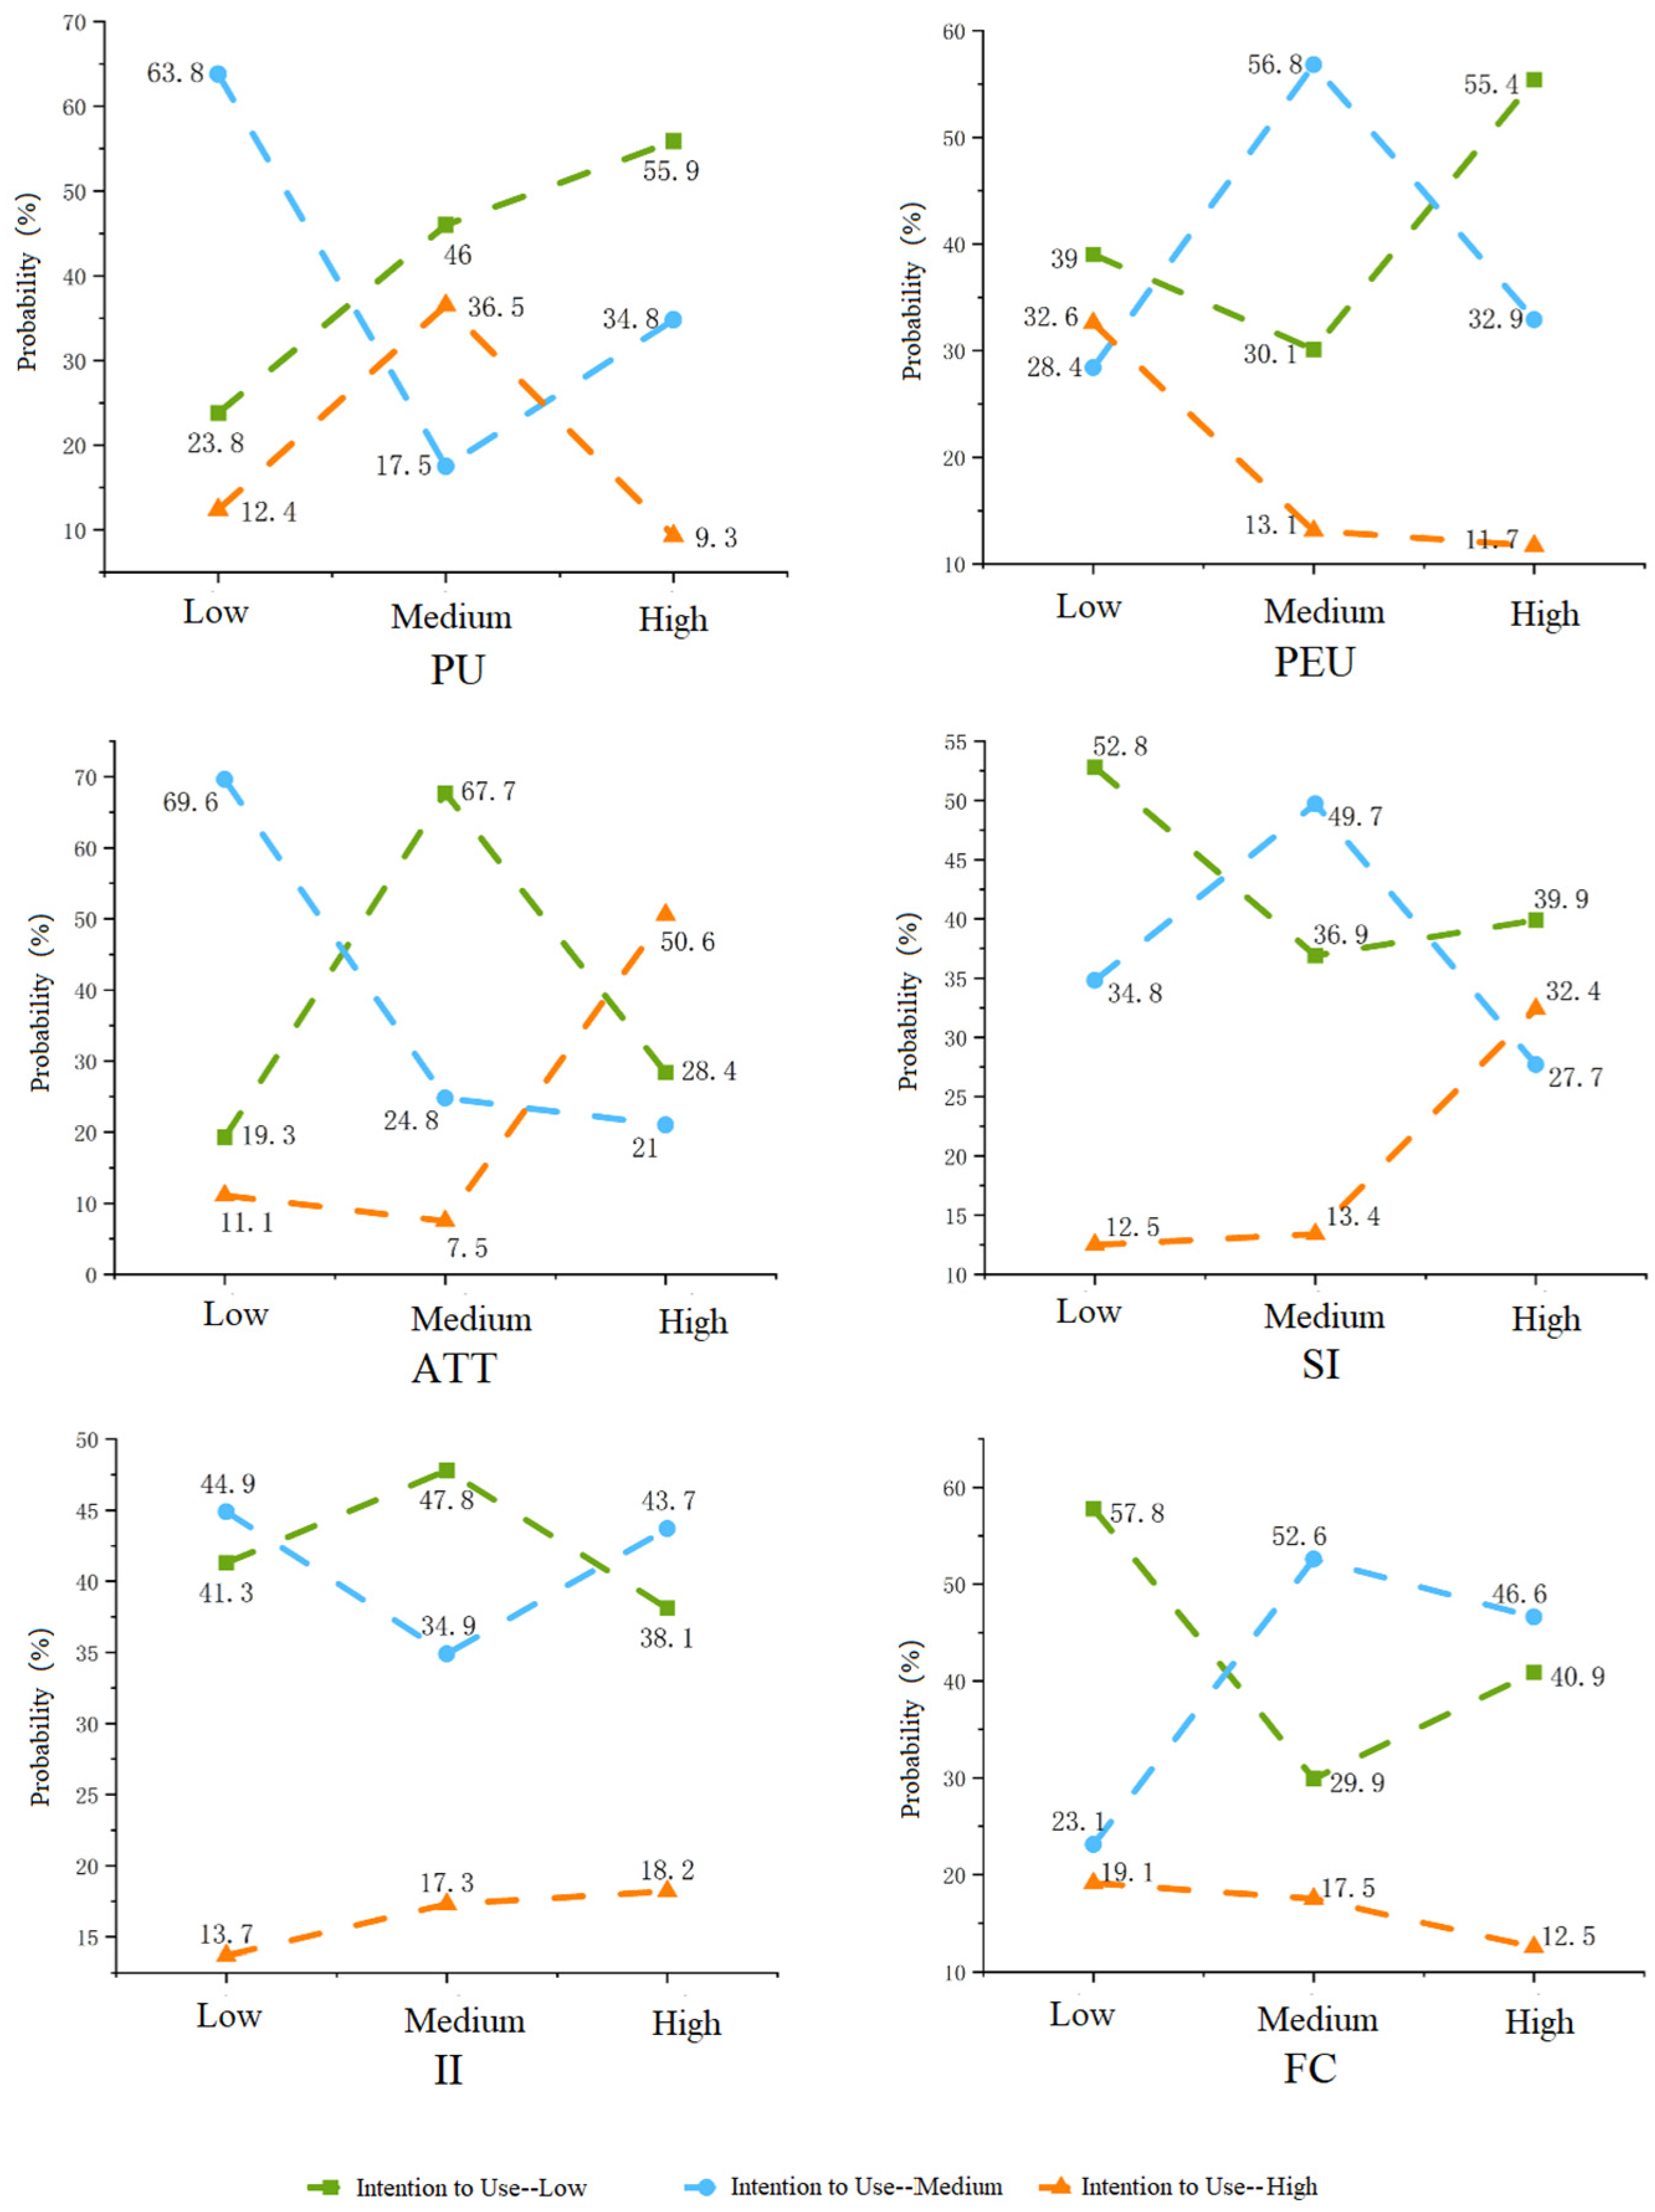
In the Bayesian inference of the study, the probabilities of the three states (“low”, “medium”, and “high”) for the six variables are set to 100% successively, and the probability changes for the three states of intention to use are calculated.
Figure 5 displays the Bayesian inference results. The analysis results indicate that attitude has the most significant impact on willingness to use. When the attitude variable changes from “low” to “medium” and then to “high”, the probability of “high” willingness to use increases from 11.1% to 50.6%. The three extension variables proposed in the paper also positively influence willingness to use. When the states of social influence and individual innovation change from “low” to “high”, the probability of “high” willingness to use continually increases by 159.2% and 32.8%, respectively.
In the Bayesian diagnosis of the study, the probabilities of the three states (“low”, “medium“, and high”) of intention to use are each set to 100%, and the probability changes for the three states of the influencing variables are calculated.
Figure 6 illustrates the reverse diagnosis results for “high” intention to use. The analysis results reveal that, when the intention to use variable is in the “high” state, attitude plays the most substantial role. Its “high” state probability increases from 15.2% to 52.8%. Among the three extension variables proposed by the model, social influence and facilitating conditions experience slight changes in all three states, with social influence showing a slight increase in the “high” state probability and facilitating conditions experiencing a slight decrease.
In order to analyze the importance of the influencing factors, the paper conducted a sensitivity analysis using Mutual Information (MI). Higher MI values indicate stronger correlations between variables. The results shown in
Table 6 indicate that attitude and perceived usefulness have the greatest impact on the intention to use cooperative vehicle infrastructure technology, while personal innovation and social influence have the smallest impact.
7. Conclusions
This study expands the research on the acceptance of cooperative vehicle infrastructure technology by presenting an extended TAM model and analyzing relationships using both the SEM and BN methods. The findings highlight the significant roles of perceived usefulness, social influence, and facilitating conditions in shaping the public’s intention to adopt this emerging technology. Specifically, perceived usefulness had the strongest influence on acceptance, suggesting that users are more likely to adopt the technology if they see clear personal benefits. Social influence also plays a crucial role, particularly in early adoption stages, indicating that authoritative endorsements and peer influence could increase public trust in the system.
However, we acknowledge certain limitations in the study. Since cooperative vehicle infrastructure technology is not yet widely deployed, the respondents’ lack of practical experience may have impacted their perceptions. This limitation should be addressed in future studies by incorporating respondents with varying levels of exposure to the technology.
For future research, we plan to expand the sample size and explore additional factors that were not fully addressed in this study, such as cost implications, privacy concerns, and safety issues. These aspects are likely to become more prominent as the technology moves closer to widespread implementation. Longitudinal studies tracking changes in public acceptance over time, as the technology becomes more accessible, will also be conducted.
The following recommendations are offered based on our findings:
Accelerate infrastructure development and enhance legal frameworks to support cooperative vehicle infrastructure systems. Improving road infrastructure and implementing clear legal safeguards will greatly enhance public confidence and acceptance.
Leverage online platforms and expert endorsements to raise awareness and educate the public about the benefits of cooperative vehicle infrastructure. Public campaigns led by authoritative voices can significantly boost trust and the willingness to adopt to technology.
Provide hands-on trial opportunities for consumers to experience the technology first-hand. Establishing pilot programs or demonstration sites could help overcome resistance by offering direct interaction with the system.
Author Contributions
Writing—original draft preparation, W.B.; software, Y.Y.; methodology, L.L. All authors have read and agreed to the published version of the manuscript.
Funding
This research was supported by the Intelligent Policing Key Laboratory of Sichuan Province, No ZNJW2024KFMS001 and the National Natural Science Foundation of China under Grant No. 52202408.
Data Availability Statement
The original contributions presented in this study are included in the article. Further inquiries can be directed to the corresponding author.
Conflicts of Interest
The authors declare no conflicts of interest.
References
- Xu, Z.G.; Li, J.; Zhao, X.; Li, L.; Wang, Z.; Tong, X.; Tian, B.; Hou, J.; Wang, G.; Zhang, Q. A Review on Intelligent Road and Its Related Key Technologies. China J. Highw. Transp. 2019, 8, 1–24. [Google Scholar]
- Huo, Y.Y.; Guo, C.; Zhu, Y.; Feng, C.X. Use Intention Model of Shared Autonomous Vehicles and Its Impact Factors. J. Northeast. Univ. (Nat. Sci.) 2021, 7, 1057–1064. [Google Scholar]
- Li, J.; He, Y.; Sun, C.; Peng, J.; Chen, T. An Acceptance Model and Risk Analysis of Automated Vehicle Based on SEM. J. Transp. Inf. Saf. 2021, 1, 26–34. [Google Scholar]
- Liljamo, T.; Liimatainen, H.; Pöllänen, M. Attitudes and Concerns on Automated Vehicles. Transp. Res. Part. F Psychol. Behav. 2018, 59, 24–44. [Google Scholar] [CrossRef]
- Ren, H.L. Preferences for Shared Autonomous Vehicles Based on the Mixed Logit Model. J. Guizhou Univ. (Nat. Sci.) 2022, 5, 105–110. [Google Scholar]
- Lajunen, T.; Sullman, M.J.M. Attitudes Toward Four Levels of Self-Driving Technology Among Elderly Drivers. Front. Psychol. 2021, 12, 682973. [Google Scholar] [CrossRef] [PubMed]
- Jing, P.; Yuan, D.B.; Du, L.Y.; Xu, G.; Chen, Y.X.; Zhan, F.P. Research of Acceptance of Autonomous Vehicles Technology Based on Mapping Knowledge Domain. J. Jiangsu Univ. (Nat. Sci. Ed.) 2023, 1, 14–21. [Google Scholar]
- Li, Y.T.; Ye, X. Residents’ Willingness to Use Shared Autonomous Vehicles in Shanghai. China Transp. Rev. 2023, 3, 163–169. [Google Scholar]
- Zhang, X.Q.; Mao, W.; Luo, Y.L.; Du, Z.H.; Wang, G. Modeling and Gender Difference Analysis of Acceptance of Cooperative Vehicle Infrastructure System. China J. Highw. Transp. 2021, 7, 177–187. [Google Scholar]
- Wei, X.X.; Zhong, S.Q. Understanding the Acceptance Intentions of Automated Vehicles Based on TAM and Cognitive Theory. China Transp. Rev. 2019, 11, 79–84. [Google Scholar]
- Li, Z.L.; Xing, G.Y.; Li, J.; Zhao, X.H. Driver’s Acceptance of Cooperative Vehicle Infrastructure System Based on Extended TAM. China J. Highw. Transp. 2021, 7, 188–200. [Google Scholar]
- Zhang, T.R.; Tao, D.; Qu, X.; Zhang, X.; Lin, R.; Zhang, W. The Roles of Initial Trust and Perceived Risk in Public’s Acceptance of Automated Vehicles. Transp. Res. Part C 2019, 98, 207–220. [Google Scholar] [CrossRef]
- Davis, F.D. Perceived Usefulness, Perceived Ease of Use, and User Acceptance of Information Technology. MIS Q. 1989, 13, 319–340. [Google Scholar] [CrossRef]
- Venkatesh, V.; Morris, M.G.; Davis, G.B.; Davis, F.D. User acceptance of information technology: Toward a unified view. MIS Q. 2003, 27, 425–478. [Google Scholar] [CrossRef]
- Agarwal, R.; Prasad, J. A Conceptual and Operational Definition of Personal Innovativeness in the Domain of Information Technology. Inf. Syst. Res. 1998, 9, 204–215. [Google Scholar] [CrossRef]
- Chen, Y.L.; Khan, S.K.; Shiwakoti, N.; Stasinopoulos, P.; Aghabayk, K. Analysis of Australian Public Acceptance of Fully Automated Vehicles by Extending Technology Acceptance Model. Case Stud. Transp. Policy 2023, 14, 101072. [Google Scholar] [CrossRef]
| Disclaimer/Publisher’s Note: The statements, opinions and data contained in all publications are solely those of the individual author(s) and contributor(s) and not of MDPI and/or the editor(s). MDPI and/or the editor(s) disclaim responsibility for any injury to people or property resulting from any ideas, methods, instructions or products referred to in the content. |
© 2024 by the authors. Published by MDPI on behalf of the World Electric Vehicle Association. Licensee MDPI, Basel, Switzerland. This article is an open access article distributed under the terms and conditions of the Creative Commons Attribution (CC BY) license (https://creativecommons.org/licenses/by/4.0/).


