1. Introduction
The used EV market is gaining in volume as pioneers do not find the technology adequate or they adopt newer models. A large used EV market is necessary to foster wide adoption of the technology. Presently, in developed countries as well as emerging markets, a second-hand ICE vehicle is the primary method of acquisition of a car. As an illustration, in the European Union, 80% of drivers buy a used car, a number that reaches 90% in developing countries [
1]. In the USA (United States of America), on average, 70% of cars are bought used, while less than 20% of less affluent families acquire a new vehicle [
2].
As EVs become a mainstream means of transport, the number of second-hand cars is increasing, even if among new vehicle registrations the ratio of used to new EVs remains small. There are a total of about 40 million EVs on the roads after almost 14 million new registrations in 2023. Among the 14 million vehicles, the USA accounted for only 10%, Europe for 25%, and China alone for 60%. Regarding the used EV market, 400,000 vehicles changed owners in the USA, about 450,000 in Europe, and 800,000 in China alone during the same period. In 2024, in the USA, second-hand EV sales grew about 40% compared to 2023. Even though this augmentation is noticeable, the used EV market is a very small proportion of the market compared to used ICE vehicles, which is a fully matured market: 36 million cars in the USA, about 30 million in Europe, and 20 million in China.
Nevertheless, the price of used EVs is on a continuous verge of dropping, consequently making them an increasingly more competitive option compared to their ICE counterparts. The main criteria for buyers to commit to the acquisition of an EV is affordability, followed by range. It is therefore understandable that affordability will stand as leverage to increase the market share of second-hand EVs. The reference price of USD 30,000 is already above the price of a significant proportion of used EVs in the United States [
3]. It is even expected that the prices will fall closer to USD 25,000. These lower prices will make these vehicles candidates for a USD 4000 federal tax rebate, making them a more credible alternative to ICE cars. In 2023, a used Tesla, one of the top selling EV brands in the world, could commonly be found for around USD 50,000, dropping to barely above USD 33,000 at the beginning of 2024. This makes them direct alternatives to used SUVs or even new cars. In Europe, pre-owned EVs may be found in the market between EUR 15,000 and EUR 25,000 (USD 16,000–27,000), while plug-in hybrids are sold around EUR 30,000 (USD 32,000). In 2023, second-hand EVs in China were sold on average at around CNY 75,000 (USD 11,000) [
3].
While subsidies for used EVs have been proposed in some European countries, such as the Netherlands (EUR 2000), it is worth noting that incentives for new vehicles have decreased constantly since 2020 but have remained constant for used vehicles. EUR 1000 subsidies are currently offered in France for used EVs.
Most important EV markets present the same drivers for used and new EVs, although the difference in subsidies is generally more significant for new EVs. Along with subsidies, technological progress is another important factor driving the used EV market, as well as depreciation [
4,
5].
There were 8.1 million new EV registrations in China in 2023, corresponding to a 35% increase from 2022. With only 500,000 second-hand passenger EVs sold in 2020 and 80,000 units that changed owners in 2023, the share of the used EV market remains relatively negligible [
6]. These were mostly compact short-range vehicles that were part of the larger proportion of EVs sold in China between 2015 and 2019 [
6]. The subsidies in China were calculated based on the EV range, and some models on the market were offered to receive a maximum benefit from subsidies instead of just buyers’ needs. It should be noted that, despite the small market share, the second-hand EV market is an important reality to be considered by the EV industry as evidence of the growing confidence among buyers. Such confidence may soon increase with manufacturers’ extended battery warranties, which may lead to significant changes in the years to come. The increasing maturity of battery technology may lead to a more important used EV market share as the standard range is nearing 400 km after an average increase of 13% per year since 2011.
The outcome of a study based on 20,000 second-hand EVs sold in China shows a value diminution of 45% observed after the first year, 58% the year after, and 67% after three years of operation [
7,
8]. EVs in China depreciate much faster than ICE cars or EVs in other important markets. ICE vehicles in China retain 60% to 75% of their value after the first three years of operation. A classical dealer’s margin can be considered to be relatively small as it is under USD 425 [
9]. The faster depreciation of EVs in China relative to other markets is due to the fast technological progress making older models prematurely obsolete. High-end EVs, such as Tesla models, hold their value better [
10,
11,
12,
13], which raises hopes for the future of EVs.
While the second-hand EV market in China remains small, there is considerable opportunity for exports. China has consistently emerged as a global leader in the automobile sector, encompassing both EVs and ICE cars. In recent years, the exports of new vehicles from China have increased. In 2023, China exported 1.07 million automobiles, with almost 40% of them being electric vehicles, overtaking Japan to take the top spot worldwide. The year 2009 signified a major shift as China surpassed the USA in new car sales [
14]. China’s second-hand vehicle exports have increased since the legalization of exporting used cars in 2019. The expansion of the automobile sector in China offers a considerable chance for exporting pre-owned cars to regions like sub-Saharan Africa and other emerging countries in general [
15].
EVs are the main method for reducing carbon emissions in road transport worldwide. Developing countries that presently rely on imported pre-owned vehicles are likely to design their future fleets around used EVs from advanced nations, analogous to the way ICE cars are repurposed.
Developing countries needing charging facilities for their EV fleets may require assistance from partners. In 2021, China sent out about 20,000 pre-owned vehicles, which jumped to 70,000 used cars in 2022, with 70% of them being EVs.
In 2023, the Chinese Ministry of Commerce changed its policy by permitting the export of used cars from the entire nation. In 2019, exports were allowed from just 27 areas (cities and provinces).
Several factors can influence the decision to choose a used EV instead of a new one. Affordability takes the primary role, although it acts as a double-edged sword; the declining expense of EVs is now a reality, but, as long as subsidies keep new EVs affordable, choosing a used EV over a new one will not be straightforward. Subsidies negatively affect depreciation, and the same applies to the decreased range linked to battery wear and swift technological progress that makes older EV models obsolete quickly, further adding to their depreciation.
As in the matured ICE vehicle market, currently, a key parameter in the EV transition is estimating the timeframe for when new and used EVs will achieve equilibrium in their market shares. The aim of this paper is to contribute to closing the gap in the literature on EVs by introducing a model that characterizes the dynamics leading to equilibrium in the growth of the used market share compared to new EVs during the transition period. In its assumption, the model considers an S-curve for the adoption of both new and used EVs. The S-curve parameters for the adoption of new EVs are derived from gathered data, a theoretical ratio between new and used EVs is considered as an input variable, and the output indicates the duration required to achieve equilibrium in the proportions of new and used EVs in new registration once the EV transition is completed. This type of approach is innovative within the literature concerning electric transport. The two varieties of S-curves differ in their prerequisites for initiating and advancing at a specific rate of adoption. The variation in the parameters of the S-curves for new EVs versus used EVs will be incorporated to illustrate the time-independent rate of adoption for each of these two types of vehicles. The trend of adopting second-hand EVs might indicate the rapid depreciation of EVs, which could lead to a slower uptake of used EVs. Rapid depreciation contrasted with strong demand for used EVs will be factored into the S-curve equation.
The approach in this study relies on gathering data to derive the parameters of the S-curve that illustrate the uptake of new EVs. The S-curve for pre-owned EVs is determined by parameters chosen according to two significantly different scenarios: strong demand for used EVs or low demand that may relate to rapid depreciation of EVs.
2. The S-Curve and the EV Transition
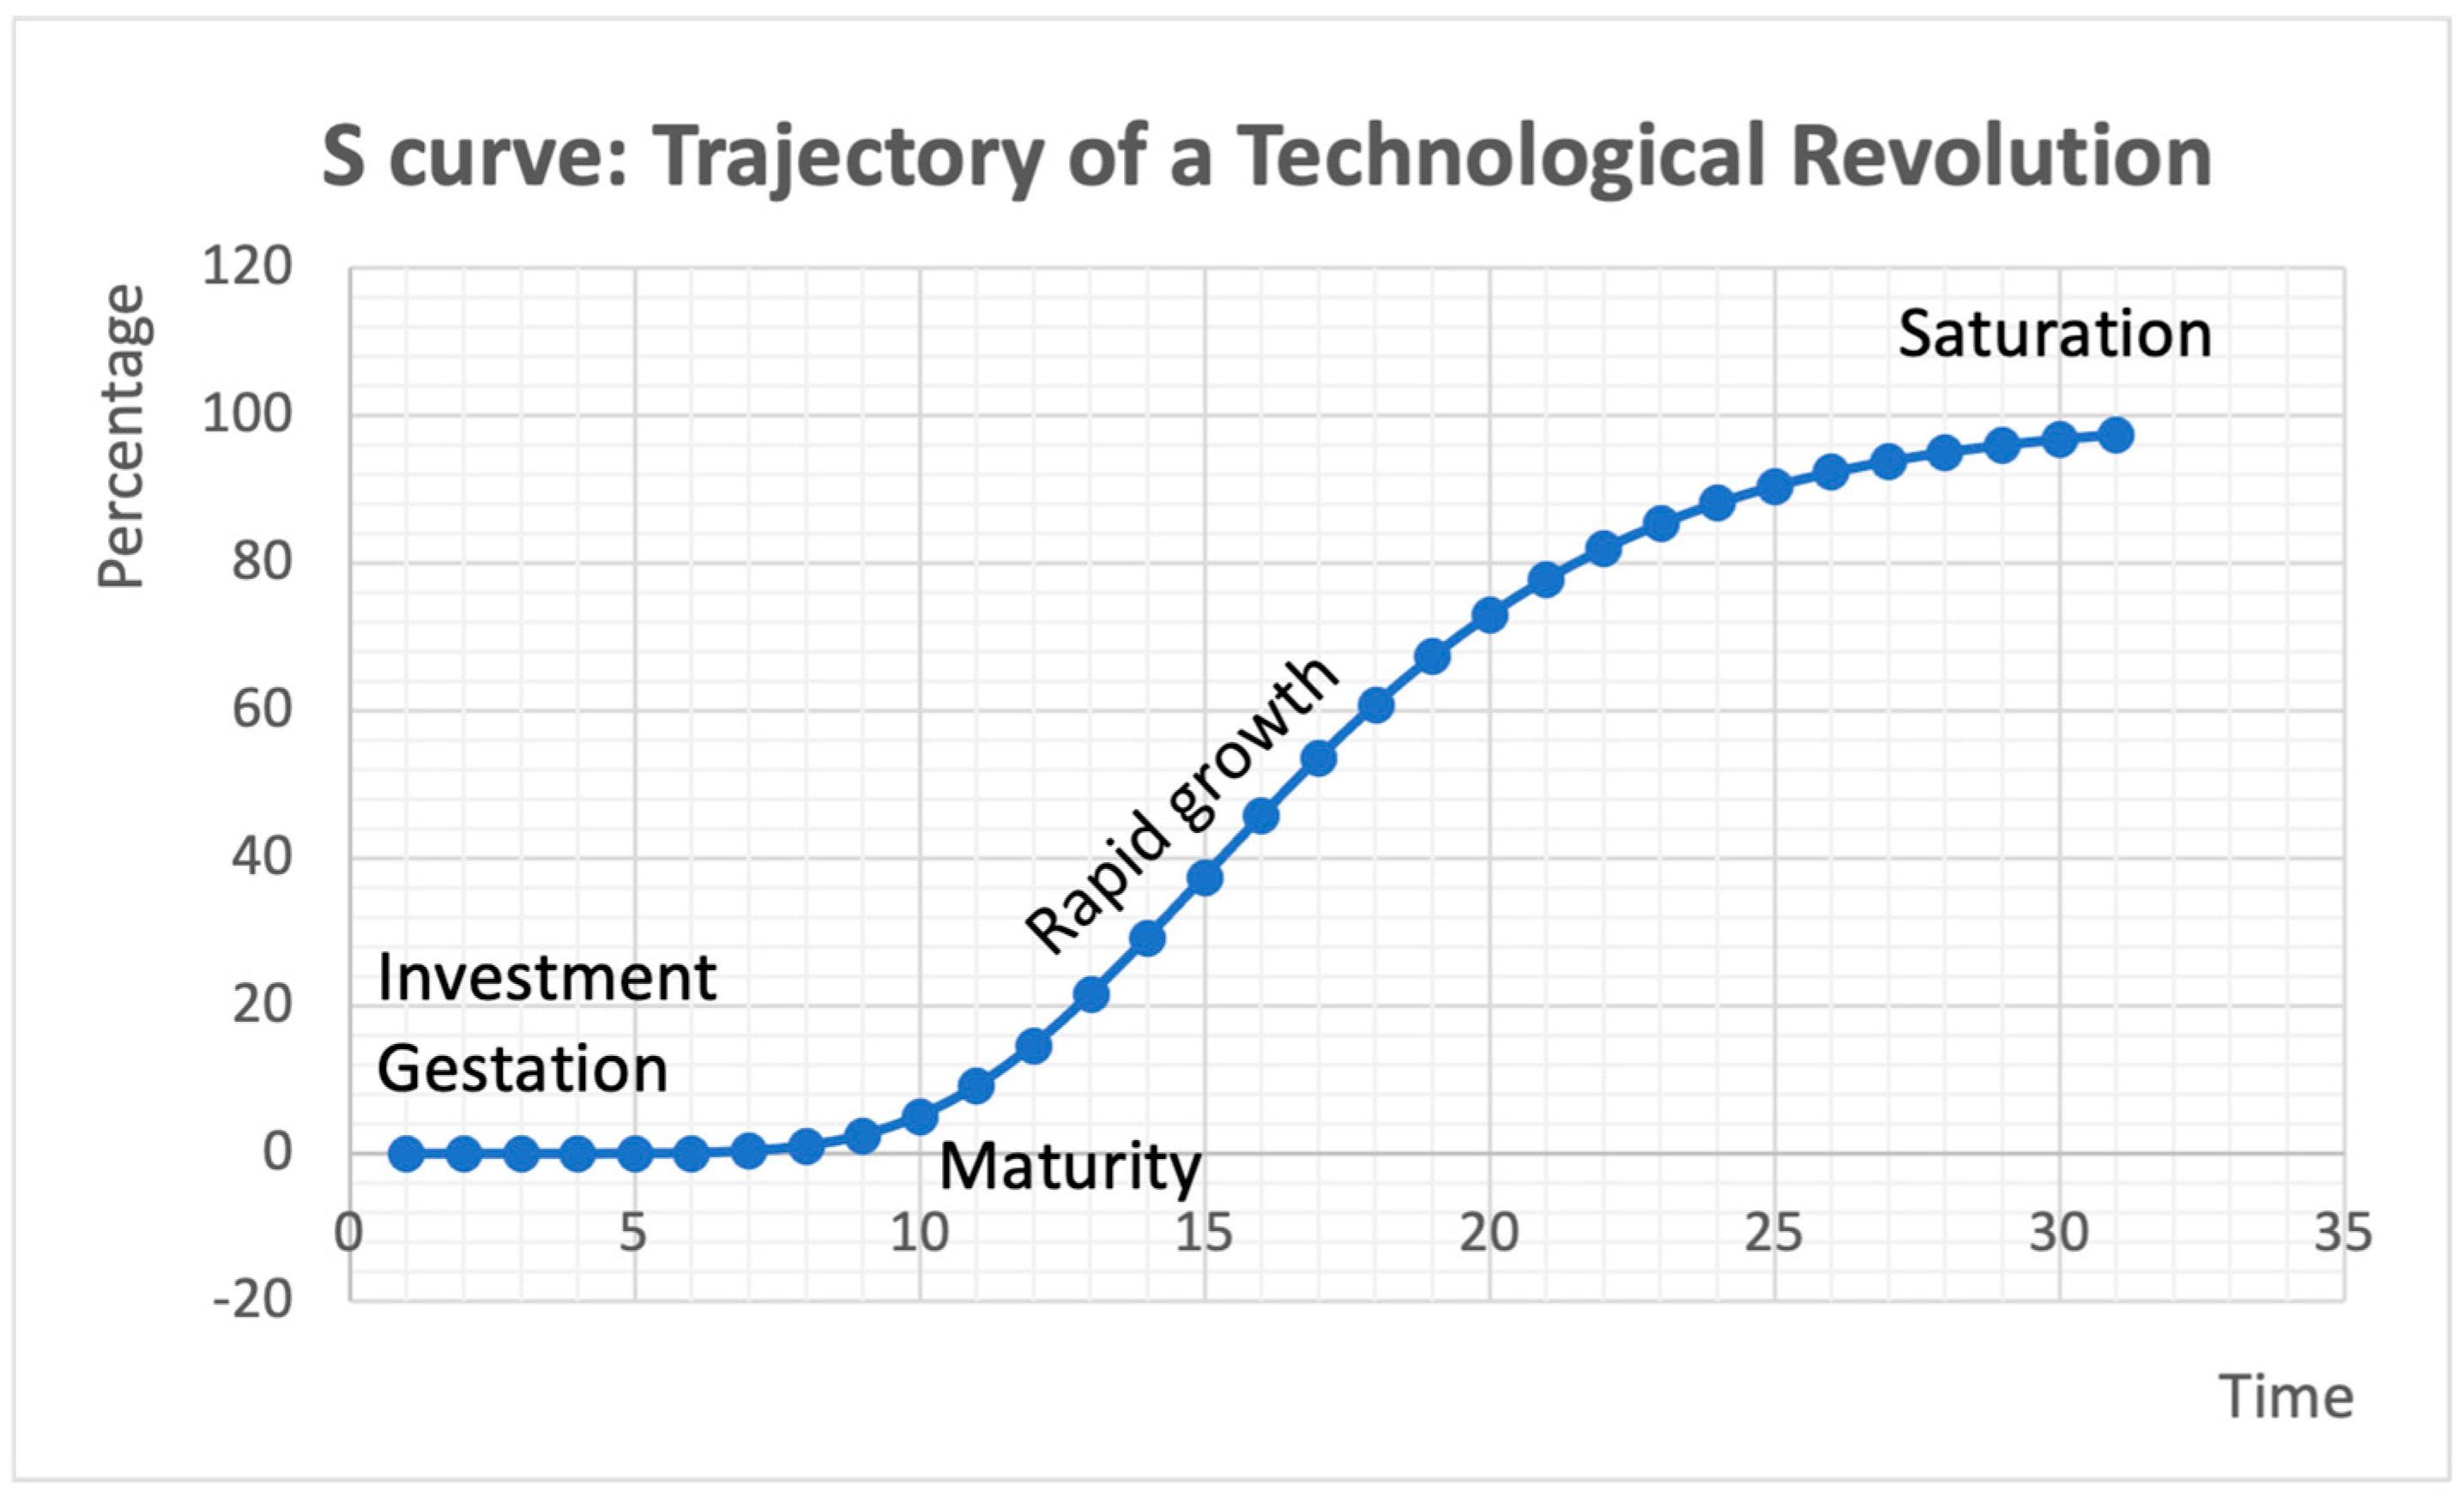
The adoption of a technological innovation within a society takes a non-linear trajectory referred to as an S-curve (
Figure 1); the initial phase is slow, the following phase accelerates quickly, and the final phase slows down, signifying saturation. The S-curve’s shape is linked to system feedback: economies of scale, social diffusion, and technological reinforcement. As a market innovation, the embrace of the EV progresses along an S-curve as illustrated in
Figure 1, consisting of an introductory phase, a period of rapid growth, and ultimately a saturation phase [
16,
17,
18].
The curve’s slope indicates the speed at which the technology gains acceptance following its initial introduction phase; this will rely on the context of each market before achieving full adoption. The initial pickup is gradual, followed by rapid growth, and then a slowdown before saturation occurs, ultimately leading to a complete transition, as observed in any S-curve that represents market penetration.
The significant rise in new registrations across all nations occurs at a turning point that aligns with maturity in
Figure 1, suggesting a sense of confidence from consumers once pioneers enter the market. This is followed by rapid growth to a specific point before a gradual decline to persuade the most hesitant customers. When efficiency is demonstrated and a strong foundation of trust is established, most buyers will invest in the embraced innovation. The final group of purchasers emerge gradually to finalize the complete EV transition. Among all the purchasers, some can purchase new items, while others will wait until they can access second-hand products.
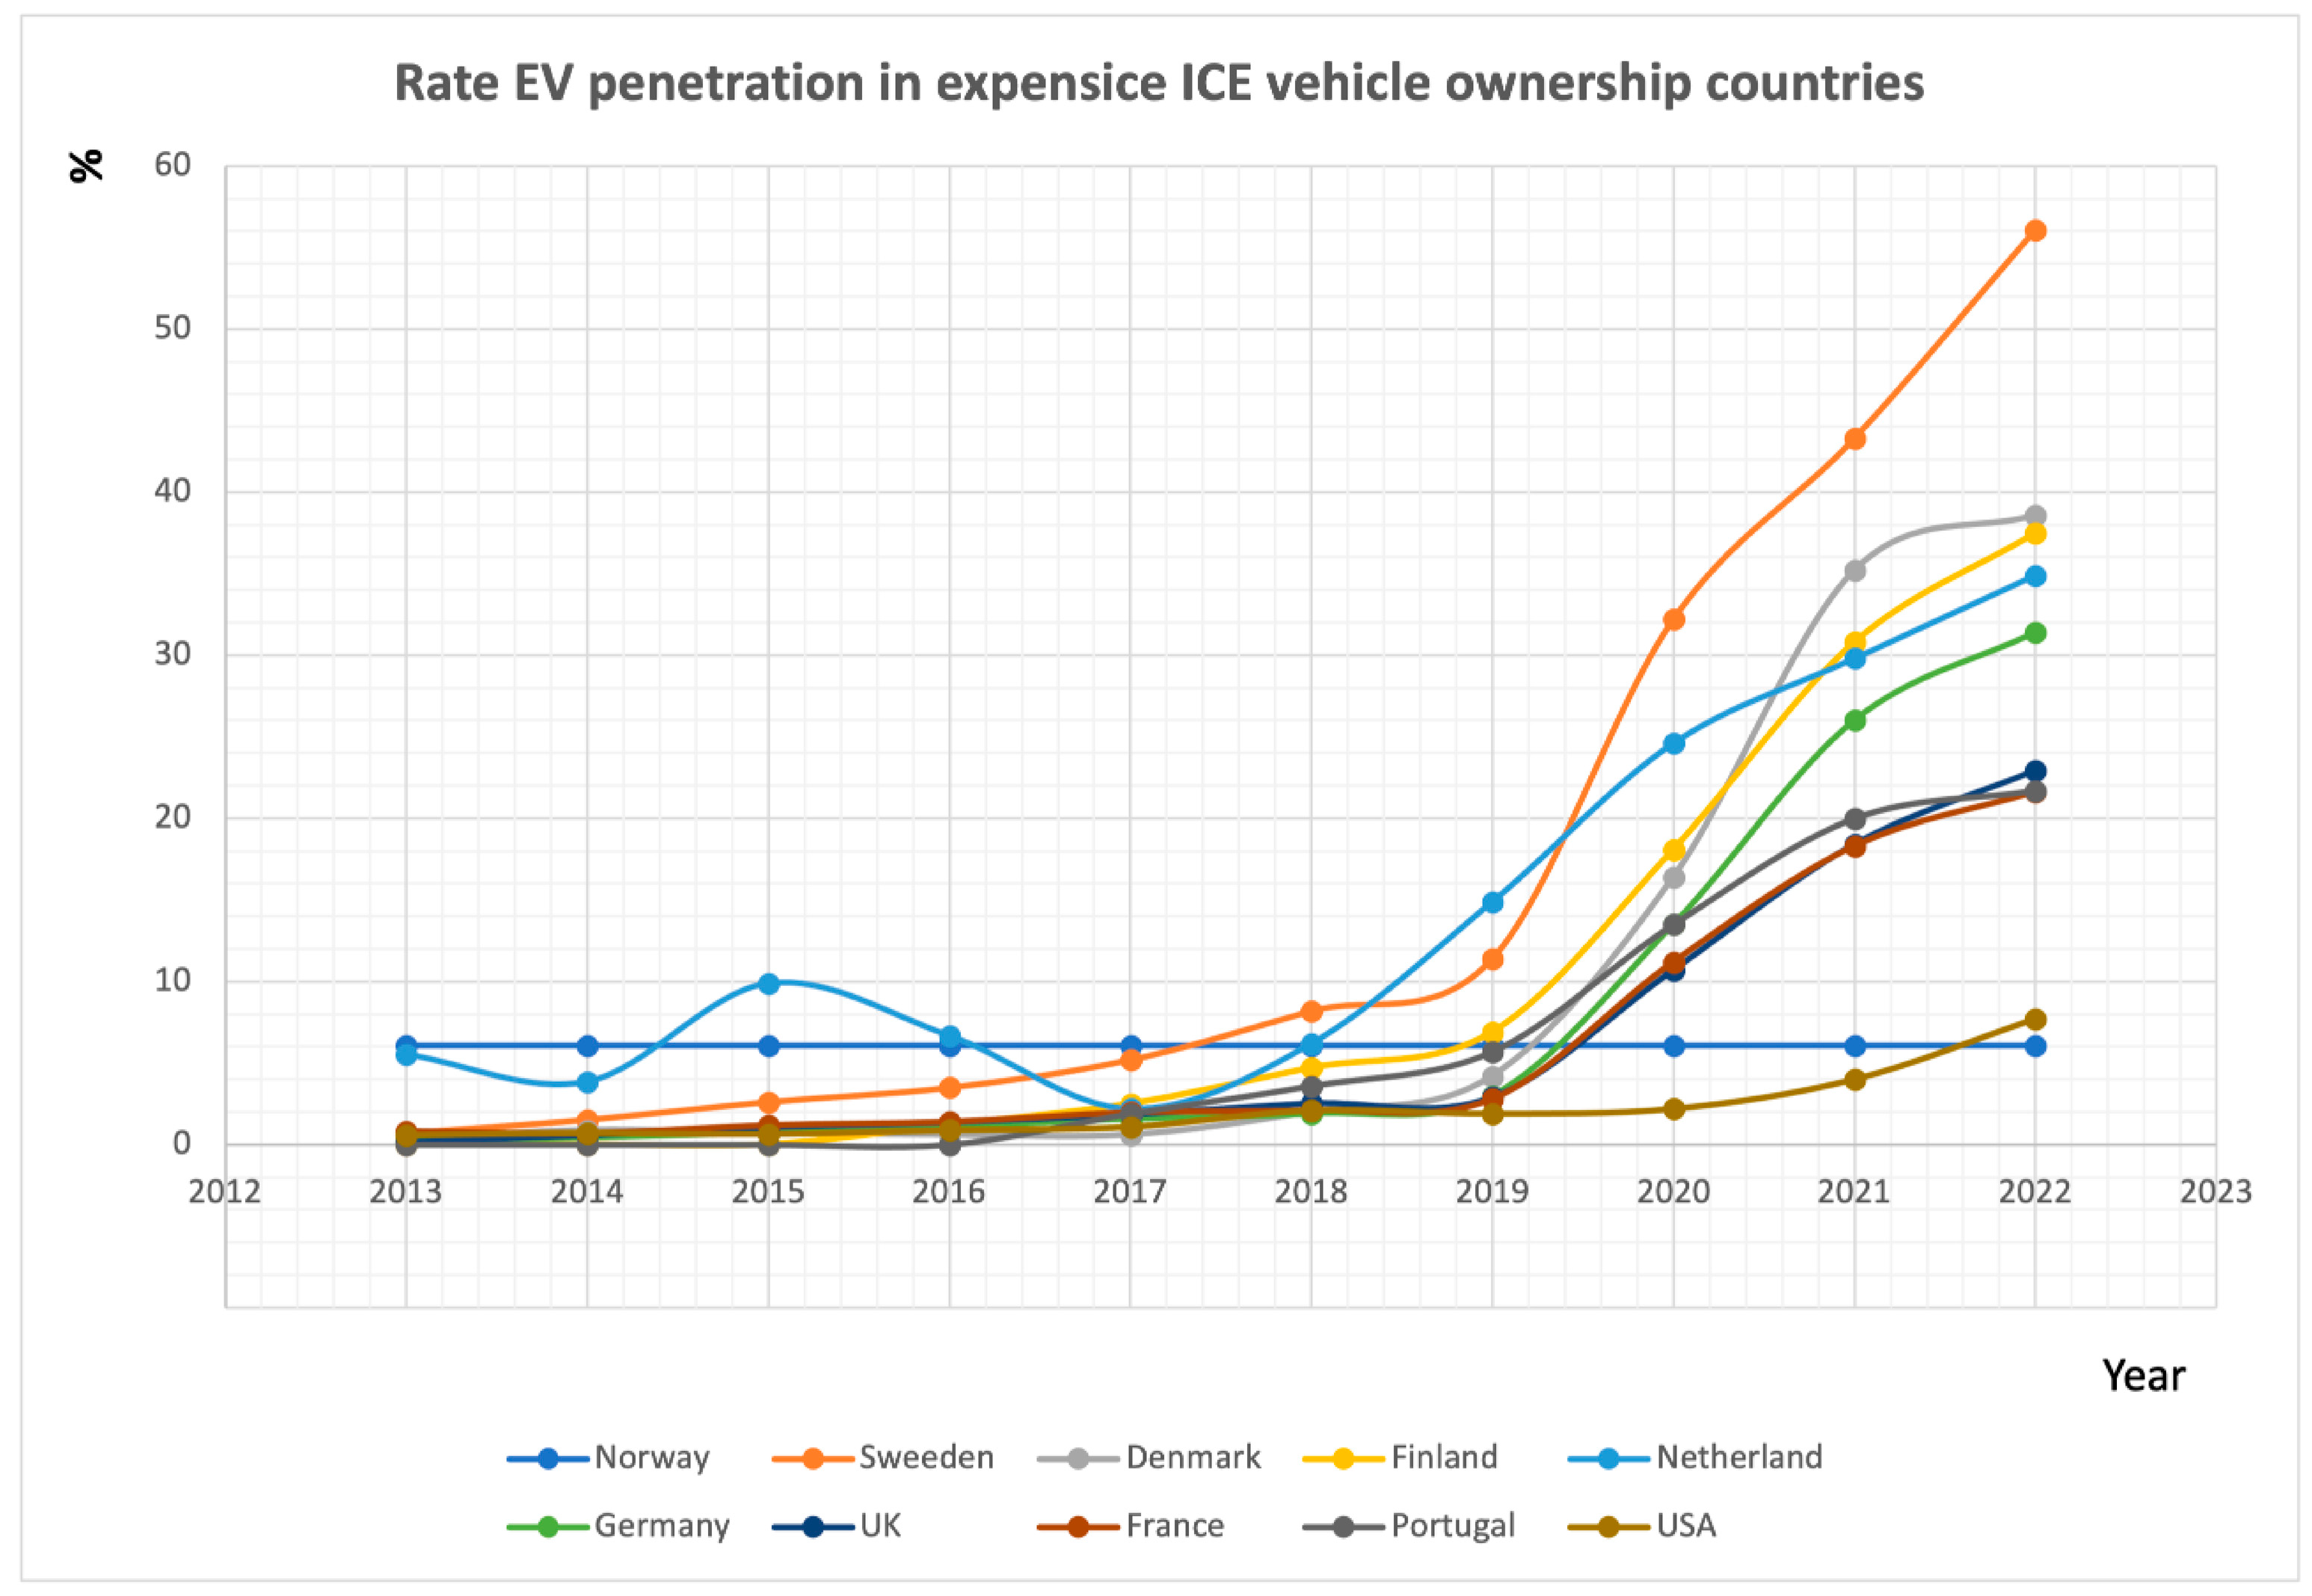
Figure 2 illustrates the change in the proportion of EVs among new registrations in countries with notable EV penetration: Norway, Sweden, Denmark, the Netherlands, Germany, the United Kingdom, France, Portugal, and the United States of America [
19]. These curves depict the initial phases and rise of an S-curve.
An S-curve model can illustrate the adoption of EVs in these markets. The market penetration rate R(t) of EVs over time is represented by Equation (1) below, where each market can be accurately described by two variables, α and k, determined by aligning the curve R(t) with the real data [
19]. Variables α and k will be unique to each market and determined when the graph R(t) aligns with the graph derived from real data.
The significance and values of α and k are thoroughly detailed in Ref. [
16].
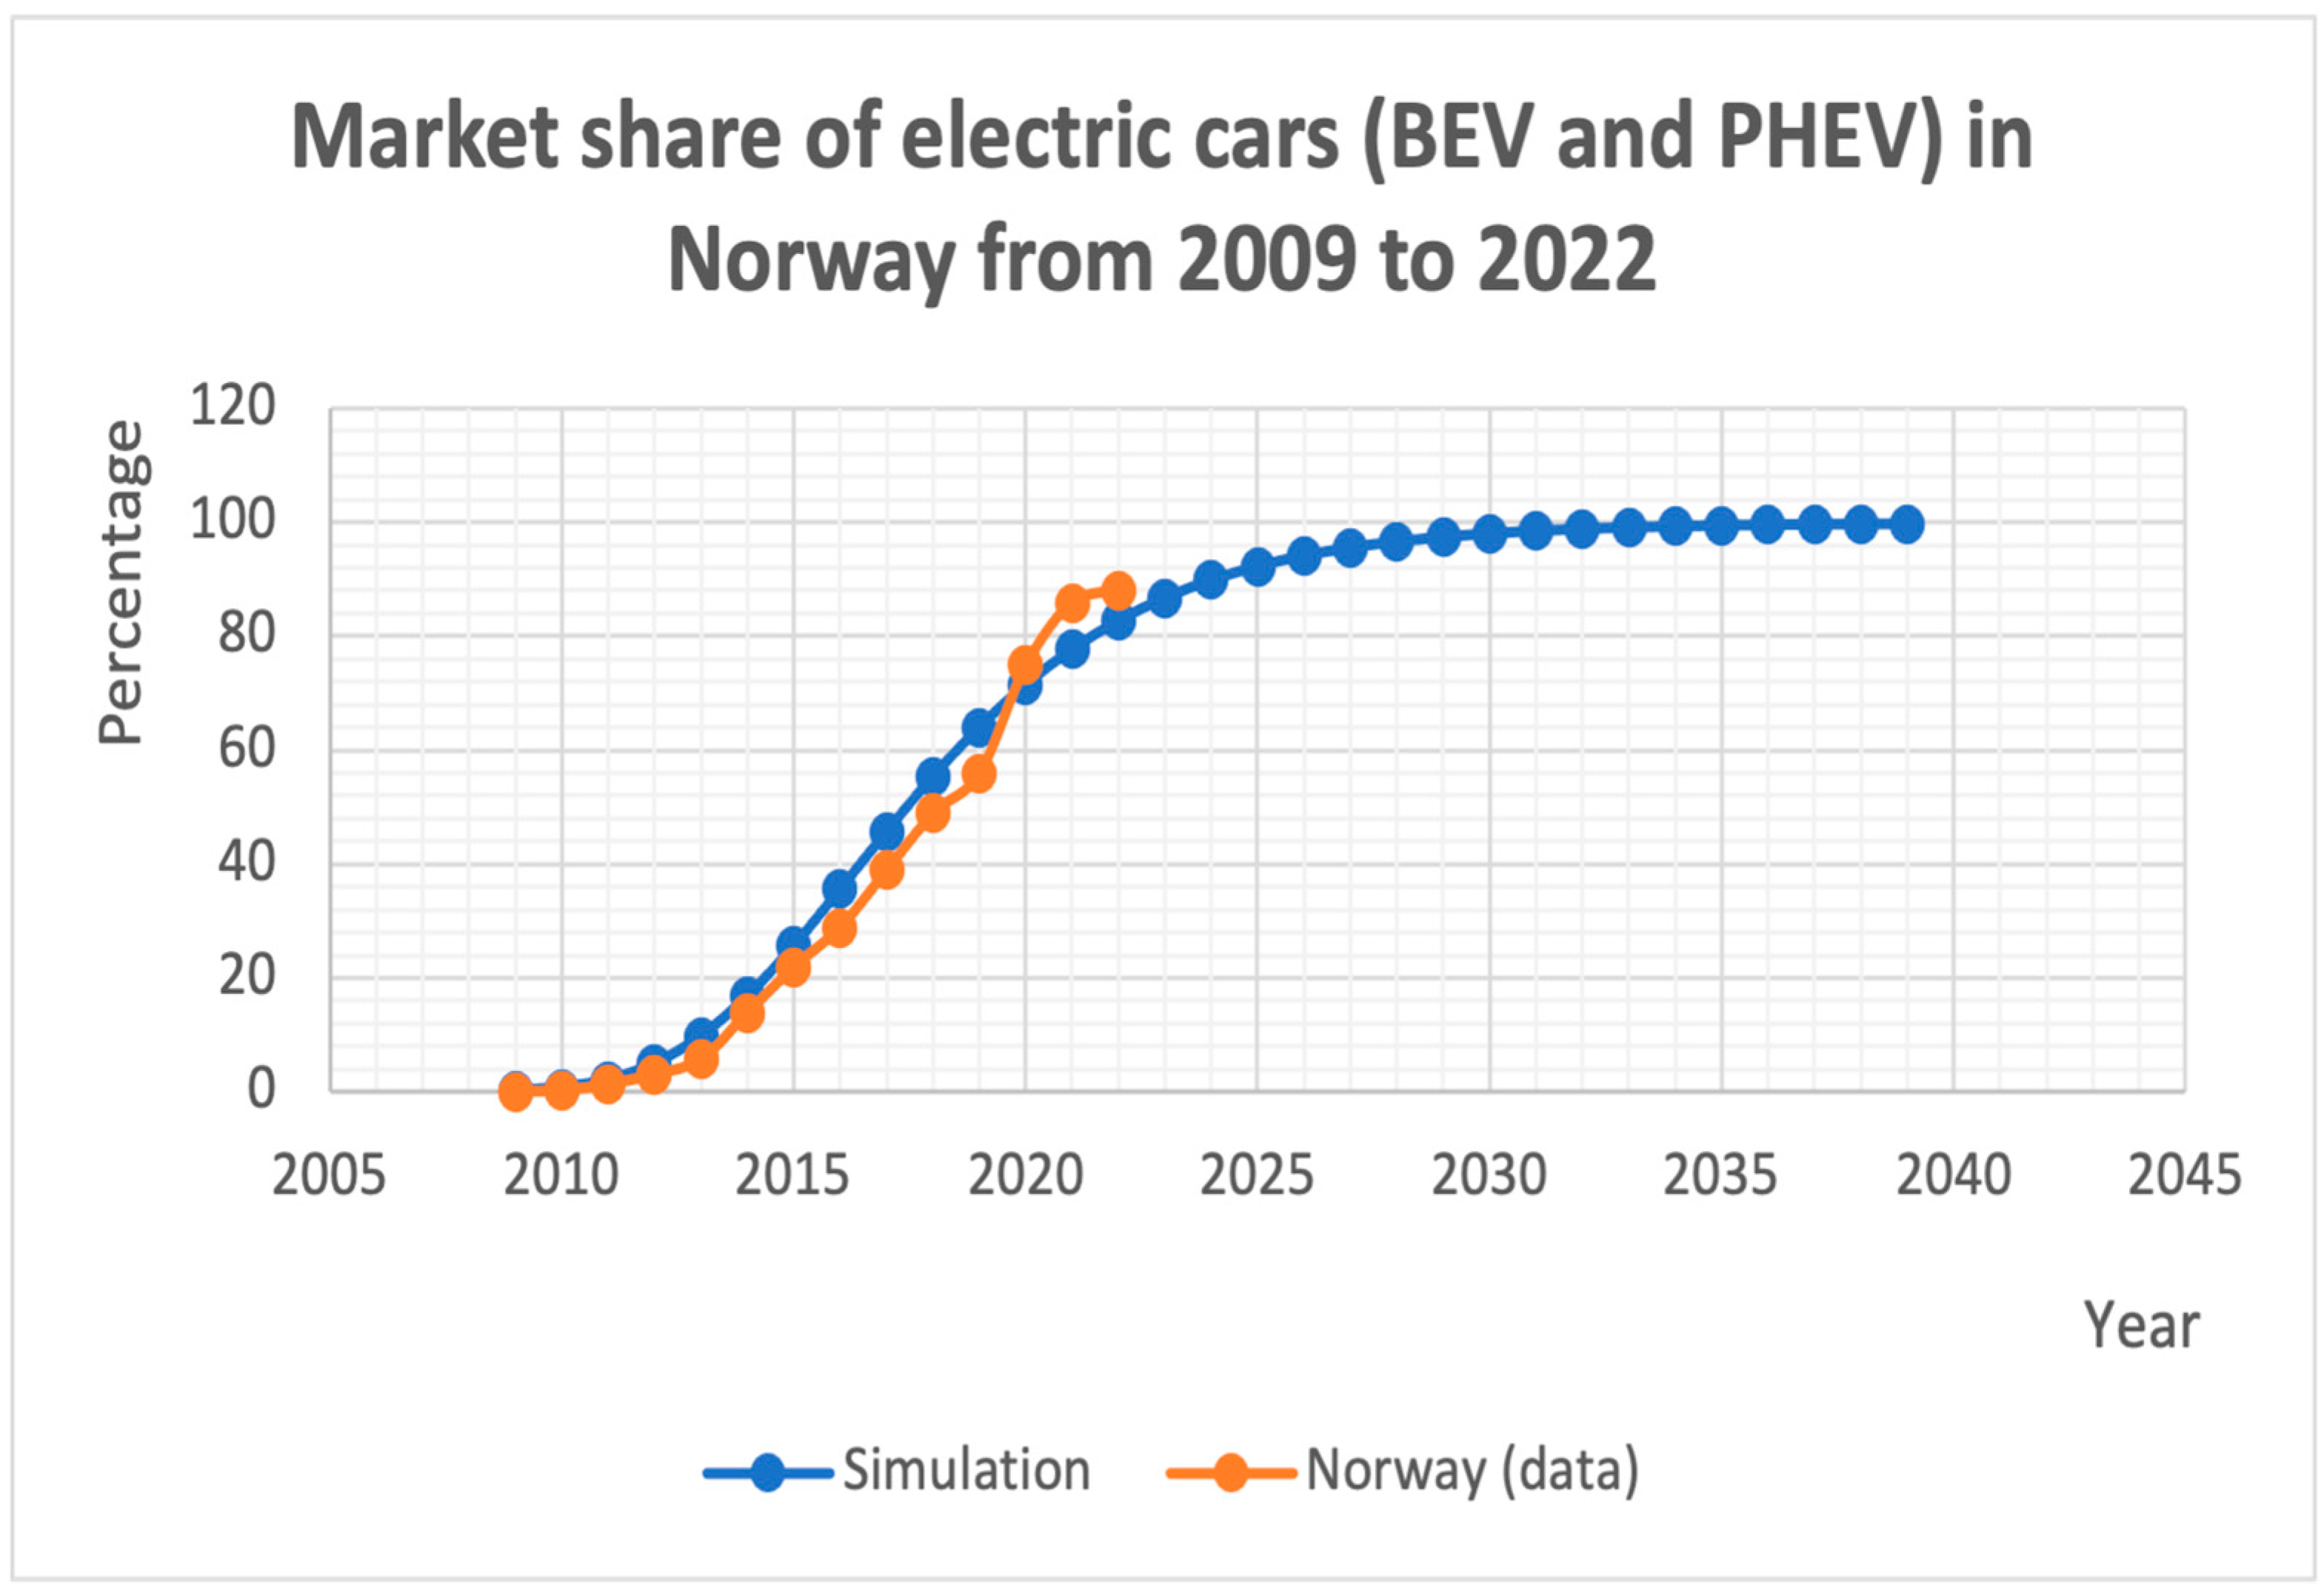
Here are the values of α and k for the nation that has the greatest EV penetration rate, Norway:
α = 0.29 and k = 11 [
20].
Figure 3 above shows that Norway will reach 100% EV transition by 2030, corresponding to 100% new registrations composed of EVs.
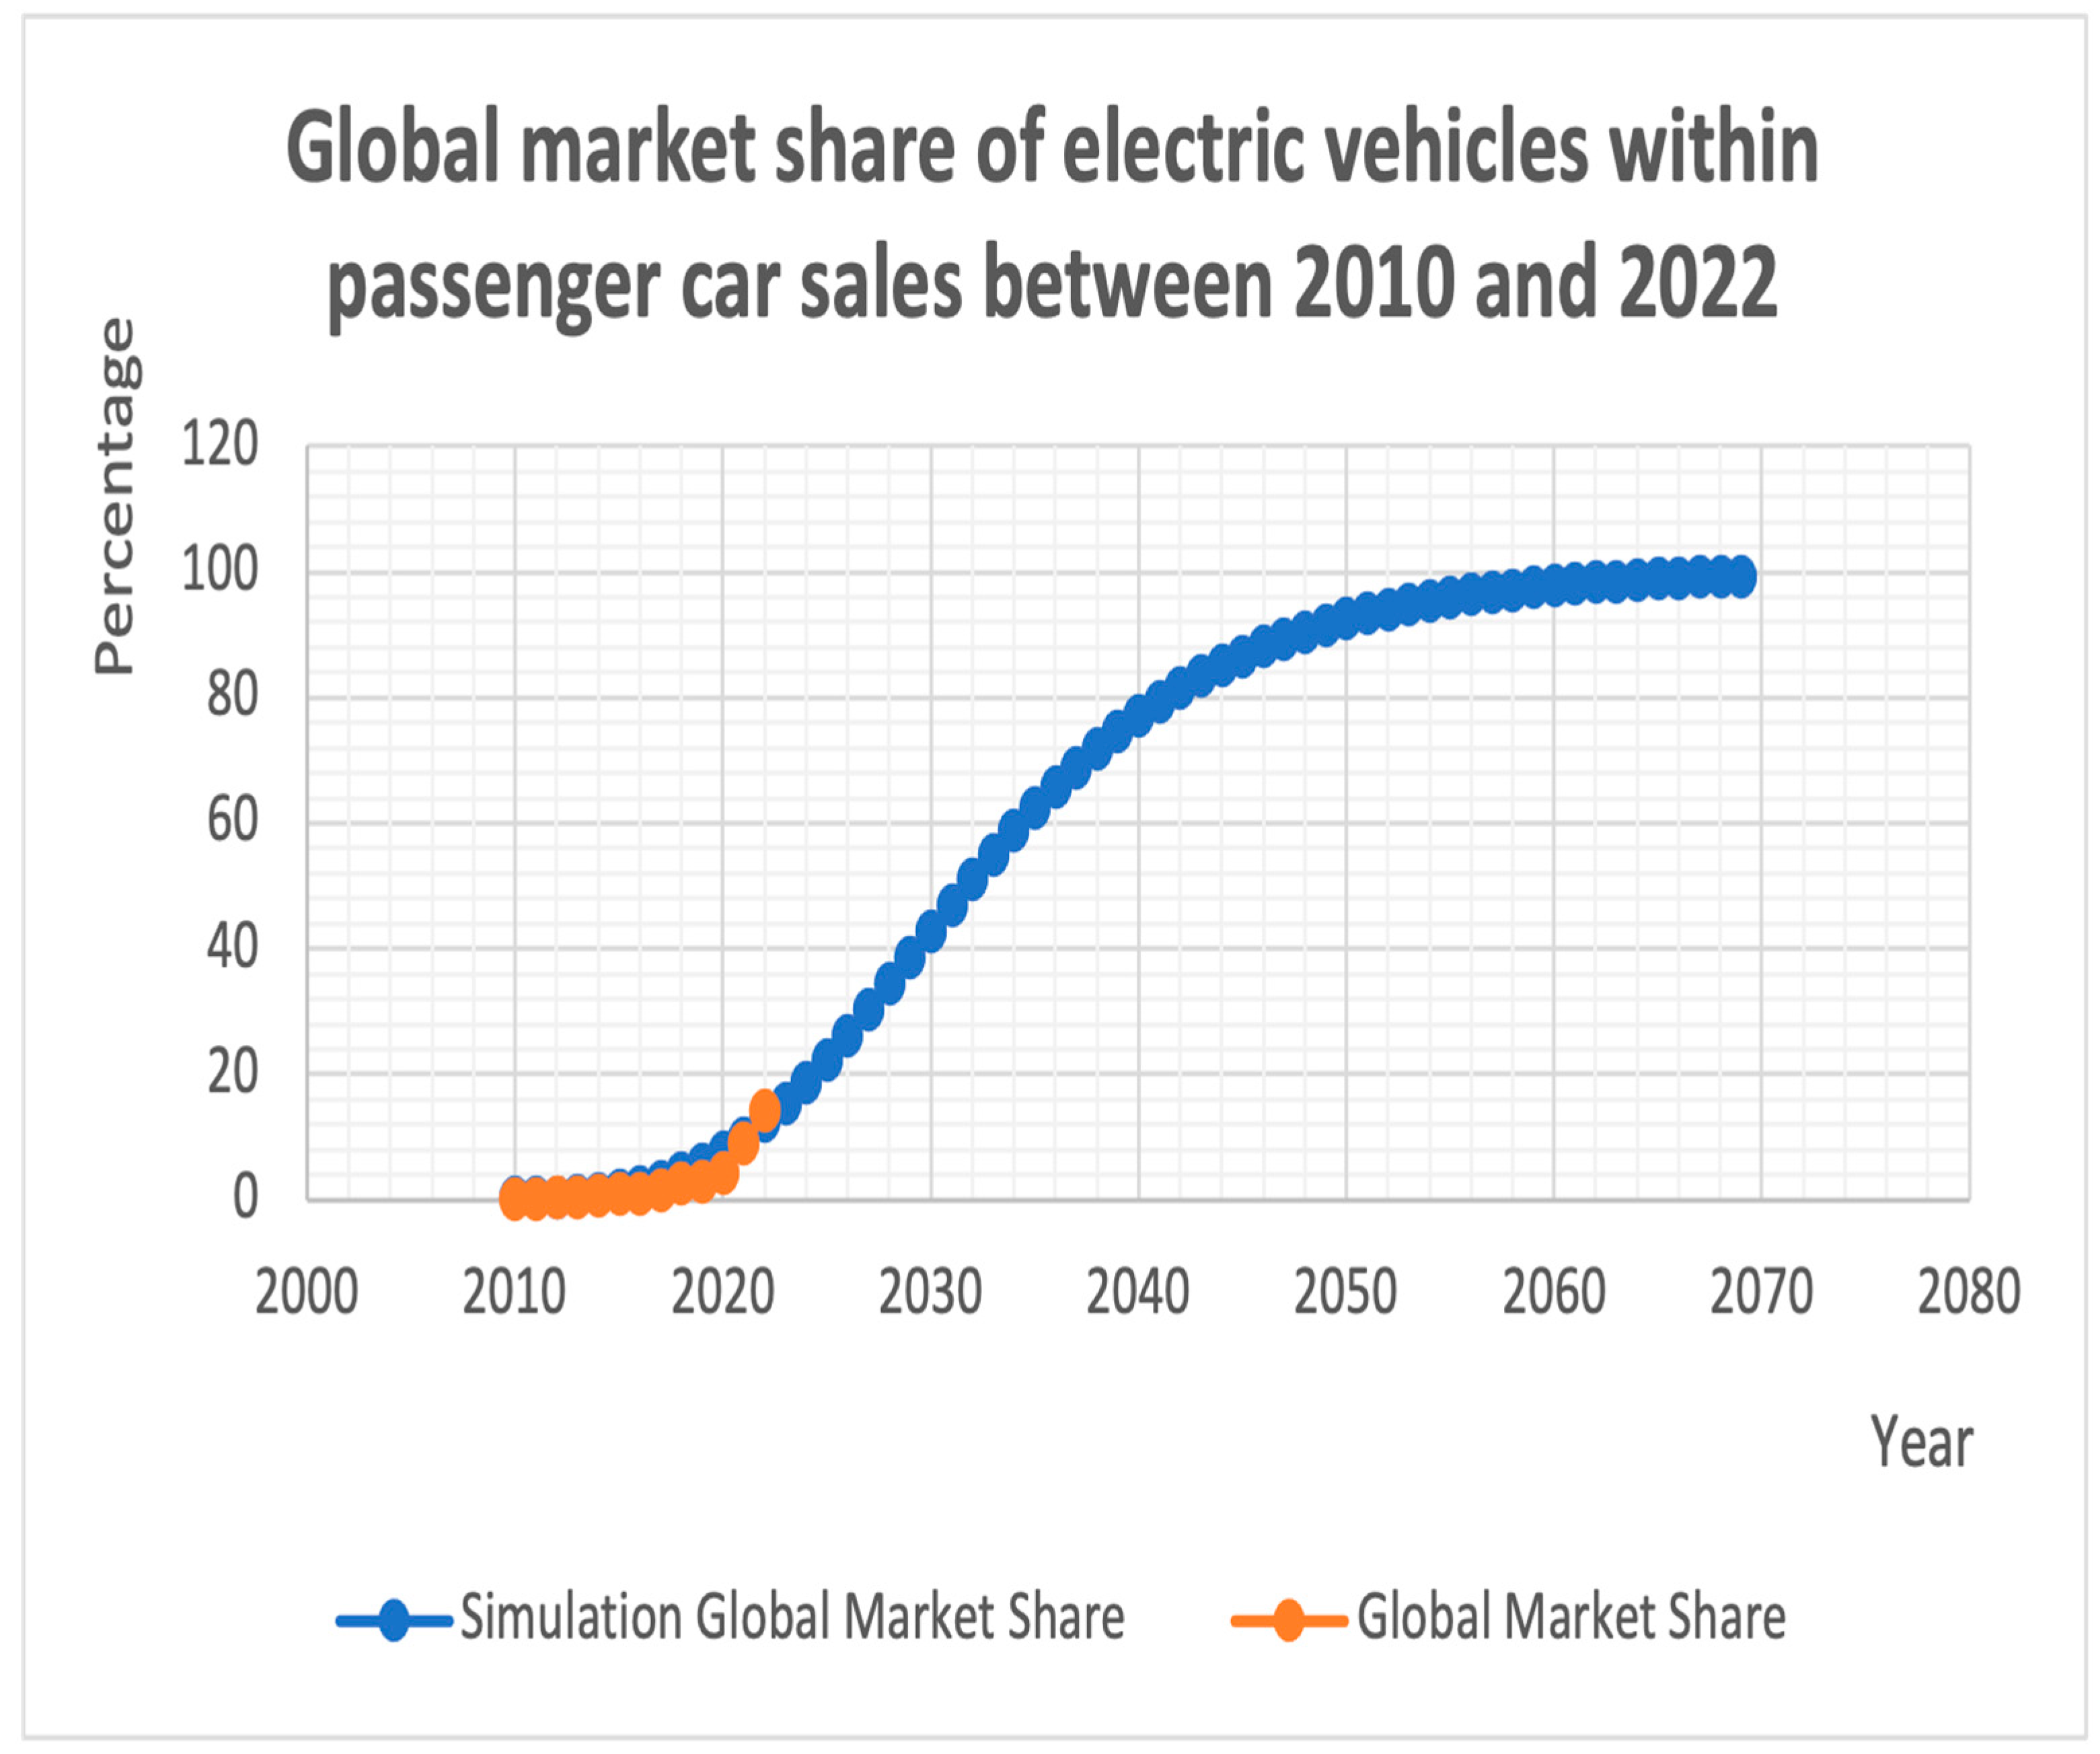
Meanwhile, the global EV penetration rate and its characteristic variables are extracted from
Figure 4, which are α = 0.12 and k =11 [
21].
The preceding
Figure 4 forecasts a worldwide complete transition to EVs by approximately 2055.
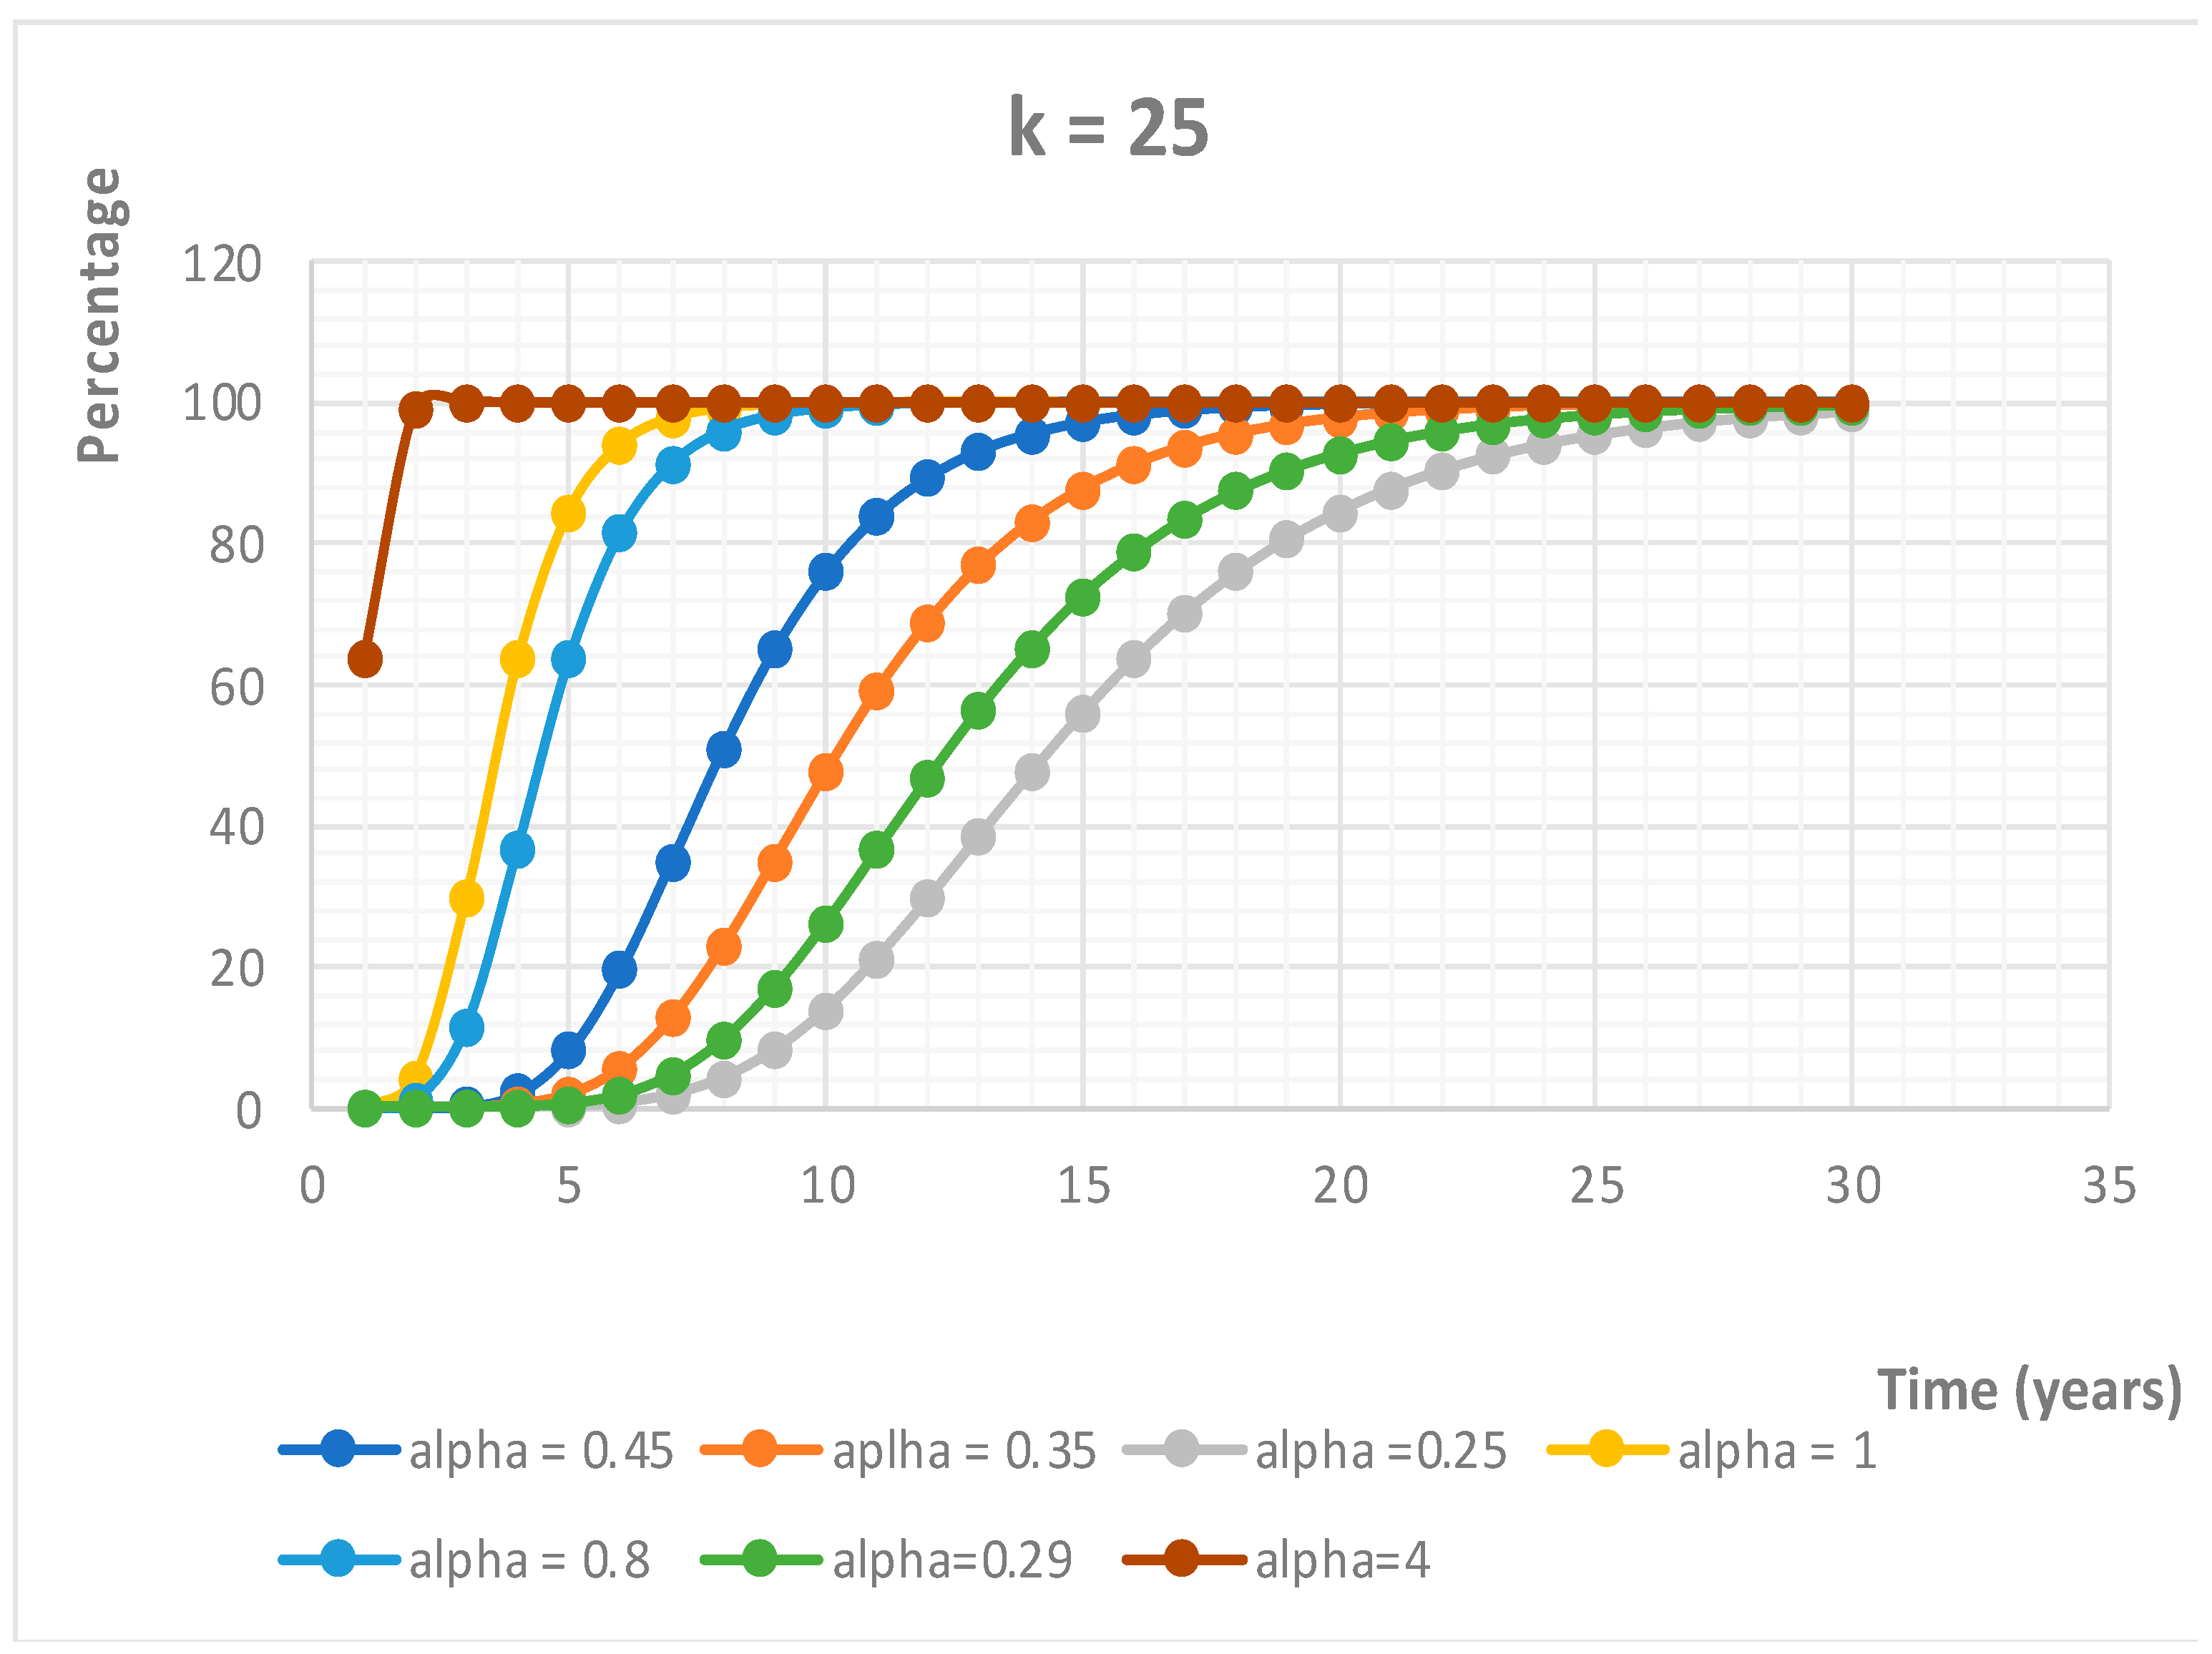
Figure 5 above illustrates the impact of altering coefficient α while keeping the value of k constant. As α rises, the pickup time decreases and the slope becomes steeper, indicating a quicker adoption of the technology after pickup. Lower values of α result in curves that have a gentler slope, indicating a slower uptake of the technological innovation.
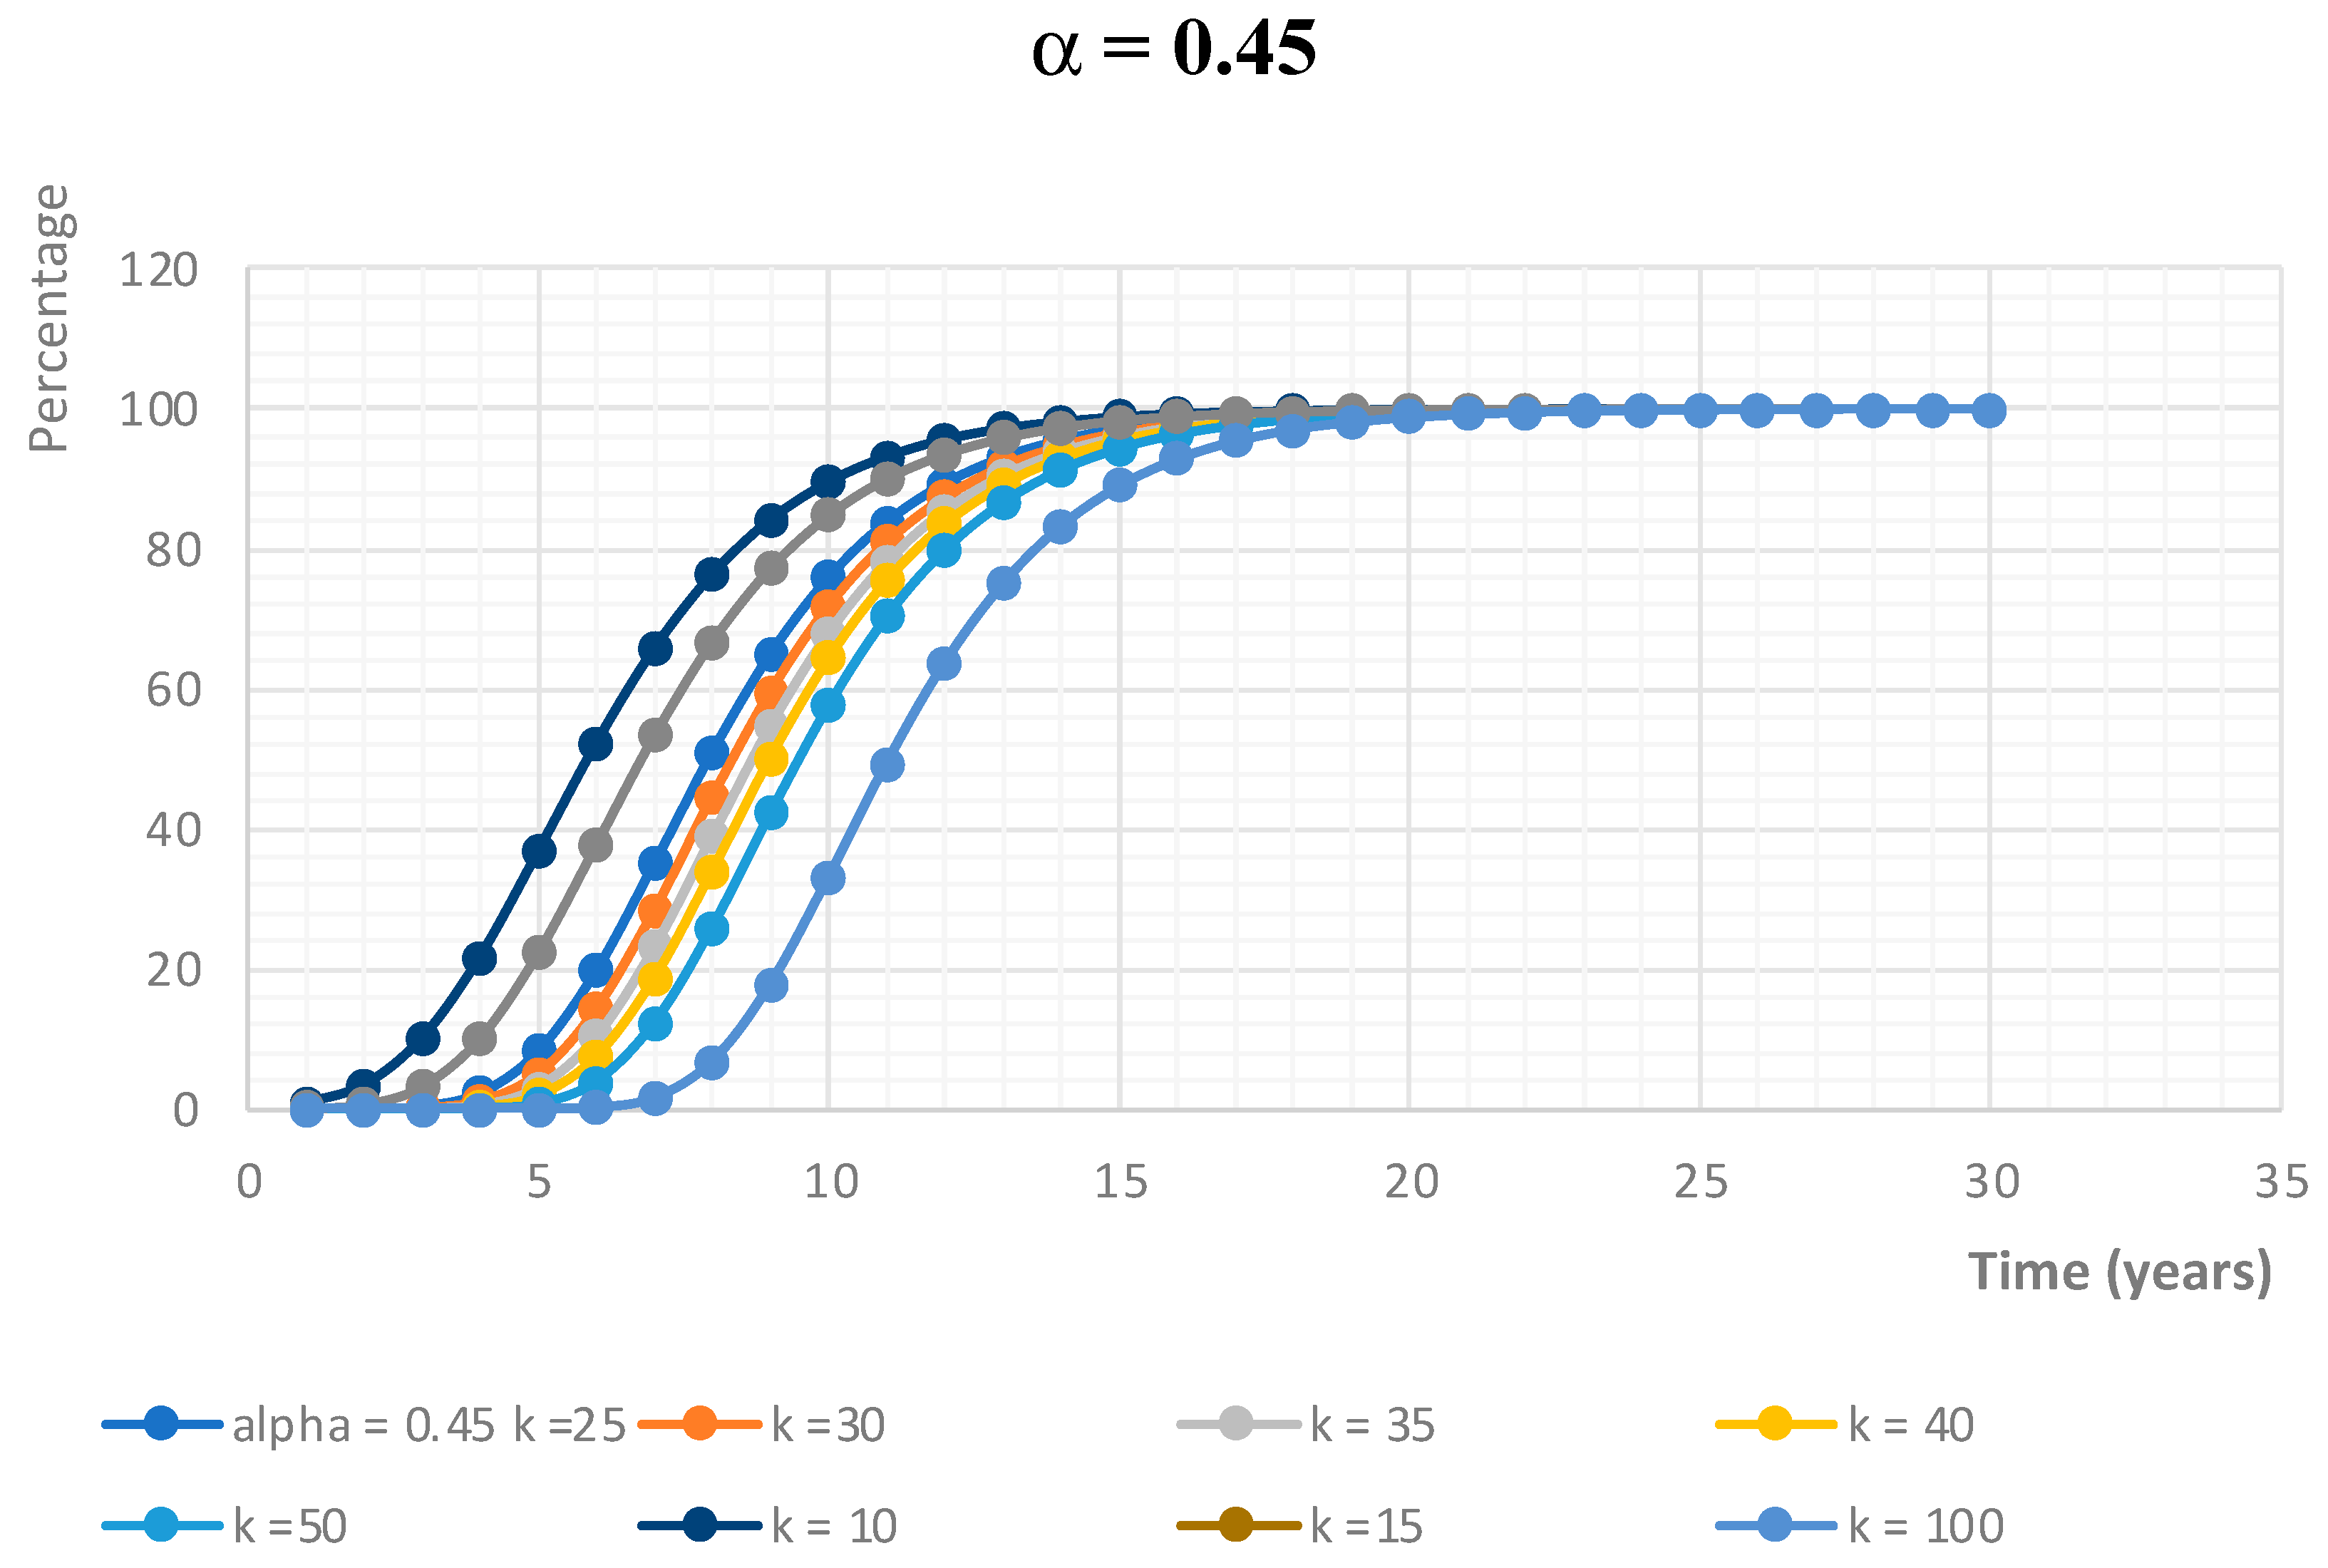
The above
Figure 6 illustrates how coefficient k varies for a specific value of α. As variable k varies, the slope stays the same while the pickup time increases, indicating a delayed maturity of the technological innovation. The pickup time rises as the value of k increases, as illustrated in
Figure 6 above.
A crucial question arises regarding the uniqueness of the pair (α and k) for the S-curve to align with the real data depicting the EV penetration rate in every market. It can be demonstrated that the pair (α and k) is singular for a specific market.
3. Ratio of New EVs to Used EVs in the EV Transition: S-Curve Approach Model
Used EVs are anticipated to notably penetrate the market no sooner than a decade after the technology’s launch. As the initial owners begin to sell their cars, the market will feature a combination of mostly new EVs and a few used EVs, which will steadily increase as more second-hand EVs enter the market. As they collectively undergo the EV transition, it is anticipated that, after the share of used EVs rises to its peak, the share of new EVs will decline to a specific threshold. The proportion of new and used EVs in the overall new registrations will reach a balance regarding x and y respectively. For ICE vehicles, every market features a distinct pair (x and y). A comparable equilibrium exists for many nonperishable consumer items: portable electronics, home appliances, motorcycles, etc. The ratio of new to used products will depend on the market. In developed countries, a significant percentage of new cars appears in new registrations, unlike in poorer nations where new vehicles in new registrations, typically all imported, represent a very low ratio. Nonetheless, it is anticipated globally that nearly 100% of EVs will be bought new during the initial decade.
In this model, used EVs are regarded as modern technology, just like new EVs. The hypothesis suggests that, in the marketplace, the uptake of second-hand EVs will mirror that of new EVs; initially, there will be limited pre-owned EVs for sale, and few prospective buyers will be willing to adopt them for a variety of reasons: the acquisition cost compared to new EVs, particularly when subsidies for new models are substantial, battery reliability and range, maintenance costs, obsolescence issues, and, most importantly, warranty concerns. With the rise in the number of EVs, there will be greater availability of second-hand EVs, prompting more consumers to purchase used EVs before the final phase when more hesitant buyers will opt for a pre-owned EV. The rapid depreciation of EVs will significantly influence this process. In the end, a balance will be reached in the proportion of new to used EVs available in the market.
The transition to EVs is represented by an S-curve [
16,
17,
18] for both new and pre-owned EVs as a theoretical model, with the following equations:
R(t) represents the overall penetration rate of electric vehicles, u(t) denotes the penetration rate of pre-owned electric vehicles, and n(t) refers to new electric vehicles.
The penetration rate of used EVs u(t) is represented as
The proportion of new EVs is represented as follows:
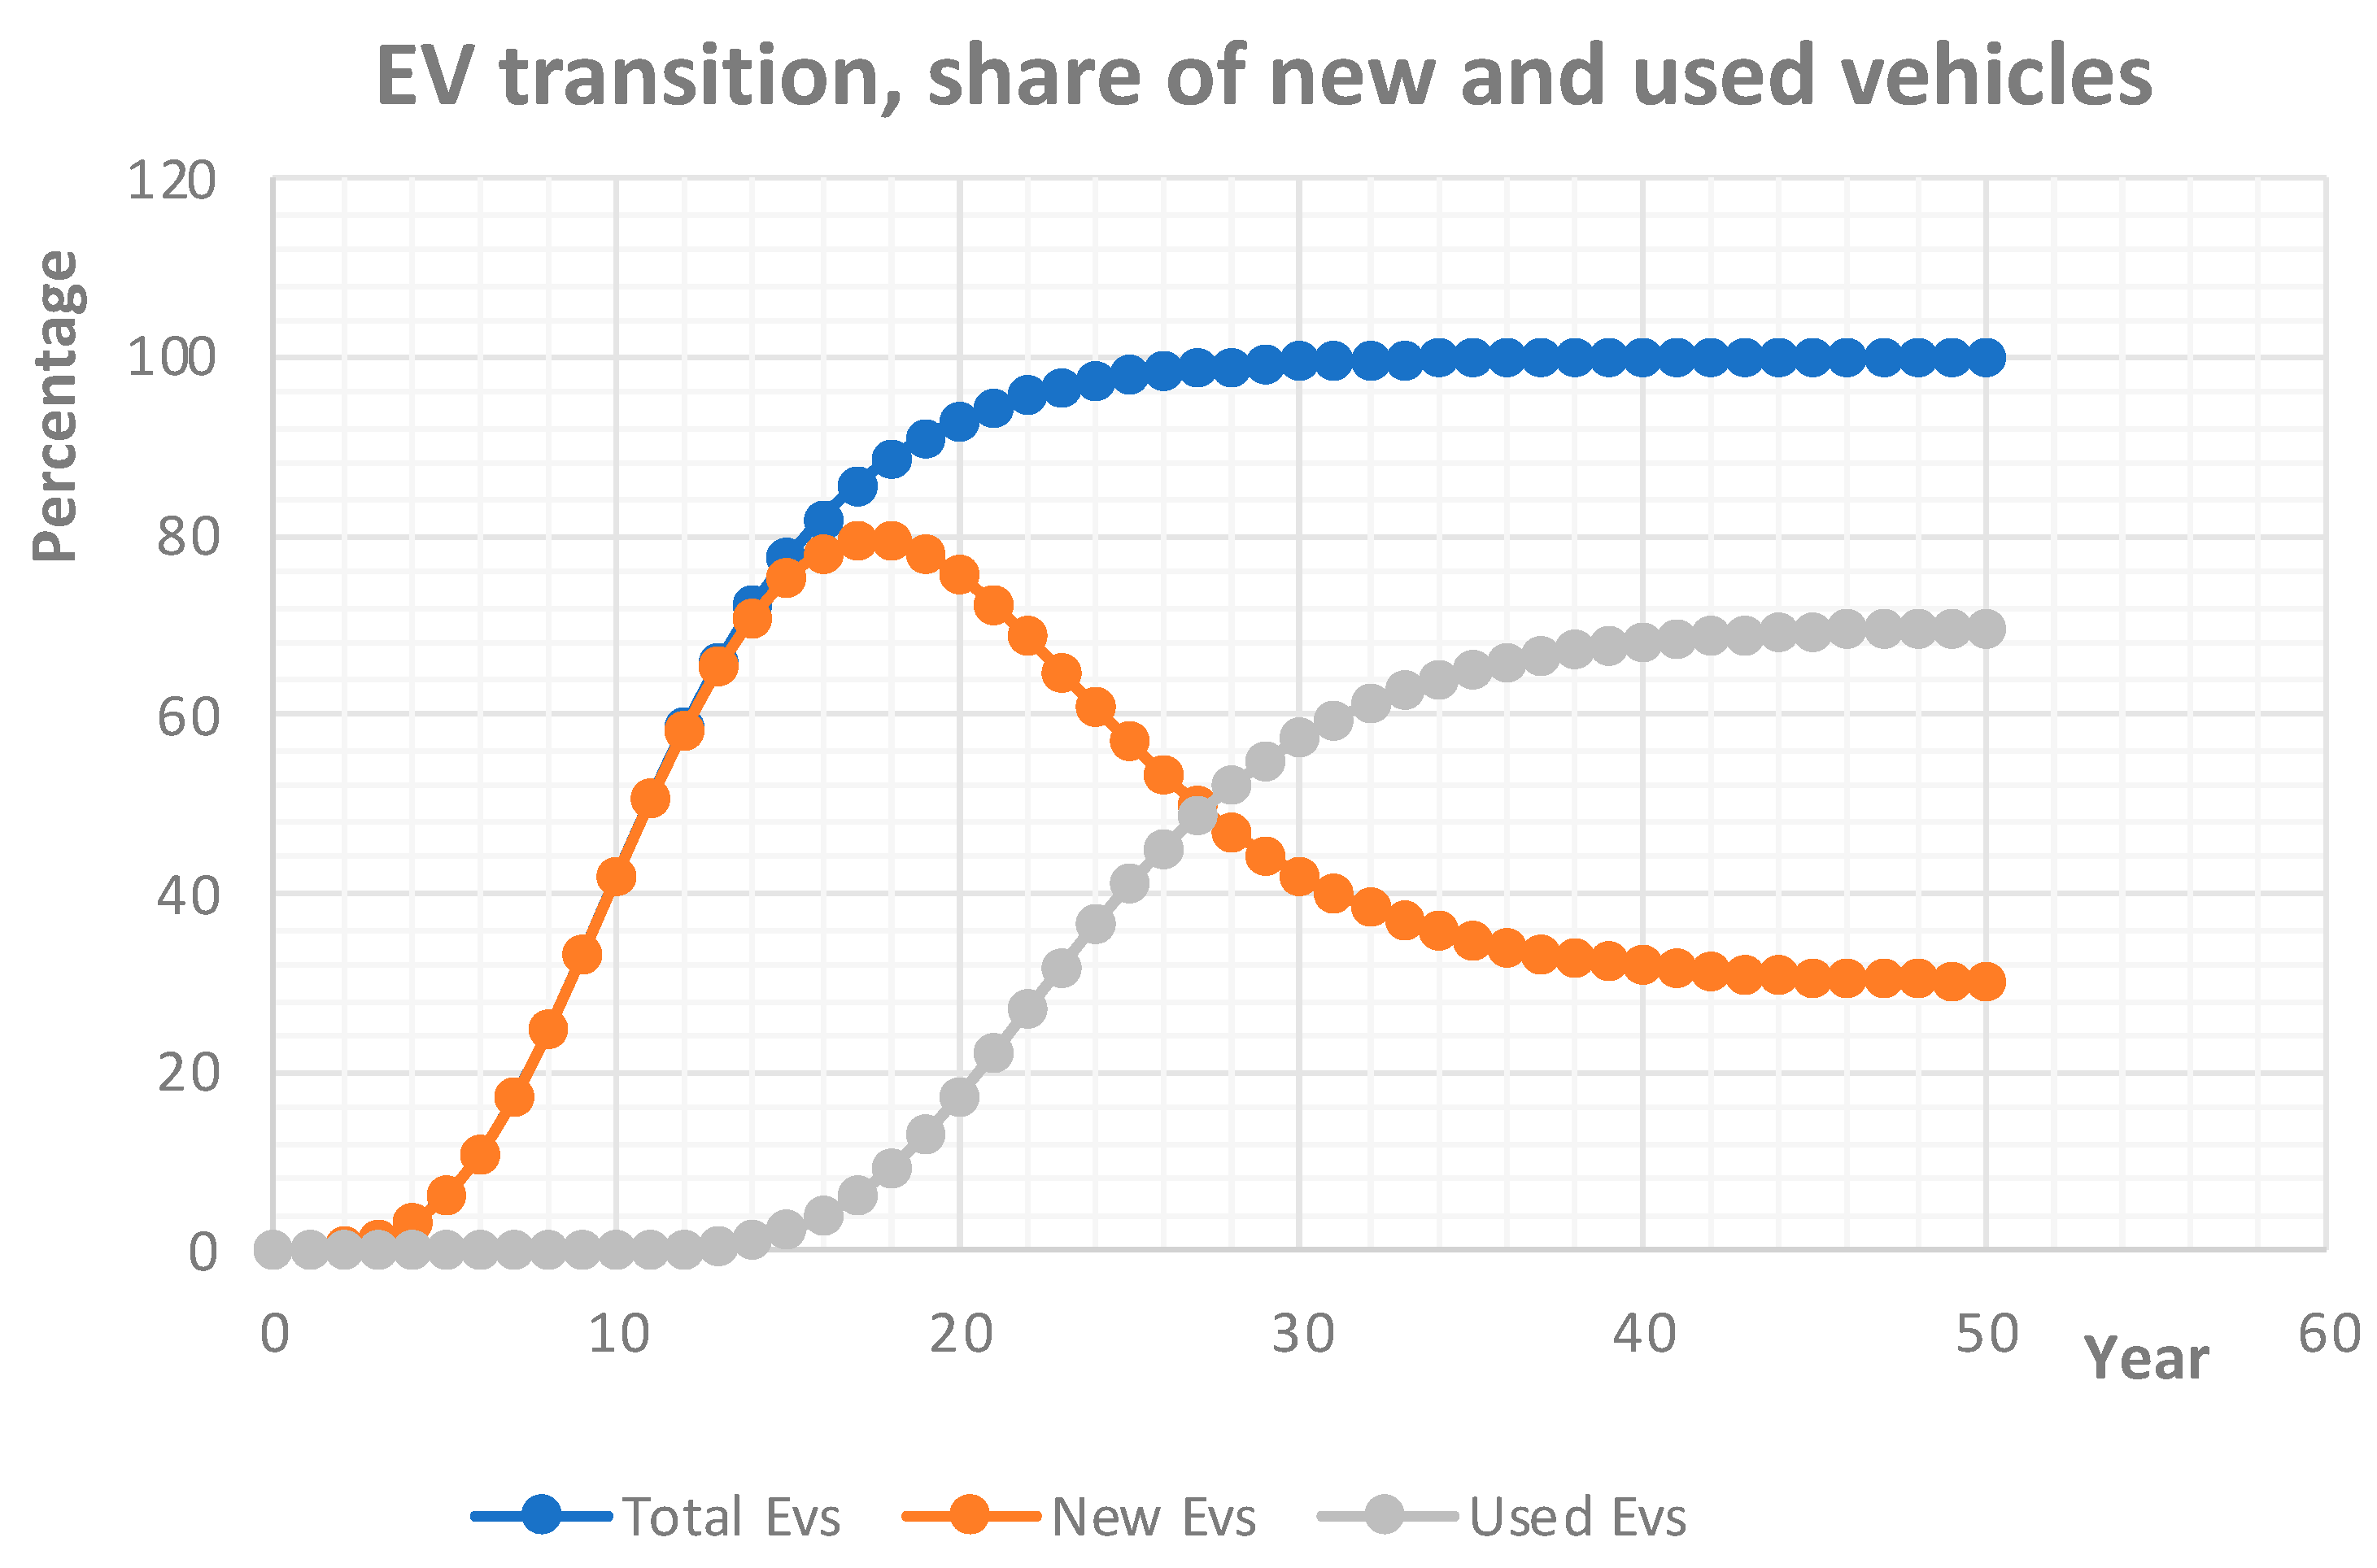
Variables α and β, along with k and m, define both the initial inflection points of the curves and their slopes. In
Figure 7 below, the assumption is α= β and k = m, reflecting a scenario of strong demand for second-hand EVs due to minimal depreciation of these vehicles.
Regarding the output of the model, its prediction is the number of years necessary to find an equilibrium in the ratio of new to second-hand EVs in new registrations. The input data will be parameters α, k, β, and m as well as the expected ratio at equilibrium. The final ratio will depend on policies not presented in this manuscript.
The result produced by the model, its forecast, indicates the number of years required to achieve a balance in the proportion of new to used EVs in new registrations. The input parameters will consist of α, k, β, and m, along with the anticipated ratio at equilibrium. The ultimate ratio will be influenced by policies not included in this document.
The above
Figure 7 is derived for the worldwide market using the assumptions α = 0.25 and k = 11 and α = β and k = m [
16] and assuming that, upon saturation, new registrations occur at a rate of 70% for used EVs and 30% for new EVs, with this being the current ratio for ICE vehicles in the reference market of the USA [
2]. According to this hypothesis, as illustrated in
Figure 7 for α, k, β, and m, the market attains equilibrium over 30 years following the first adoption of EV technology.
According to
Figure 7, worldwide, 26 years post-adoption of EVs, the share of newly registered vehicles and used vehicles will equalize: 50% for each. The share of new EVs will keep declining, while the share of used EVs will rise until balance is reached in 14 more years, totaling 40 years since the launch of EV powertrain technology.
In a situation where there is a high demand for used items, it is possible for k to equal m, meaning that second-hand products enter the market soon after the technology is embraced. This occurs when production significantly falls short of demand, causing used goods to be priced almost as high as new ones or potentially even higher since the waiting list could be excessively long, and a long-lasting shortage might exist. Hypothetically, there could be no depreciation, and used products might even appreciate in value.
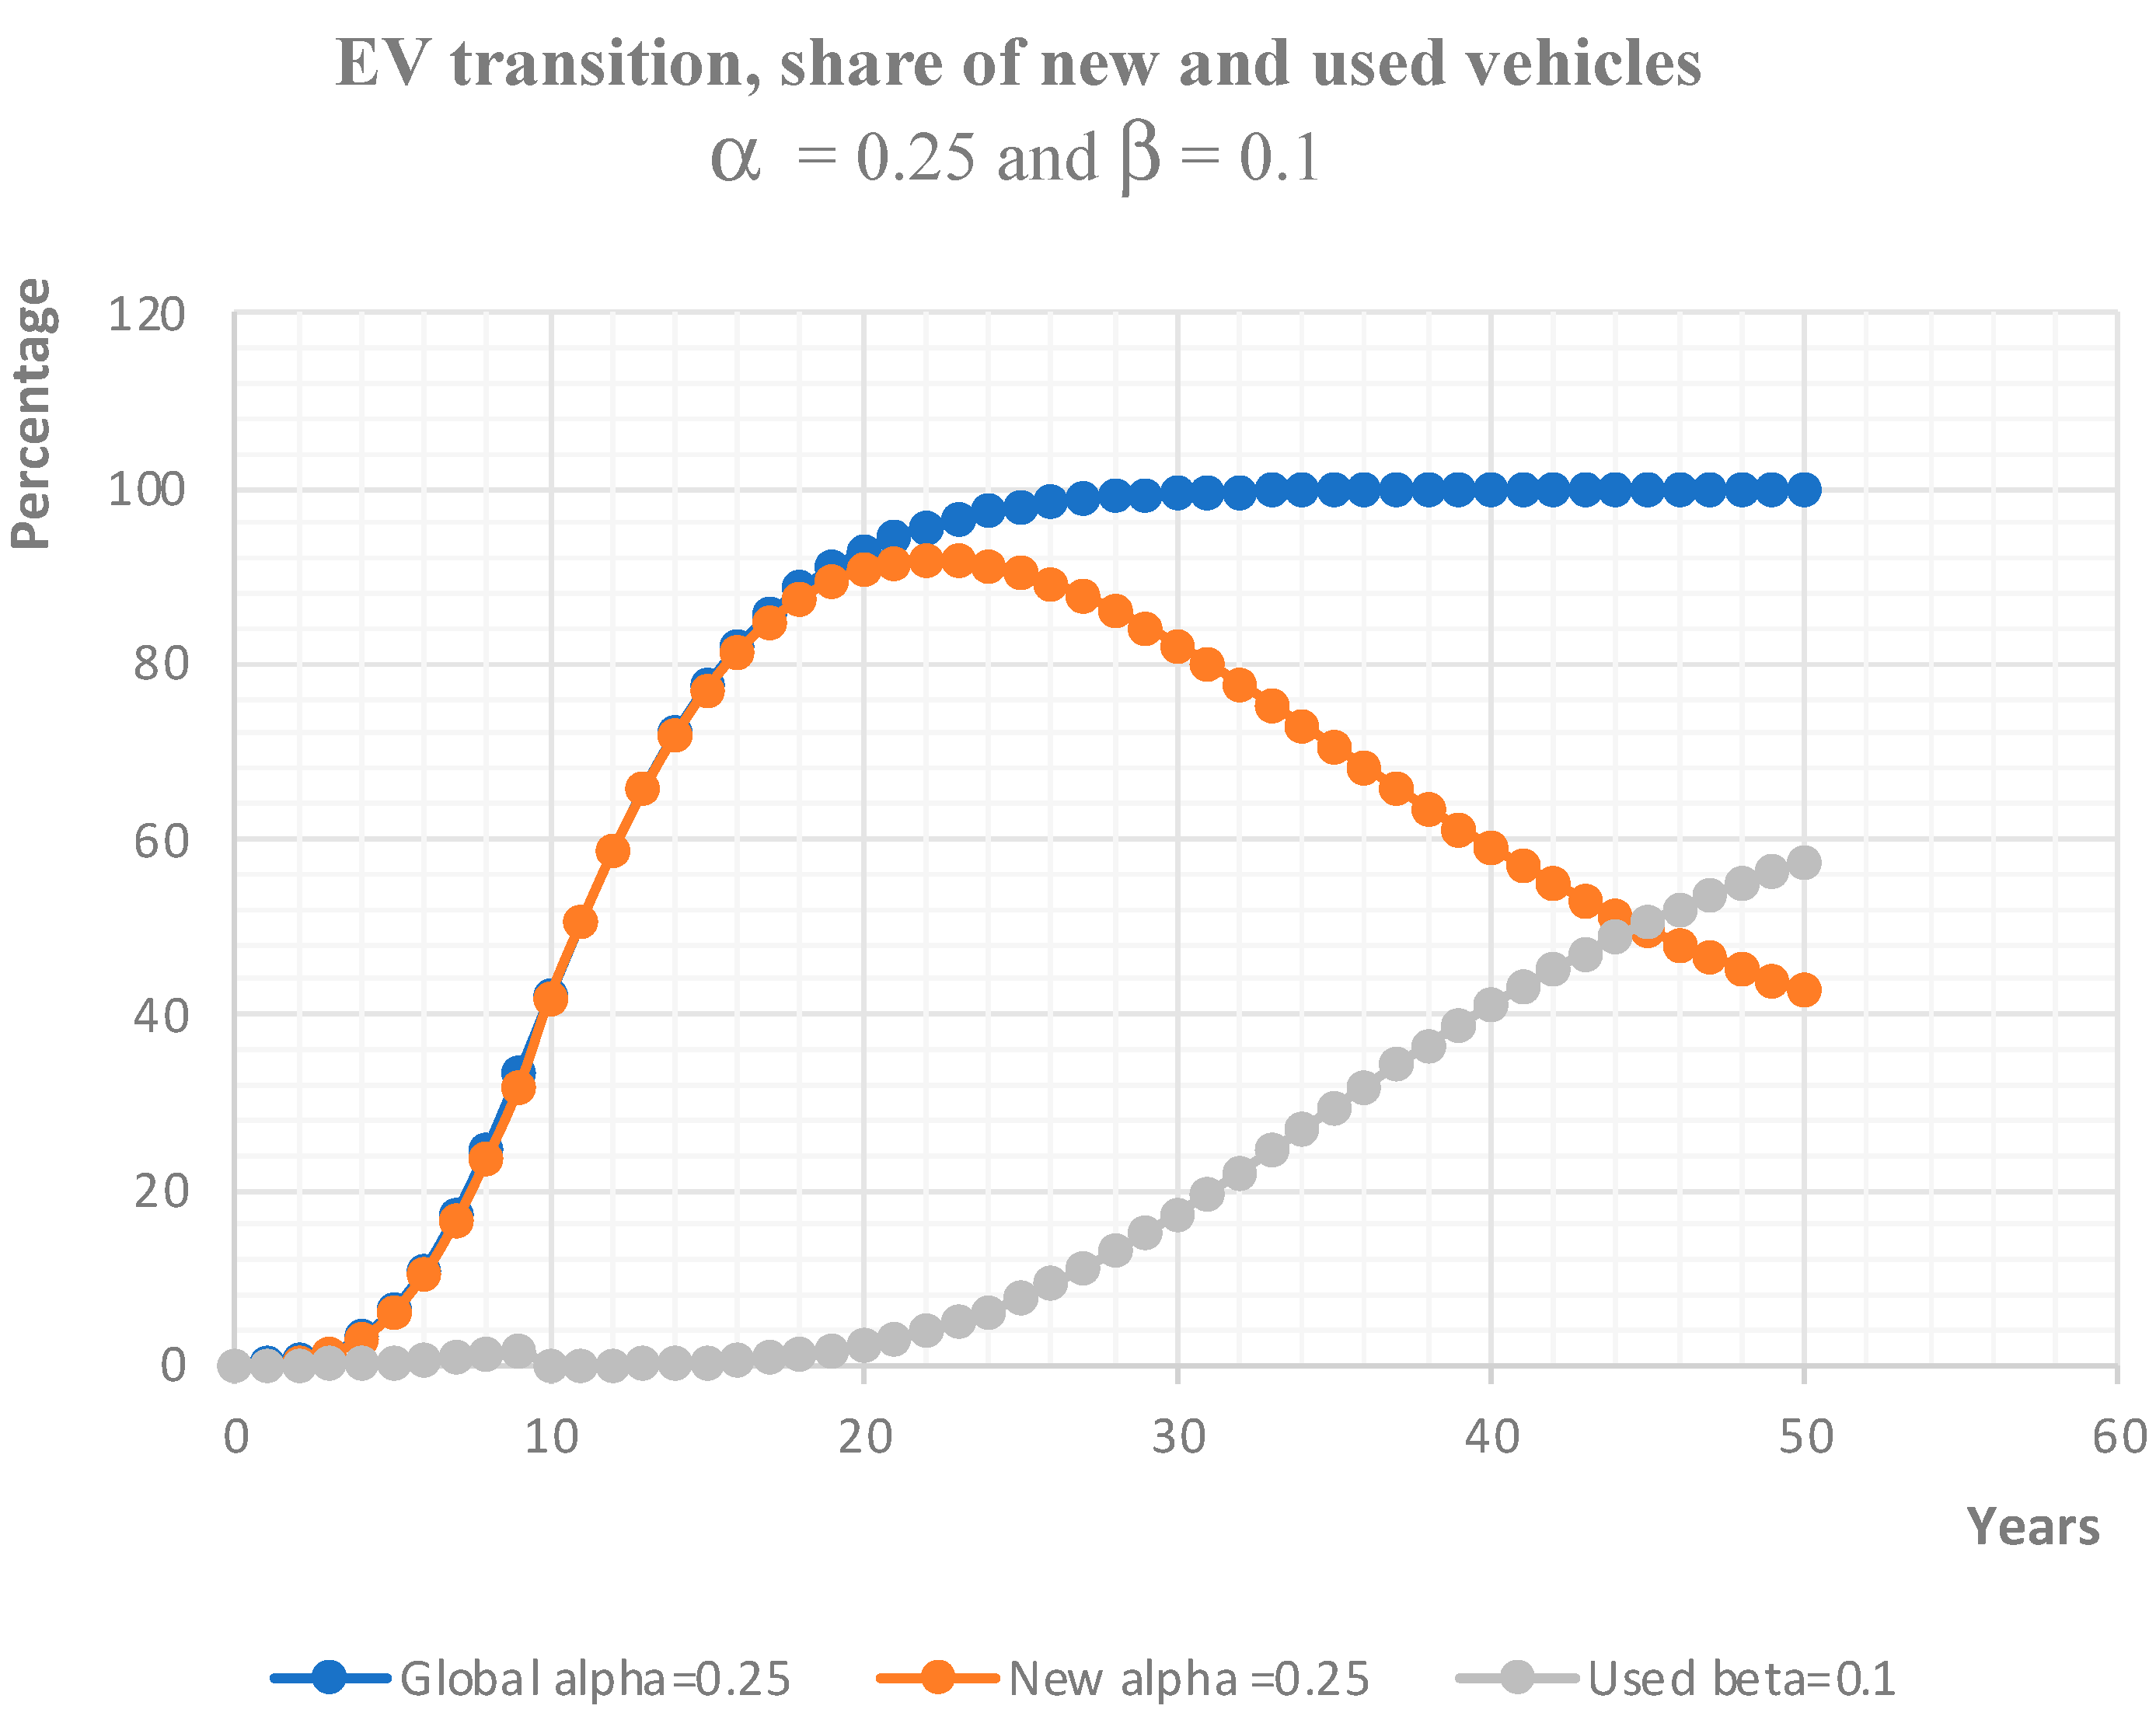
If a product experiences quick depreciation, supply takes precedence over demand, resulting in m > k and β < α (
Figure 8). The demand for used products will significantly fall short compared to that for new ones, indicating a lag in pickups and slower market progression for used vehicles relative to new ones.
Variables: k = 11, m = 11, α = 0.25, and β = 0.1.
In instances of swift depreciation, as illustrated in
Figure 8 above, the share of new EVs will continue to be more significant than that of used EVs in new registrations well beyond the complete adoption of the technology.
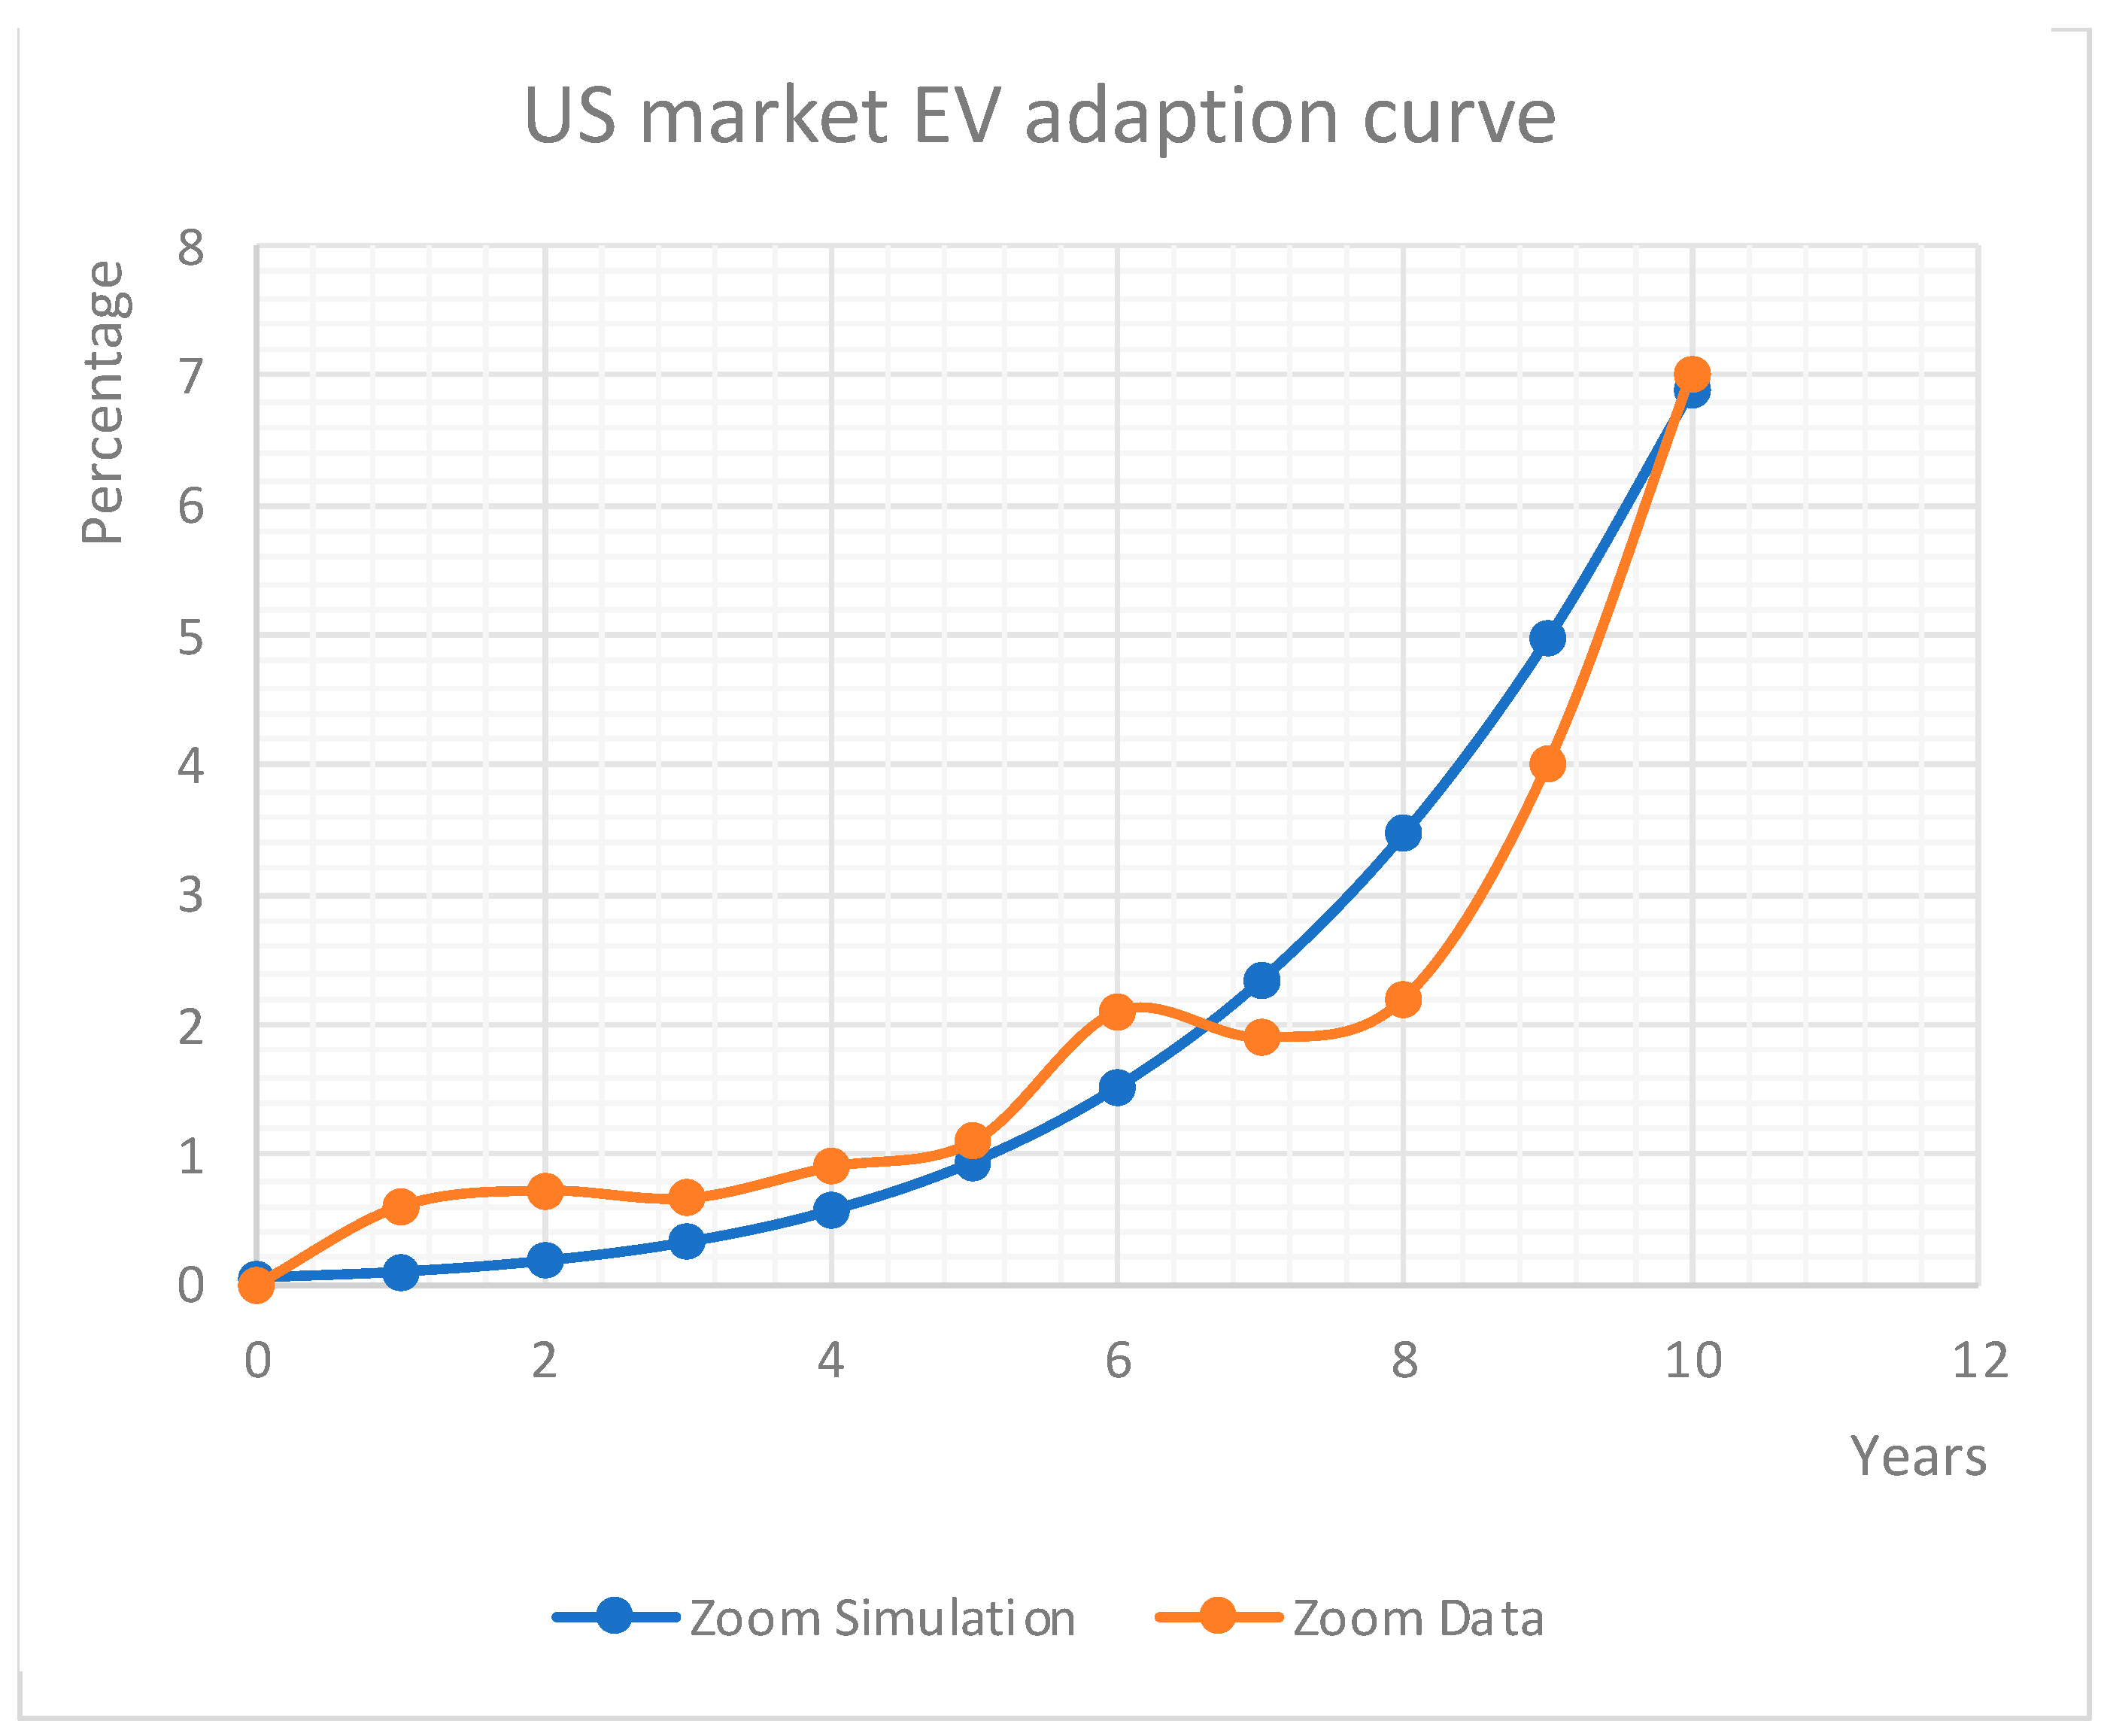
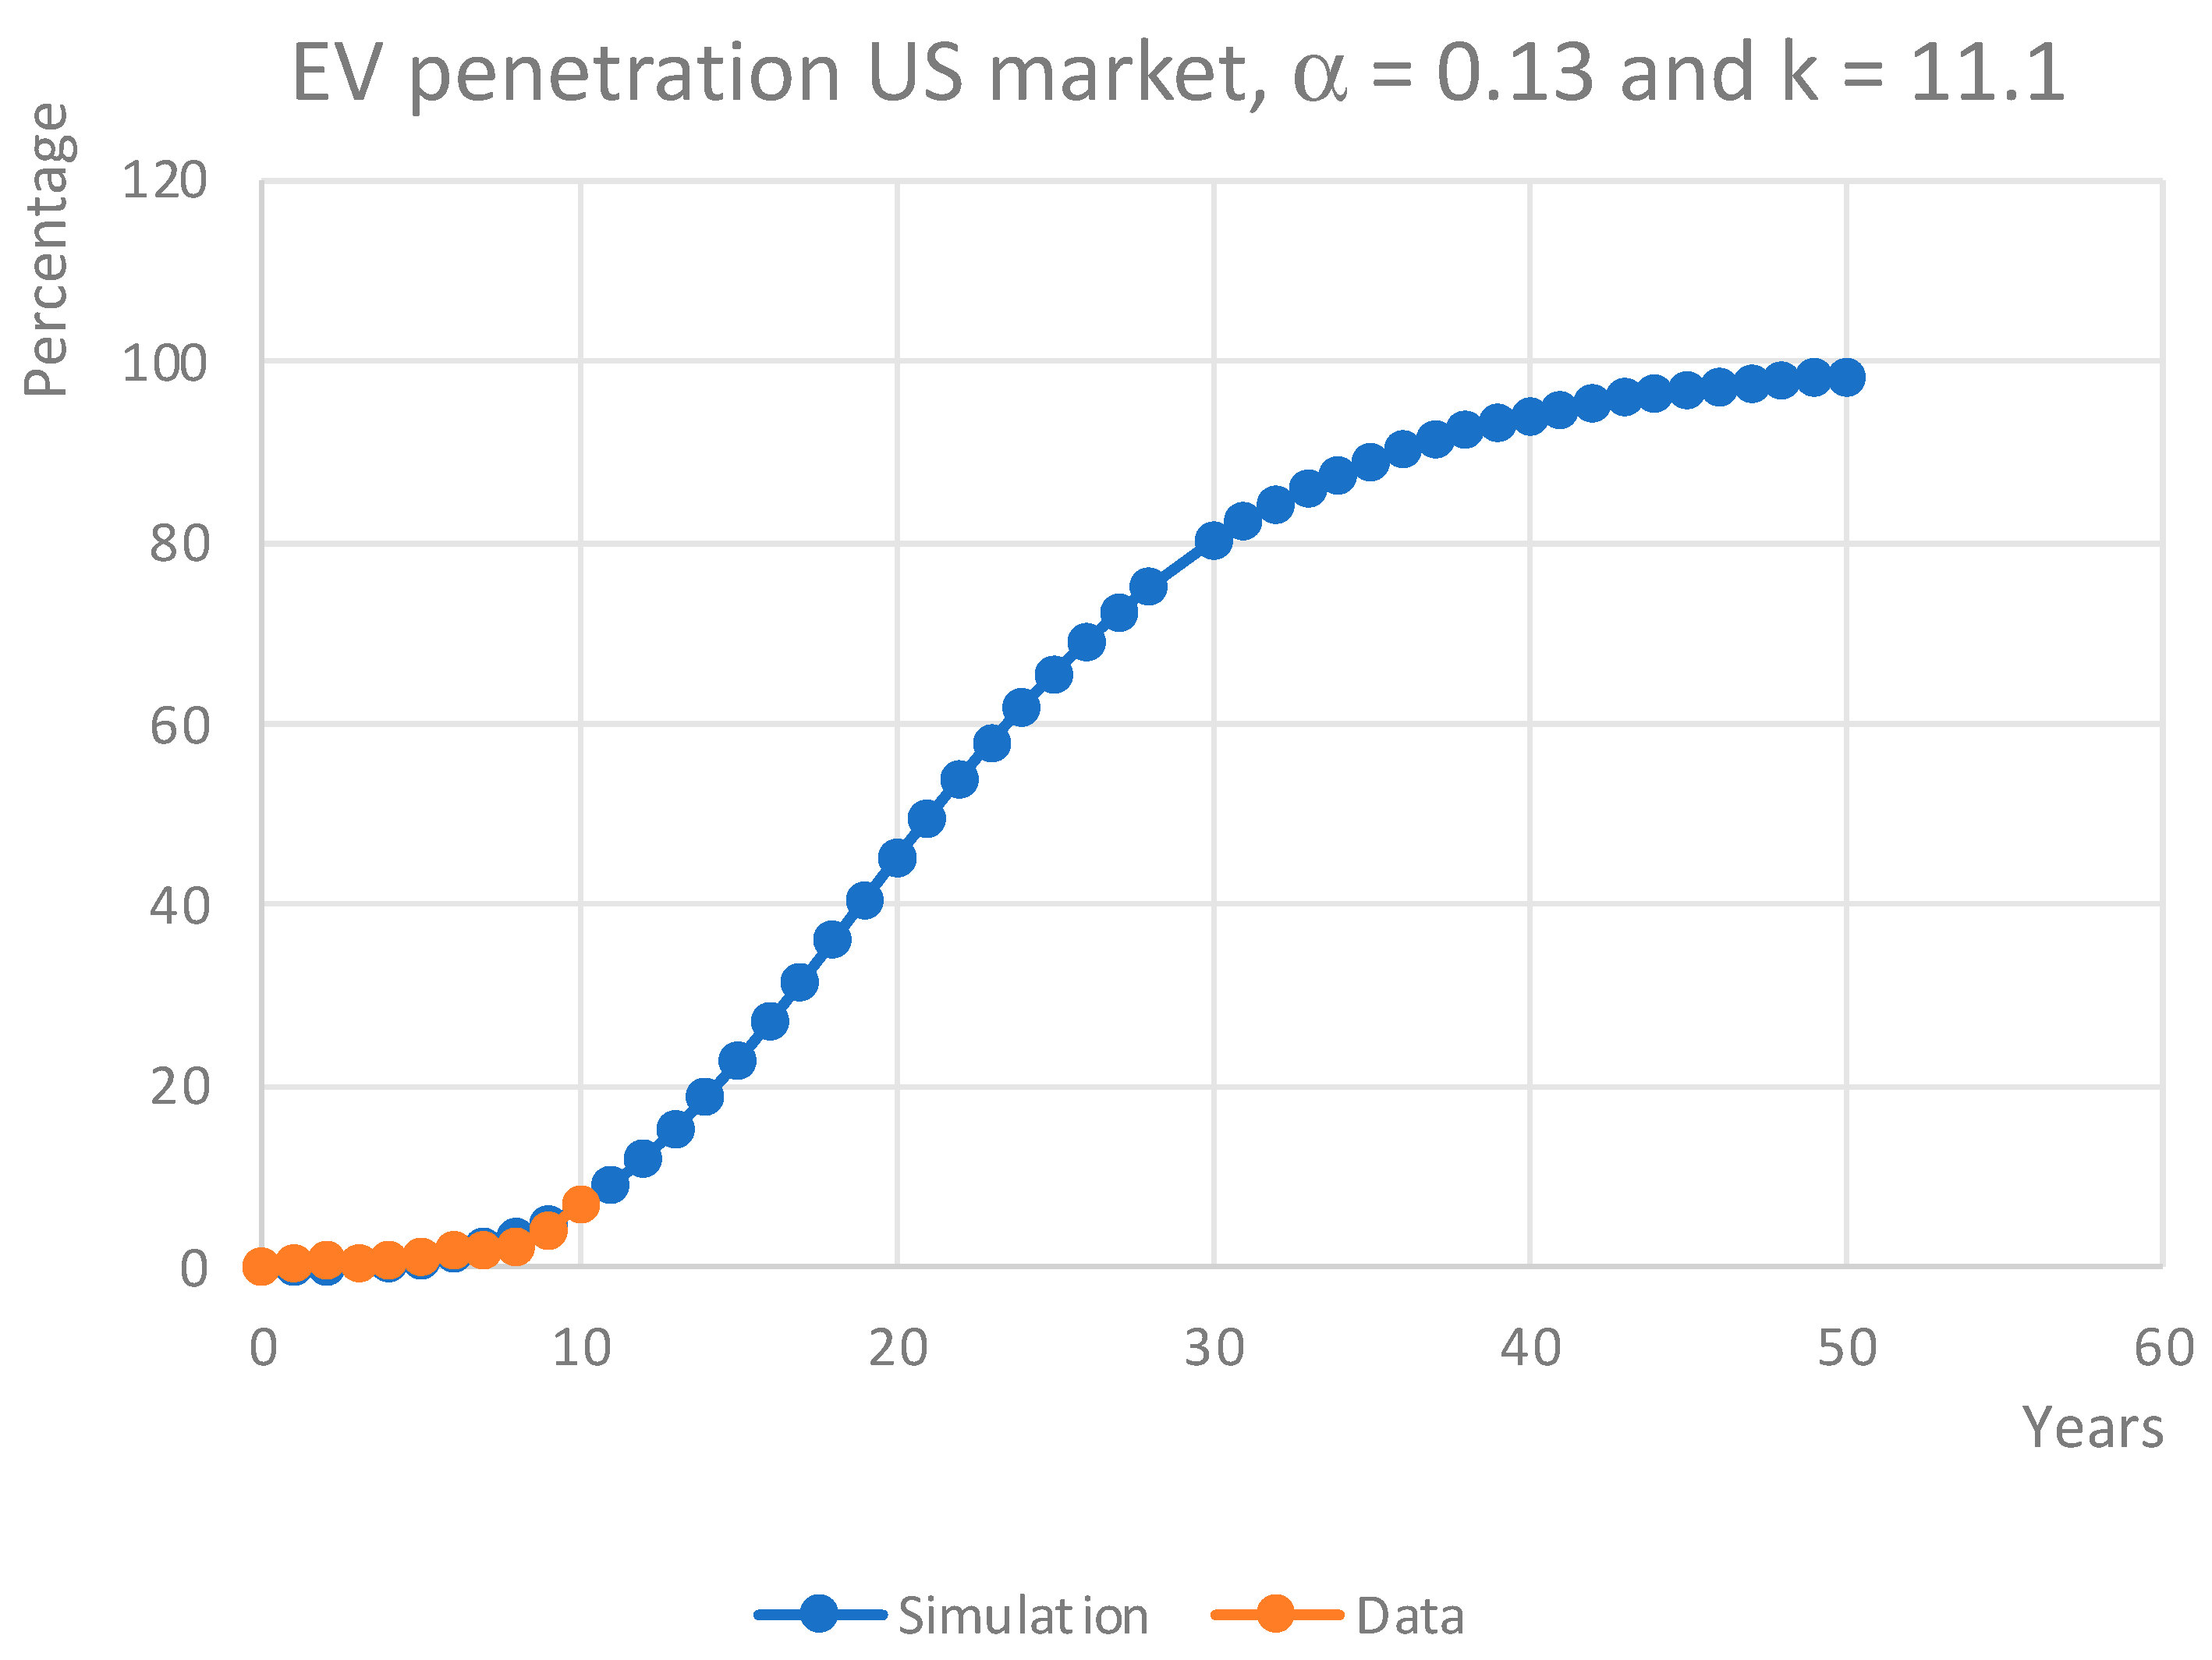
USA market: α = 0.13 and k = 11.1.
The USA market features α = 0.13 and k = 11.1 according to real data and S-curve-based simulations shown in
Figure 9 and
Figure 10.
In 2023, the USA sold 1.4 million new EVs compared to 400,000 used EVs. This results in 1.8 million fresh EV registrations in 2023, which represents 22.22% of pre-owned EVs.
Figure 9 above illustrates the advancement in EV adoption within the US market during the initial decade.
Figure 10 above illustrates the forecast for EV adoption in the US market derived from the real data of the initial 10 years as depicted in
Figure 9, along with a simulation utilizing the S-curve model.
Currently, because of various reasons, EVs lose value more quickly than any other type of powertrain technology. In 2023, electric vehicles depreciated by nearly 50% of their original worth after five years on average [
23]. The Chevrolet Bolt, experiencing a 51.1% depreciation in value, and the Nissan Leaf, with a 50.8% loss, rank among the quickest depreciating EV models after just three years of use [
24].
β and the rate of depreciation.
The comparison depicted in
Figure 11 above illustrates the total EV penetration in the US market alongside the proportion of the used market in new EV registrations for varying β values, ranging from the rapid adoption of second-hand EVs with α = β = 0.13 to β = 0.05, which aligns with the gradual adoption of used EVs. The values of β might diminish as the rate of depreciation rises.
Different factors affecting EV depreciation.
The decline in the value of EVs primarily depends on various factors that can be outlined below [
25]:
- ○
Impact of technology;
- ○
Brand reputation;
- ○
Incentives;
- ○
Mileage and age;
- ○
Battery health and maintenance;
- ○
Battery cost and lifespan;
- ○
Consumer appreciation;
- ○
Market share;
- ○
Availability of charging infrastructure.
The used EV market has an impact on the depreciation of EVs. The ongoing expansion of the EV market will lead to a larger portion of the used EV market. An increased demand for used EVs will benefit EV depreciation.
4. Results and Discussion
The depreciation of electric vehicles, especially driven by advancements in technology and government incentives, significantly influences the trends in the used market. Indeed, there is no question that EVs are functional and practical; advancements in battery technology significantly contribute to the extensive acceptance of EVs [
26,
27]. Batteries that offer greater energy density, quick and efficient charging, along with extended lifespan, render EVs practical and viable for commercial use, creating possibilities for a used market. However, EVs do not simply comprise an electric motor paired with a battery. Technology, such as advancements in battery development, significantly impacts the depreciation rate of EVs [
27], thereby influencing the market for used electric vehicles. Essential enhancements arise from software integration and AI, enabling EVs to deliver a transformation in terms of driving experience and sustainability. Cutting-edge software, data, and systems utilized by a computer to direct operations play a crucial role in the evolution of EV functionality. The software presents several benefits over conventional mechanical systems; it facilitates updates and enhancements without requiring physical changes.
The software serves as the essential framework for the functioning of EVs. The software manages and controls the operation of the vehicle. Data gathering is an integral part of the system since it is employed to assess the vehicle’s performance and potential enhancements.
There are five primary categories of axes in EV software application and development, all associated with vehicle control and management.
Vehicle design and materials: it manages the performance and proper functioning of the essential parts of the vehicle: the battery, electric motors, brakes, lights, etc.
Maintenance: administration, predictive upkeep, and security.
Monitoring: EV problems and interactions with EV drivers.
Navigation: especially aimed at alleviating range anxiety by identifying public charging station locations.
Vehicle to grid: the interconnectivity between vehicles and the grid boosts sustainability, enabling car owners to function autonomously from the grid.
Aside from battery technology, once each of these five aspects mentioned above matures, it could significantly influence depreciation rates and, in turn, impact the growth of the second-hand EV market and the future balance between used and new EVs in new registrations. The model outlined in this manuscript, which predicts the time needed to reach balance in market shares between new and used EVs according to the adoption trends of both vehicle categories, is practical. Nonetheless, parameters β and m in the S-curve, illustrated in Equation (2), which depict the adoption of used EVs, are constant or not time-dependent. This aspect could be open to debate because the time needed to reach equilibrium may be sufficient for the values of parameters β and m in the equation that defines u(t) to change. The variations in β and m will be affected by the advancement in depreciation influencing the acquisition of used EVs. The rate of adoption of used EVs can impact their depreciation, generating a wave effect that could lead to either higher or lower depreciation rates.
The market for pre-owned EVs also influences the depreciation of electric vehicles. As the EV market grows, the share of the second-hand EV market will gain significance, and these used vehicles will achieve better depreciation rates. Here are several important points regarding how the second-hand EV market influences the depreciation of used EVs.
- ○
Availability of pre-owned EVs: after more than ten years of use, the first wave of EVs will move into the second-hand car market. This market is set to keep growing. The increasing number of pre-owned EVs might lead to a situation where supply surpasses demand, resulting in a faster rate of devaluation.
- ○
Influence of newer models on the used EV market: newer electric vehicle models featuring advanced technology, such as AI integration or improved battery range, render older models outdated and less desirable to buyers.
- ○
Economic considerations: government incentives for new electric vehicles enhance their affordability, making used electric vehicles less attractive to consumers unless they are significantly cheaper.
- ○
Consumer knowledge and confidence in EV technology: as EV technology develops and evolves, buyers will be more willing to purchase pre-owned EVs, resulting in higher value.
The EV transition will comprise new EVs for those who can afford them and used EVs for the majority of people in different countries. Nevertheless, the adoption of used EVs may change as technology progresses or subsidies [
18,
19,
20,
21,
24,
25] vary. A completely matured technology will generate depreciation rates that are less dependent on obsolescence.
The model presented in this paper is based on a static approach of the S-curve with parameters β and m. Considering the above comments, a more accurate approach of β and m could be established in a time-dependent manner with β(t) and m(t) to predict the amount of time needed to reach equilibrium in each market.
β(t) plays a crucial role in the rate of acceptance of used EVs if the S-curve is considered to be an appropriate representation for the uptake of EVs in the shift to electric mobility.
The S-curve equation for second-hand EV adoption, as shown in Equation (7) above, is determined by dynamic parameters m(t) and β(t), which indicate the time-dependent aspects of the second-hand EV market’s pickup time and the speed of adoption post-pickup, respectively.
5. Conclusions
The model outlined in this document, which relies on the S-curve, illustrates how an innovation is adopted within a market. Both new EVs and used EVs are viewed as innovations, with used EVs catering to tighter budgets, and they enter the market with a certain delay when compared to new EVs. This model examines the coexistence of new and pre-owned EVs in new registrations. It estimates the years required to achieve equilibrium following a sustained rise in the share of used EVs and a decline in the share of new EVs from the launch of EV technology until it reaches full maturity.
Used items can either be in high demand or have low demand. Rapid depreciation reflects a weak market for pre-owned EVs; however, as subsidies diminish or are phased out and both battery quality improves and costs decline, EVs are expected to retain their value better, likely leading to increased demand. In this model, it is assumed that the ultimate ratio of new to used EVs in a specific market will resemble that of ICE vehicles. This hypothesis might require additional consideration given the particular circumstances of EVs. Enhanced collection of up-to-date data will enhance the prediction of the future equilibrium between new and used EVs in the market and the transition towards complete EV adoption.
The variables k, α, m, and β define the characteristics of a market. In contrast to low demand, the high demand for used EVs will result in a shorter timeframe for reaching equilibrium.
This study is confined to a typical scenario but might be broadened to various conditions that could influence the development of an innovation in a specific market. For instance, safety issues might be associated with the battery, similar to the initial period of the EV, or ICE vehicle manufacturers transitioning to EVs introducing new products and a fresh dynamic in customer preferences. In this context, the outcomes might be more precise if time-dependent variables are incorporated into the S-curve equations, especially for utilized EVs.
Comprehending the relationship and balance between new and used EVs is crucial for the future of waste management, particularly concerning battery recycling or reconditioning as well as the EV industry overall.
The assumption that the ratio of new to used vehicles is similar for ICE vehicles and EVs warrants further discussion because the rapid depreciation of EVs is significantly impacting the used EV market.
This study highlights the necessity of organized data gathering to gain clearer insight into the statistical patterns and dynamics during the EV transition, as well as in the uptake of additional technologies.

