Article

New Tool to Screen Financial Viability of Alternative Public–Private Partnership Structures for Delivery of Electric Vehicle-Charging Infrastructure

by
Patrick DeCorla-Souza
1,* and
Mahir Hossain
2
1
Federal Highway Administration, Washington, DC 20590, USA
2
RCF Economic & Financial Consulting, Inc., Chicago, IL 60601, USA
*
Author to whom correspondence should be addressed.
World Electr. Veh. J. 2025, 16(1), 30; https://doi.org/10.3390/wevj16010030
Submission received: 16 November 2024 / Revised: 24 December 2024 / Accepted: 7 January 2025 / Published: 9 January 2025

Abstract

:
This paper demonstrates the use of an Excel-based tool called the “Electric Vehicle-Charging Infrastructure Financial Analysis Spreadsheet Tool”, or “EVCI-FAST”, developed to analyze public–private partnership approaches to deliver publicly accessible EV-charging infrastructure that would not be commercially viable without a government subsidy. To demonstrate the use of this tool, we conducted a high-level screening analysis for a hypothetical bundle of publicly accessible EV-charging stations to assess the financial viability of delivering electric vehicle-charging infrastructure (EVCI) using alternative public–private partnership (P3) structures. This demonstration suggests that the EVCI-FAST could assist public agencies in determining whether their budgetary resources are adequate to support a proposed P3 for an EVCI project. The demonstration suggests that the EVCI-FAST could also help agencies decide which P3 structuring option would best meet their financial objectives. The results from the analysis of the hypothetical project suggest that public agencies could benefit considerably from a P3 structure that uses a minimum revenue guarantee to reduce revenue risk for the private partner.

1. Introduction

1.1. Background

Publicly funded programs provide financial support for publicly accessible electric vehicle (EV)-charging infrastructure in locations where they may not be commercially viable without public financial support. Grants catalyze private sector investment, and collaboration between the public and private sectors is called a “public–private partnership”, or “P3”.
In the U.S., the public sector provides grants to partially reimburse the private partner as certain costs are incurred. However, such “grant-based” payment arrangements may not ensure the optimal operational performance of the EV-charging infrastructure and the achievement of all the goals of the public agency. A contract that provides cost reimbursements during the planning and construction phase leaves the private partner with less incentive to maintain performance standards during the operation phase and could increase the likelihood that the contractor will simply walk away if the revenue from user charges is inadequate to generate profits or if they find that it is too costly to achieve the performance standards set out in the contract.
These challenges could be addressed through innovative performance-based P3 contracting approaches [1,2]. Performance-based P3s involve long-term contractual arrangements between the public and private sectors, under which compensation for the private partner’s initial investment and on-going operations depends on them achieving project goals in accordance with contractual performance requirements. The key difference relative to the “grant-based” reimbursement approach is that the private partner finances all or a large part of the upfront investment and is compensated for those investments only during the operation phase through user charges and “availability payments” from the government. An availability payment is a scheduled payment made by a public agency to a private entity under a P3 contract. The payment is contingent on the availability and performance of the infrastructure or service, ensuring that the facility meets the specified performance standards established in the contract. If the facility is not available or does not meet those standards, the concessionaire may face penalties or deductions in the payment. Government payments can be reduced or withheld by the public agency if performance standards are not met. So, the private partner has a much greater incentive to maintain performance standards during the entire operation phase.
A P3 contract for EV-charging infrastructure does not normally require that the public agency take on significant commercial risk. The private partner has an exclusive right to collect user fees from the EV-charging infrastructure sites in order to help repay its investment and operation costs, thus taking on considerable revenue risk due to the high uncertainty in the demand and revenue from charging fees. However, a transfer of all revenue risk may not be optimal from the public agency’s perspective, since investors are likely to consider the highly uncertain future charging revenues and set a larger risk premium that will increase their bid prices.
To reduce revenue risk for bidders, the public agency could provide a “minimum revenue guarantee”, or MRG, which is a “floor” below which the public agency would make up any revenue shortfall with a government subsidy. To protect the public agency from high contingent liabilities, this floor could be set at a level such that the present value of the guaranteed revenue paid out by the government never exceeds a specified amount.
On the other hand, the demand for the use of the EV-charging infrastructure may increase faster than anticipated and lead to a return on investment for the private partner that is higher than is reasonable. To guard against such “windfall profits” for the private partner on a publicly subsidized investment, the P3 agreement could include a revenue-sharing mechanism to allow the public agency to share in revenues that exceed a certain threshold.
A financial viability analysis can help a public agency decide on the most advantageous P3 structure from the public agency’s perspective. A financial analysis tool can help the public agency understand the potential impacts of alternative P3 structuring options on its financial position. In this paper, we demonstrate the use of a new financial analysis tool that we developed to assist public agencies in understanding the financial impacts of alternative P3 structures.

1.2. Literature Review

Our literature search found no suitable analytical tools that could be used to perform the type of analysis that is needed to evaluate P3 structures for electric vehicle-charging infrastructure. There are analytical tools that can assist in conducting financial viability analyses of highway P3 projects. In 2010, the Government of India released an analytical tool for the financial evaluation of highway P3 projects, where the concessionaire takes on revenue risk [3]. In 2009, the Public–Private Infrastructure Advisory Facility published its P3 Toolkit [4], which also only evaluates highway P3 projects with revenue risk. Following up on this effort, Mladenovic and Queiroz [5] presented a tool that can evaluate hybrid P3 projects that combine both availability payments and revenue risk. In 2014, DeCorla-Souza [6] presented a tool for the Value for Money analysis of highway P3 projects that could evaluate both availability payments and revenue risk in P3 projects.
More recently, two tools have been developed to assist in the financial analysis of electric vehicle-charging infrastructure. In 2020, the National Renewable Energy Laboratory [7] released a tool to assist in the financial analysis of electric vehicle infrastructure, but it could not evaluate alternative P3 structures. In 2023, Atlas Public Policy [8] published a tool to calculate the costs associated with operating electric vehicle-charging infrastructure. This tool can assist in calculating costs but not in calculating revenues or financial viability for P3 options. In 2023, the Institute of Transportation Studies [9] studied the costs associated with installing corridor DC fast chargers in California. This research did not address revenues or financial viability.
While the data and methodologies used in the above studies are helpful, they are unable to specifically help public agencies in assessing the financial viability of a P3 project for publicly accessible electric vehicle-charging infrastructure (EVCI). We therefore developed an Electric Vehicle-Charging Infrastructure Financial Analysis Spreadsheet Tool (EVCI-FAST) to assist in conducting a high-level screening analysis to assess the financial viability of delivering an EVCI project using a P3 [10]. This paper demonstrates the use of the EVCI-FAST for the financial viability analysis of a hypothetical EVCI P3 project. The EVCI-FAST model methodology could also be applied to any revenue-generating project. Our objective is to demonstrate how the model could be applied specifically to EV-charging infrastructure since the EVCI-FAST model includes specific features for revenue generation inputs that are specific to EV infrastructure.

1.3. Novelty and Key Contributions

Public agencies are looking to partner with private developers to install and operate electric vehicle-charging infrastructure in locations where they may not be commercially viable without a public subsidy. Our literature review suggests that there are no financial analysis tools that these public agencies could use to consider and evaluate the financial impacts of such public–private partnership agreements on their budgets and, therefore, their ability to provide public subsidies to incentivize the private development of electric vehicle-charging infrastructure. The main contribution of our work for practitioners is the creation and demonstration of an analytical tool that can fill the gap in the availability of appropriate tools for the financial analysis of alternative public–private partnership approaches to develop electric vehicle-charging infrastructure. The main contribution to academics is our application of existing P3 financial structuring mechanisms (i.e., availability payments and MRG) currently used in other industry sectors to a new industry sector, namely electric vehicle-charging infrastructure, and the demonstration of a new tool that could be modified to assist in training focused on other energy infrastructure sectors.

1.4. Structure of the Paper

Section 2 describes the EVCI-FAST model. In Section 3, we describe the hypothetical project, alternative P3 structures, and model inputs to reflect the alternative structures. Section 4 presents the model results. Section 5 discusses the results and the value of the research. Finally, Section 6 summarizes the key findings, discusses the limitations of the research, and provides thoughts on future research to further validate our findings.

2. Model Description

The EVCI-FAST was programmed in Excel to ensure the accessibility of the tool for the non-technical local or state government staff that are typically involved in the procurement of electric vehicle-charging infrastructure. This tool helps in assessing the financial viability of an EVCI P3 project, including the potential range of public subsidies that may be required, as well as potential payments from the private partner to the public agency in cases where the EVCI project may be capable of generating surplus revenue. Figure 1 provides a visual overview of the tool. The model inputs and outputs are explained in more detail in the following subsections.
The detailed analytical process used by the tool to perform calculations is discussed in the user guide [10]. Also, the tool may be downloaded free of charge from the web page https://www.fhwa.dot.gov/ipd/p3/toolkit/analytical_tools/evci_fast/ (accessed on 6 January 2025). In brief, a project’s financial feasibility is estimated based on model inputs such as initial costs, operating expenses, revenue projections, and other essential financial parameters. The key steps are as follows:
  • Revenue estimation: The model estimates the project’s revenues based on assumptions about user demand, pricing, and demand growth.
  • Cost estimation: This involves estimating both initial capital expenditures (CapExs) and ongoing operational expenses (OpExs). Inputs are provided in current-year (real) USD, and the model uses escalation factors to project these costs to future years of the project’s lifespan or P3 concession term length.
  • Cash flow analysis: The model then calculates detailed cash flows (nominal USD) over the project’s lifecycle. This includes projected inflows from revenues and outflows from expenses.
  • Discounted Cash Flow (DCF) analysis: This step involves discounting future cash flows to the present value using a discount rate to account for the time value of money and the risk associated with the cash flows. The Net Present Value (NPV) is then calculated to assess the overall value the project will add. If the NPV is negative, a government contribution would be needed to make the project financially viable.
  • Financial metrics: The model then calculates key financial metrics such as the Internal Rate of Return (IRR) and payback period to provide additional measures of the project’s financial performance.

2.1. Inputs—Constant Tab

Model inputs that are input in current-year (real) USD and then projected to obtain future values are called “constant” inputs, and inputs that are input for each year in future years are called “time series” inputs. The inputs—constant tab in the EVCI-FAST is used to input USD values (in terms of real USD), which may be projected to future years using escalation factors input into the model. Sections are provided for estimates of initial capital costs, demand, and revenues. In addition, the user inputs key financing assumptions such as the discount rate, escalation factors, and the number of operational years during which the P3 contract is active.
  • Inputs for capital cost estimates: Users may enter detailed information into the cells provided or may enter a total estimate. The user also enters cost allocation in the planning and construction phase as the percentages of the initial capital cost that are expended in each year of the planning and construction phase.
  • Inputs for revenue estimates: Users can select a baseline (i.e., best-guess forecast), pessimistic, or optimistic scenario to develop a range. The optimistic and pessimistic scenarios will multiply baseline (best-guess) revenues by a multiple that the user inputs for each scenario. The baseline (best-guess) multiple is 1.00. The estimate of the share of charging that takes place during peak hours is entered as a percentage. The price per kWh paid by the user of the EV port during peak and non-peak hours is used along with peak-hour charging share to calculate a weighted average price. Alternatively, if data on the peak- versus non-peak-hour charging price are unavailable, a weighted average price per kWh may be input into the peak-hour price cell, with the peak-hour charging share input as 100%.
  • Inputs to estimate demand: The EVCI-FAST uses a bottom-up approach to arrive at a value for total annual visits based on the user input of the estimated average charge duration per EV (hours), the occupancy per charger (average % per 24 h period), and the number of ports. Alternatively, users may conduct their own calculations and enter them into the User Override cell.

2.2. Inputs—Time Series Tab

The Inputs—Time Series tab has values that change over the analysis period. These include operation and maintenance costs (O&M), additional capital requirements such as equipment replacement, and annual revenues. All values are entered in nominal USD (i.e., year-of-expenditure USD). Next, sections are provided to input government support and, optionally, to input revenue estimates (if the user has calculated revenues externally) and optional revenue structures, such as the minimum revenue guarantee (MRG) and revenue sharing.
  • Input for government support: the user provides inputs for the maximum governmental reimbursement as a % of the project costs that are eligible for reimbursement by the government.
  • Input for revenue structures: Two optional revenue structures may be input as applicable. These are a minimum revenue guarantee (MRG) and a revenue-sharing strategy. If an MRG is in place, then the input will be a percentage of the baseline (best-guess) forecasted revenues for the project. For example, if the MRG is 60%, this means that if the project falls short of 60% of the baseline (best-guess) forecasted revenues, the agency will pay the difference between the actual revenue and 60% of the baseline (best-guess) forecasted revenue. If a revenue-sharing strategy is in place, the user inputs the percentage of revenue retained by the private developer. The threshold that triggers the revenue-sharing mechanism is also input as a percentage of the baseline (best-guess) forecasted revenues.

2.3. Intermediate Model Outputs

The Outputs tab contains results in nominal USD for costs, revenues, government support, operating income, and revenue structures, as discussed below.
  • In the Cost Estimate Output section, a summary of costs is provided for the planning and construction phase and the operation phase. Note that cost estimates that are input in real USD in the Inputs—Constant tab are multiplied by escalation factors to output the values in year-of-expenditure USD in the Outputs tab.
  • The Revenue Estimate Outputs show revenues from charging activity, fees, and subscriptions and any other revenues, if applicable. Note that revenues may be input in nominal USD in the Input—Time Series tab, or they may be optionally calculated by the model based on demand-related inputs that are provided in the Inputs—Constant tab. The demand-related inputs are multiplied by “constant” input growth rates provided in the Inputs—Constant tab to output the revenue estimates in year-of-expenditure USD.
  • In the Government Support Output section, government subsidies under grant-based and performance-based P3s are provided. For a grant-based P3, the outputs are simply the subsidy amounts calculated over the planning and construction period and the operation period and the NPV of these subsidies. For a performance-based P3, the NPV of the availability payments is calculated as the difference between the NPV of the total revenues and the NPV of the total eligible costs. Then, this value is distributed equally over the operational years and multiplied by the future value factor calculated for each year. The future value factor is equal to 1 divided by the discount factor for each year, and the discount factor for each year is calculated as 1/(1 + r) ^n (where “r” is the discount rate and “n” is the period in years).
If the NPV of the availability payments as a proportion of the NPV of the total costs is smaller than the allowable subsidy coverage % (input by the user in the Input—Time Series tab), then the full availability payment will be reimbursed by the government. If it is greater than the allowable subsidy coverage %, then the remaining portion is the non-reimbursed amount. This amount would need to be subsidized by another source or the public agency partnering in the project would need to provide an additional subsidy if the project is to be financially viable.
  • The Net Operating Income is simply the revenues minus the costs during the operation phase of the project.
  • The results of any Optional Revenue Structures are provided annually over the scenario timeframe.
Note that both availability payments with revenue-risk (AP/RR) and MRG structures provide the concessionaire with financial contributions from the government if there is a revenue shortfall relative to the revenues needed for financial viability, i.e., revenues needed to pay all eligible costs. However, they do so in different ways. With availability payments, the total required government contribution is calculated in advance in NPV terms based on forecasted revenues, and then these total required contributions are spread over the operation period to determine the required annual government contributions. With the MRG, while the annual revenues required for financial viability are calculated in advance, the private partner is only compensated if there is an actual revenue shortfall relative to those required annual revenues.

2.4. Discounted Cash Flow Analysis

The Discounted Cash Flow Analysis tab includes the Discounted Cash Flow, Net Present Value, Internal Rate Of Return, and discounted payback period for the project. A Discounted Cash Flow (DCF) table is present for grant-based, availability payment with revenue-risk (AP/RR) and MRG approaches. The discount factor is calculated as 1/(1 + r)n (where “r” is the discount rate and “n” is the period in years).
  • Net Present Value (NPV): The discount factor is multiplied by the free cash flows to calculate Discounted Cash Flows (i.e., present values of future cash flows), which are summed to obtain the NPV. Typically, if the NPV ≥ 0, then the project is financially viable.
  • Internal Rate of Return (IRR): The IRR is the annual rate of return that an investment is expected to generate. In the AP/RR approach, due to the way availability payments are calculated (i.e., using a discount rate exactly equal to the required Internal Rate of Return), the NPV will be zero and the IRR will be equal to the input discount rate.
  • Payback Period: The discounted payback period is the amount of time required to recoup the investment. If the cumulative Discounted Cash Flows are not ≥0, then the payback period is not within the period of the analysis.
  • Subsidy Adjustment: For a grant-based approach, there is an additional output called the Optimal Subsidy Adjustment. If the NPV of the project is negative, even with grants provided at the maximum allowable %, then the additional subsidy that will be required for financial viability (i.e., for NPV ≥ 0) will be shown here. If the NPV is positive, the value shown here indicates the amount of payment to the private partner beyond what it would need to meet its target rate of return.

2.5. Outcomes Dashboard

The Outcomes Dashboard tab contains statistics and charts summarizing key financial data relevant to the EVCI project. This is segmented into key project data, grant-based P3 data, AP/RR data, and MRG data. Charts showing results for annual values of costs, revenues, cash flows, and operating income are provided.

3. Scenario Construction

3.1. Prototypical Project and Alternative P3 Approaches

The analysis in this paper used the EVCI-FAST to demonstrate a P3 financial viability evaluation for a hypothetical bundle of charging stations. The project bundle included a total of eighty ports. The public agency estimated a “best-guess” revenue forecast (baseline forecast), and it expects that user demand and revenue will be highly uncertain. The optimistic revenue scenario is estimated at 50% above the baseline “best-guess” forecast. The pessimistic scenario is estimated at 50% below the baseline (best-guess) forecast. The term length of the P3 agreement is anticipated to be 5 years of operation. There are no rehabilitation costs expected during the 5-year term of operations.
The purpose of the analysis was to estimate the potential impact on the public partner’s financial position from alternative P3 structures. The pessimistic revenue scenario would have the maximum financial impact on the agency. So, the pessimistic scenario was the scenario of primary interest. We also assumed that all standards in the contract would be met by the concessionaire in order to reflect the maximum subsidy that a public agency would have to provide so that the public agency could be prepared by allocating the needed funds in its budget.
We evaluated the following alternative P3 structures:
(1) A grant-based P3 structure typical of a U.S. Government federal-aid project under which the private partner retains all revenue and is reimbursed for a portion of eligible project costs at a predetermined percentage level throughout the planning and construction phase and operation phase (after subtracting revenue receipts);
(2) A hybrid availability payment/revenue-risk (AP/RR) P3 structure, with government-funded availability payments beginning after the start of the operation phase;
(3) A minimum revenue guarantee (MRG) structure, with government contributions made only when revenues are below those needed for financial viability.
To estimate the maximum government support that might be needed under each P3 structure, the EVCI-FAST was run for the pessimistic revenue scenario for each P3 structure. Note that if there is a desire to estimate the financial impacts on the public agency for a public ownership structure instead of a P3, financial impacts with simple public ownership can be estimated by using 100% as the government support percentage in the “Government Support Inputs” in the “Inputs—Time Series” tab, with an appropriate discount rate to reflect the government’s cost of borrowing in the “Inputs—Constant” tab. The government’s financial contribution in NPV terms would then be calculated as the NPV of revenues minus the NPV of costs.

3.2. Common Inputs for All Alternatives

Costs for all three alternatives were estimated as discussed below:
  • Initial capital and construction costs: A study by the Institute of Transportation Studies [9] found that a large share of project capital costs comprises site “make-ready” infrastructure costs, which vary greatly due to site-specific factors and design choices. The study found that project capital costs ranged from USD 122,000 to USD 440,000 per DCFC charging port. For the 80 DCFC ports in our hypothetical project, we estimated a total capital cost of USD 11,500,000, or an average cost of USD 143,750 per port.
  • Energy costs per year: The cost of electricity for an EVCI operator varies depending on number of ports, the occupancy of the ports, and the power delivered by the port. To estimate energy costs under a pessimistic scenario, we assumed power delivery at 50 kWh for a DCFC port, a pessimistic occupancy rate of 12.5% (which equates to an occupancy rate of 25% for the baseline “best-guess” scenario), and an energy cost for the operator of USD 0.06 per kWh, representative of states with low electricity rates like Louisiana, coupled with energy cost-cutting strategies like Energy Storage Systems (ESSs), negotiations with utility providers, and, potentially, solar energy on site. With these assumptions, the annual costs were estimated as follows: 50 kWh × (8760 h per year × 0.125 occupancy) × 80 ports × USD 0.06 = USD 262,800. For simplicity, we rounded off the annual cost to USD 250,000. This estimate would increase as occupancy rates increase under less pessimistic scenarios.
  • Operations and maintenance costs: According to USDOE’s Alternative Fuels Data Center [11], station owners should plan to allocate around USD 400 per charger per year for general maintenance and an additional USD 800 per charger per year for extended warranties. This amounts to a total of USD 1200 per year. However, these estimates are sourced from a January 2018 report. Adjusting for inflation using the Producer Price Index by Commodity [12], we estimated the adjusted cost at USD 1654 per DCFC port and a total of USD 132,337 for 80 ports. We used an estimate of USD 200,000 in the first operational year to account for other operational costs, such as costs for station site insurance and other general station site maintenance costs.
We estimated model inputs for demand as discussed below.
  • Demand growth rate: The EV market is expected to grow at a compound annual growth rate of 10.49% from 2024 to 2029 according to Statista [13], whereas the International Energy Agency [14] projects that 2024 EV sales in the U.S. will increase by 20% compared to 2023. Since the former estimate is a multi-year projection, we gave more weight to that estimate when arriving at our estimate of 11.5%.
  • Inflation rate: We used an estimate of 2.5% for inflation since the US inflation rate has come down to between 2% and 3% at present [15].
  • Energy cost escalation: This rate was estimated at 14.3% by combining the inflation rate and the demand growth rate inputs, i.e., (1.025 × 1.115) − 1 = 0.143.
  • Estimated EV Charge Duration: USDOT [16] indicates that the average battery electric vehicle takes 20 min to 1 h to charge with a DCFC port. We assumed an average of 30 min per charging session.
  • Estimated occupancy per port: The Transportation Energy Institute [17] found that EV port utilization can range from 0.9% to 24% in the US. We estimated a utilization rate of 12.5% under the pessimistic scenario.
Other model inputs were estimated as follows:
  • Average price per kWh: EV Connect [18] indicates that DCFC charging costs for customers range from USD 0.20 to USD 0.40 per kWh. We assumed a value of USD 0.36 per kWh.
  • Discount rates for P3 structures: we used a discount rate that reflects the expected market rate of return on equity, which is approximately 10% when considering historic annualized average returns of the S&P 500 index [19].
  • Average energy sold per charging session: In a study of EV owners, USDOE [20] estimated that the average energy consumed per charging session was 22 kWh. We rounded this estimate up to 25 kWh per charging session.
  • Term length: a term length of 5 years of operation was assumed, consistent with the relatively short lifecycle of EV-charging equipment.

3.3. Alternative Specific Inputs

The three P3 structures were tested with the pessimistic scenario, as follows:
  • Grant-based P3 alternative: The P3 structure scenario was set as grant-based (Inputs—Constant tab). In the same tab, the Revenue Scenario Selector was set as pessimistic. Grant-based cost reimbursement was set to 80%, which is typical of U.S. Government federal-aid projects. This was input for every year throughout the concession period (including both the planning and construction phase and operation phase) in the Inputs—Time Series tab.
  • AP/RR alternative: The P3 structure scenario was set as performance-based in the Inputs—Constant tab. In the same tab, the Revenue Scenario Selector was set as pessimistic. In the Inputs—Time Series tab, revenue-sharing strategy inputs were input as follows:
    Threshold for revenues triggering the upside revenue-sharing mechanism: 60% of baseline (best-guess) forecasted revenues (i.e., 120% of the pessimistic revenue forecast);
    Proportion of revenue above the revenue cap the private developer will collect: 50%.
  • MRG alternative: The P3 structure scenario was set as the minimum revenue guarantee in the Inputs—Constant tab. In the same tab, the Revenue Scenario Selector was set as pessimistic. In the Inputs—Time Series tab, revenue structure inputs were input as follows:
    Minimum revenue guarantee private sector is eligible to receive from agency: USDOT [21] indicates that international agencies have guaranteed up to 90% of forecasted revenues for P3 projects. We therefore used 90% of the forecasted baseline “best-guess” revenues (i.e., 180% of the pessimistic revenues) because we found, through trial runs of the model, that this level would be sufficient for the project to meet the private partner’s target rate of return of 10%.
    Threshold for revenues triggering the upside revenue-sharing mechanism: 100% of forecasted baseline “best-guess” revenues.
    Proportion of revenue above the revenue cap the private developer will collect: 50%.
Three more model runs were then carried out for the MRG alternative to test revenue scenarios where the actual revenue may be higher. We changed the pessimistic multiplier from 0.5 to 0.7 to reflect actual revenues at 70% of the baseline (best-guess) forecast and to 0.9 to reflect actual revenues at 90% of the baseline (best-guess) forecast. The third revenue scenario setting was set at baseline (best guess), i.e., 100% of the baseline (best-guess) forecast. The purpose of these additional model runs was to analyze the financial impact on the public agency if actual revenues exceed the pessimistic scenario forecast. Also, for these runs, the energy cost component of annual energy costs in the first year of operations was escalated in proportion to the increase in demand, i.e., to USD 350,000 for the run with 70% of the baseline (best-guess) revenue, USD 450,000 for the run with 90% of the baseline (best-guess) revenue, and USD 500,000 for that with 100% of baseline (best-guess) forecast revenue.

4. Results

It should be noted from the outset that the model inputs described above reflect scenarios and thresholds for each alternative P3 approach that would commonly be considered by a public agency, and the results therefore reflect the combination of payment mechanisms and scenario assumptions. The EVCI-FAST would assist public agencies in understanding the financial impacts of the combination of the payment mechanism and scenario assumptions selected by them for their analysis.
Figure 2 and the first three columns of Table 1 show results from model runs for the three P3 structures under a pessimistic revenue scenario, i.e., 50% of baseline (best-guess) revenue. The financial contributions that would need to be made by the public sector are presented in the NPV of Government Contribution row. The results suggest that, because the government’s share of eligible costs was pre-determined at a rate of 80% of the eligible costs, the government contributions would be higher than needed for the target private sector rate of return under the grant-based P3, leading to a return on private investment exceeding 35%, which is much higher than the target market rate of return of 10%. On the other hand, government contributions would be much lower under the AP/RR and MRG alternatives and just adequate to meet the “hurdle” private rate of return of 10% which is required to ensure financial viability. The analysis results from the tool indicate that the government could reduce its pre-determined share of eligible project costs significantly under the grant-based P3 option. Re-running the tool iteratively with lower percentages for allowable reimbursement could help the government determine more optimal percentages for reimbursement.
Figure 3 and the last three columns in Table 1 show the results for the MRG structure under scenarios where the actual revenue receipts are equal to 70%, 90%, and 100% of the baseline (best-guess) forecast revenues. Operating costs also increase due to more energy usage as demand increases above the pessimistic scenario, while the total income to the private partner from revenues and government contributions stays at 90% of the baseline revenue forecast, i.e., the MRG amount, under scenarios where the actual revenues are equal to 70% and 90% of the baseline forecast. This causes the private rate of return to fall below 10%, suggesting that, to ensure financial viability as actual demand increases above the pessimistic level, there will need to be additional government contributions to compensate the private partner for operating cost increases as demand increases from the pessimistic level up to the MRG forecast level.
Table 2 and Figure 4 present the USD contributions that the public partner will need to make for each year of the concession term in year-of-expenditure (i.e., nominal) USD. The results are first presented for the three P3 structures under the pessimistic revenue scenario with revenues at 50% below the baseline (best-guess) scenario. The grant-based P3 structure involves large upfront government contributions in the planning and construction phase (pre-determined as 80% of the eligible costs), but during operations, no government contributions are needed because the revenues exceed the O&M costs. The profile of required government contributions is roughly the same for the AP/RR and MRG alternatives; the MRG alternative requires government contributions that are slightly lower than the AP/RR in the first 3 years of operations but slightly higher than the AP/RR in the last 2 years. Note that availability payments increase each year due to the application of escalation factors.
Next, Table 2 presents the results for the MRG structure with the actual revenues at 70%, 90%, and 100% of the baseline (best-guess) revenues. The results clearly show a drop in government contributions as revenues increase. These effects can also be seen in Figure 4.

5. Discussion and Value of This Research

5.1. Discussion of Results

The analysis for the hypothetical EVCI project evaluated in this paper suggests that the grant-based P3 approach has the greatest risk of resulting in higher rates of return for the private partner as a result of government payments above the level needed for financial viability. Also, as explained earlier, the public agency may have little leverage to ensure that performance standards are met during the operation phase since user revenues may exceed operational costs and the private partner will not be reliant on the public partner for any financial support. (For example, even though a bundle of charging ports brings in revenues that exceed costs, a specific charging port in a bundle may be located in an area where it does not bring in sufficient revenue to make up for the costs required to bring it up to standard, reducing the private partner’s incentive to make the repairs needed to bring it up to standard.)
The AP/RR structure allows the public agency to determine in advance the amount of government financial support needed to ensure that the rates of return to the private partner do not exceed a reasonable rate of return. Governmental payments only start after operations begin so that the public agency will be in a better position to enforce operational performance standards through performance deductions from its scheduled availability payments if standards are not met.
As with the AP/RR structure, the MRG structure can be set up in such a way that government payments begin only after operations start. The MRG level can be set, by model iteration, to ensure that the private partner’s desired “hurdle” rate of return (required to attract its investment in the project) is achieved. If the pessimistic revenue scenario does materialize, this approach is likely to place similar demands on the public agency’s budget compared to the AP/RR structure. However, an advantage of this approach is that the public agency will need to make much lower financial contributions if the actual revenues exceed the pessimistic projections.

5.2. Value of This Research

The EVCI-FAST can assist in educating government staff on financial concepts and how to evaluate public–private partnership approaches to deploy electric vehicle-charging infrastructure. The U.S. Federal Highway Administration has incorporated the tool into its training course on the “Use of Public–Private Partnerships for Delivery of Electric Vehicle-Charging Infrastructure”. This training course targets public sector staff from procurement offices, finance offices, planning offices, and infrastructure design and construction offices. While this training focuses on electric vehicle-charging infrastructure, training focused on other energy infrastructure sectors could also benefit from a modified version of the EVCI-FAST. The EVCI-FAST could be a good example of the kinds of tools that future energy informatics specialists [22] may need to develop or work with. Thus, the EVCI-FAST could be significant in the context of education and training for the next generation of energy professionals [23].

6. Conclusions

The main contribution of our work is the creation and demonstration of an analytical tool that can fill the gap in the tools available for the financial analysis of alternative public–private partnership approaches to deploy electric vehicle-charging infrastructure. This paper demonstrated that the EVCI-FAST could be helpful for public agencies in developing estimates of the range of public subsidies that could be needed in order to determine whether their budgetary resources are adequate to support a proposed P3 for an EVCI project. The EVCI-FAST could also help agencies decide which P3 structuring option would best meet their financial objectives. The results from the analysis of the hypothetical project presented in this paper suggest that public agencies could benefit considerably from a P3 structure that uses a minimum revenue guarantee to reduce revenue risk for the private partner.
Due to data limitations, the authors were unable to use a real-world example for the analysis. Further research could use a real-world case study to validate our analysis results and make the findings much more compelling and relatable for policymakers and stakeholders.

Author Contributions

Conceptualization, methodology, validation, formal analysis, investigation, resources, data curation, original draft preparation, review and editing, and visualization, P.D.-S. and M.H. Software programming, M.H. All authors have read and agreed to the published version of the manuscript.

Funding

This research received no external funding. The development of the EVCI-FAST model used in this research was entirely funded by the Federal Highway Administration (FHWA), which is Patrick DeCorla-Souza’s employer.

Data Availability Statement

The EVCI-FAST Excel spreadsheet and user guide may be downloaded at https://www.fhwa.dot.gov/ipd/p3/toolkit/analytical_tools/evci_fast/ (accessed on 6 January 2025).

Conflicts of Interest

The authors declare no conflicts of interest. Mahir Hossain is employee of RCF Economic & Financial Consulting, Inc. The paper reflects the views of the scientists and not the company. The FHWA had no role in the design of the study; in the collection, analyses, or interpretation of data; in the writing of the manuscript; or in the decision to publish the results.

Acronyms

AP/RRavailability payment/revenue risk
DCFDiscounted Cash Flow
DCFCdirect-current fast charger
EVelectric vehicle
EVCIelectric vehicle-charging infrastructure
EVCI-FASTElectric Vehicle-Charging Infrastructure Financial Analysis Spreadsheet Tool
IRRInternal Rate Of Return
MRGminimum revenue guarantee
NPVNet Present Value
O&Moperations and maintenance
P3public–private partnership
USDOEUnited States Department of Energy
USDOTUnited States Department of Transportation

References

  1. Federal Highway Administration. State of the Practice of Public-Private Partnerships for Electric Vehicle Charging Infrastructure. FHWA. 2024. Available online: https://www.fhwa.dot.gov/ipd/pdfs/p3/state_of_the_practice_of_p3s_for_ev_charging_infrastructure.pdf (accessed on 6 January 2025).
  2. Federal Highway Administration. Structuring Options for Performance-Based Contracts Under the NEVI Program: A Discussion Paper. FHWA. 2024. Available online: https://www.fhwa.dot.gov/ipd/pdfs/p3/structuring_options_for_ev_charging_infrastructure.pdf (accessed on 6 January 2025).
  3. Government of India. PPP Toolkit for Improving PPP Decision-Making Processes. Government of India Ministry of Finance. 2010. Available online: https://ppp.worldbank.org/public-private-partnership/library/ppp-toolkit-improving-ppp-decision-making-process (accessed on 6 January 2025).
  4. PPIAF. Toolkit for Public-Private Partnerships in Roads and Highways. Public-Private Infrastructure Advisory Facility. 2009. Available online: https://www.ppiaf.org/sites/ppiaf.org/files/documents/toolkits/highwaystoolkit/index.html (accessed on 6 January 2025).
  5. Mladenovic, G.; Queiroz, C. Enhancing the Financial Feasibility of PPP Projects with Hybrid Funding. In Proceedings of the International Conference on Traffic and Transport Engineering, Belgrade, Serbia, 27–28 September 2018; pp. 592–599. Available online: https://www.academia.edu/90072235/Enhancing_the_Financial_Feasibility_of_PPP_Projects_with_Hybrid_Funding (accessed on 6 January 2025).
  6. DeCorla-Souza, P. New Tool to Understand Value-for-Money Analysis Concepts in Evaluating Public-Private Partnership Options. Transp. Res. Rec. J. Transp. Res. Board 2014, 2450, 99–108. [Google Scholar] [CrossRef]
  7. National Renewable Energy Laboratory. Electric Vehicle Infrastructure Financial Analysis Scenario Tool (EVI-FAST): Spreadsheet Tool User’s Manual. 2020. Available online: https://www.nrel.gov/transportation/assets/pdfs/evi-fast-user-manual-draft-nov-2020.pdf (accessed on 6 January 2025).
  8. Atlas Public Policy. EV Charging Cost Calculator (v0.2). 2023. Available online: https://atlaspolicy.com/ev-charging-cost-calculator/ (accessed on 6 January 2025).
  9. Institute of Transportation Studies, University of California, Davis. A Study Evaluating the Total Costs of Installing DC Fast Chargers Along Major Transportation Corridors in California. 2023. Available online: https://www.sciencedirect.com/science/article/pii/S2213624X23000238 (accessed on 6 January 2025).
  10. Federal Highway Administration. Toolkit for Public-Private Partnerships for Electric Vehicle Charging Infrastructure: EVCI-FAST User Guide. FHWA. 2024. Available online: https://www.fhwa.dot.gov/ipd/p3/toolkit/download/Toolkit%20for%20Public-Private%20Partnerships%20for%20Electric%20Vehicle%20Charging%20Infrastructure%20-%20FAST%20User%20Guide.pdf (accessed on 6 January 2025).
  11. U.S. DOE Alternative Fuels Data Center. Charging Infrastructure Operation and Maintenance. Available online: https://afdc.energy.gov/fuels/electricity_infrastructure_maintenance_and_operation.html (accessed on 6 January 2025).
  12. Federal Reserve Bank of, St. Louis. Producer Price Index by Commodity: Repair and Maintenance Services (Partial): Commercial and Industrial Machinery and Equipment Repair and Maintenance. Available online: https://fred.stlouisfed.org/series/WPU551 (accessed on 6 January 2025).
  13. Statista. Electric Vehicles—United States. Available online: https://www.statista.com/outlook/mmo/electric-vehicles/united-states (accessed on 6 January 2025).
  14. International Energy Agency. Global EV Outlook. 2024. Available online: https://iea.blob.core.windows.net/assets/a9e3544b-0b12-4e15-b407-65f5c8ce1b5f/GlobalEVOutlook2024.pdf (accessed on 6 January 2025).
  15. Federal Reserve Economic Data. CPI for All Urban Consumers: Electricity in US City Average. Available online: https://fred.stlouisfed.org/series/CUSR0000SEHF01#0 (accessed on 6 January 2025).
  16. U.S. DOT. Charger Types and Speeds. Available online: https://www.transportation.gov/rural/ev/toolkit/ev-basics/charging-speeds#:~:text=DCFC%20equipment%20can%20charge%20a,not%20work%20with%20fast%20chargers (accessed on 6 January 2025).
  17. Transportation Energy Institute. Electric Vehicle Charging State of the Market Report. June 2024. Available online: https://www.transportationenergy.org/wp-content/uploads/2024/06/Tier-1-Report-JUNE-2024-FINAL.pdf (accessed on 6 January 2025).
  18. EV Connect. How Much Does It Cost to Charge an Electric Car at a Public Charging Station? Available online: https://www.evconnect.com/blog/ev-charging-costs-at-public-stations (accessed on 6 January 2025).
  19. Investopedia. S&P 500 Average Return and Historical Performance. Available online: https://www.investopedia.com/ask/answers/042415/what-average-annual-return-sp-500.asp?utm_source=chatgpt.com (accessed on 6 January 2025).
  20. U.S. DOE. FOTW #1319, December 4, 2023: EV Charging at Paid DC Fast Charging Stations Average 42 Minutes per Session. Available online: https://www.energy.gov/eere/vehicles/articles/fotw-1319-december-4-2023-ev-charging-paid-dc-fast-charging-stations-average (accessed on 6 January 2025).
  21. U.S. DOT. Revenue Risk Sharing for Highway Public-Private Partnership Concessions. December 2016. Available online: https://www.fhwa.dot.gov/ipd/pdfs/p3/p3-toolkit_risk_sharing_white_paper_1216.pdf (accessed on 6 January 2025).
  22. Huang, B.; Bai, X.; Zhou, Z.; Cui, Q.; Zhu, D.; Hu, R. Energy informatics: Fundamentals and standardization. ICT Express 2017, 3, 76–80. [Google Scholar] [CrossRef]
  23. Bordin, C.; Mishra, S.; Safari, A.; Eliassen, F. Educating the energy informatics specialist: Opportunities and challenges in light of research and industrial trends. SN Appl. Sci. 2021, 3, 674. [Google Scholar] [CrossRef]
Figure 1. Overview of EVCI-FAST. Adapted with permission from Ref. [10], 2024: Federal Highway Administration.
Wevj 16 00030 g001
Figure 2. Comparison of P3 structures under a pessimistic revenue scenario.
Wevj 16 00030 g002
Figure 3. Impacts of different actual revenue scenarios on government contributions and private rate of return under MRG structure.
Wevj 16 00030 g003
Figure 4. Government subsidy by year under alternative P3 structures (graphical representation of Table 2).
Wevj 16 00030 g004
Table 1. Model results for alternative P3 structures.
Pessimistic Revenue Scenario at 50% of Baseline (Best-Guess) ForecastAlternative Actual Revenue Scenarios with MRG Set at 90% of Baseline (Best-Guess) Revenue Forecast
Key MetricsGrant-Based P3AP/RR *MRG **Actual Revenue at 70% of Baseline (Best Guess)Actual Revenue at 90% of Baseline (Best Guess)Actual Revenue at 100% of Baseline (Best Guess)
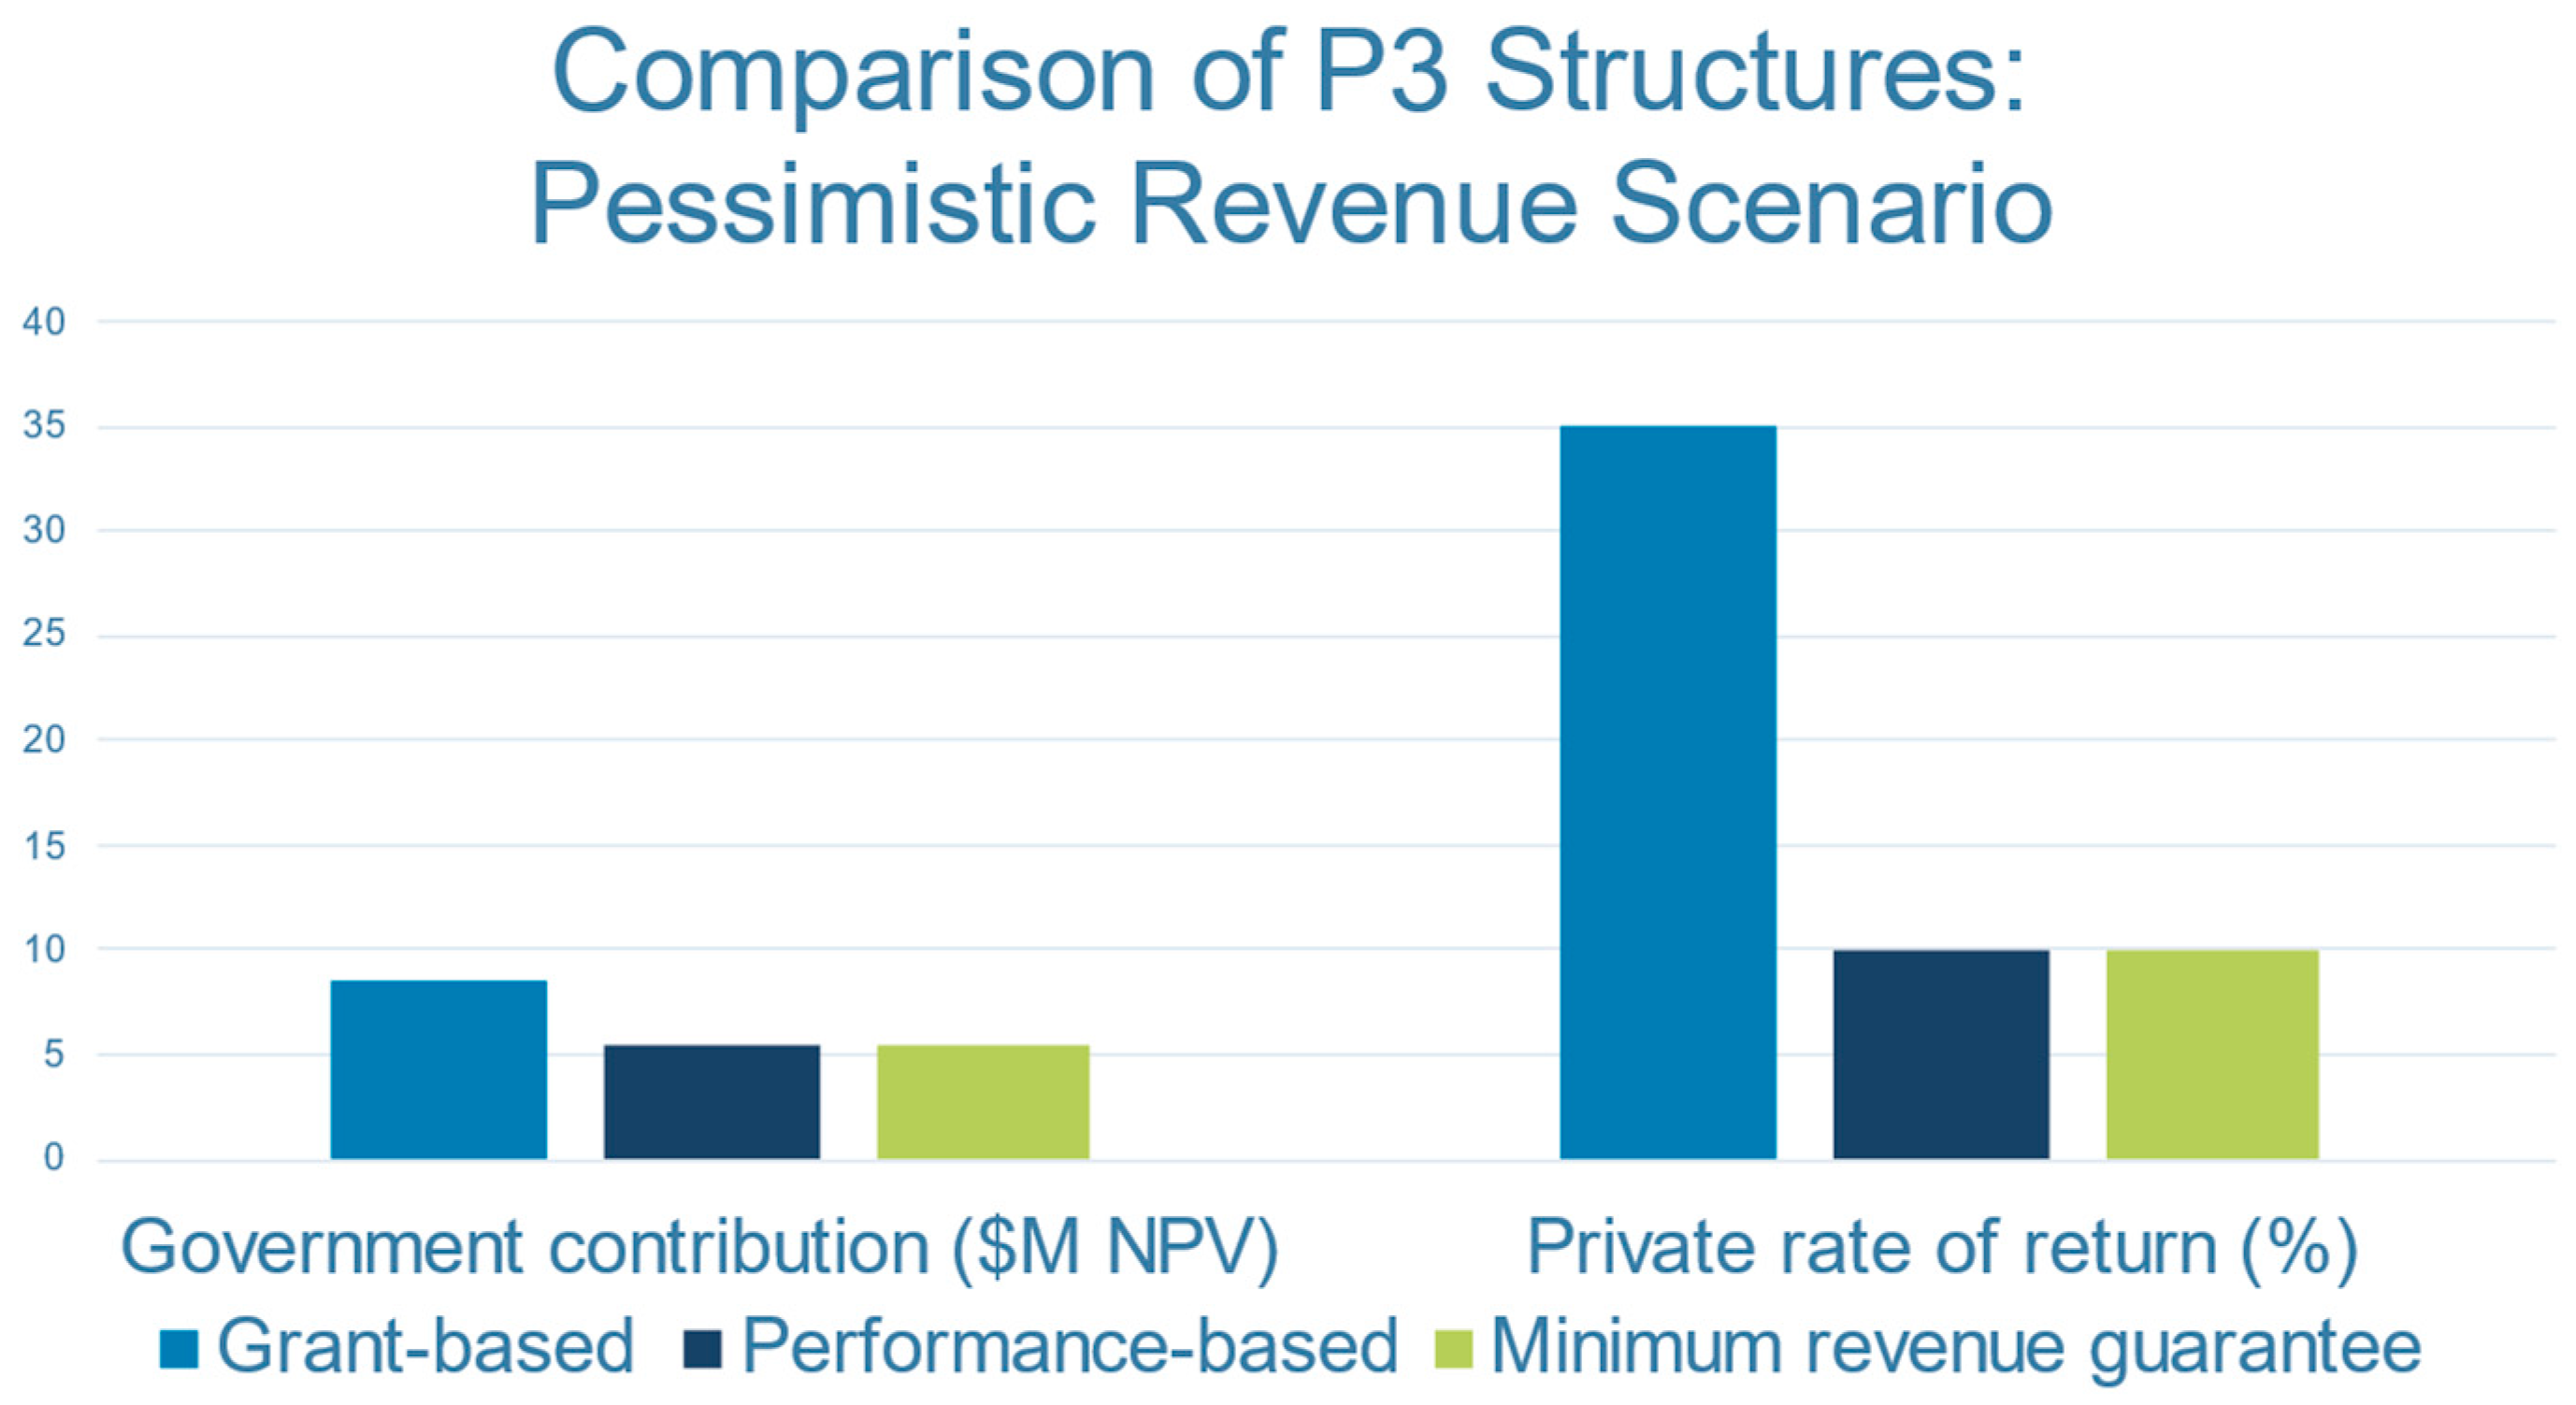
Revenues (NPV)USD 6,895,837USD 6,895,837USD 6,895,837USD 9,654,172USD 12,412,507USD 13,791,675
Costs (Eligible) (NPV)USD 12,410,777USD 12,410,777USD 12,410,777USD 12,816,975USD 13,223,172USD 13,426,271
Returns to Agency (NPV)USD 0USD 0USD 0USD 0USD 0USD 0
NPV of Cash FlowsUSD 3,076,796USD 0USD 1,730−USD 404,467−USD 810,665USD 365,404
NPV of Govt. ContributionUSD 8,591,736USD 5,514,939USD 5,516,670USD 2,758,335USD 0USD 0
Internal Rate of Return (IRR)35.41%10.00%10.00%9.05%8.06%10.84%
Subsidy above Amount Needed for Viability (NPV)USD 3,076,796USD 0USD 1730USD 0USD 0USD 0
NPV of Availability Payments/NPV of Total Eligible CostsN.A.44%N.A.N.A.N.A.N.A.
* AP/RR = performance-based P3 with a hybrid availability payment/revenue-risk structure. ** MRG = performance-based P3 with a minimum revenue guarantee structure.
Table 2. Required government subsidy by year under alternative P3 structures (year-of-expenditure USD) 1.
P3 StructureYear 0Year 1Year 2Year 3Year 4Year 5Year 6Year 7
Pessimistic Revenue Scenario (50% of Baseline Forecast)
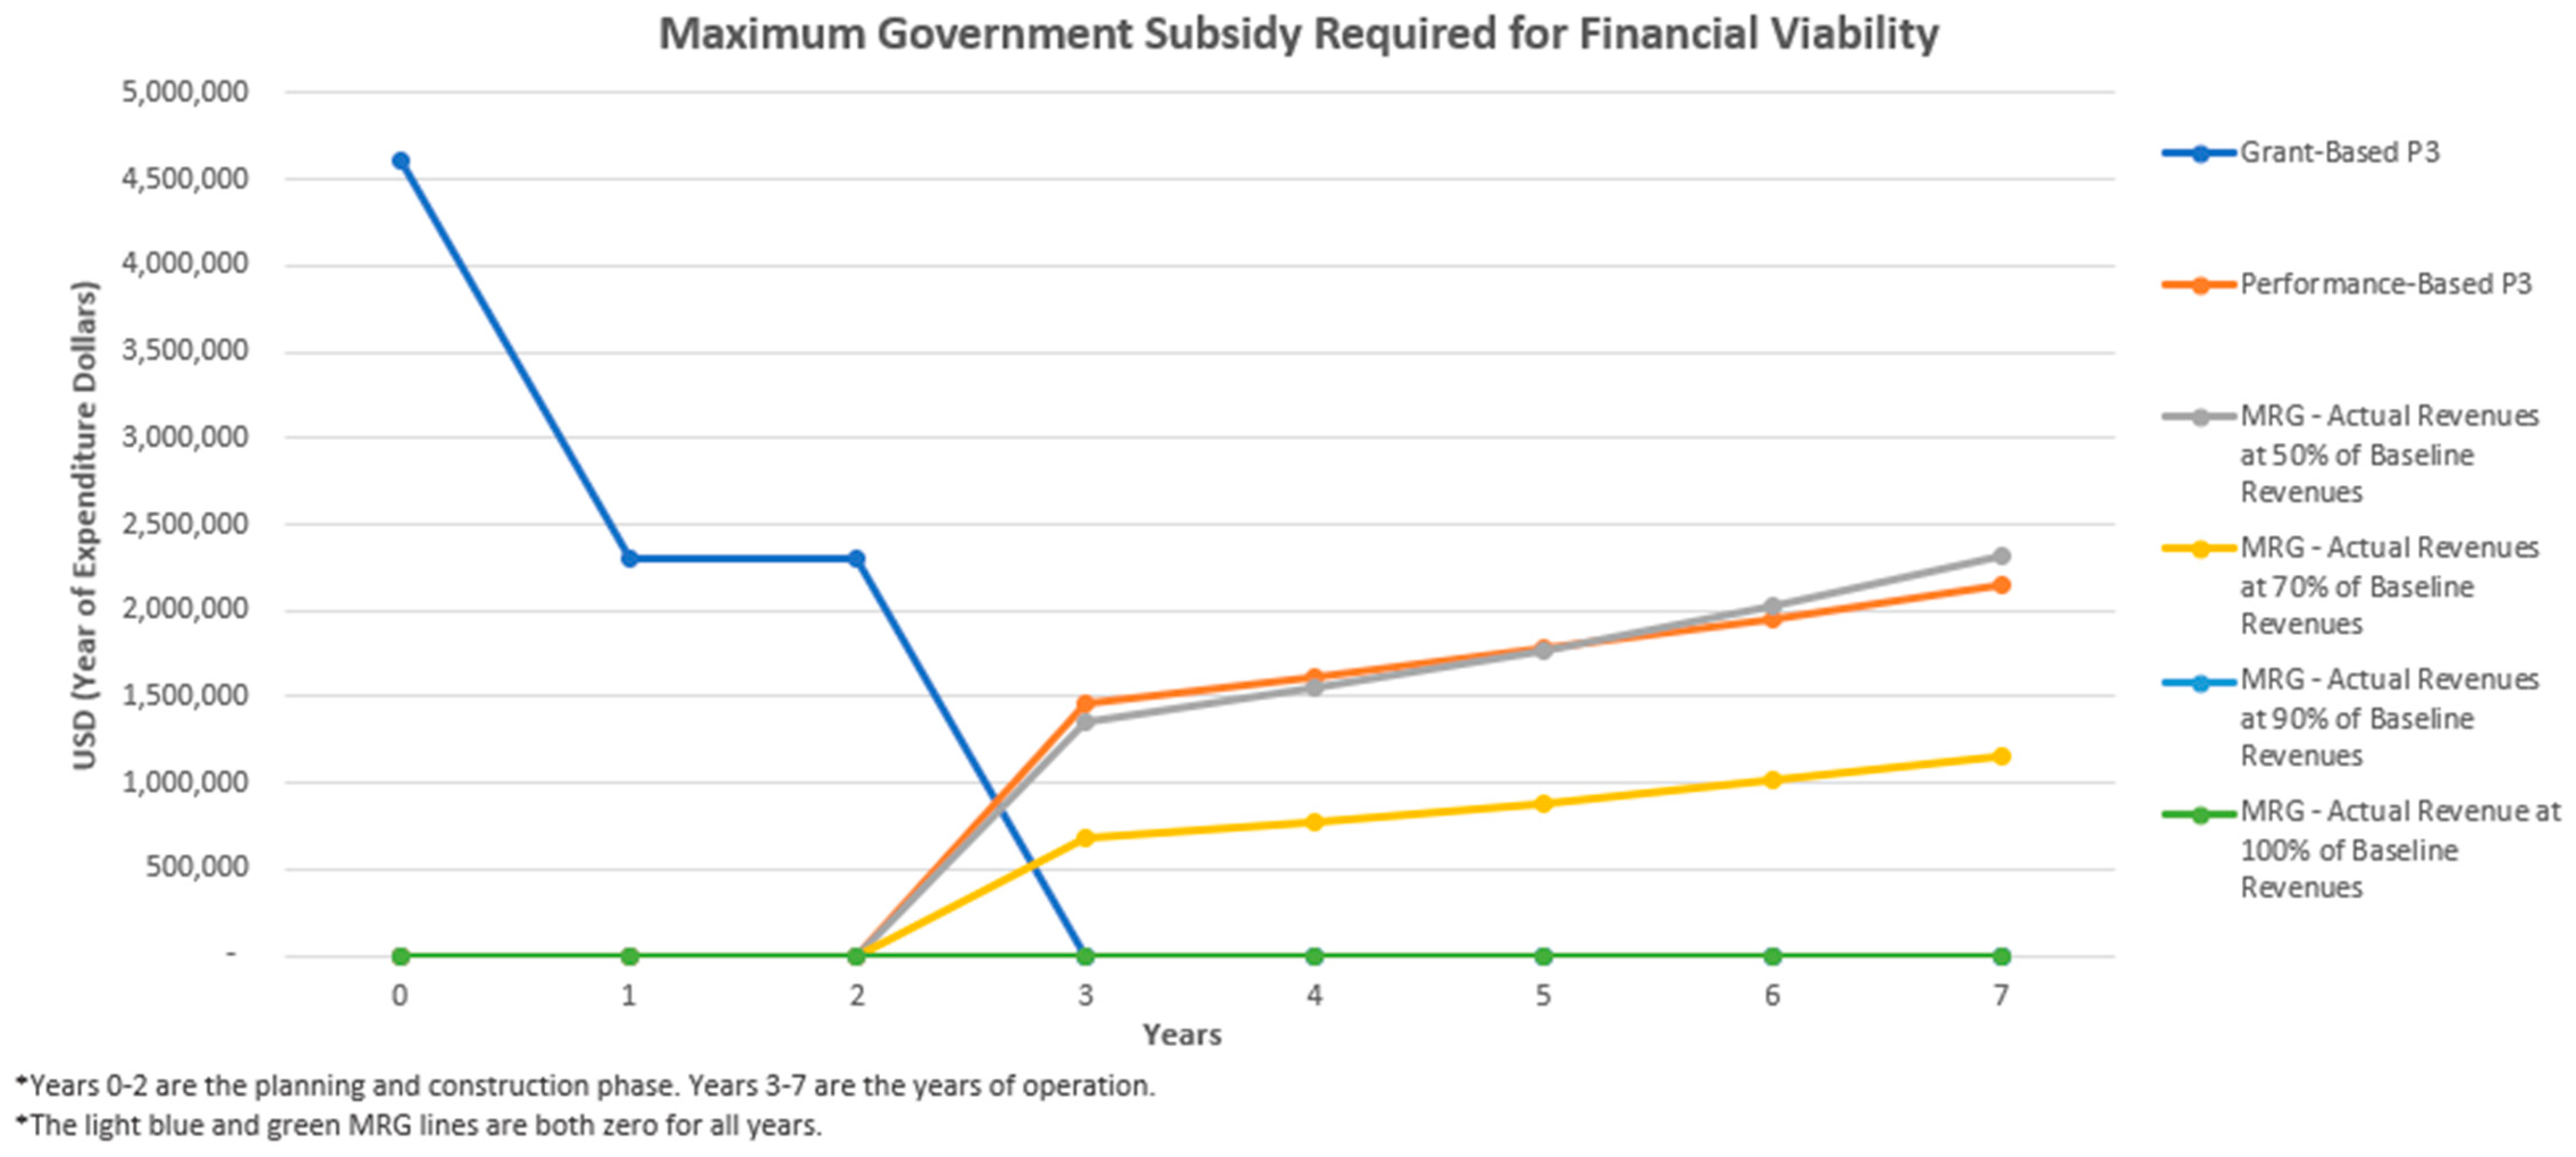
Grant-Based P3USD 4,600,000USD 2,300,000USD 2,300,000USD 0USD 0USD 0USD 0USD 0
Performance-Based P3---USD 1,468,077USD 1,614,885USD 1,776,373USD 1,954,010USD 2,149,411
Minimum Revenue Guarantee (MRG) --USD 1,358,433USD 1,552,519USD 1,774,335USD 2,027,843USD 2,317,571
MRG Structure with MRG at 90% of Baseline Revenue Forecast
Actual Revenues at 70% of Baseline---USD 679,216USD 776,260USD 887,168USD 1,013,922USD 1,158,786
Actual Revenues at 90% of Baseline---USD 0USD 0USD 0USD 0USD 0
Actual Revenues at 100% of Baseline Revenues---USD 0USD 0USD 0USD 0USD 0
1 3 years of planning and construction followed by 5 years of operations.
Disclaimer/Publisher’s Note: The statements, opinions and data contained in all publications are solely those of the individual author(s) and contributor(s) and not of MDPI and/or the editor(s). MDPI and/or the editor(s) disclaim responsibility for any injury to people or property resulting from any ideas, methods, instructions or products referred to in the content.

