Article

A Novel Neuro-Probabilistic Framework for Energy Demand Forecasting in Electric Vehicle Integration

by
Miguel Ángel Rojo-Yepes
1,
Carlos D. Zuluaga-Ríos
2,
Sergio D. Saldarriaga-Zuluaga
1,
Jesús M. López-Lezama
3,* and
Nicolas Muñoz-Galeano
3
1
Departamento de Eléctrica, Facultad de Ingenieria, Institución Universitaria Pascual Bravo, Calle 73 No. 73A-226, Medellin 050036, Colombia
2
Instituto de Investigación Tecnológica, Universidad Pontificia Comillas, Calle de Alberto Aguilera, 23, 280015 Madrid, Spain
3
Grupo de Investigación en Manejo Eficiente de la Energía (GIMEL), Departamento de Ingeniería Eléctrica, Universidad de Antioquia (UdeA), Calle 70 No. 52-21, Medellin 050010, Colombia
*
Author to whom correspondence should be addressed.
World Electr. Veh. J. 2024, 15(11), 493; https://doi.org/10.3390/wevj15110493
Submission received: 11 September 2024 / Revised: 22 October 2024 / Accepted: 26 October 2024 / Published: 29 October 2024
(This article belongs to the Special Issue Power and Energy Systems for E-mobility)

Abstract

:
This paper presents a novel grid-to-vehicle modeling framework that leverages probabilistic methods and neural networks to accurately forecast electric vehicle (EV) charging demand and overall energy consumption. The proposed methodology, tailored to the specific context of Medellin, Colombia, provides valuable insights for optimizing charging infrastructure and grid operations. Based on collected local data, mathematical models are developed and coded to accurately reflect the characteristics of EV charging. Through a rigorous analysis of criteria, indices, and mathematical relationships, the most suitable model for the city is selected. By combining probabilistic modeling with neural networks, this study offers a comprehensive approach to predicting future energy demand as EV penetration increases. The EV charging model effectively captures the charging behavior of various EV types, while the neural network accurately forecasts energy demand. The findings can inform decision-making regarding charging infrastructure planning, investment strategies, and policy development to support the sustainable integration of electric vehicles into the power grid.

1. Introduction

1.1. Motivation

The integration of electric vehicles (EVs) into the power grid is a crucial strategy for addressing global warming and enhancing the efficiency of the power system. By reducing dependence on fossil fuels, EVs can significantly lower greenhouse gas emissions. Additionally, their adoption supports cleaner and more sustainable energy consumption [1]. However, this transition comes with its own set of challenges. For the successful and sustainable implementation of EVs, it is essential to address issues such as developing adequate charging infrastructure, advancing battery technology, and integrating renewable energy sources into the grid [2].
In this context, one challenge is the increased electricity consumption resulting from the introduction of EVs into the grid [3]. Charging these vehicles adds additional demand to the electricity system, which can have significant implications, particularly during peak demand periods. Moreover, the variability in EV charging—depending on when, where, and at what speed the vehicles are charged—can cause fluctuations in the electrical load and affect grid stability [4].
The impacts of the introduction of EVs extend beyond the energy sector. Effects have been identified in industries such as transportation, manufacturing, and the economy, in general. These impacts can be related to changes in energy demand, charging infrastructure, EV supply chain, and job creation. For example, in [5], the authors present an assessment of the technical impacts of EV penetration in distribution networks. To address the issues arising from the mass adoption of EVs, it is essential to implement strategies for their intelligent management [6]. This involves the efficient coordination of charging, considering factors such as usage patterns, the availability of renewable energy, and the capacity of the electrical grid. The implementation of smart charging technologies, along with policies that encourage off-peak charging, can help mitigate the negative impacts on the electrical grid [7].
Additionally, the careful planning of charging infrastructure, the promotion of electric mobility in specific areas, and the integration of renewable energy are crucial aspects to maximize the benefits of EVs and minimize their adverse impacts. In summary, the transition to electric vehicles requires a comprehensive approach that addresses the energy challenges and the economic and social aspects associated with this transformation [1].
The aforementioned aspects require the development of more accurate EV charging models to better assess their impact on the electrical grid. Various approaches have been proposed to model EV charging [8]. These include deterministic techniques for EV charging modeling [9], Monte Carlo simulation (MCS) approaches [10], fuzzy methods [11], hybrid Fuzzy-MCS methods [12], linear programming approaches [13], and other techniques [14,15]. Accurate EV charging models can also significantly impact the demand forecasts of electrical grids.
Integrating demand forecasts with accurate EV charging models is essential for managing the challenges of EV introduction to the electrical grid. This approach enables the adjustment of EV charging strategies based on energy demand variations, optimizing infrastructure use and preventing congestion. Analyzing demand forecasts helps identify daily, weekly, and seasonal energy patterns [16]. It is essential to assess the impact of EVs on demand, understanding how their charging coincides with or differs from periods of high forecast demand and whether there are correlations between energy demand and charging patterns.
Using forecasts to model scenarios with higher EV penetration helps anticipate impacts on grid capacity and efficiency, enabling better infrastructure planning and smart charging strategies. Integrating demand forecasts with EV charging models provides a detailed view of future energy demand, facilitating effective planning and strategies for sustainable electric mobility. Furthermore, to the best of our knowledge, there are no existing studies in the technical literature that provide demand forecasts specifically for the city of Medellin, considering the factors addressed in this paper.

1.2. Literature Review

Several approaches have been suggested to model electric vehicle (EV) charging, which can be categorized into three main groups: deterministic, data-driven, and uncertainty/variability models, as outlined by [6].
In deterministic models, EV parameters like arrival and departure times, available charging period, and travel distance are predefined by the grid operator, treating EVs as stationary energy storage systems [8]. Other studies use measurement-based approaches to model EV fast-charging stations by minimizing the difference between real load measurements and simulated loads, as seen in [17]. A modified backward–forward sweep method was implemented in [9] to assess the impact of EV charging models on the grid using constant current and voltage-dependent loads. These deterministic models are also referred to as traditional methods.
Data-driven models, on the other hand, use large datasets to capture EV charging patterns more accurately than deterministic approaches, which struggle with real-time driving data [3]. These models rely on historical data to reflect driver behavior, which affects EV energy consumption. Data mining techniques like clustering, correlation analysis, and time series clustering are commonly applied to analyze driving data [8,18]. For example, time series clustering was used to analyze hybrid EV driving cycles in [18], while [3] applied a two-level clustering model to identify driving patterns that influence the daily load curve. These data-driven methods offer flexibility and scalability but can perform poorly with low-dimensional real-time data.
Several data-driven approaches have been suggested to characterize EV charging behaviors and analyze driving data. Techniques like clustering [8], correlation analysis [19], stochastic prediction [20], and time series clustering [18] are commonly used. For instance, ref. [18] developed a time series clustering method with variable weights to study hybrid EV driving cycles. The authors in [8] utilized historical residential charging data to create probability density functions for modeling charging durations and applied k-nearest neighbors clustering for decision-making. The authors in [3] proposed a two-level clustering model to identify EV driving patterns, revealing five daily and four multifaceted driving patterns impacting the daily load curve, though they did not consider weather conditions. The authors in [21] introduced a probabilistic model using K-means clustering for EV load control, identifying three distinct vehicle usage modes in the UK, with the number of clusters being a model parameter.
Data-driven methods hold significant promise for predicting non-linear systems, allowing for the calculation of EV load based on varying household numbers and charging rates [8]. However, these methods often struggle with real-time driving data in low dimensions. While many studies highlight the distinctions between data-driven techniques and machine learning methods, both can be encompassed within data-driven approaches. Several methods incorporate machine learning theories or concepts to model EV charging, behaviors, or driving patterns [14,22,23]. Specifically, ref. [22] modeled the EV consumption profile using gross power measurements, identifying five types of EV plugs and batteries to determine power drawn from the grid and battery capacity via the random forest algorithm. The authors in [23] used a Gaussian Mixture Model (GMM) to model the probability of EV charging, effectively capturing charging profiles by considering factors like battery capacity, consumption, charging infrastructure, day of the week, and settlement structure. The authors in [15] proposed a data-driven regression model to predict EV charging demand from a large historical dataset of charging processes. The authors in [24] presented a forecasting model for estimating EV charging demand using big data technologies, employing clustering analysis to classify traffic patterns, relational analysis to identify influencing factors, and a decision tree to establish criteria for determining EV charging speed and power.
In uncertainty and variability approaches, probabilistic, possibilistic, and stochastic methods are utilized to model EV charging demand, addressing both uncertainty and variability. Probabilistic methods often use individual probability distributions to model EV charging demand, employing Gaussian distributions [25], Weibull [10], lognormal [26], exponential [26], mixed probability distributions (e.g., mixtures of Gaussian distributions) [27], or non-parametric methods [28,29]. The most common technique is Monte Carlo simulation (MCS), which generates a large number of samples using probability density functions of various input variables [10,30]. These variables can include arrival/departure times, daily distance traveled, initial State of Charge (SoC) of the EV battery, type of EV, battery capacity, and EV recharge probability [30].
Numerous applications of MCS are found in the literature. For instance, ref. [7] analyzed the impact of EV charging demand on the temperature of hot spots in distribution transformers and the loss of useful life using a thermal model for both uncontrolled and controlled charging scenarios. Similarly, ref. [31] evaluated the effects of EVs on distribution networks, using MCS and Weibull probability distribution to model EV charging demand and assuming correlated loads in the network. Under different conditions, ref. [32] employed MCS to develop an EV charging pattern model considering vehicle class, battery capacity, SoC, driving habits/needs, connection time, mileage, daily recharge frequency, charging rate, and dynamic charging price. The authors in [33] proposed a probabilistic approach to model EV charging demand, considering factors like arrival time, departure time, driving distance, non-linear characteristics of battery charging, and different vehicle types, using historical data from the National Household Travel Survey to obtain the probability distributions.
For possibilistic approaches, ref. [34] proposed an EV charging profile that incorporates factors such as arrival time, departure time, daily distance traveled, and vehicle parameters to develop a stochastic driving pattern model using fuzzy logic theory. The authors in [35] introduced a fuzzy inference mechanism to determine suitable charging, discharging, or retention decisions for EVs, taking into account the available power from the smart grid, arrival time, departure time, State of Charge (SoC), and the required staying time of the EV. They also proposed a hybrid Fuzzy-MCS method where parameters are modeled using either probabilistic or possibilistic approaches.
In [36], the problem addressed is the need to evaluate the electrical power system, considering the growing load that needs to be managed in the future. However, the availability of historical data, limited to the last five years, imposes restrictions on a thorough analysis. To address this issue, a methodology is developed to assess the impact of these loads on electrical networks. Electrical properties, user charging behaviors, geographic locations, travel distances, and other relevant variables are modeled using empirical or known probability distributions and evaluated in different scenarios using MCS and load flow analysis. Although MCS introduces uncertainty, it provides flexibility to consider various scenarios and estimate the variability of the results. Among the advantages of the study is the representation of operational scenarios for a single hour over a week, based on a projected charging demand for the year 2030. However, a drawback is the limited use of EV data, including a mix of plug-in hybrids, non-plug-in hybrids, and pure EVs during the study period from 2016 to 2020, which could lead to significant errors. In conclusion, the utility of the Inverse Cumulative Distribution Function (ICDF) for generating random values in Monte Carlo simulations is highlighted, offering an effective alternative when limited data are available for modeling stochastic variables in EV simulations.
In [37], the challenges of optimizing electrical distribution networks with high penetration of EVs and distributed generation (DG) are addressed. It proposes a hierarchical and distributed optimization method that considers the spatial and temporal characteristics of EV charging, using a detailed predictive model that combines trip probabilities, vehicular mobility, and traffic networks. The advantages of the study are improved computational efficiency and more flexible control through distributed optimization, as well as better integration of distributed energy and energy storage. However, it faces disadvantages such as implementation complexity, reliance on accurate data, and difficulties in modeling the interaction between traffic networks and electrical distribution.
In [38], the impact of demand management strategies, such as time-of-use (ToU) rates and smart charging, on the charging behavior of EV drivers in Australia is explored. Using a multinomial choice model and an ordered bivariate model, the authors analyzed data from a survey of 994 drivers, including 97 EV owners. The findings indicate that consumers with more flexible schedules are more likely to adjust their charging times in response to ToU rates, while those with greater time constraints prefer user-managed smart charging. Testing with current EV owners may overestimate the acceptance of these strategies among potential new adopters. ToU rates are effective in shifting charging to nighttime hours but not to midday, suggesting the need for synergy between transportation and energy demand strategies.

1.3. Contributions

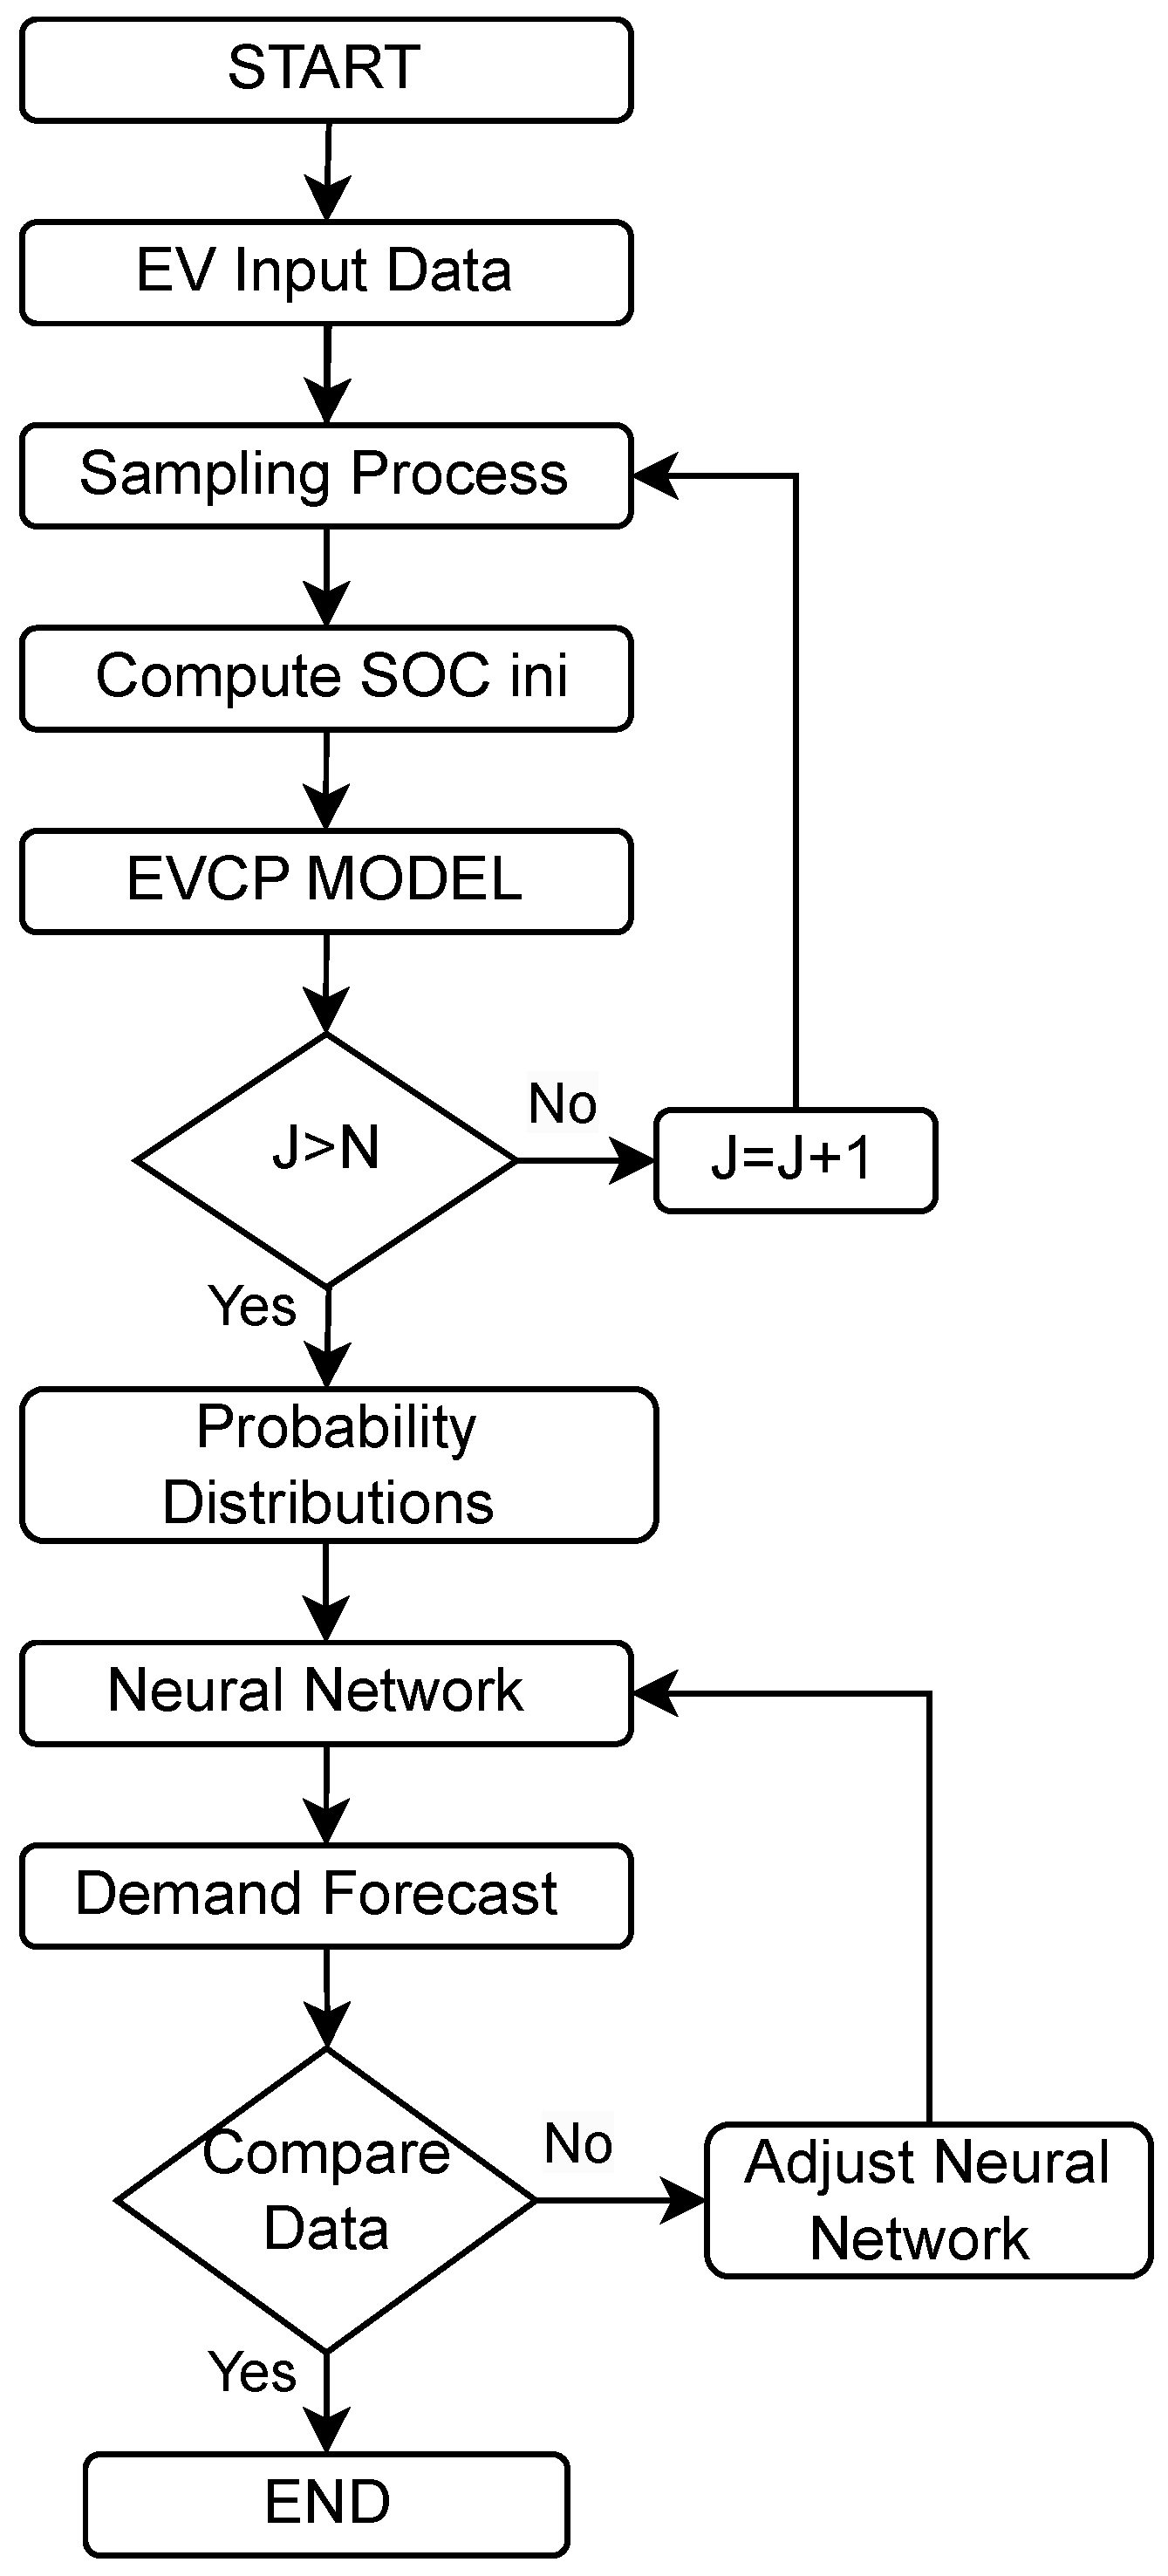
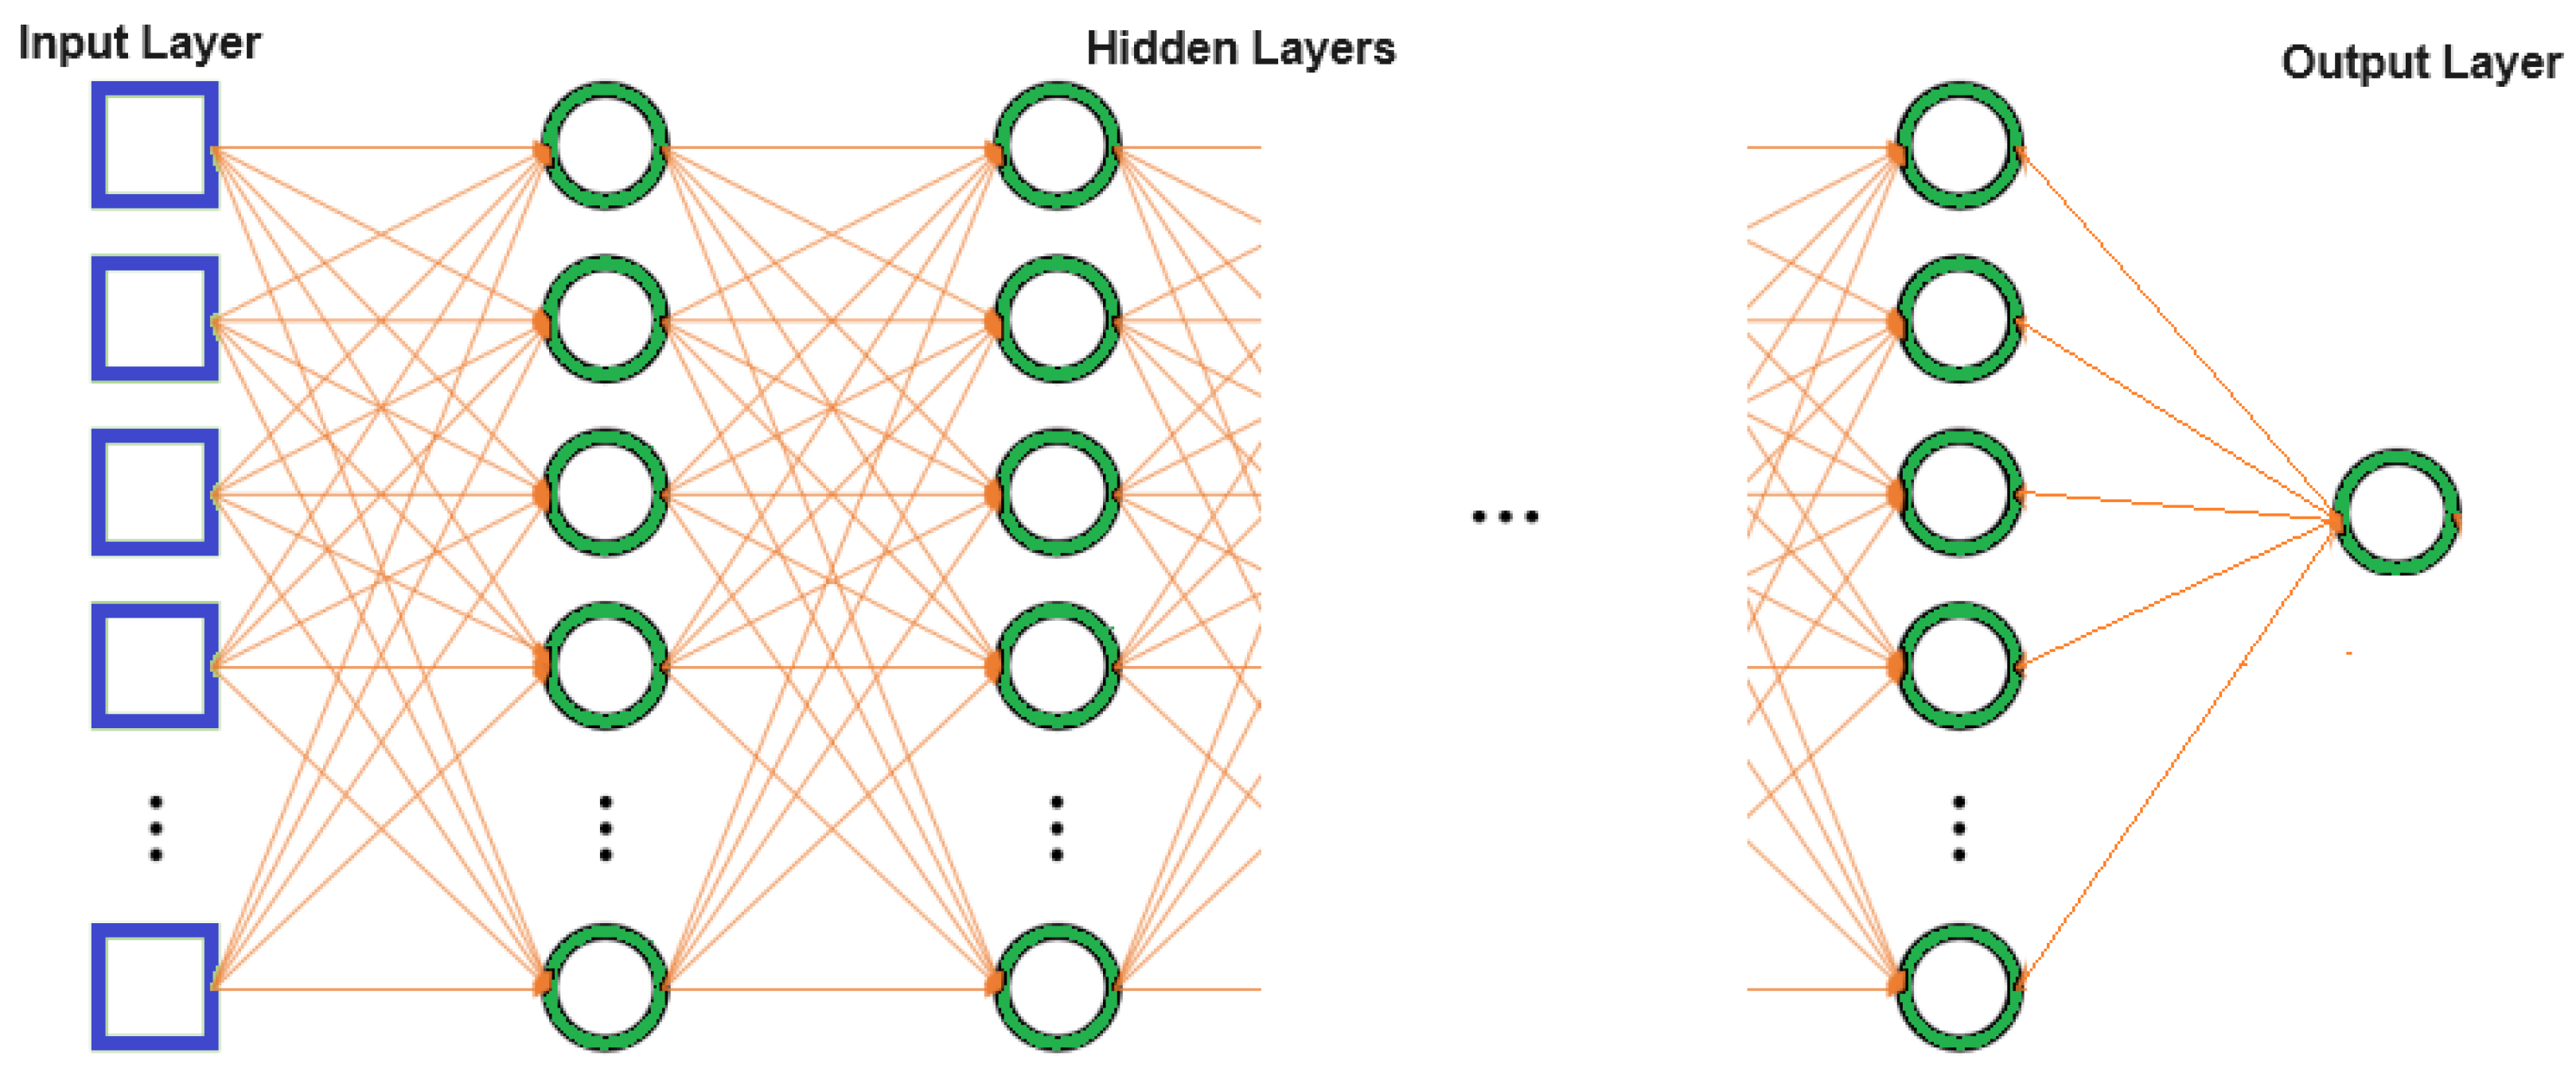
This paper explores a grid-to-vehicle modeling approach based on probabilistic methods for EVs enhanced by neural networks. The proposed methodology addresses every aspect of the process, from data collection and processing to model implementation and validation, providing a comprehensive and robust solution. Using the collected local data, mathematical models are developed and coded to accurately reflect the characteristics of EV charging in Medellin, the second-largest city in Colombia. Through a rigorous analysis of criteria, indices, and mathematical relationships, the most suitable model for the city is selected. Note that the scope of this research does not include the optimal location of charging stations or the evaluation of the impact of EV charging on infrastructure.
The validation of the charging model through simulations in a controlled environment before practical application offers several advantages. Different scenarios of EV penetration can be simulated and their impact on the charging infrastructure evaluated, enabling forecasting and planning for various future situations. This was achieved with the help of a neural network, which provided demand forecasts. The simulation facilitates the identification of critical points and opportunities for improvement in the charging system, optimizing the placement and capacity of charging stations. To summarize, the main features and contributions of this study are as follows:
  • A grid-to-vehicle modeling approach that utilizes probabilistic methods for EVs enhanced by neural networks is proposed and tested.
  • The proposed approach is applied to Medellin, the second-largest city in Colombia, incorporating local data and models that accurately reflect the city’s reality. the specific environment of Medellin is considered, including its road infrastructure and mobility patterns, which allows the model to be adjusted to the city’s actual needs and facilitates.
  • The model is flexible and can adapted to other cities, as well as changes in EV penetration and public policies, facilitating long-term sustainable planning.
Finally, this project constitutes a valuable tool for planning and managing EV charging infrastructure, ensuring its relevance and utility for local authorities and urban planners through its detailed and locally adapted approach. It offers a solid foundation for making informed decisions about the location and capacity of charging stations, optimizing investment, and improving system efficiency.

2. EVs in the City of Medellin

Table 1 shows the data on EVs in Medellin, classified by technology type and broken down by year from 2019 to 2022. The technology types included are HEV (Hybrid Electric Vehicles), BEV (Battery Electric Vehicles), and PHEV (Plug-in Hybrid Electric Vehicles). The primary focus of this analysis is on BEVs and PHEVs. For BEVs, the numbers show a gradual increase from 2019 to 2022. PHEVs, although with variations, also show an increase over these years. In contrast, HEVs have seen much more pronounced growth but will not be the focus of this study. Overall, these data reflect a growing adoption of electric vehicle technologies in Medellin, with particular attention to how BEVs and PHEVs are contributing to this trend [39]. It is important to highlight that HEVs and small-battery PHEVs offer similar greenhouse gas reductions at lower costs compared with large-battery PHEVs or BEVs [40], making them valuable for long-term power system planning across multiple areas, including reducing greenhouse gas emissions, optimizing electric transportation systems, supporting manufacturing efficiency, and benefiting the broader economy [3], even though they do not rely directly on grid electricity; for this reason, they are mentioned in Table 1.
Table 2 provides a more detailed and segmented view of the types of EVs in Medellin [39]. A significant growth can be observed in the Automobile and Utility segments, especially in 2022, where the number of utility vehicles reached 3780. Other segments, such as Passenger Commercial and Cargo Commercial, also show an increase, though less pronounced. This breakdown helps to better understand the distribution and types of vehicles being adopted in the city.

3. Methodology

The methodology employed in this work, as depicted in Figure 1, begins with the EV input data block. Here, variables such as battery capacity, electric vehicle types, charging power, and full-range mileage are sampled from their respective probability distributions to create a specific charging scenario for the electric vehicles [6]. Following this, a Monte Carlo simulation (MCS) is utilized to propagate the defined random variables, enabling the calculation of probability distributions related to the charging demand of electric vehicles connected to the power network.
Next, the initial State of Charge (SOC) of the electric vehicle batteries is determined using the sampled data. This calculation is pivotal, as the initial SOC significantly influences the charging and discharging patterns of the batteries. Subsequently, these sampled inputs are fed into the MCS-based EV Charging Power (EVCP) model in the sampling block, where the total power required by the electric vehicles is calculated. This procedure is repeated 1000 times to generate statistical results and a comprehensive set of samples for the total EV power demand. These simulations offer insights into how energy demands fluctuate under various usage conditions and vehicle characteristics, using the historical data of electric vehicles from the city of Medellin, which were obtained from [39].
As the iterations progress, probability distributions for the input data are established, yielding annual results that reflect the maximum, minimum, average, and standard deviation of demands. The data derived from these annual simulations, along with actual demand recorded by XM, the organization responsible for managing Colombia’s electrical system [41], are subsequently fed into an artificial neural network. This neural network processes the data to generate an initial demand forecast. To enhance accuracy, the forecast undergoes refinement through multiple simulations covering the period from 2008 to 2021. During this phase, adjustments are made to the neural network’s architecture, particularly the number of layers, in order to minimize the mean squared error.
Once the optimal configuration of the neural network is determined, it is employed to predict energy demand for future years, extending the projections up to 2030. To ensure the model’s accuracy, the predicted demand for 2022 is compared with actual data provided by XM [41]. If the forecast demand aligns closely with the actual data, the model is deemed successful. However, in cases where discrepancies emerge, the neural network is fine-tuned, and the simulation process is repeated. This iterative cycle is essential for confirming the model’s reliability and ensuring that future demand predictions are as precise as possible.
With a well-calibrated and validated neural network in place, a comprehensive forecast extending to the year 2030 is generated. This forecast, grounded in both historical data and accurate simulations, provides a clear and well-informed projection of how energy demand is likely to evolve in the coming years.

3.1. Electric Vehicle Charging Probabilistic (EVCP) Modeling

Electric Vehicle Charging Probabilistic (EVCP) modeling refers to the use of probabilistic and statistical methods to model and predict the charging patterns of EVs, considering the variability and uncertainty of user behavior. This approach allows for better planning of charging infrastructure, optimizes energy demand management, and helps formulate effective policies for the sustainable development of electric mobility. Techniques such as Monte Carlo models, stochastic processes, and machine learning are used to estimate and predict future charging needs. Therefore, three electric vehicle charging models are presented.

3.1.1. EVCP Model 1

EVCP Model 1 is based on [30] and was shown in [6]. In this case, the authors assumed that the daily travel distance (d) and the connection time ( t p ) of an EV are Gaussian and lognormal, respectively. Also, the State of Charge S O C i j after a daily travel distance (D) can be calculated from Equation (1) using the battery energy efficiency ( η ) in driving cycles.
S O C i j = 1 d D η
For every EV (without regard to HEV), the charging duration ( t d ) is calculated to determine its total power ( P E V ) using Equations (2) and (3). In Equation (3), P C represents the nominal charging power at time t. Here, j denotes the Monte Carlo simulation iteration, and i indicates the type of EV within the predefined fleet, where (i = {1, 2, 3, 4, 5}). These types correspond to private electric vehicles, public utility electric vehicles, commercial electric vehicles (taxis), electric freight trucks, and electric buses, respectively.
P E V = i = 1 5 j = 1 N P E V i j
P E V i j = P c t p t t d 0 other time

3.1.2. EVCP Model 2

Model 2, as described in [6], relies on the departure time from home ( t l ), the time the EV user is away from home ( t a ), and the charging efficiency ( η ) of the EVs as random variables to estimate the energy consumption of the EV. In this model, t l and t a are represented by Gaussian distributions, while η is modeled using a uniform distribution. Additionally, five types of EVs are considered, similar to EVCP Model 1. This model approximates the minimum charging duration time ( t m c d ) as a function of the initial State of Charge (SOC):
The minimum charging duration time is approximated as a function of the initial SOC, as shown in Equation (4), where C a p is the battery capacity. The connection time ( t c ) and full charge time ( t f c ) are calculated as indicated in Equations (5) and (6). In all cases, the upper index j indicates the Monte Carlo simulation iteration.
t m c d j = ( η S O C i j ) C a p P c
t c j = t l j + t a j
t f c j = t c j + t m c d j
By applying Equations (4)–(6), the total EV power is determined using Equations (2) and (7).
P E V i j = P c t p t t f c j 0 other time

3.1.3. EVCP Model 3

The third model is a modified version of the one introduced in [33], which was utilized in [6] and adapted to incorporate EVCP model 1. In this model, the arrival time at home ( t a ), departure time ( t d ), and distance traveled (d) are treated as Gaussian random variables, while battery efficiency follows a uniform distribution. The initial SOC is computed using Equation (1). The rated load power of P c is represented as a non-linear function of the SOC, which is updated recursively according to Equation (8).
S O C t = S O C t 1 + 100 P c η C a p
In this case, η represents the efficiency of EV when driving. Taking into account the previously mentioned random variables and Equation (8), the total EV power is determined using Equations (2) and (9). The full charge time ( t f c ) is calculated as outlined in Equations (4)–(6).
P E V i j = P c t p t t f c j and S O C t 100 0 other time
In [6], a comprehensive review of the current state of electric vehicle modeling under the Grid to Vehicle (G2V) approach was conducted. The review identified three main categories: deterministic approaches, methods that address uncertainty and variability, and data-driven techniques. Moreover, an experimental comparison was performed using three probabilistic models based on Monte Carlo simulation. Based on the comparison made in [6], we found that the EVCP 3 model and the gamma distribution show strong potential for accurately modeling the penetration of electric vehicles in probabilistic load flow analyses. It also proves to be a suitable approach for stochastic planning studies in active distribution networks, offering a reliable framework for capturing the variability and uncertainty associated with electric vehicle integration.

3.2. Neural Network

An artificial neural network (ANN) is a computational model whose layered structure resembles the interconnected arrangement of neurons in the brain. ANNs can learn from data, enabling them to be trained to recognize patterns, classify data, and forecast future events [42]. The fundamental unit of an ANN is the neuron, which connects with others through input layers, intermediate or hidden layers, and output layers. The connections between layers are determined by specific weights, which reflect the relative importance of one neuron’s input on another neuron’s output.
In this work, a multilayer artificial neural network (ANN) is trained using error backpropagation, with a single neuron in the output layer. To estimate multiple periods, the forecast for the first period is obtained, and then the process iterates by using the forecast data from each period as input for the next, continuing until all desired periods are forecast. This type of ANN and iterative procedure have been widely used for time series forecasting in various fields, including battery State of Charge estimation [43] energy demand forecasting [44,45,46], renewable generation [47], etc. The input data for the ANN consist of the number of vehicles and statistics representing the probability distributions of electric vehicle demand, obtained using the EVCP 3 model and historical demand data from the Department of Antioquia from 2008 to 2021. The trained neural network is then tested and fine-tuned using data from 2022, with the number of hidden layers defined as part of the model optimization. Figure 2 shows a schematic of the neural network.
Once the neural network is trained or loaded, it is used to make demand predictions based on new statistical data. This new input dataset represents the statistics for the year to be forecast. The ANN processes these data and generates a prediction of the expected demand. The output data represent monthly power demands over several years.

4. Tests and Results

The process begins with a comprehensive search for energy demand data for the city under study (Medellin), sourced from the XM website [41]. The data were carefully collected to ensure both accuracy and relevance. After collection, the data were organized on a monthly basis, encompassing each day of every month from 2018 to 2022. This organization enabled the analysis of both daily and monthly variations in energy consumption.
Once the data were organized monthly, averages for each month were calculated to smooth out daily fluctuations and provide a clearer, more structured view of monthly energy consumption. This approach allows for easy comparison and analysis of consumption trends across different months and years. The monthly arrangement helps identify seasonal patterns, demand peaks, and other significant trends in energy consumption. Additionally, further calculations were conducted to determine the maximum, minimum, and average values, as well as the standard deviation of energy demand.
With the electric vehicle data, a forecast was made, incorporating both historical data and future projections. Different projection models were presented to refine the data used for training Model 3. This projection involved an exponential adjustment to model the growth in EV adoption based on data from previous years.

4.1. Input Data

To forecast future energy demand, the process begins with collecting detailed data on EVs. Key information such as battery capacity, range, vehicle type, charging speed (fast or slow), number of charges per day, charging periods throughout the day, and total time the vehicles are connected is recorded. These data provide a solid foundation for understanding how EVs perform under various conditions and are essential for subsequent calculations.
Figure 3 shows the behavior of the data based on the information in Table 3. It is worth mentioning that there are no official records of the actual number of EVs in Medellin for the years 2008 to 2018; nonetheless, this number can be forecast based on Equation (10). Since there is official information from 2019 to 2022, the number of actual and forecast EVs was compared to obtain the absolute error that ranged between 7.4% to 0.81% for 2020 and 2022, respectively. From Figure 3, it can be seen that the adoption of EVs in the city of Medellin presents an exponential behavior.
y = 899.31 · e ( 0.4662 · x )
In this case, y represents the projected number of vehicles, and x is the year, while 899.31 and 0.4662 are parameters fitted by the regression methods. The value 0.9944 indicates a fit coefficient out of R 2 that improves the accuracy of the model. From Equation (10), the number of EVs in Medellin was forecast from 2023 to 2030 (there are no official records for the year 2023). The results are shown in Table 4.
The number of charges per day, the charging period, the probability of charging, and the distributions of both the State of Charge (SOC) and the connected time are defined. Additionally, several types of EVs are defined, each with their specific battery capacities and corresponding charging rates. These EV types range from private vehicles to utility vehicles, commercial vehicles, goods trucks, and buses. Detailed information on battery capacity and charging rates (slow and fast) is compiled to provide a complete set of data on the various EVs, reflecting their diverse characteristics and energy needs. This information is used to feed Model 3 (EVCP 3), which simulates the energy demand of EVs in a probabilistic environment. The model considers the characteristics and charging habits of each type of vehicle, allowing an accurate assessment of the charging behavior and its impact on the power grid. Table 5 and Table 6 show the characteristics of the input information, which is used in the EVCP 3 model; this information is obtained from [30].
The demand statistics are obtained with the data shown in the Table 5 and Table 6.

4.2. Results of EVCP 3

With the EVCP 3 model, probability distributions of EVs were obtained from 2008 to 2030. The probability distributions from 2008 to 2022 are calculated based on Table 3. The distributions from 2023 to 2030 were calculated using the data presented in Table 4. The results of the probability distributions calculated with the EVCP 3 model for the years 2023 and 2030 are shown in Table 7 and in Figure 4 and Figure 5.
The probability distributions obtained with the EVCP model are used to generate demand forecasts with the neural network. This model simulated several possible scenarios to produce a series of values from which key statistics were extracted: the maximum value (MAX), minimum value (MIN), average (AVG), and standard deviation (STD). These statistics summarize the expected behavior of EV charging based on various variables and market conditions. The results of these calculations were used to train the neural network, which was designed to predict energy demand up to the year 2030.

4.3. Demand Forecast Results

The neural network was used to forecast energy demand in Medellin for the years 2023 to 2030, considering the integration of EVs. The input data for the neural network consisted of the probability distributions of EV charging obtained using the EVCP 3 model. The network was trained using demand data from 2008 to 2021.
To optimize the energy demand prediction up to 2030 using neural networks, an exhaustive exploration of various configurations of hidden layers and neurons was conducted. Table 8 shows the Root Mean Square Error (RMSE), where the best simulation was performed with 25 layers. Each configuration was evaluated using historical data up to 2021, and the prediction accuracy for 2022 was compared with actual values by calculating the RMSE, as shown in Table 9. The goal was to identify the configuration that minimized the RMSE, thereby indicating the best architecture for the neural network. Figure 6 shows the behavior and similarity of the data.
Considering the forecast for the year 2022, a simulation was conducted using a neural network configured with 25 layers. This neural network model was initially trained with data up to 2022 and was then used to add input data year by year. By incorporating additional data for each subsequent year, the model’s accuracy is enhanced, continuously adjusting it to the updated reality and ensuring that the predictions more faithfully reflect emerging trends and patterns in energy consumption.
Once the optimal configuration (25 layers) is selected, the energy demand is projected year by year up to 2030, as shown in Table 10. This process involves periodically retraining the neural network, adjusting it as new real data become available. This ensures that the predictions remain accurate and adapt to seasonal variations and long-term trends in energy consumption in Medellin. Continuously updating the model allows it to more accurately reflect emerging changes and patterns in energy usage, thereby increasing the reliability of the projections.
The continuous optimization of the model ensures more effective energy planning and more efficient resource management in the city. This facilitates informed and strategic decision-making, promoting long-term sustainable energy development. By anticipating future needs and adjusting strategies accordingly, Medellin can enhance its ability to respond to changes in energy demand, ensuring a consistent and sustainable supply for its residents. This approach allows more accurate forecasting of energy demand for subsequent years, from 2023 to 2030. By periodically updating the neural network with new input data, it ensures that the model can adapt to unforeseen changes and seasonal variations. This technique not only provides more reliable long-term projections but also facilitates the efficient planning and management of energy resources, allowing decision-makers in Medellin to implement effective strategies for sustainable energy development.
Table 10 illustrates the energy demand in MWh each month from 2023 to 2030. There is a clear upward trend in energy production over the years, with each year showing an increase in the amount of energy produced. This suggests a sustained growth in energy demand, which can be partly attributed to the rising adoption of EVs. It is important to highlight that the results presented in Table 10 show the general demand forecast for the city of Medellin. In this case, not only is the demand for EVs considered, but also the electricity demand from other sectors of the city. It is also important to note that the historical demand pattern shows a similar trend to the results found in this article. This is expected, as the neural network, in addition to using information from EVs, also incorporated the city’s historical demand forecasts. Therefore, the trend in the results demonstrates appropriate behavior, although the forecasted values may be influenced by various social, industrial, and other factors.

5. Conclusions

This research presented a comprehensive approach to grid-to-vehicle modeling, incorporating probabilistic methods for electric vehicles and neural networks for electric demand forecasting. The methodology, applied to the city of Medellin, Colombia, offers a valuable tool for planning and managing EV charging infrastructure.
By combining probabilistic modeling and neural networks, the proposed approach provides a robust and accurate framework for predicting future energy demand in the presence of increasing EV penetration. From the results, it is highlighted that the EV charging model, EVCP 3, accurately captures the charging behavior of various EV types, considering their specific characteristics and usage patterns. The neural network, trained on historical data and EV charging probability distributions, effectively forecasts energy demand up to 2030.
The results of this study highlight the importance of integrating EV charging models with demand forecasting to anticipate future energy needs and optimize grid management. The findings can inform decision-making regarding charging infrastructure planning, investment strategies, and policy development.

Author Contributions

Conceptualization, M.Á.R.-Y., C.D.Z.-R., and S.D.S.-Z.; data curation, M.Á.R.-Y., C.D.Z.-R., and S.D.S.-Z.; formal analysis, M.Á.R.-Y., C.D.Z.-R., S.D.S.-Z., J.M.L.-L., and N.M.-G.; funding acquisition, S.D.S.-Z., J.M.L.-L., and N.M.-G.; investigation, M.Á.R.-Y., C.D.Z.-R., S.D.S.-Z., J.M.L.-L., and N.M.-G.; methodology, M.Á.R.-Y., C.D.Z.-R., and S.D.S.-Z.; project administration, M.Á.R.-Y., C.D.Z.-R., S.D.S.-Z., J.M.L.-L., and N.M.-G.; resources, M.Á.R.-Y., C.D.Z.-R., S.D.S.-Z., J.M.L.-L., and N.M.-G.; software, M.Á.R.-Y., C.D.Z.-R., and S.D.S.-Z.; supervision, C.D.Z.-R., S.D.S.-Z., J.M.L.-L., and N.M.-G.; validation, M.Á.R.-Y., C.D.Z.-R., and S.D.S.-Z.; visualization, M.Á.R.-Y., C.D.Z.-R., S.D.S.-Z., J.M.L.-L., and N.M.-G.; writing—original draft, M.Á.R.-Y., C.D.Z.-R., and S.D.S.-Z.; writing—review and editing, M.Á.R.-Y., C.D.Z.-R., S.D.S.-Z., J.M.L.-L., and N.M.-G. All authors have read and agreed to the published version of the manuscript.

Funding

This work was supported by the program called “Pascualino Creativo e Innovador”, funded by the Pascual Bravo University Institution. The authors gratefully acknowledge the financial support provided by the Colombian Ministry of Science, Technology, and Innovation “MinCiencias” through “Patrimonio Autónomo Fondo Nacional de Financiamiento para la Ciencia, la Tecnología y la Innovación, Francisco José de Caldas” (Perseo Alliance, Contract No. 112721-392-2023).

Data Availability Statement

The original contributions presented in the study are included in the article, further inquiries can be directed to the corresponding author.

Conflicts of Interest

The authors declare no conflicts of interest.

References

  1. Alahyari, A.; Ehsan, M.; Mousavizadeh, M. A hybrid storage-wind virtual power plant (VPP) participation in the electricity markets: A self-scheduling optimization considering price, renewable generation, and electric vehicles uncertainties. J. Energy Storage 2019, 25, 100812. [Google Scholar] [CrossRef]
  2. Villada Duqe, F.; López-Lezama, J.M.; Muñoz-Galeano, N. Effects of Incentives for Renewable Energy in Colombia. Ing. Univ. 2017, 21, 257–272. [Google Scholar] [CrossRef]
  3. Li, X.; Zhang, Q.; Peng, Z.; Wang, A.; Wang, W. A data-driven two-level clustering model for driving pattern analysis of electric vehicles and a case study. J. Clean. Prod. 2019, 206, 827–837. [Google Scholar] [CrossRef]
  4. Cheng, X.; Yu, F.; Qiu, L. An Effective Charging Torque Elimination Method for Dual-Channel Electric-Drive-Reconstructed Onboard Chargers. World Electr. Veh. J. 2024, 15, 205. [Google Scholar] [CrossRef]
  5. Borroy Vicente, S.; Fernández, G.; Galan, N.; Llombart Estopiñán, A.; Salani, M.; Derboni, M.; Giuffrida, V.; Hernández-Callejo, L. Assessment of the Technical Impacts of Electric Vehicle Penetration in Distribution Networks: A Focus on System Management Strategies Integrating Sustainable Local Energy Communities. Sustainability 2024, 16, 6464. [Google Scholar] [CrossRef]
  6. Zuluaga-Ríos, C.D.; Florián-Ceballos, D.F.; Rojo-Yepes, M.Á.; Saldarriaga-Zuluaga, S.D. Review of charging load modeling strategies for electric vehicles: A comparison of grid-to-vehicle probabilistic approaches. Tecnura 2021, 25, 108–125. [Google Scholar] [CrossRef]
  7. Grahn, P.; Rosenlind, J.; Hilber, P.; Alvehag, K.; Söder, L. A method for evaluating the impact of electric vehicle charging on transformer hotspot temperature. In Proceedings of the 2011 2nd IEEE PES International Conference and Exhibition on Innovative Smart Grid Technologies, Manchester, UK, 5–7 December 2011; pp. 1–8. [Google Scholar] [CrossRef]
  8. Yi, Z.; Scoffield, D. A data-driven framework for residential electric vehicle charging load profile generation. In Proceedings of the 2018 IEEE Transportation Electrification Conference and Expo (ITEC), Long Beach, CA, USA, 13–15 June 2018; pp. 519–524. [Google Scholar] [CrossRef]
  9. Kongjeen, Y.; Bhumkittipich, K.; Mithulananthan, N.; Amiri, I.; Yupapin, P. A modified backward and forward sweep method for microgrid load flow analysis under different electric vehicle load mathematical models. Electr. Power Syst. Res. 2019, 168, 46–54. [Google Scholar] [CrossRef]
  10. Li, G.; Zhang, X.P. Modeling of plug-in hybrid electric vehicle charging demand in probabilistic power flow calculations. IEEE Trans. Smart Grid 2012, 3, 492–499. [Google Scholar] [CrossRef]
  11. Shahidinejad, S.; Filizadeh, S.; Bibeau, E. Profile of charging load on the grid due to plug-in vehicles. IEEE Trans. Smart Grid 2011, 3, 135–141. [Google Scholar] [CrossRef]
  12. Ali, A.; Mahdi, S.; Ali, E.; Masoud, A.G.; Michael, F. Optimal WDG planning in active distribution networks based on possibilistic–probabilistic PEVs load modeling. IET Gen. Transm. Distrib. 2017, 11, 865–875. [Google Scholar] [CrossRef]
  13. Rubino, L.; Rubino, G.; Esempio, R. Linear Programming-Based Power Management for a Multi-Feeder Ultra-Fast DC Charging Station. Energies 2023, 16, 1213. [Google Scholar] [CrossRef]
  14. Stiasny, J.; Zufferey, T.; Pareschi, G.; Toffanin, D.; Hug, G.; Boulouchos, K. Sensitivity analysis of electric vehicle impact on low-voltage distribution grids. Electr. Power Syst. Res. 2021, 191, 106696. [Google Scholar] [CrossRef]
  15. Frendo, O.; Graf, J.; Gaertner, N.; Stuckenschmidt, H. Data-driven smart charging for heterogeneous electric vehicle fleets. Energy AI 2020, 1, 100007. [Google Scholar] [CrossRef]
  16. Yi, T.; Zhang, C.; Lin, T.; Liu, J. Research on the spatial-temporal distribution of electric vehicle charging load demand: A case study in China. J. Clean. Prod. 2020, 242, 118457. [Google Scholar] [CrossRef]
  17. Gil-Aguirre, J.; Perez-Londoño, S.; Mora-Flórez, J. A measurement-based load modelling methodology for electric vehicle fast-charging stations. Electr. Power Syst. Res. 2019, 176, 105934. [Google Scholar] [CrossRef]
  18. Zhou, W.; Xu, K.; Yang, Y.; Lu, J. Driving cycle development for electric vehicle application using principal component analysis and K-means cluster: With the case of Shenyang, China. Energy Procedia 2017, 105, 2831–2836. [Google Scholar] [CrossRef]
  19. Xydas, E.; Marmaras, C.; Cipcigan, L.M.; Jenkins, N.; Carroll, S.; Barker, M. A data-driven approach for characterising the charging demand of electric vehicles: A UK case study. Appl. Energy 2016, 162, 763–771. [Google Scholar] [CrossRef]
  20. Ashtari, A.; Bibeau, E.; Shahidinejad, S.; Molinski, T. PEV charging profile prediction and analysis based on vehicle usage data. IEEE Trans. Smart Grid 2011, 3, 341–350. [Google Scholar] [CrossRef]
  21. Crozier, C.; Morstyn, T.; McCulloch, M. A stochastic model for uncontrolled charging of electric vehicles using cluster analysis. arXiv 2019, arXiv:1907.09458. [Google Scholar] [CrossRef]
  22. Gerossier, A.; Girard, R.; Kariniotakis, G. Modeling and forecasting electric vehicle consumption profiles. Energies 2019, 12, 1341. [Google Scholar] [CrossRef]
  23. Gödde, M.; Findeisen, T.; Sowa, T.; Nguyen, P.H. Modelling the charging probability of electric vehicles as a gaussian mixture model for a convolution based power flow analysis. In Proceedings of the 2015 IEEE Eindhoven PowerTech, Eindhoven, The Netherlands, 29 June–2 July 2015; pp. 1–6. [Google Scholar] [CrossRef]
  24. Arias, M.B.; Bae, S. Electric vehicle charging demand forecasting model based on big data technologies. Appl. Energy 2016, 183, 327–339. [Google Scholar] [CrossRef]
  25. Sun, K.; Sarker, M.R.; Ortega-Vazquez, M.A. Statistical characterization of electric vehicle charging in different locations of the grid. In Proceedings of the 2015 IEEE Power & Energy Society General Meeting, Denver, CO, USA, 26–30 July 2015; pp. 1–5. [Google Scholar] [CrossRef]
  26. Khoo, Y.B.; Wang, C.H.; Paevere, P.; Higgins, A. Statistical modeling of Electric Vehicle electricity consumption in the Victorian EV Trial, Australia. Transp. Res. Part D Transp. Environ. 2014, 32, 263–277. [Google Scholar] [CrossRef]
  27. Flammini, M.G.; Prettico, G.; Julea, A.; Fulli, G.; Mazza, A.; Chicco, G. Statistical characterisation of the real transaction data gathered from electric vehicle charging stations. Electr. Power Syst. Res. 2019, 166, 136–150. [Google Scholar] [CrossRef]
  28. Chung, Y.W.; Khaki, B.; Chu, C.; Gadh, R. Electric vehicle user behavior prediction using hybrid kernel density estimator. In Proceedings of the 2018 IEEE International Conference on Probabilistic Methods Applied to Power Systems (PMAPS), Boise, ID, USA, 24–28 June 2018; pp. 1–6. [Google Scholar] [CrossRef]
  29. Chen, L.; Huang, X.; Zhang, H. Modeling the charging behaviors for electric vehicles based on ternary symmetric kernel density estimation. Energies 2020, 13, 1551. [Google Scholar] [CrossRef]
  30. Su, J.; Lie, T.; Zamora, R. Modelling of large-scale electric vehicles charging demand: A New Zealand case study. Electr. Power Syst. Res. 2019, 167, 171–182. [Google Scholar] [CrossRef]
  31. Tekdemir, I.G.; Alboyaci, B.; Gunes, D.; Sengul, M. A probabilistic approach for evaluation of electric vehicles’ effects on distribution systems. In Proceedings of the 2017 4th International Conference on Electrical and Electronic Engineering (ICEEE), Ankara, Turkey, 8–10 April 2017; pp. 143–147. [Google Scholar] [CrossRef]
  32. Ul-Haq, A.; Cecati, C.; El-Saadany, E. Probabilistic modeling of electric vehicle charging pattern in a residential distribution network. Electr. Power Syst. Res. 2018, 157, 126–133. [Google Scholar] [CrossRef]
  33. Ahmadian, A.; Sedghi, M.; Aliakbar-Golkar, M. Stochastic modeling of plug-in electric vehicles load demand in residential grids considering nonlinear battery charge characteristic. In Proceedings of the 2015 20th Conference on Electrical Power Distribution Networks Conference (EPDC), Zahedan, Iran, 28–29 April 2015; pp. 22–26. [Google Scholar] [CrossRef]
  34. Tan, J.; Wang, L. Stochastic modeling of load demand of plug-in hybrid electric vehicles using fuzzy logic. In Proceedings of the 2014 IEEE PES T&D Conference and Exposition, Chicago, IL, USA, 14–17 April 2014; pp. 1–5. [Google Scholar] [CrossRef]
  35. Hussain, S.; Ahmed, M.A.; Kim, Y.C. Efficient power management algorithm based on fuzzy logic inference for electric vehicles parking lot. IEEE Access 2019, 7, 65467–65485. [Google Scholar] [CrossRef]
  36. Betancur, D.; Duarte, L.F.; Revollo, J.; Restrepo, C.; Díez, A.E.; Isaac, I.A.; López, G.J.; González, J.W. Methodology to evaluate the impact of electric vehicles on electrical networks using Monte Carlo. Energies 2021, 14, 1300. [Google Scholar] [CrossRef]
  37. Liu, S.; Fang, C.; Jia, S.; Xiang, Y.; Yang, J. Hierarchical and distributed optimization of distribution network considering spatial and temporal distribution of electric vehicle charging load. Energy Rep. 2023, 9, 308–322. [Google Scholar] [CrossRef]
  38. de Sa, A.L.S.; Lavieri, P.S.; Cheng, Y.T.; Hajhashemi, E.; Oliveira, G.J. Modelling driver’s response to demand management strategies for electric vehicle charging in Australia. Energy Res. Soc. Sci. 2023, 103, 103218. [Google Scholar] [CrossRef]
  39. Andemos. Andemos Asociacion de Movilidad Sostenible. Available online: https://www.andemos.org/ruta-electrica (accessed on 18 October 2024).
  40. Karabasoglu, O.; Michalek, J. Influence of driving patterns on life cycle cost and emissions of hybrid and plug-in electric vehicle powertrains. Energy Policy 2013, 60, 445–461. [Google Scholar] [CrossRef]
  41. XM. XM Informes de Demanda. Available online: https://www.xm.com.co/consumo/informes-demanda/indicadores-de-pronosticos-oficiales-de-demanda (accessed on 18 December 2022).
  42. Duarte Soares, L.; de Souza Queiroz, A.; López, G.P.; Carreño-Franco, E.M.; López-Lezama, J.M.; Muñoz-Galeano, N. BiGRU-CNN Neural Network Applied to Electric Energy Theft Detection. Electronics 2022, 11, 693. [Google Scholar] [CrossRef]
  43. Hernández, J.A.; Fernández, E.; Torres, H. Electric Vehicle NiMH Battery State of Charge Estimation Using Artificial Neural Networks of Backpropagation and Radial Basis. World Electr. Veh. J. 2023, 14, 312. [Google Scholar] [CrossRef]
  44. Arnob, S.S.; Arefin, A.I.M.S.; Saber, A.Y.; Mamun, K.A. Energy Demand Forecasting and Optimizing Electric Systems for Developing Countries. IEEE Access 2023, 11, 39751–39775. [Google Scholar] [CrossRef]
  45. Wazirali, R.; Yaghoubi, E.; Abujazar, M.S.S.; Ahmad, R.; Vakili, A.H. State-of-the-art review on energy and load forecasting in microgrids using artificial neural networks, machine learning, and deep learning techniques. Electr. Power Syst. Res. 2023, 225, 109792. [Google Scholar] [CrossRef]
  46. Hu, H.; Gong, S.; Taheri, B. Energy demand forecasting using convolutional neural network and modified war strategy optimization algorithm. Heliyon 2024, 10, e27353. [Google Scholar] [CrossRef]
  47. Medina, S.V.; Ajenjo, U.P. Performance Improvement of Artificial Neural Network Model in Short-term Forecasting of Wind Farm Power Output. J. Mod. Power Syst. Clean Energy 2020, 8, 484–490. [Google Scholar] [CrossRef]
Figure 1. Flowchart of the proposed methodology.
Wevj 15 00493 g001
Figure 2. Artificial neural network.
Wevj 15 00493 g002
Figure 3. Number of EVs in Medellin.
Wevj 15 00493 g003
Figure 4. Frequency of statistics (2023).
Wevj 15 00493 g004
Figure 5. Frequency of statistics (2030).
Wevj 15 00493 g005
Figure 6. Real demand vs demand forecast.
Wevj 15 00493 g006
Table 1. EVs in Medellin.
Type of Tecnologie2019202020212022
HEV871148830444649
BEV314434439694
PHEV295204339415
TOTAL1480212638225758
Table 2. EVs in Medellin by segment.
Segement2019202020212022
Automobile693134814511759
Utility Car69267622183780
Passenger Commercial64401
Cargo Commercial −10.5T1784118203
Cargo Commercial +10.5T0001
Pick Up08164
Van7990
Taxi70010
TOTAL1480212638225758
Table 3. Number of EVs in Medellin 2008–2022.
YearActual Number of EVsForecast Number of EVsAbsolute ErrorRelative Error
2008-9--
2009-14--
2010-22--
2011-34--
2012-55--
2013-87--
2014-139--
2015-222--
2016-354--
2017-564--
2018-899--
201914801433473.2%
2020212622841577.4%
2021382236421804.7%
202257585805470.81%
Table 4. Forecast of the number EVs in Medellin 2023–2030.
YearNumber of EVs
20239252
202414,747
202523,506
202637,467
202759,720
202895,190
2029151,725
2030241,839
Table 5. Charging parameters of five types of EV models [30].
EV TypesModelBattery (kWh)Charging Power (kW)Full Endurance Mileage (km)
Slow ChargingFast Charging
Private vehicleNissan Leaf24/406.611150/250
Utility vehicleNissan Leaf406.611250
Commercial vehicleNissan Leaf4011250
Goods truckEMS 18 series24080250
BusAUT-BUS20250200
Table 6. Characteristic EV charging parameters for probabilistic modeling [30].
Daily Charging TimesCharging Period (Tp, Td)Charging Mode M C Probability
Electric private vehicle19:00–17:00Slow10%
18:00–07:00Slow80%
09:00–17:00Fast10%
Electric utility vehicles29:00–17:00Fast30%
18:00–07:00Slow70%
Electric commercial vehicles200:00–09:00Fast90%
09:00–16:00Fast60%
16:00–24:00Fast50%
Electric goods trucks200:00–09:00Fast80%
09:00–24:00Fast120%
Electric bus122:00–07:00Fast100%
Table 7. Forecast of the EV load statistics for 2023 and 2030.
Statistics 2023Statistics 2030
MAX [MW]2.8547.166
MIN [MW]2.4066.956
PROM [MW]2.6177.054
STD0.0600.030
Table 8. Number of Layers and Root Mean Square Error.
LayersRoot Mean Square Error
54,295,158
1014,889,360
155,248,382
208,892,628
254,176,252
3012,750,712
356,177,012
4023,758,554
4523,557,122
5032,971,744
Table 9. Real Demand vs Forecast Demand.
MonthReal Demand 2022 (MWh)Demand Forecast 2022 (MWh)Absolute ErrorRelative Error
January26,40529,1602.75510.4%
February27,99332,2224.22915.1%
March27,47125,2082.2638.2%
April26,47928,5432.0647.79%
May27,03728,0190.9823.63%
June26,66428,1431.4795.54%
July26,44025,0471.3935.26%
August26,63728,5711.9347.26%
September26,96928,1431.1744.35%
October26,46727,0150.5482.07%
November26,55125,9210.6302.4%
December26,24424,1562.0887.95%
Table 10. General demand forecast for the city of Medellin.
20232024202520262027202820292030
33,94034,58635,60436,28236,97237,67538,39239,123
34,54635,20336,24036,92937,63238,34739,07739,820
35,30635,97837,03737,74238,46039,19239,93740,697
33,31433,94834,94835,61236,29036,98037,68438,401
22,61723,04723,72624,17724,63725,10625,58326,070
32,65833,27934,25934,91135,57536,25236,94137,644
33,22633,85834,85535,51836,19436,88237,58438,299
25,21925,69926,45626,95927,47227,99528,52729,070
27,11327,62928,44328,98429,53530,09730,67031,253
36,27936,96938,05838,78239,51940,27141,03741,818
24,77325,24425,98726,48226,98627,49928,02228,555
31,85732,46333,41934,05534,70335,36336,03536,721
Disclaimer/Publisher’s Note: The statements, opinions and data contained in all publications are solely those of the individual author(s) and contributor(s) and not of MDPI and/or the editor(s). MDPI and/or the editor(s) disclaim responsibility for any injury to people or property resulting from any ideas, methods, instructions or products referred to in the content.

