Article

A Non-Intrusive Load Monitoring Model for Electric Vehicles Based on Multi-Kernel Conventional Neural Network

1
Zhongshan Power Supply Bureau of Guangdong Power Grid Co., Ltd., Zhongshan 528400, China
2
Digital Grid Research Institute, China Southern Power Grid, Guangzhou 510663, China
*
Author to whom correspondence should be addressed.
World Electr. Veh. J. 2023, 14(2), 51; https://doi.org/10.3390/wevj14020051
Submission received: 25 December 2022 / Revised: 2 February 2023 / Accepted: 7 February 2023 / Published: 10 February 2023

Abstract

:
With the widespread use of electric vehicles (EVs), the charging behavior of these resources has brought a large amount of load growth to the grid, leading to a series of problems such as increased peak valley load difference and line flow violation. Non-intrusive load monitoring (NILM) is a key technology that can be employed to monitor the multi-source load data information in the power grid and support the high-proportion access of electric vehicles. However, traditional NILM approaches are designed to identify the operation of household appliances and cannot be applied at the substation level directly due to frequent and intricate switching events of electrical equipment at this stage. In this paper, a NILM algorithm that can be applied for the monitoring of the charging behavior of electric vehicles at the substation level is proposed to support the high-proportion injection of distributed energy resources. The proposed approach employs a deep learning framework and a multi-kernel convolutional neural network (multi-kernel CNN) framework is used. The performance of the proposed method is verified on the self-organized datasets based on Pecan Street data and results showed that the obtained f1 score is over 90% for both the training sets and testing sets.

1. Introduction

In the novel power system, the load structure tends to be increasingly complicated, the time-varying nature of the model parameters rises, and the active and electronic characteristics of the load side become more significant [1,2,3]. At the same time, with the widespread use of distributed energy resources such as electric vehicles and buses, the charging demand of these transports has caused significant load growth on the grid, which could lead to problems such as increased peak valley load difference, line flow violation, etc. [4,5]. Load monitoring is a technique that can be used to obtain residential power information and help to develop demand response plans [6,7,8,9,10]. However, there are challenges with the conventional artificial experience analysis-based load modeling approach [11]. A major challenge in the control of the novel power system is how to completely mine the multi-source load data information in the power grid using digital technology to produce quick and accurate load modeling.
Load monitoring is a technique that can be used to obtain residential power information for the guidance of grid scheduling and dispatching, as well as provide consumers with energy consumption information to improve their participation in demand response and optimize residential power consumption behavior [12,13]. Load monitoring methods can be divided into intrusive load monitoring (ILM) and non-intrusive load monitoring (NILM) [14,15,16]. The power information for each appliance or device is required for the ILM approach. To track the usage of each electrical equipment using the intrusive technique, a large number of monitoring devices, such as smart meters, must be installed, resulting in a higher investment and operation cost [17]. NILM is a technology that can be used to obtain the “ON/OFF” state and energy consumption information of each type of device using aggregate information [18]. The implementation of NILM is based on feature recognition technologies. Only a single measurement device is needed to be installed at the low-voltage side of the substation to monitor the energy consumption of each type of device, making NILM a cost-effective strategy [19]. Additionally, customers are more likely to have higher acceptance of the non-intrusive approach due to its non-intrusive nature, which facilitates the promotion of this strategy [20].
The load monitoring is realized based on the analysis of the aggregate load power consumption information obtained from the measurement tools installed at the low-voltage side of a substation or outside the residential house [21,22]. For different types of loads, the operation characteristics, such as duration time and rated power, are different. As a result, the main objective of NILM is to identify the operation curve of these devices through these signatures. Currently, NILM methods can be divided into low-frequency measurement-based approaches or high-frequency measurement-based approaches depending on the sampling rate of the measured load data [18]. However, the acquisition of high-frequency sampling data is relatively expensive, making the low-frequency data-based method a cost-effective way to monitor energy consumption information. At present, the commonly used low-frequency data mainly include voltage, current, or active power time series.
According to the different technical approaches, the NILM algorithm can be divided into two types: event-based methods and non-event-based methods. The former achieve load monitoring through load identification, which is applied to detect the switching events of electrical appliances and classify the events. The non-event-based NILM can be used to decompose the total power consumption data at any selected time or by a set step instead of events. This approach directly predicts the power sequence of the target appliance or speculates the possible combination of appliances based on the aggregate power sequence or other characteristics. It can be applied in situations where only the system composition at a specific time is known or the occurrence of events does not need to be detected, typically employed for statistics on long-term energy use.
At present, multiple types of research have been carried out on residential load decomposition using these NILM algorithms [23,24,25]. Reference [26] used the factorial hidden Markov model to identify the operation state of household appliances using a whole home electricity signal. Reference [27] employed the principal component analysis approach to acquire the best identification characteristics and decrease the dimensions of the load data. Combined with the supervised Fisher discrimination method, different types of loads can be identified. In recent years, with the increasing attention to the development of deep neural networks and their application in semantic segmentation and image recognition, many researchers have employed deep learning techniques to solve NILM problems [28,29,30,31,32]. The study [33] proposed deep neural networks for NILM based on recurrent neural networks (RNNs) and a factorial hidden Markov model (FHMM), respectively. Compared with traditional machine learning algorithms, the proposed approach achieved better performance in terms of recognition accuracy and precision. The study [34] employed a convolutional neural network (CNN) to solve the NILM problem and disaggregate the total power information. Compared to the methods proposed in [33], this approach takes less time and has better energy disaggregation performance. The study [35] further improved the accuracy of the NILM algorithm by establishing a load sample library for different types of loads. These studies, however, did not take electrical vehicles into account. Additionally, the proposed load decomposition algorithms can only be applied to disaggregate load data at the scale of residential houses or buildings.
Aiming to create demand response plans and solve the issues caused by high-proportion injection of electric vehicle loads, it is necessary to monitor the load consumption information from the substation level. However, the NILM framework at the residential scale cannot be directly applied to the substation level since there are a large number of electric power customers, frequent and complex switching events of electrical equipment, and significantly higher energy consumption. To solve this problem, a multi-kernel CNN-based NILM algorithm that can be applied to load disaggregated at the substation level is proposed in this paper. The suggested algorithm considers a region with a significant proportion of electric automobiles. Figure 1 depicts the decomposition of load at the substation level. To disaggregate the active power consumption information of electric vehicles at the substation level, the refinement level of load disaggregation is modified and the load type is divided into EV charging station load, domestic load, and commercial load. The main contributions of the proposed algorithm can be listed as follows:
(1)
In this paper, a NILM algorithm that can be applied for the monitoring of the charging behavior of electric vehicles at the substation level to support the high-proportion injection of distributed energy resources is proposed.
(2)
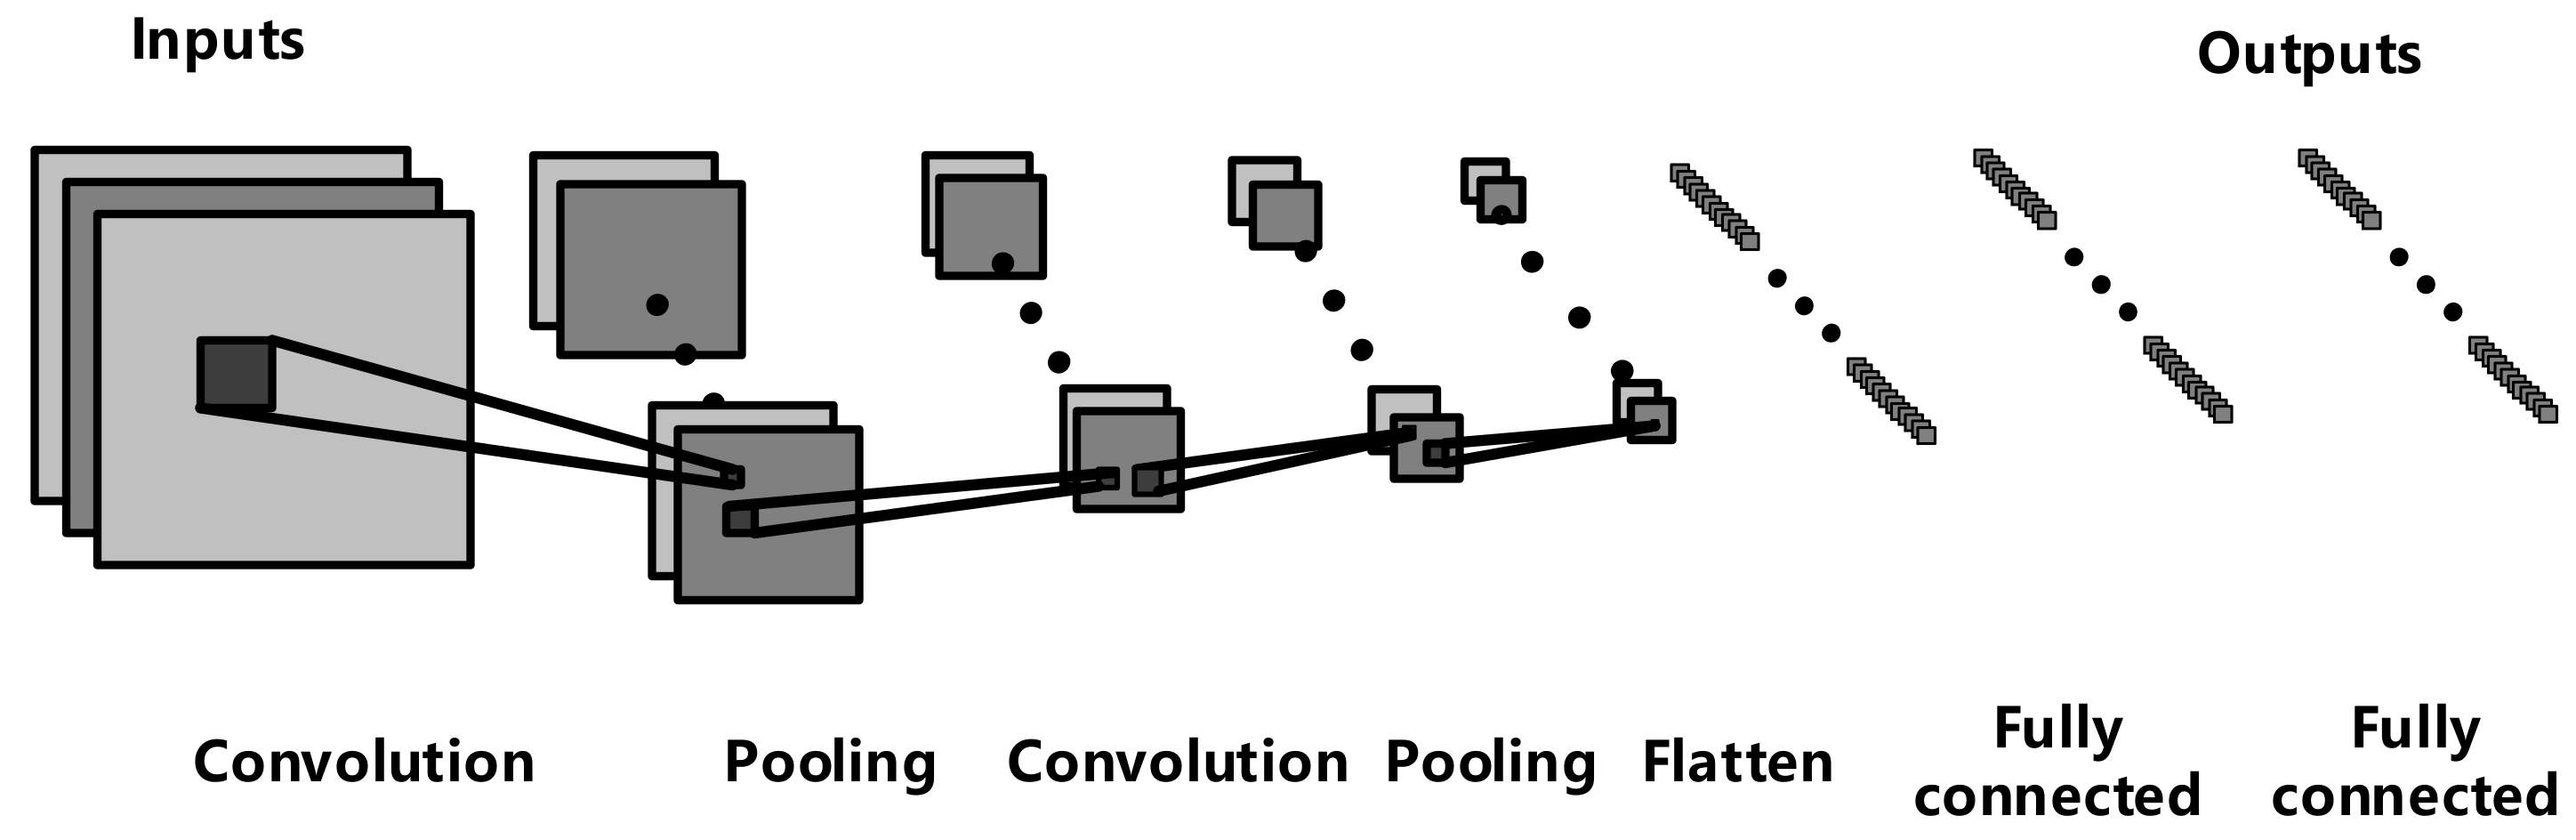
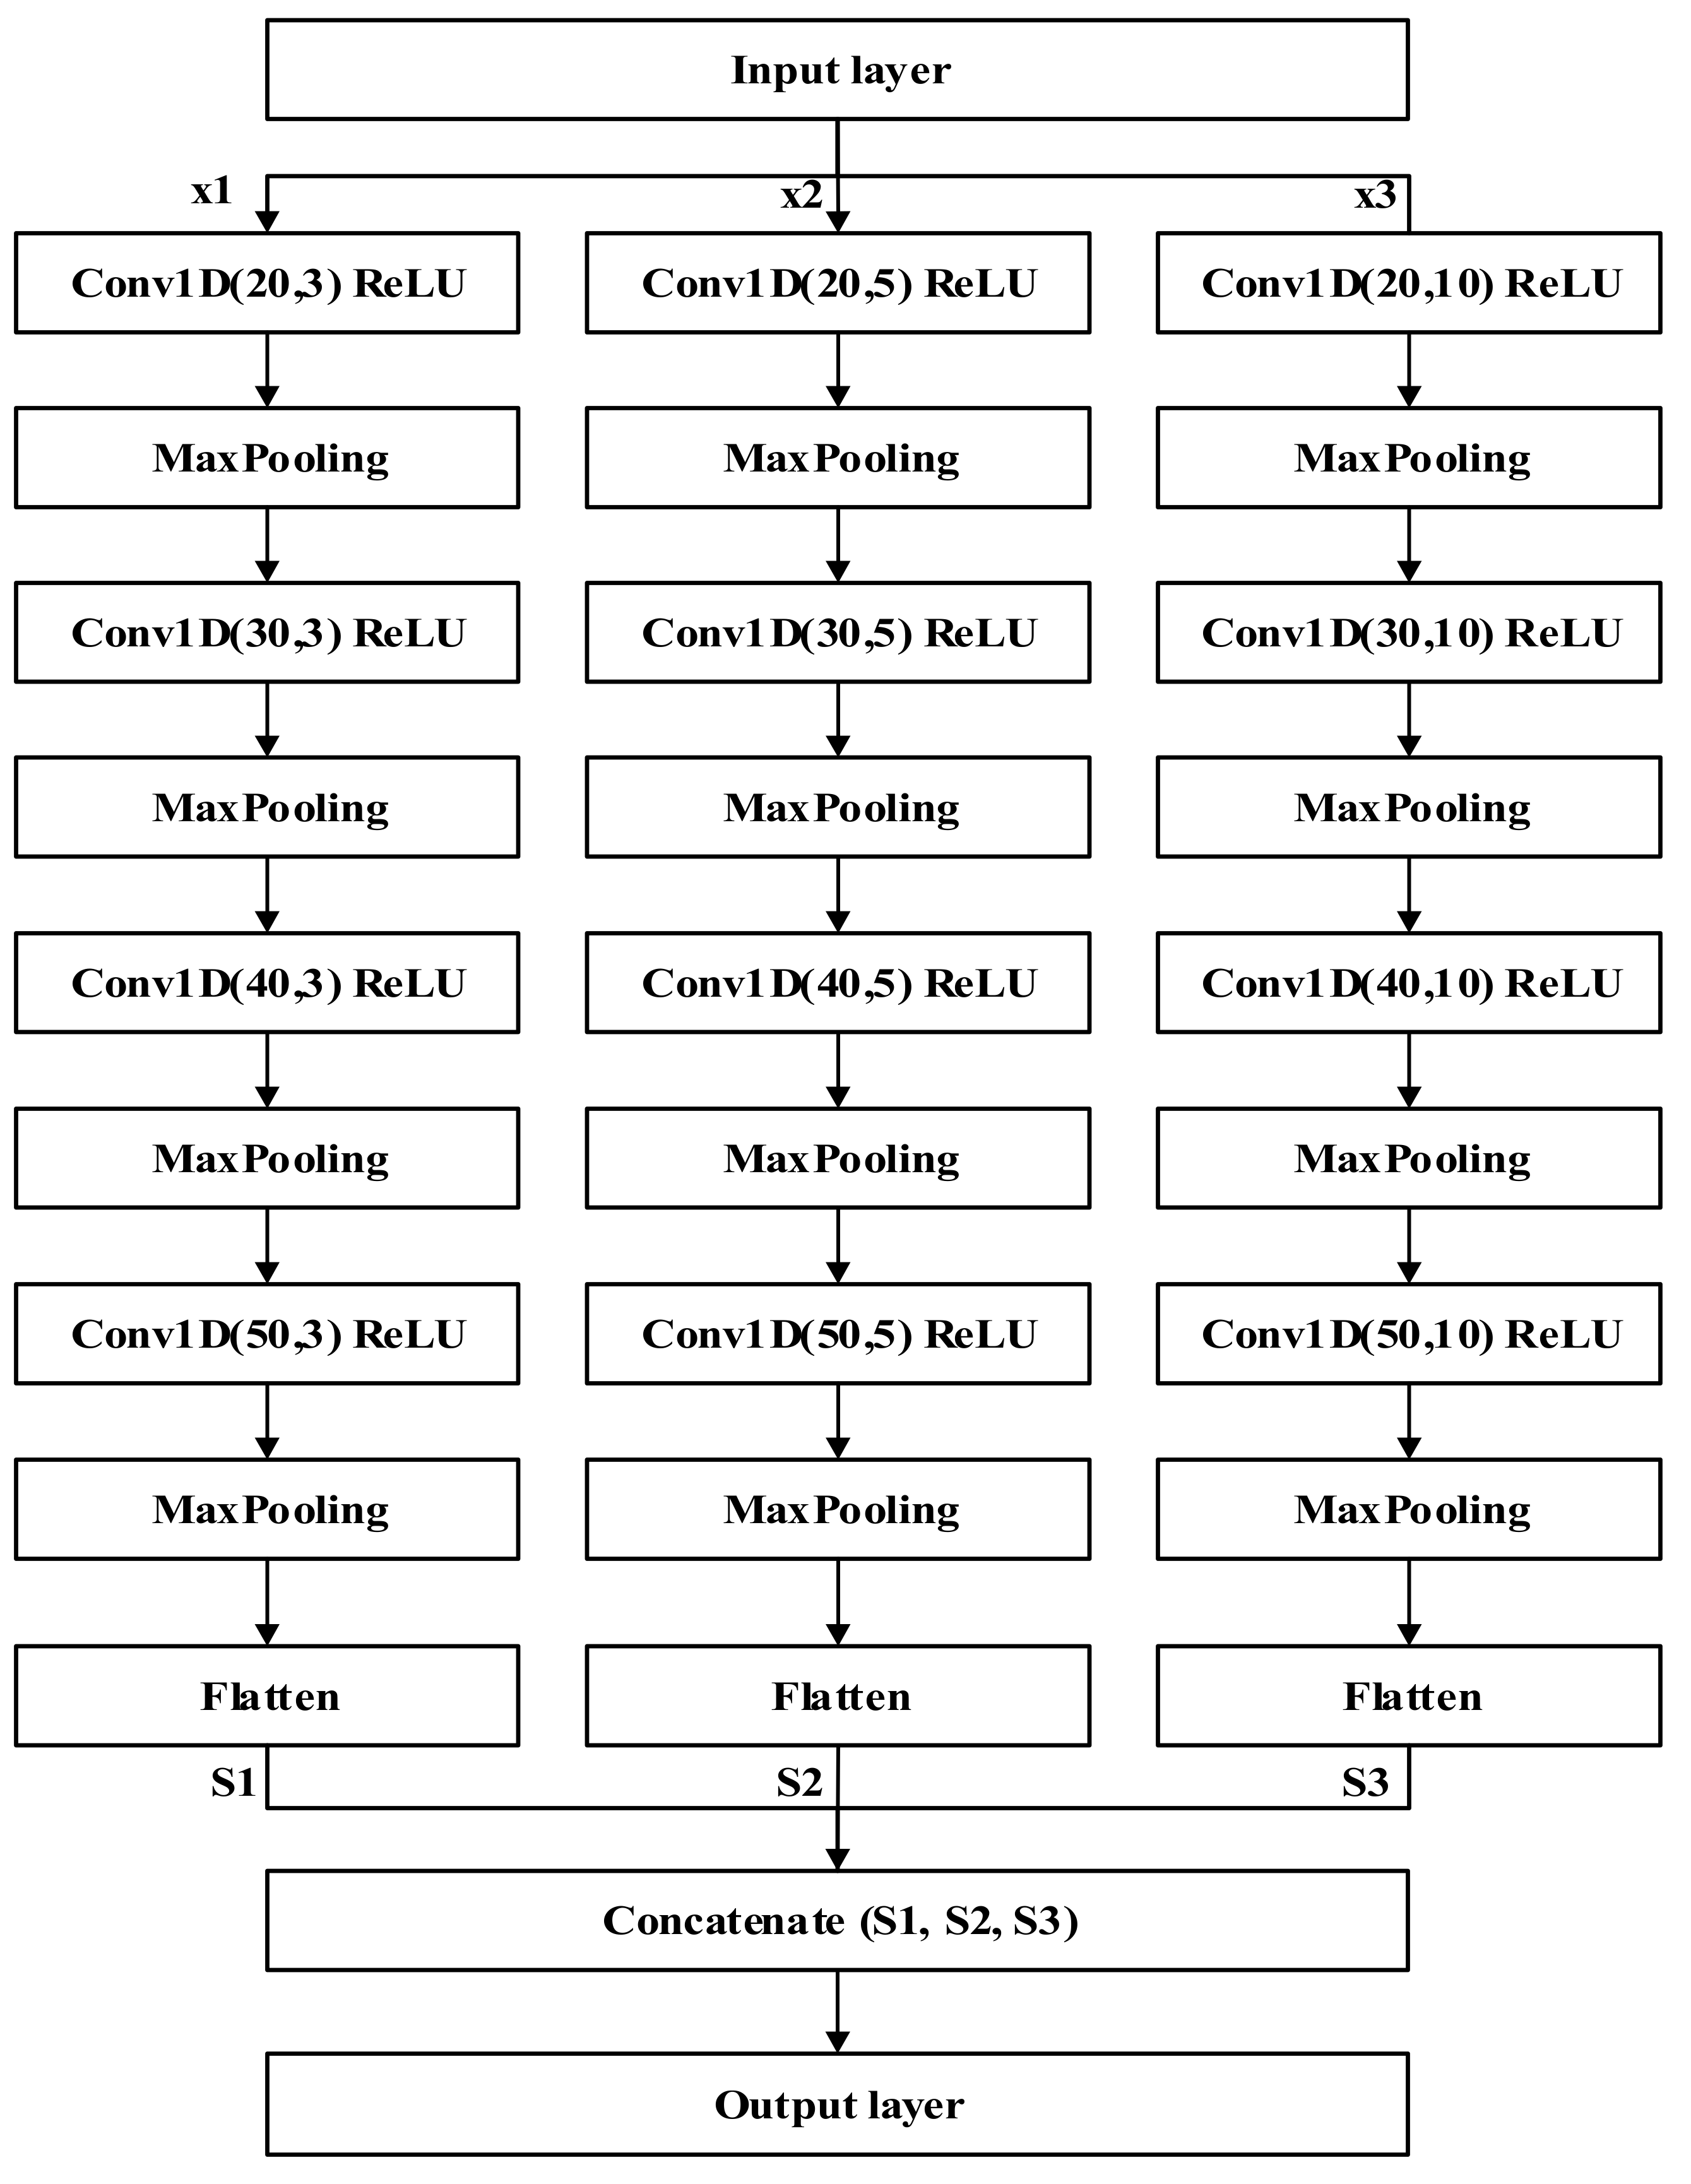
The multi-kernel CNN used in the NILM approach is designed by using three separate blocks with convolution kernels of different sizes that work in parallel to produce more precise disaggregation load data for electric vehicles.
(3)
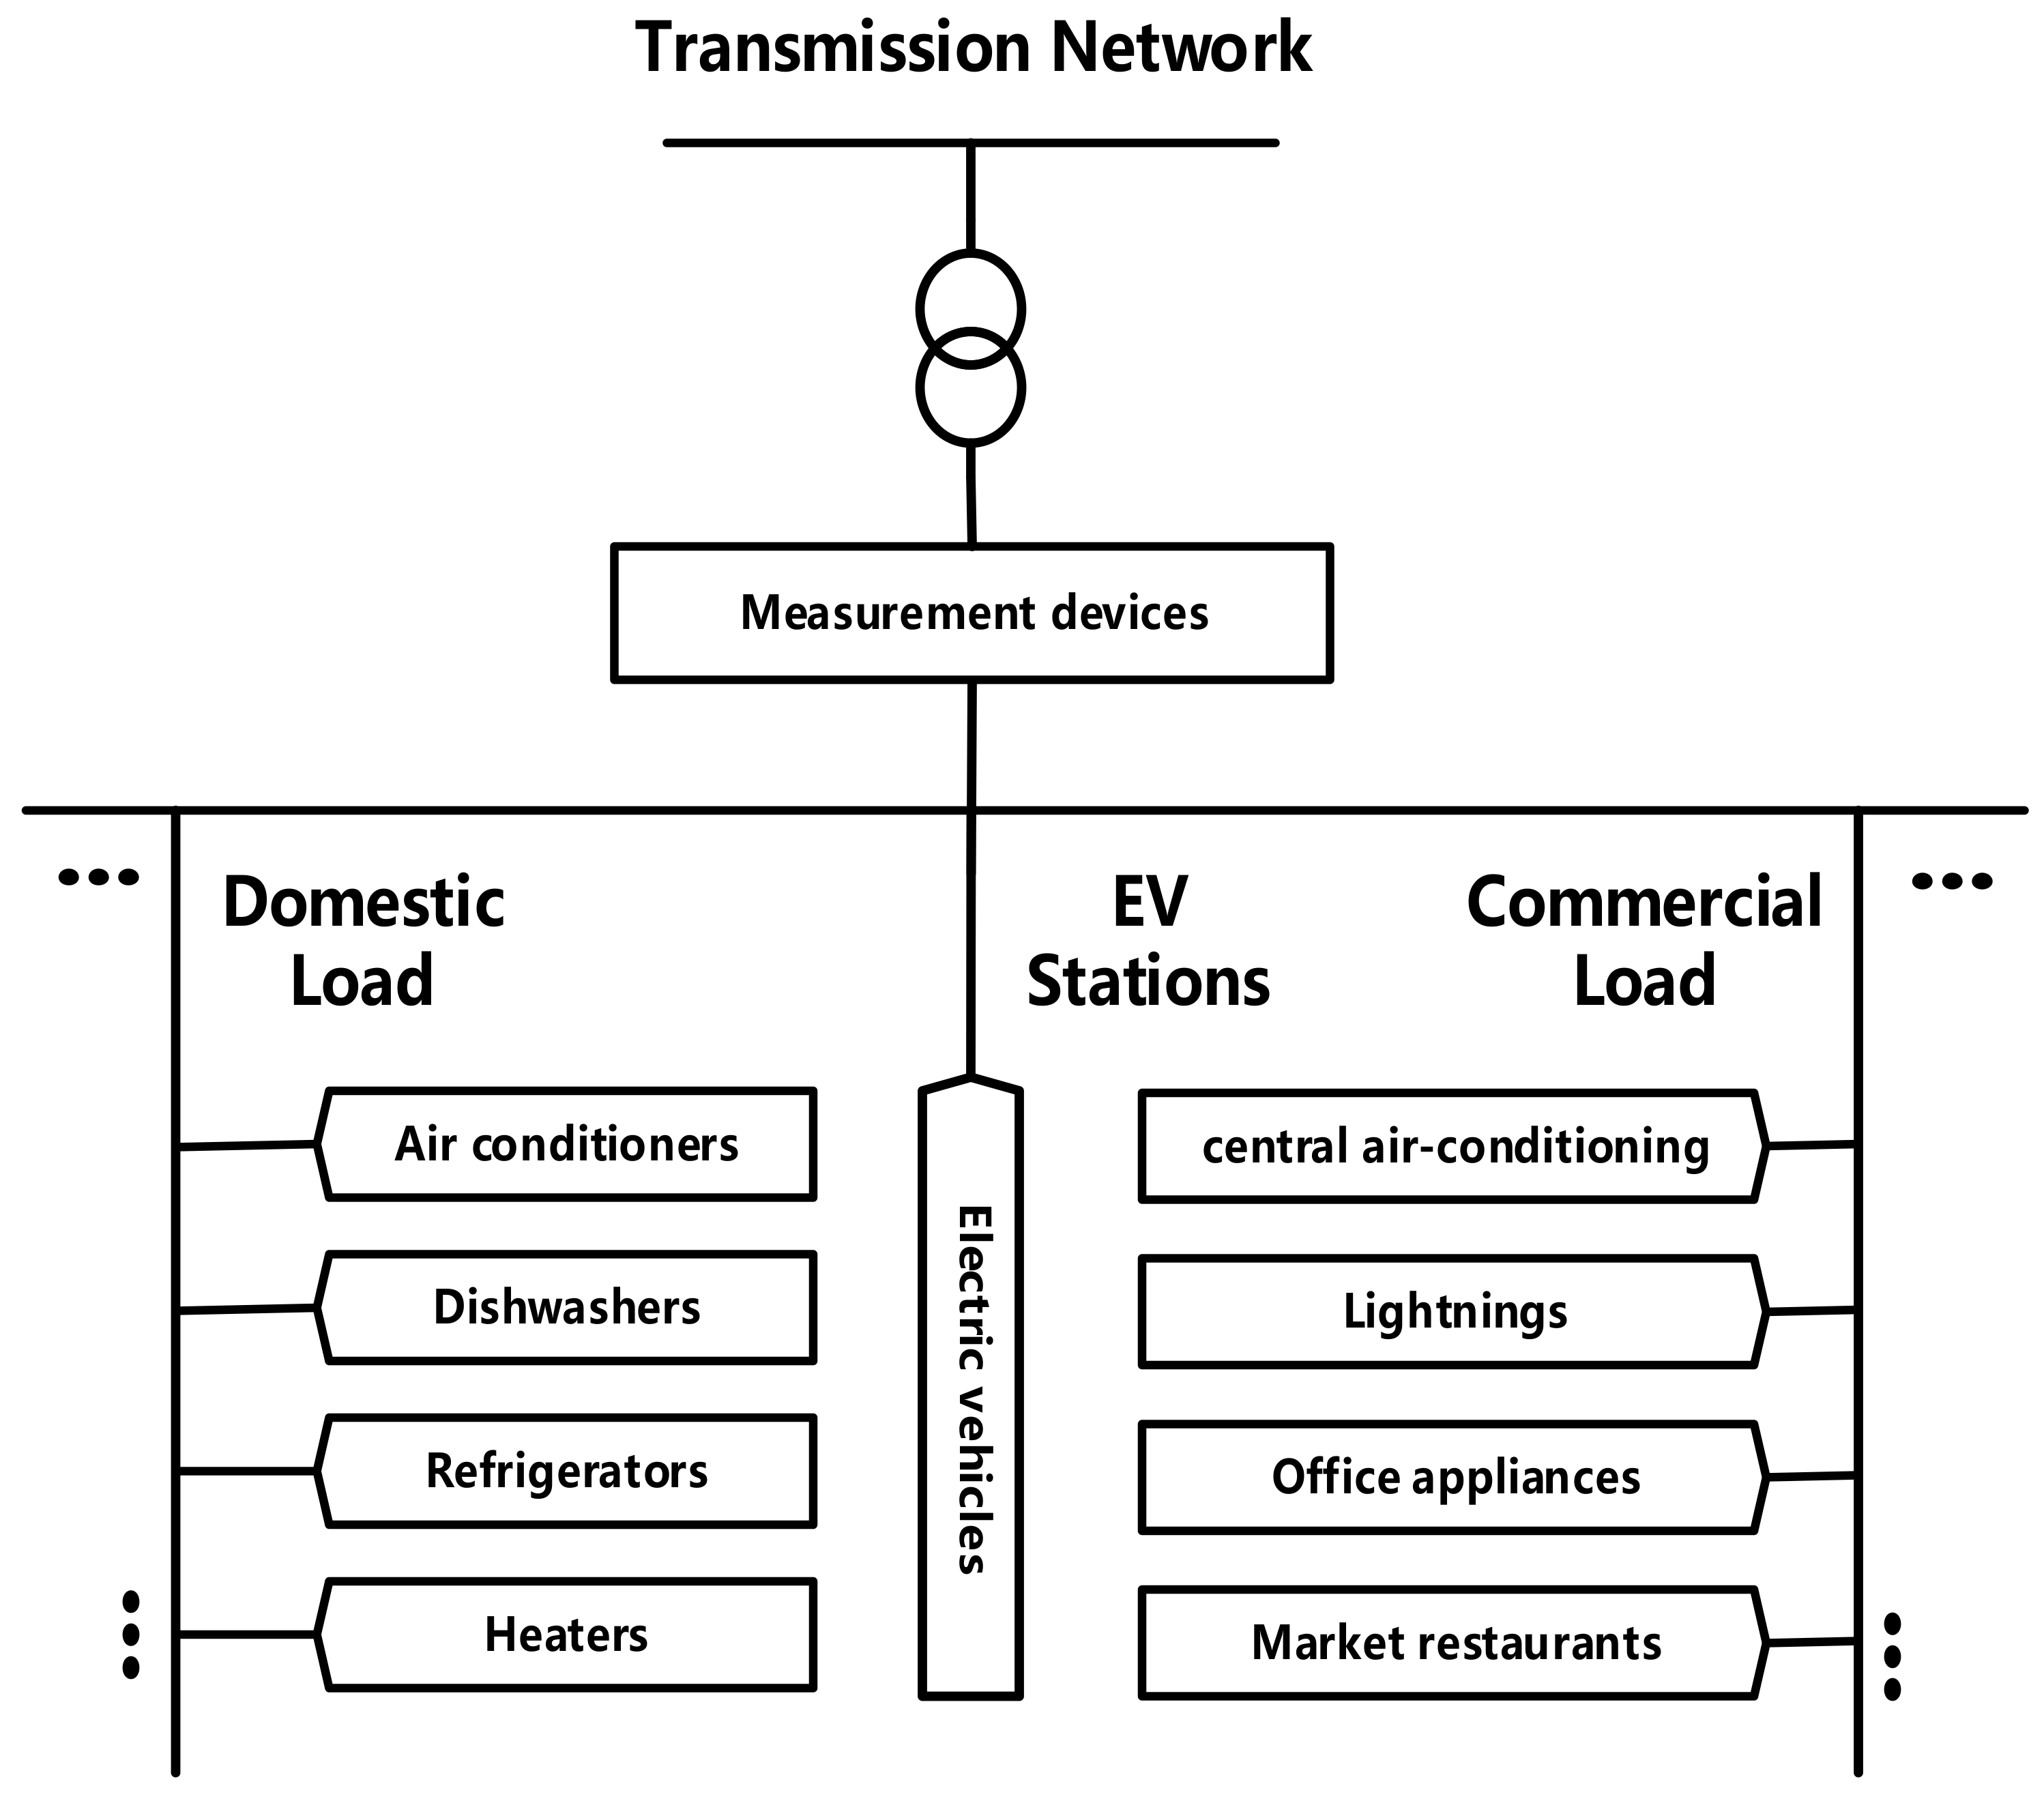
The proposed NILM algorithm can be applied to the load disaggregation of EV loads and monitor the load consumption information from the substation level which contains a large number of electric power customers, frequent and complex switching events of electrical equipment, and high energy consumption.

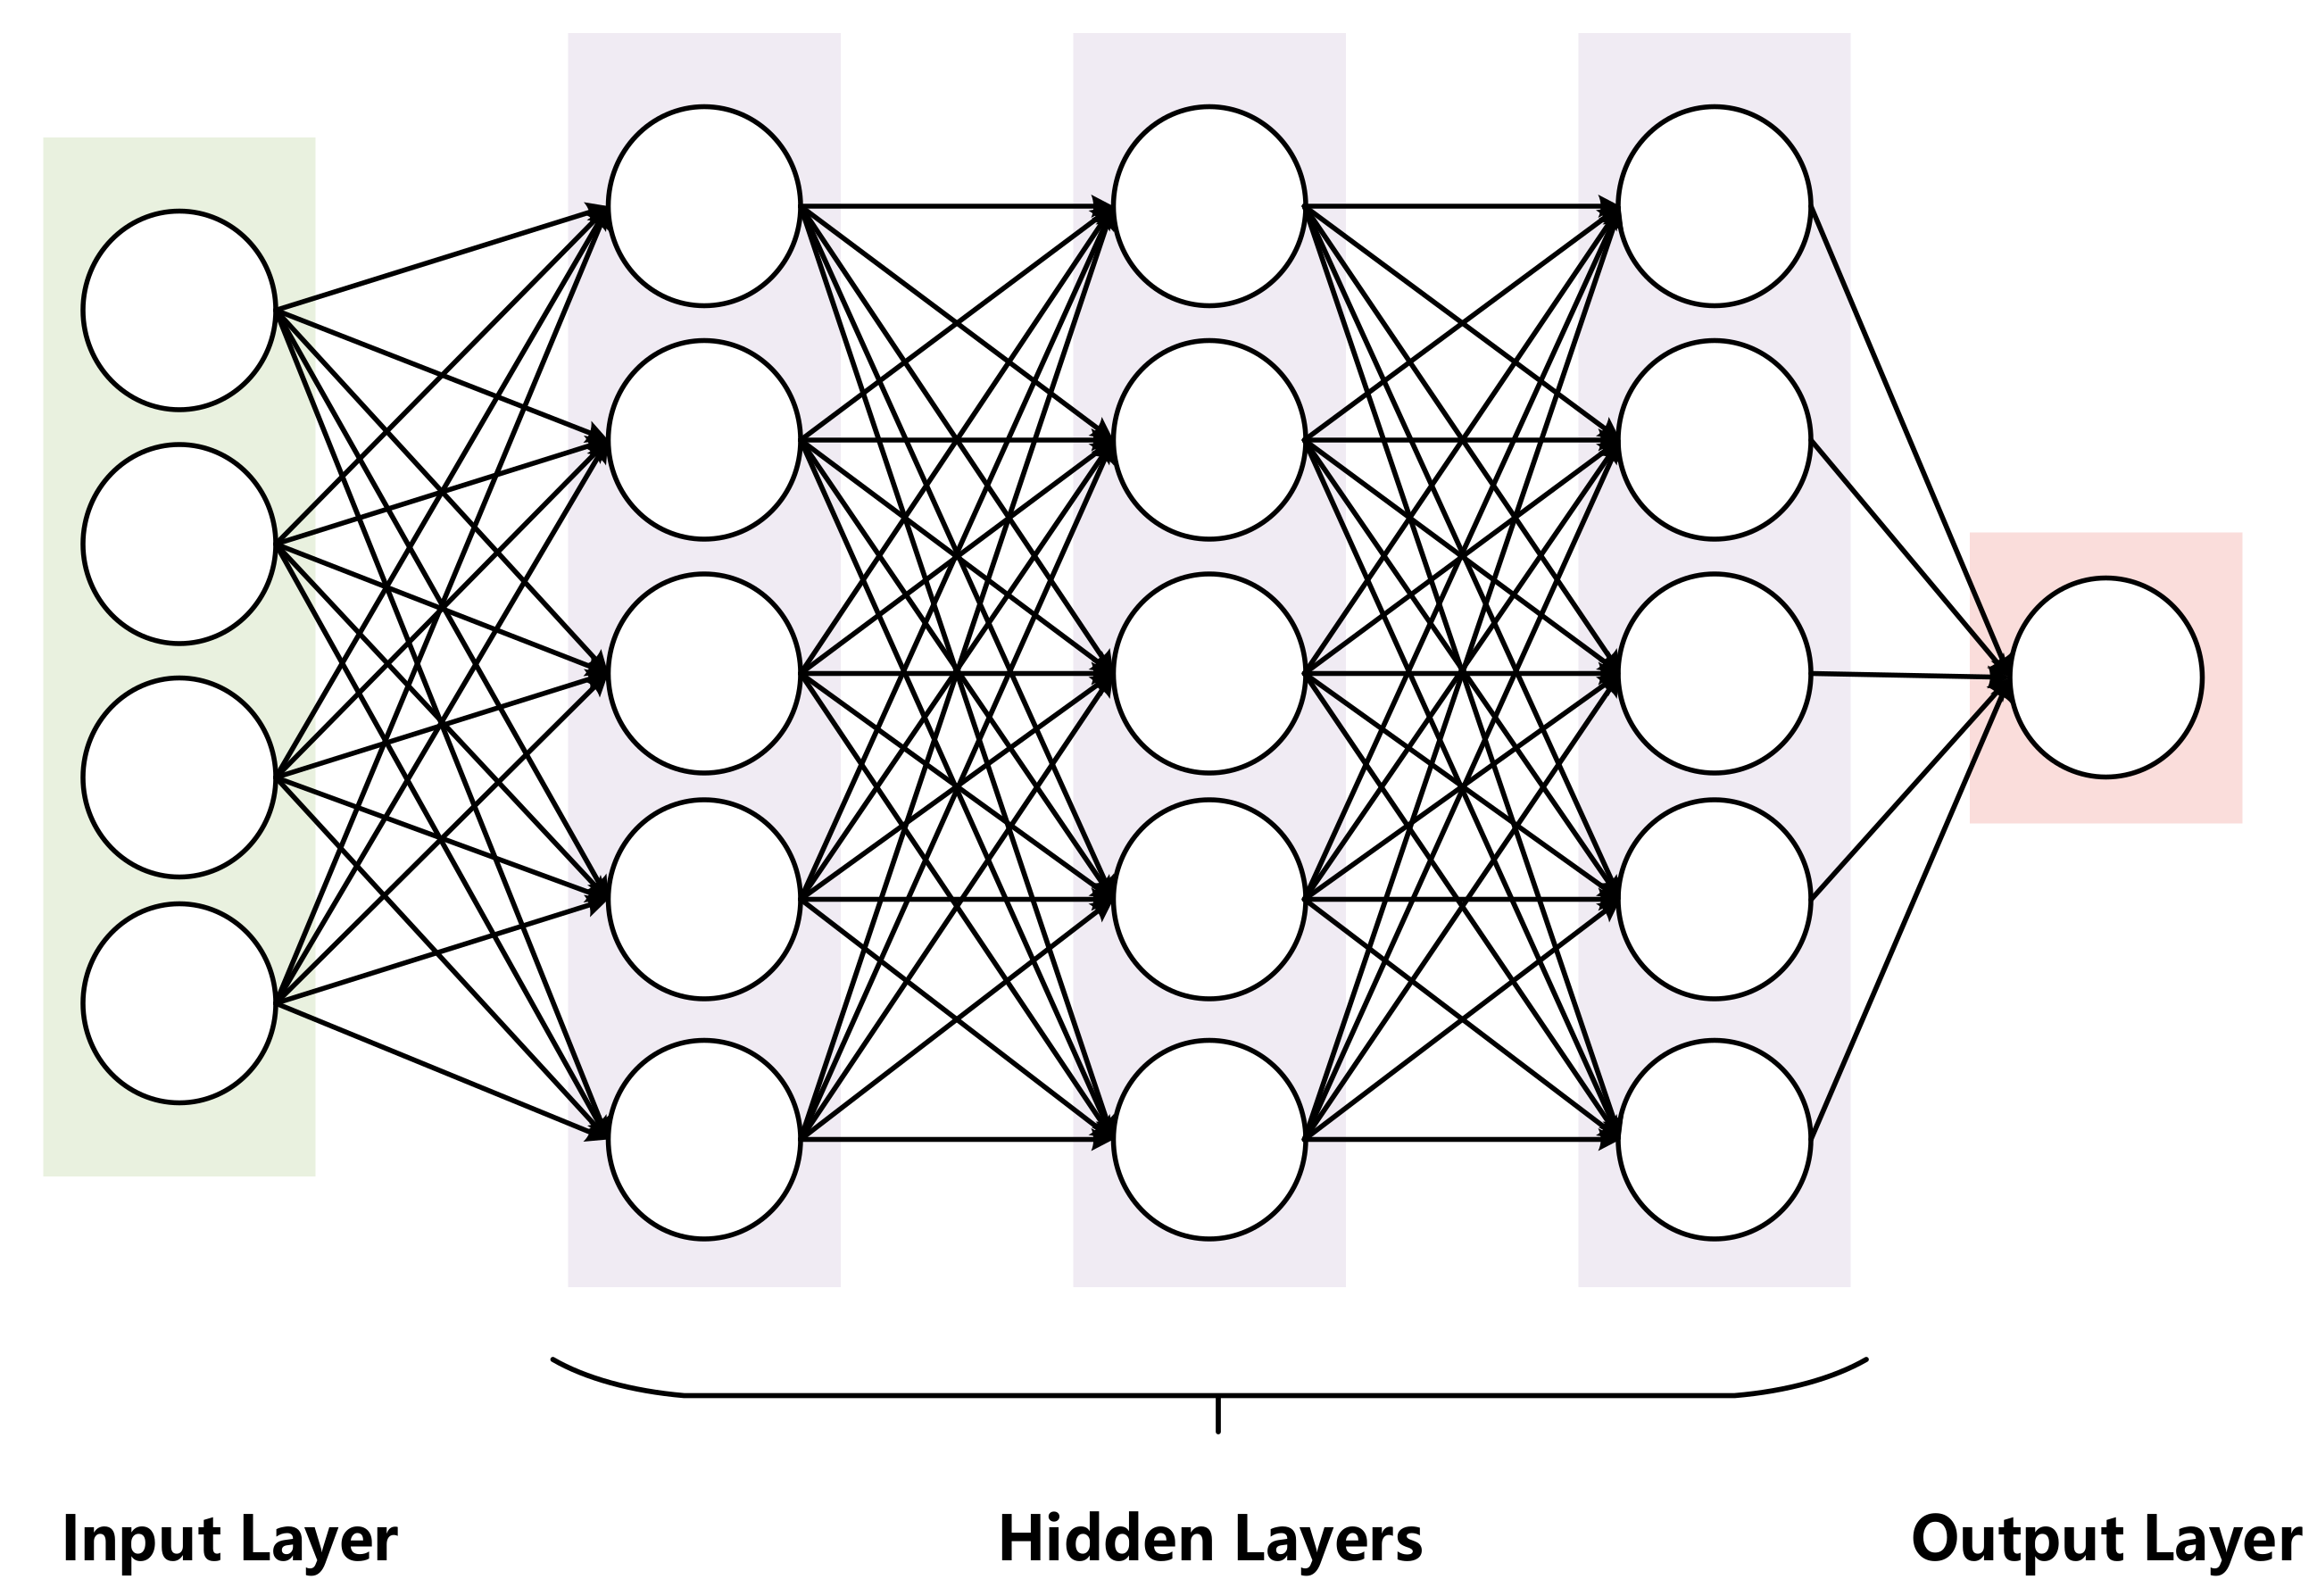
2. Convolutional Neural Network

Discrete-time convolution is an operation that multiplies and adds the values of two discrete-time sequences according to certain rules. According to the definition, the mathematical equation of discrete convolution can be given as:
x ( n ) = i = a ( i ) b ( n i ) = a ( n ) b ( n )
where x ( n ) is the new sequence after the convolution operation; a ( n ) and b ( n ) are the sequence before convolution. The convolutional neural network is a typical feed-forward neural network. The convolution operation of the CNN belongs to discrete convolution but is a linear operation rather than a real convolution operation. The corresponding convolution kernel can be called a filter.
Compared to the traditional fully connected neural network shown in Figure 2 which requires a time-consuming feature extraction and data reconstruction process, the CNN decreases the complexity and the number of weights of the network by using a weight-sharing network topology. The CNN is highly invariant to deformation such as translation, scaling, and tilting. The core layers of the CNN are the convolutional layers and pooling layers. Figure 3 shows the network structure of the CNN.
The convolutional layers contain several learnable kernels and are used to extract the features of the input data. Each element of the convolution kernel corresponds to a weight coefficient and a bias vector, similar to the neuron of a feed-forward neural network. In the convolutional layer, each neuron is connected to a small region of the input volume to realize a sparse local connection pattern between neurons of adjacent layers. The extent of the connecting area is called the “receptive field” and is determined by the kernel size. During the forward process, the kernels scan over the input features, multiplying the input features and adding the deviation within the receptive field.
Z l + 1 = [ Z l w l + 1 ] + b
where Z k l and Z l + 1 denote the input and output feature map of the (l + 1)th convolution layer; b is the deviation. The output volume size of the convolutional layer is determined by the depth, stride, and padding size, represented by:
V l + 1 = V l k + 2 p s + 1
where V l and V l + 1 are the spatial size of the input and output volume of the (l + 1)th convolution layer; k is the kernel size of neurons in the corresponding layer; p is the amount of zero padding at the edge; s is the stride which represents the number of units the filter translates each time.
The pooling layer is another important block of the CNN. It is applied to reduce the size of data and the number of network parameters and is usually inserted between the convolutional layers. After the feature extraction of the convolution layer, the output feature map is sent to the pooling layer for further feature selection and data filtering. In this layer, a pre-set pooling function is used to combine the outputs of neuron clusters in the previous layer into a single neuron to reduce the dimensions of the feature maps.

3. The Proposed NILM Algorithm

The overall framework of the proposed NILM method is shown in Figure 4. The aggregate power consumption information at T = t 1 , t 2 , , t n can be represented as a power sequence:
P a g g ( t ) = i = 1 N P i ( t ) + e ( t )
where n denotes the total number of sampling points; N represents types of loads according to the refinement level; P a g g ( t ) denotes the aggregate power sequence measured at the low-voltage side of the substation; e ( t ) is the aggregate measurement error; P i ( t ) is the power sequence of load type i, represented by:
P i ( t ) = { p i , 1 , p i , 2 , p i , n }
where p i , t denotes the power consumption of the ith type of load at sampling point t. By applying the proposed approach, the power consumption of the target load type can be directly predicted through the aggregate power sequence.
As presented in Figure 4, the overall load discompose procedure is as follows:
(1)
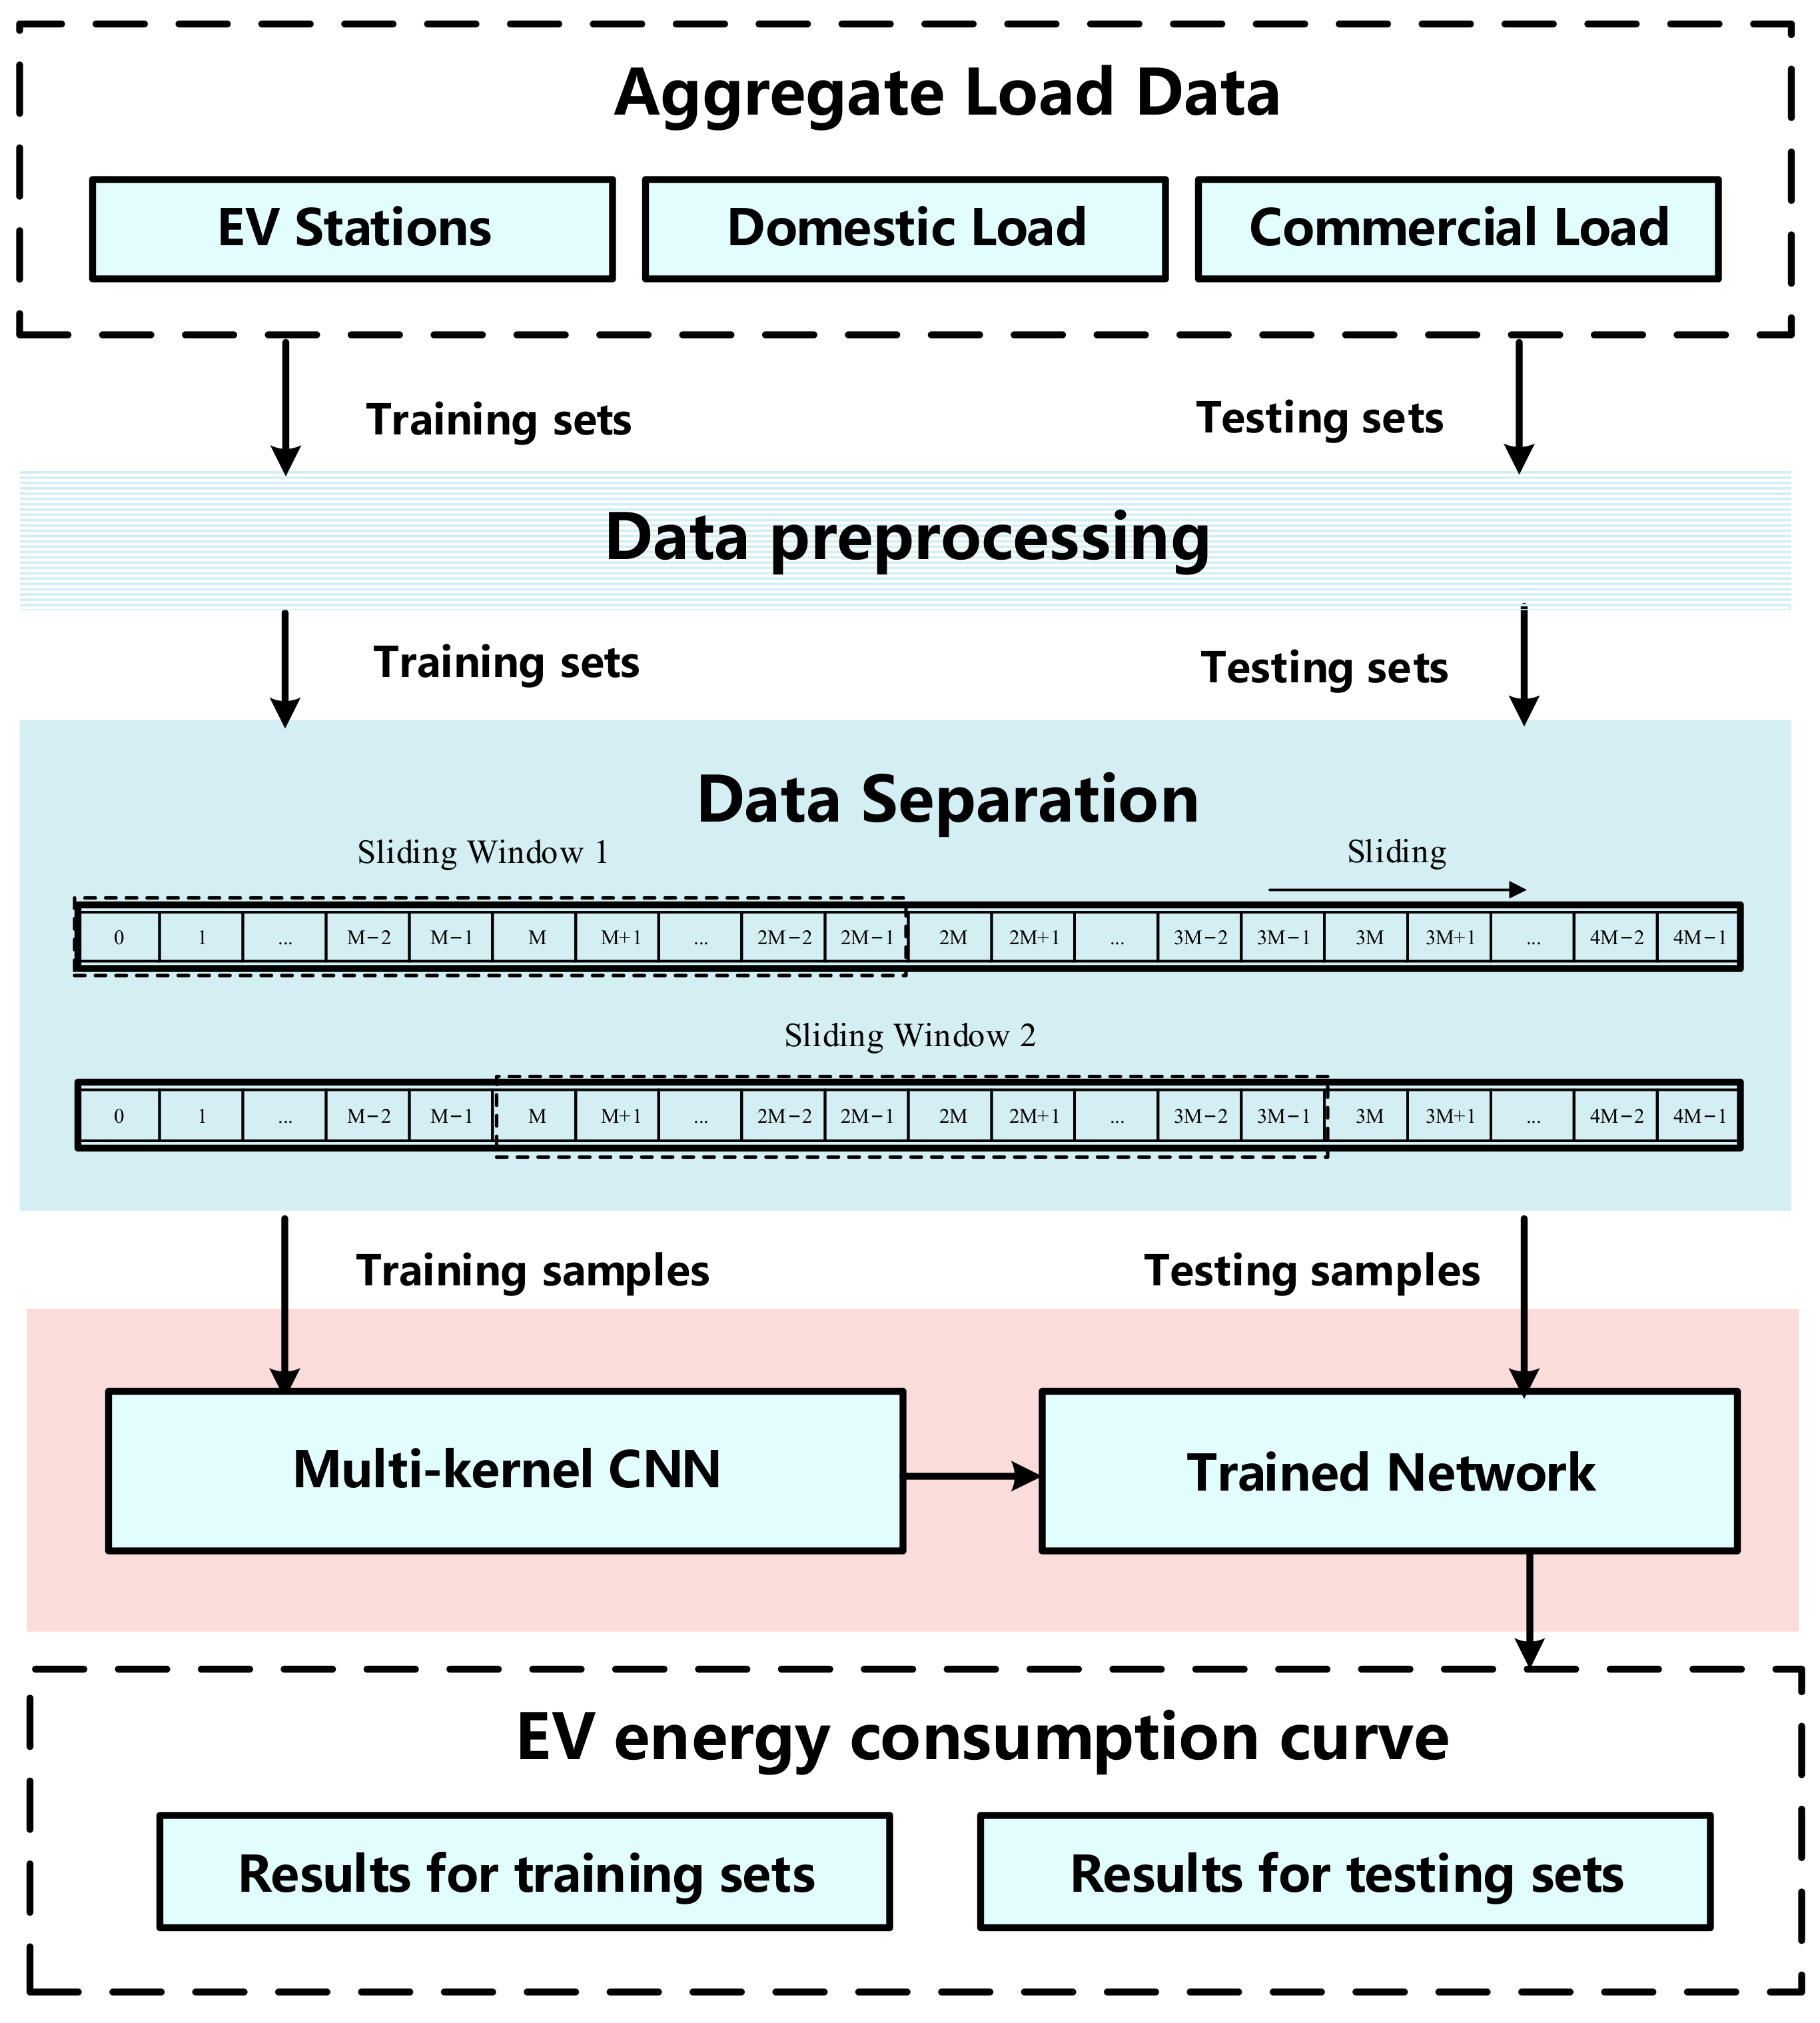
Step 1, the generation of self-organized datasets: To generate the self-organized datasets, first, the residual load data of different residential houses measured and recorded by Pecan Street datasets are combined and added to form the power sequences that contain the aggregate power consumption of an area and the power consumption of electrical vehicles. Then, the datasets are divided into training sets and testing sets.
(2)
Step 2, data processing: Remove noise and outliers in the raw dataset. Down-sample the self-organized datasets and segment using a sliding window method according to the fixed window length. Before segmenting the self-organized datasets using the sliding window approach with a fixed window length, the sampling rate is decreased to 0.5 Hz. Then, the processed training sets and testing sets are sent to the deep learning network.
(3)
Step 3, load disaggregation: The multi-kernel CNN is exploited to extract the load feature and calculate the power sequence of electric vehicles from the total load data. The input value of the network is total power consumption and the output value is the power sequence of electric vehicles.
The implementation of NILM requires effective load disaggregation techniques as well as the improvement of the applicability of the algorithm under complicated scenarios. On the one hand, the NILM framework needs to be improved, for instance, by utilizing different techniques for various scenarios. On the other hand, the NILM framework can benefit from research findings in areas such as mathematical optimization, pattern recognition, and other innovations in crucial technologies, and get around the drawbacks of different approaches.
The proposed approach employs a deep learning framework and a multi-kernel convolutional neural network framework is used. Three separate blocks with convolution kernels of different sizes work in parallel to form the multi-kernel CNN. These blocks are employed to extract local details and edge contour information of the input energy consumption data, respectively. The multi-channel information is then fused to produce more precise disaggregation load data for electric vehicles. The detailed framework of the multi-kernel CNN is displayed in Figure 5. The rectified linear units (ReLUs) serve as the activation functions, which can be represented as:
f ( x ) = max 0 , x

4. Case Study

To verify the performance of the proposed NILM algorithm, experiments are implemented using a 64-bit computer with 11th Gen Intel (R) Core (TM) i7-11700 CPU @ 2.50 GHz, 16G memory, and Intel (R) UHD Graphics 750. The residential power consumption information of Pecan Street is utilized and re-organized to simulate the total load condition at the substation side of an area with a high proportion injection of electric vehicle loads. Several evaluation metrics are employed to evaluate the classification performance and accuracy of the algorithm.

4.1. Data Pre-Processing

Data pre-processing is applied to improve the effectiveness of the training process of the proposed network. In order to remove the impact of different load scales, the power is mapped from −1 to 1 using the maximum minimum normalization method. Equation (7) displays the specific normalized calculation.
x n o r m = x x min x max x min
where x min and x max stand for the minimum and maximum values of the power sequence; x and x n o r m represent the power sequence before and after the normalization process, respectively.

4.2. Data Separation

The active power sequence of the low-frequency sampling data used for the NILM algorithm is typically extensive with a large number of sampling points. However, the length of the input sequence for deep learning models such as the multi-kernel CNN is limited and fixed in general. Therefore, it is necessary to segment the data using the sliding window method.
Figure 6 shows the process of the sliding windows algorithm. The setting of the window size depends on the operation characteristic of EV charging behaviors. In this study, the window size of the input data is set to 400.

4.3. Loss Function

This developed algorithm trains the network by minimizing the loss function, which is defined by mean square error (MSE). The specific function is given by:
M S E = 1 N t = 1 N p t p p r e d t 2
where p t is the ground truth value of power consumption at the (t)th sampling point; p p r e d t is the disaggregation value of power consumption at the (t)th sampling point computed by the NILM algorithm; N is total sampling points.

4.4. Evaluation Indicators

For the monitoring of the charging behavior of EVs, NILM can be considered as a classification task during residential energy consumption. The state of the EV stations is decided by comparing the ground truth power value and the pre-set threshold. For simplicity of expression, the metrics for evaluation of disaggregation performance are defined as follows.
  • True positive (TP): Both the result calculated by the algorithm and the ground truth value show the target appliance is in the “ON” state.
  • False positive (FP): The result calculated by the algorithm shows the target appliance is in the “ON” state, while the ground truth value shows the target appliance is in the “OFF” state.
  • True negative (TN): Both the result calculated by the algorithm and the ground truth value show the target appliance is in the “OFF” state.
  • False negative (FN): The result calculated by the algorithm shows the target appliance is in the “OFF” state, while the ground truth value shows the target appliance is in the “ON” state.
To verify the classification performance of the developed NILM algorithm, the experimental data are evaluated by four indicators given as follows:
P r e = T P T P + F P
R = T P T P + F N
A c c = T P + T F T P + T F + F N + F P
f 1 = 2 P r e * R P r e + R = 2 * T P 2 * T P + F N + F P
where P r e , R , A c c , and f 1 stands for precision, recall, accuracy, and f1 score, respectively. Recall and accuracy can be seen as intermediate metrics since a high score on one of them can still result in a low f1 score. F1 score reflects the network performance as a whole in terms of categorizing the “ON/OFF” state of the appliances.
Mean absolute error (MAE) is used to evaluate the temporal sequence of the disaggregation results to assess the correctness of the algorithm across time. It reflects the effectiveness of the load disaggregation method using more precise power deviations. MAE can be defined by:
M A E i = 1 N t = 1 N p t p p r e d t
where p t is the ground truth value of power consumption at the (t)th sampling point; p p r e d t is the disaggregation value of power consumption at the (t)th sampling point computed by the NILM algorithm; N is total sampling points.

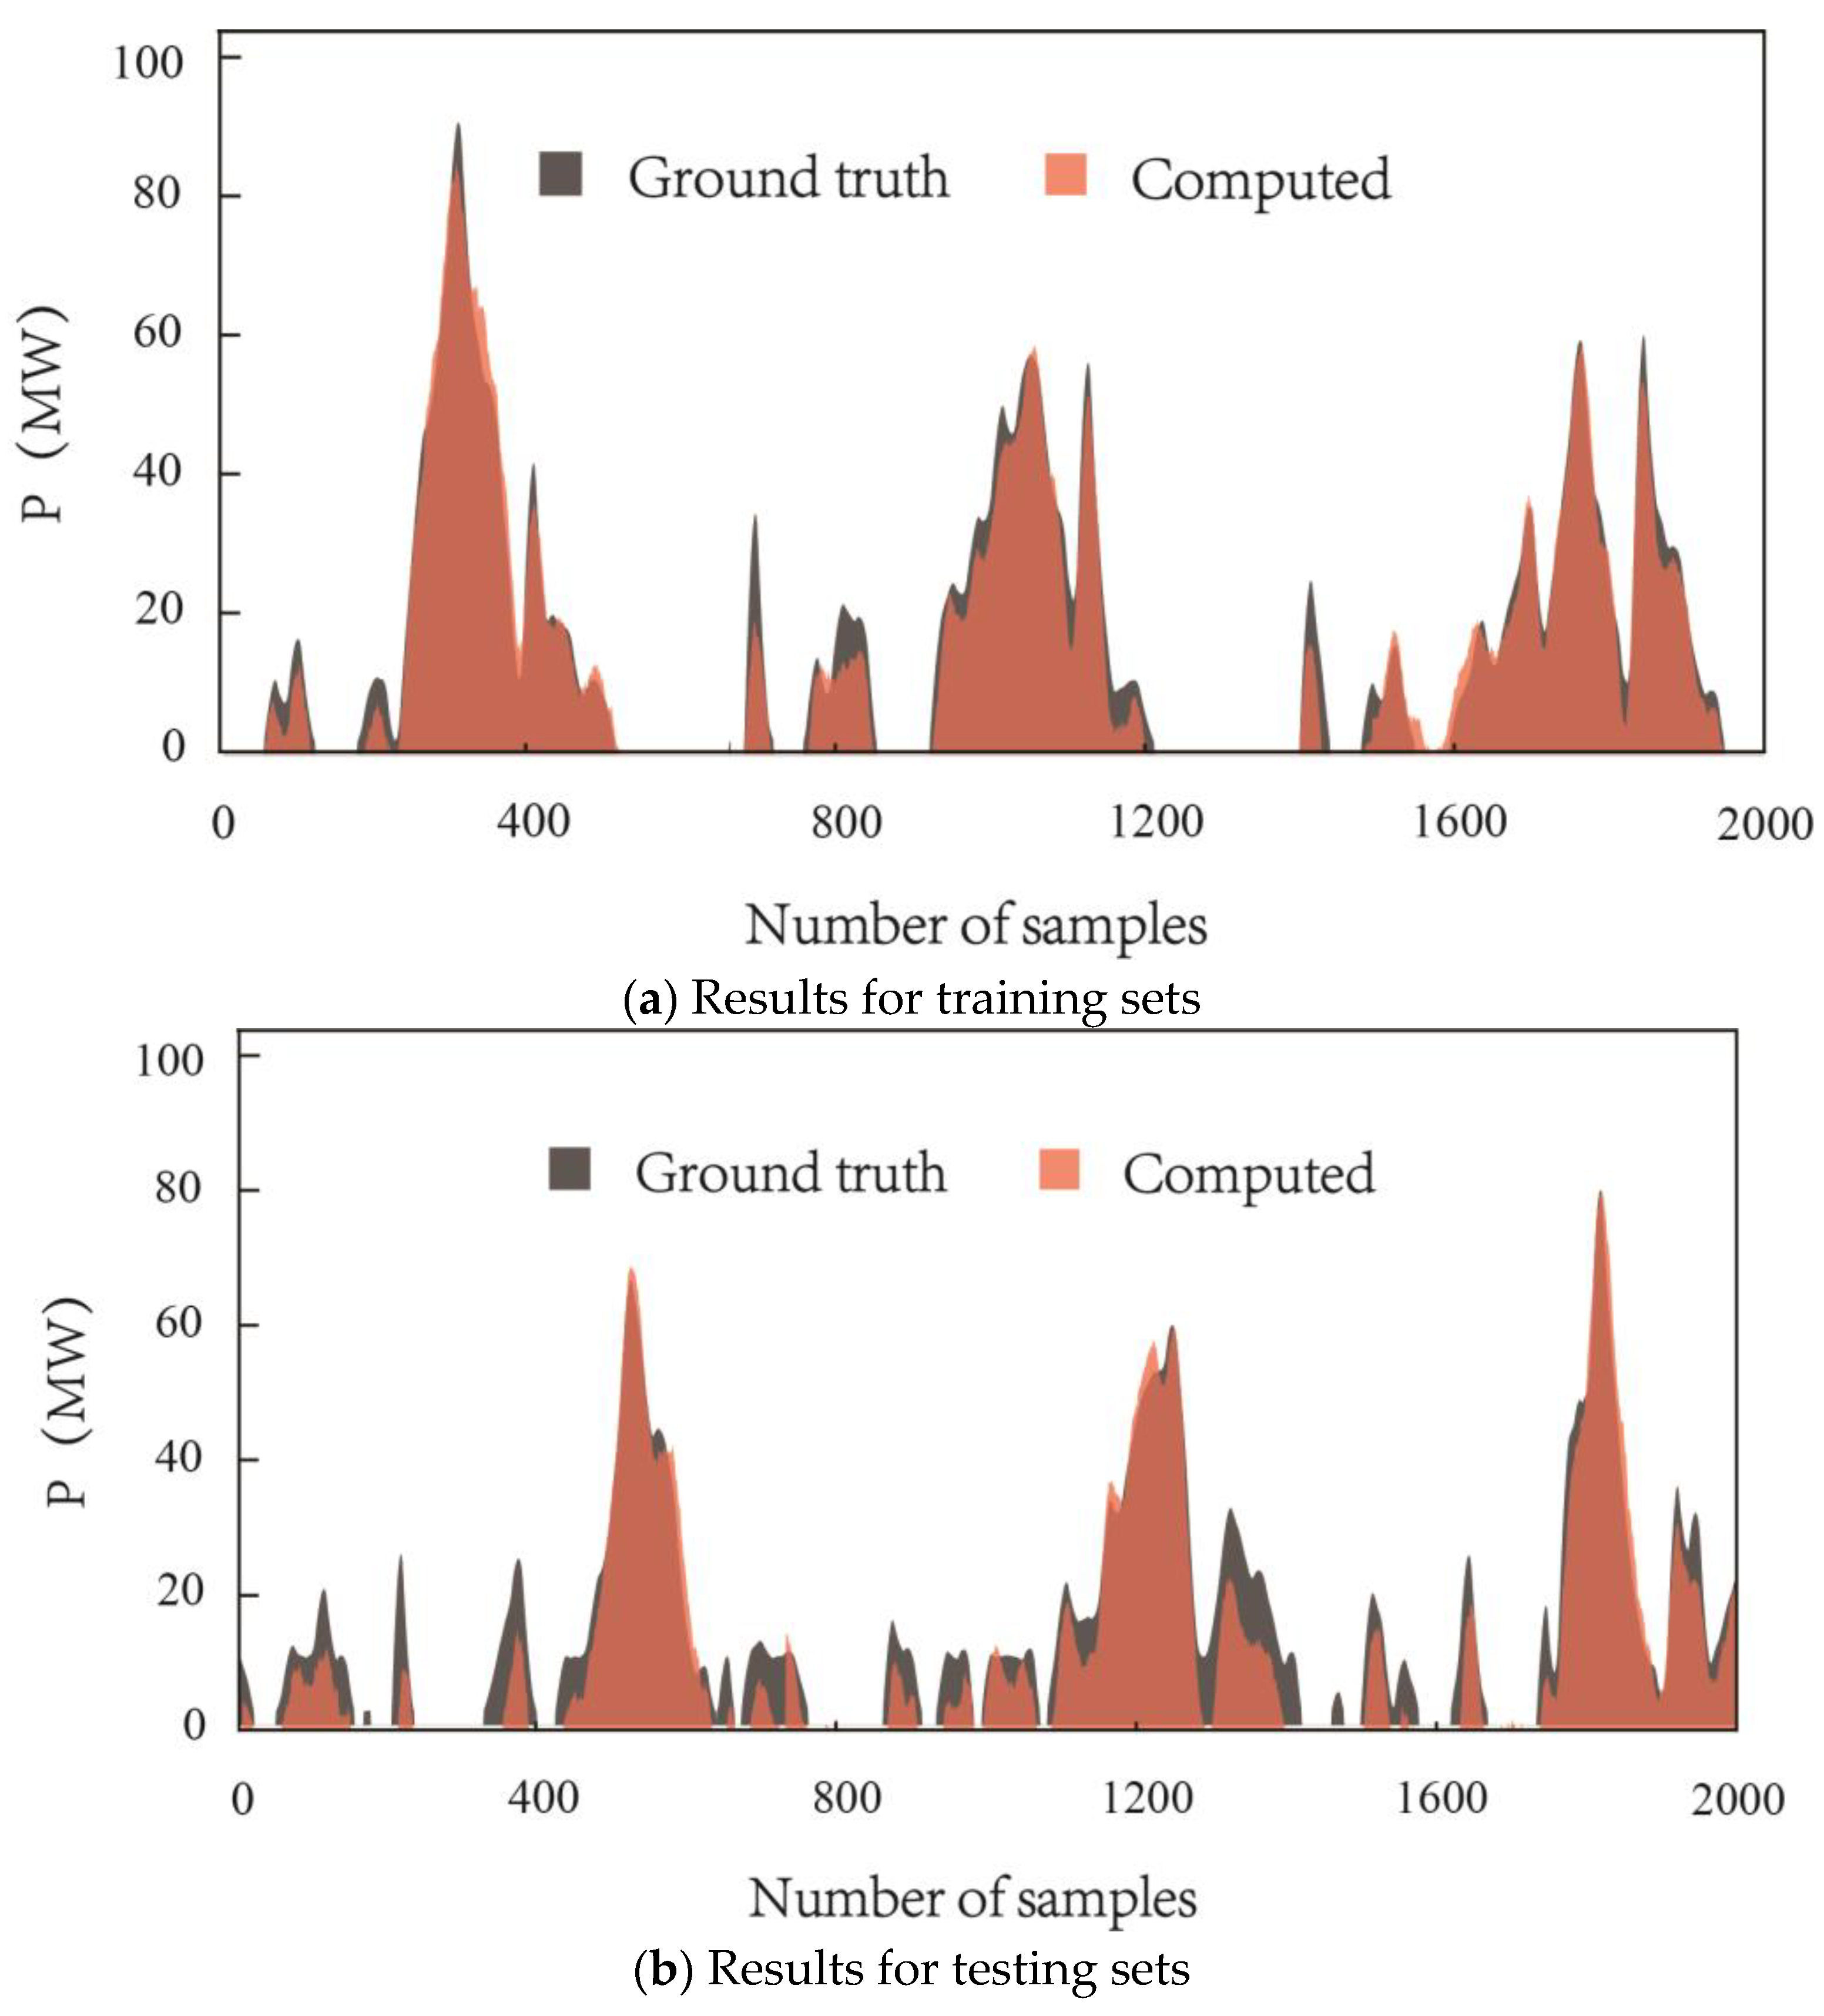
4.5. Experiments and Results

In this experimental part, residual load data of different houses measured and recorded by Pecan Street datasets are added and proportionally expanded to form the self-managed datasets that contain the aggregate power consumption of an area and the power consumption of electrical vehicles. The self-managed datasets simulate the load consumption condition at the substation stage of an area containing a high proportion of EV injection and the training sets and testing sets consist of different houses. The proposed NILM method is used to predict the power consumption series of electric vehicles using the aggregate load information.
To discuss the effectiveness of the proposed method, a case study based on self-organized datasets including electric vehicles generated from Pecan Street load data is presented. To generate the self-organized datasets, first, the residual load data of different residential houses measured and recorded by Pecan Street datasets are combined and added to form the power sequences that contain the aggregate power consumption of an area and the power consumption of electrical vehicles. Then, noise and outliers are removed from the raw dataset. The sampling rate of the self-organized datasets is reduced to 0.5 Hz and segmented using the sliding window method according to the fixed window length. After that, the datasets are divided into training sets and testing sets and sent to the deep learning network.
The proposed model is trained using the training set data, and the trained model is then used to disaggregate the test set data. To verify the performance of the developed NILM algorithm, the precision, recall, accuracy, f1 score, and mean absolute error are used to evaluate the classification performance and accuracy of the results. Figure 7 displays the output results of the proposed model.
The computed value displays the power sequence of electric vehicles discomposed by the proposed NILM model. The ground truth value of the target load is also shown in Figure 7 to more clearly demonstrate the load disaggregation capacity of the proposed model. It represents the real power consumption of electric vehicles recorded by measurement devices. The experimental results demonstrate that the suggested NILM algorithm is suitable for substation-level monitoring of the charging behavior of electric vehicles and has a good trend-tracking impact. It can also be seen from Figure 7 that the recognition accuracy of the developed algorithm is higher under heavy EV load than under light EV load conditions.
At the same time, the disaggregated load data can be utilized to calculate the aforementioned evaluation metrics to verify the performance of the non-intrusive load monitoring algorithm. Table 1 shows the comparison of Pre, R, Acc, f1, and MAE for the predicted value computed by the algorithm for the training sets and testing sets. From the results obtained, the efficiency of the model is verified. The obtained f1 score value is over 90% for both the training sets and testing sets, showing the effectiveness of the proposed method.
Compared with the NILM approach based on an RNN and factorial HMM proposed in [33], the model in this paper improves the load decomposition accuracy significantly. The accuracy for the selected appliances seen during training is 93.41%, improving 26.74% and 23.08% compared to the average accuracy score for the five selected appliances of the RNN-based method and factorial HMM-based method proposed in [33]. When compared to the accuracy for the selected appliances seen during testing, the average accuracy scores for the five selected appliances of the RNN-based method and the factorial HMM-based method provided in [33] have improved by 19.07% and 23.07%, respectively.

5. Conclusions

The charging behavior of distributed resources such as electric vehicles has resulted in significant load growth on the grid, leading to several issues including higher peak valley load differential and line flow violation. To enable the large-proportion injection of distributed energy resources, a NILM algorithm that can be used to monitor the charging behavior of electric vehicles at the substation level is proposed in this study. To create more accurate disaggregation load data for electric vehicles, a multi-kernel CNN is constructed employing three independent blocks with convolution kernels of different sizes that operate in parallel.
Experiments are implemented to verify the effectiveness of the developed method using self-organized datasets based on the aggregation of Pecan Street data. To generate the self-organized datasets, the residual load data of different residential houses measured and recorded by Pecan Street datasets are combined and added to form the power sequences that contain the aggregate power consumption of an area and the power consumption of electrical vehicles. The sampling rate of the self-organized datasets is reduced to 0.5 Hz and segmented using the sliding window method according to the fixed window length. The datasets are then divided into training sets and testing sets and sent to the deep learning network.
The multi-kernel CNN is exploited to extract the load feature and calculate the power sequence of electric vehicles from the total load data. The input value of the network is total power consumption and the output value is the power sequence of electric vehicles. Compared with the NILM approach based on an RNN and factorial hidden Markov model method, the model proposed in this paper improves the average load decomposition accuracy significantly, by 19.07% and 23.07%, respectively. The obtained f1 score is over 90% for both the training sets and testing sets, showing the effectiveness of the proposed method. The result shows that the proposed model is feasible for the load monitoring of electric vehicles at the substation level and can be used to obtain residential power information for the guidance of grid scheduling and dispatching.

Author Contributions

Conceptualization, Y.Y. and B.X.; methodology, Y.Z.; writing—original draft preparation, T.B.; writing—review and editing, P.W. All authors have read and agreed to the published version of the manuscript.

Funding

This research was funded by the Science and Technology Project of China Southern Power Grid Co., Ltd. (Item No.: 032000KK52220006(GDKJXM20220163)).

Institutional Review Board Statement

Not applicable.

Informed Consent Statement

Not applicable.

Data Availability Statement

Not applicable.

Conflicts of Interest

Y.Y., B.X. and Y.Z. are employees of Zhongshan Power Supply Bureau of Guangdong Power Grid Co., Ltd.; T.B. and P.W. are employees of Digital Grid Research Institute, China Southern Power Grid. The paper reflects the views of the scientists, and not the company. The authors declare no conflict of interest.

References

  1. Zhang, Y.; Meng, X.; Shotorbani, A.M.; Wang, L. Minimization of AC-DC Grid Transmission Loss and DC Voltage Deviation Using Adaptive Droop Control and Improved AC-DC Power Flow Algorithm. IEEE Trans. Power Syst. 2021, 36, 744–756. [Google Scholar] [CrossRef]
  2. Bu, F.; Ma, Z.; Yuan, Y.; Wang, Z. WECC composite load model parameter identification using evolutionary deep reinforcement learning. IEEE Trans. Smart Grid 2020, 11, 5407–5417. [Google Scholar] [CrossRef]
  3. Anwar, M.B.; Muratori, M.; Jadun, P.; Hale, E.; Bush, B.; Denholm, P.; Ma, O.; Podkaminer, K. Assessing the value of electric vehicle managed charging: A review of methodologies and results. Energy Environ. Sci. 2022, 15, 466–498. [Google Scholar] [CrossRef]
  4. Holtsmark, B. A comparison of the global warming effects of wood fuels and fossil fuels taking albedo into account. Gcb Bioenergy 2015, 7, 984–997. [Google Scholar] [CrossRef]
  5. Sayed, M.A.; Atallah, R.; Assi, C.; Debbabi, M. Electric vehicle attack impact on power grid operation. Int. J. Electr. Power Energy Syst. 2022, 137, 107784. [Google Scholar] [CrossRef]
  6. Hu, Q.; Han, R.; Quan, X.; Wu, Z.; Tang, C.; Li, W.; Wang, W. Grid-Forming Inverter Enabled Virtual Power Plants with Inertia Support Capability. IEEE Trans. Smart Grid 2022, 13, 4134–4143. [Google Scholar] [CrossRef]
  7. Hu, Q.; Guo, Z.; Li, F. Imitation Learning Based Fast Power System Production Cost Minimization Simulation. IEEE Trans. Power Syst. 2023, 3237398. [Google Scholar] [CrossRef]
  8. Afzalan, M.; Jazizadeh, F. Residential loads flexibility potential for demand response using energy consumption patterns and user segments. Appl. Energy 2019, 254, 113693. [Google Scholar] [CrossRef]
  9. Yang, D.; Gao, X.; Kong, L.; Pang, Y.; Zhou, B. An event-driven convolutional neural architecture for non-intrusive load monitoring of residential appliance. IEEE Trans. Consum. Electron. 2020, 66, 173–182. [Google Scholar] [CrossRef]
  10. Zafar, U.; Bayhan, S.; Sanfilippo, A. Home energy management system concepts, configurations, and technologies for the smart grid. IEEE Access 2020, 8, 119271–119286. [Google Scholar] [CrossRef]
  11. Li, Y.; Hu, Q.; Li, N. A reliability-aware multi-armed bandit approach to learn and select users in demand response. Automatica 2020, 119, 109015. [Google Scholar] [CrossRef]
  12. Zhang, Y.; Wang, L.; Li, W. Autonomous DC Line Power Flow Regulation Using Adaptive Droop Control in HVDC Grid. IEEE Trans. Power Deliv. 2021, 36, 3550–3560. [Google Scholar] [CrossRef]
  13. Weng, T.; Balaji, B.; Dutta, S.; Gupta, R.; Agarwal, Y. Managing plug-loads for demand response within buildings. In Proceedings of the Third ACM Workshop on Embedded Sensing Systems for Energy-Efficiency in Buildings, Seattle, WA, USA, 1 November 2011; pp. 13–18. [Google Scholar]
  14. Zhang, Y.; Shotorbani, A.M.; Wang, L.; Li, W. Distributed Voltage Regulation and Automatic Power Sharing in Multi-Terminal HVDC Grids. IEEE Trans. Power Syst. 2020, 35, 3739–3752. [Google Scholar] [CrossRef]
  15. Revuelta Herrero, J.; Lozano Murciego, Á.; López Barriuso, A.; Hernández de la Iglesia, D.; Villarrubia González, G.; Corchado Rodríguez, J.M.; Carreira, R. Non intrusive load monitoring (nilm): A state of the art. In Proceedings of the International Conference on Practical Applications of Agents and Multi-Agent Systems, Porto, Portugal, 21–23 June 2017; pp. 125–138. [Google Scholar]
  16. Hu, Q.; Liang, Y.; Ding, H.; Quan, X.; Wang, Q.; Bai, L. Topological partition based multi-energy flow calculation method for complex integrated energy systems. Energy 2022, 244, 123152. [Google Scholar] [CrossRef]
  17. Zheng, Z.; Sun, Z.; Pan, J.; Luo, X. An integrated smart home energy management model based on a pyramid taxonomy for residential houses with photovoltaic-battery systems. Appl. Energy 2021, 298, 117159. [Google Scholar] [CrossRef]
  18. Huber, P.; Calatroni, A.; Rumsch, A.; Paice, A. Review on deep neural networks applied to low-frequency nilm. Energies 2021, 14, 2390. [Google Scholar] [CrossRef]
  19. Hamid, O.; Barbarosou, M.; Papageorgas, P.; Prekas, K.; Salame, C. Automatic recognition of electric loads analyzing the characteristic parameters of the consumed electric power through a Non-Intrusive Monitoring methodology. Energy Procedia 2017, 119, 742–751. [Google Scholar] [CrossRef]
  20. Liu, B.; Luan, W.; Yu, Y. Dynamic time warping based non-intrusive load transient identification. Appl. Energy 2017, 195, 634–645. [Google Scholar] [CrossRef]
  21. Hart, G.W. Nonintrusive appliance load monitoring. Proc. IEEE 1992, 80, 1870–1891. [Google Scholar] [CrossRef]
  22. Pei, C.; Huiying, W.; Bin, Y.; Chuangxin, G.; Hengjun, Z. Research on smart demand side management system in low-carbon economy. Power Syst. Technol. 2012, 36, 11–16. [Google Scholar]
  23. Bonfigli, R.; Principi, E.; Fagiani, M.; Severini, M.; Squartini, S.; Piazza, F. Non-intrusive load monitoring by using active and reactive power in additive Factorial Hidden Markov Models. Appl. Energy 2017, 208, 1590–1607. [Google Scholar] [CrossRef]
  24. Kang, H.; Kim, H. Household appliance classification using lower odd-numbered harmonics and the bagging decision tree. IEEE Access 2020, 8, 55937–55952. [Google Scholar]
  25. Zoha, A.; Gluhak, A.; Nati, M.; Imran, M.A. Low-power appliance monitoring using factorial hidden markov models. In Proceedings of the 2013 IEEE Eighth International Conference on Intelligent Sensors, Sensor Networks and Information Processing, Melbourne, Australia, 2–5 April 2013; pp. 527–532. [Google Scholar]
  26. Kolter, J.Z.; Jaakkola, T. Approximate inference in additive factorial hmms with application to energy disaggregation. In Proceedings of the Artificial Intelligence and Statistics, La Palma, Canary Islands, Spain, 21–23 April 2012; pp. 1472–1482. [Google Scholar]
  27. Song, X.; Zhou, M.; Tu, J.; Li, G. Non-intrusive load monitoring method based on k-NN and kernel Fisher discriminant. Autom. Electr. Power Syst. 2018, 42, 73–80. [Google Scholar]
  28. Zhang, Y.; Shotorbani, A.M.; Wang, L.; Li, W. A Combined Hierarchical and Autonomous DC Grid Control for Proportional Power Sharing with Minimized Voltage Variation and Transmission Loss. IEEE Trans. Power Deliv. 2022, 37, 3213–3224. [Google Scholar] [CrossRef]
  29. Athanasiadis, C.; Doukas, D.; Papadopoulos, T.; Chrysopoulos, A. A scalable real-time non-intrusive load monitoring system for the estimation of household appliance power consumption. Energies 2021, 14, 767. [Google Scholar] [CrossRef]
  30. Fagiani, M.; Bonfigli, R.; Principi, E.; Squartini, S.; Mandolini, L. A non-intrusive load monitoring algorithm based on non-uniform sampling of power data and deep neural networks. Energies 2019, 12, 1371. [Google Scholar] [CrossRef]
  31. Chen, T.; Zhang, B.; Pourbabak, H.; Kavousi-Fard, A.; Su, W. Optimal Routing and Charging of an Electric Vehicle Fleet for High-Efficiency Dynamic Transit Systems. IEEE Trans. Smart Grid 2018, 9, 3563–3572. [Google Scholar] [CrossRef]
  32. Zhang, Y.; Shotorbani, A.M.; Wang, L.; Mohammadi-Ivatloo, B. Distributed secondary control of a micro grid with a generalized PI finite-time controller. IEEE Open Access J. Power Energy 2021, 8, 57–67. [Google Scholar] [CrossRef]
  33. Kelly, J.; Knottenbelt, W. Neural nilm: Deep neural networks applied to energy disaggregation. In Proceedings of the 2nd ACM International Conference on Embedded Systems for Energy-Efficient Built Environments, Seoul, Republic of Korea, 4–5 November 2015; pp. 55–64. [Google Scholar]
  34. Zhang, C.; Zhong, M.; Wang, Z.; Goddard, N.; Sutton, C. Sequence-to-point learning with neural networks for non-intrusive load monitoring. In Proceedings of the AAAI Conference on Artificial Intelligence, New Orleans, LA, USA, 2–7 February 2018. [Google Scholar]
  35. Hu, Q.; Li, F.; Chen, C.-f. A Smart Home Test Bed for Undergraduate Education to Bridge the Curriculum Gap from Traditional Power Systems to Modernized Smart Grids. IEEE Trans. Educ. 2015, 58, 32–38. [Google Scholar] [CrossRef]
Figure 1. Load Disaggregation at Substation Level.
Wevj 14 00051 g001
Figure 2. Fully Connected Neural Network Structure.
Wevj 14 00051 g002
Figure 3. Network structure of CNN.
Wevj 14 00051 g003
Figure 4. Overall Framework of The Proposed NILM Model.
Wevj 14 00051 g004
Figure 5. Detailed Framework of The Multi-kernel CNN.
Wevj 14 00051 g005
Figure 6. Sliding Windows.
Wevj 14 00051 g006
Figure 7. Comparison of The Ground Truth Power and Predicted Power of Four Devices.
Wevj 14 00051 g007
Table 1. Comparison of Pre, R, Acc, f1, and MAE.
Evaluation MetricsTraining SetsTesting Sets
P r e 0.97940.9983
R 0.90780.8292
A c c 0.93410.8706
f 1 0.94220.9059
M A E 2.67174.1587
Disclaimer/Publisher’s Note: The statements, opinions and data contained in all publications are solely those of the individual author(s) and contributor(s) and not of MDPI and/or the editor(s). MDPI and/or the editor(s) disclaim responsibility for any injury to people or property resulting from any ideas, methods, instructions or products referred to in the content.

