Abstract
Breaking the highly oil-dependent energy use structure in the transportation sector will be crucial for China to reduce its dependence on crude oil imports and ensure its energy security, and the development of new energy vehicles is helping to break this dilemma. A time series analysis summarizes the possible relationships between new energy vehicles and crude oil imports, i.e., new energy vehicles, as alternatives to fuel vehicles, will reduce the demand for oil in the transportation sector, which will in turn reduce crude oil imports, and crude oil prices and crude oil production will inhibit crude oil imports. In this empirical study, monthly data from 2015 to 2021 on crude oil imports, the market share of new energy vehicles, crude oil prices, and crude oil production are selected, time-series multiple regression modelling is adopted, and endogeneity is treated using a generalized method of moments (GMM). The regression results show that crude oil imports decrease by one unit for every 16.32% increase in crude oil prices, indicating that price factor is the most influential factor in China’s crude oil imports, while crude oil imports decrease by one unit for every 133.99% increase in crude oil production, indicating that an increase in crude oil production contributes less to the reduction of crude oil imports. One unit of crude oil imports is added for every 15.53% increase in the share of new energy vehicles, indicating that the effect of new energy vehicles on limiting crude oil imports has not yet emerged. Probably due to the fact that new energy vehicles have not yet had a significant impact on fuel vehicles, oil consumption will continue to increase in the short and medium term, with oil for the petrochemical industry becoming the primary driver of this increase. Finally, policy implications are provided from the perspective of crude oil demand, supply, and China’s oil price mechanism.
1. Introduction
Energy transition is the prominent feature of today’s global energy development, with new and renewable energy sources thriving and clean and low-carbon energy being the inevitable trend of global energy transition [1]. According to the World Energy Statistics Yearbook 2022 published by British Petroleum (BP) [2], renewable primary energy (including biofuels, but excluding hydropower) grew by 15%, up from 9% in 2020, and its growth rate exceeded that of any other fuel in 2021. However, the global energy transition will continue over a considerable historical period, with primary energy demand increasing by 5.8% in 2021, 1.3% above the 2019 level, and fossil fuels accounting for 82% of primary energy use, a slight decrease from 83% in 2019 and 85% five years ago. From the analysis of the development trend of the world energy consumption structure, the world energy system has gradually formed a “four-way” pattern of coal, oil, natural gas, and new energy sources, and in 2019, the proportion of these four in the world’s energy consumption structure was 27%, 33%, 24%, and 16%, respectively; however, oil and gas will remain the dominant energy sources for a long period of time [3]. As a result of the rapid rise of emerging economies such as China and India, the Asia–Pacific region is leading the growth of world oil demand, and three major oil and gas consumption centers have emerged in North America, Asia–Pacific, and Europe [4].
China’s “coal-rich, oil-poor and gas-poor” energy production structure has persisted for a long time, while the latter two account for a relatively high proportion of consumption, resulting in a severe mismatch between the energy production and consumption structures, which hinders the transformation of China’s energy structure. According to the China Statistical Yearbook 2021 and the Statistical Bulletin of National Economic and Social Development in 2021, coal, crude oil, and natural gas consumption accounted for approximately 56%, 22%, and 11%, respectively, of the 5.24 billion tons of standard coal consumed in the year. Oil is known as the “blood” of industry and is an indispensable resource for economic and social development, and China has become the world’s second-largest crude oil consumer and the first-largest crude oil importer, with a crude oil dependence of up to 70%, and crude oil consumption mainly dependent on imports. With the sharp rise in energy geopolitical risks, the risk of uncertainty in the international market is transmitted to the domestic market through trade [5], affecting China’s crude oil security, which in turn affects the real economy in many ways [6]. Consequently, alleviating the status quo of excessive external dependence on oil and gas is the most urgent major strategic task at present [7]. The energy transition of the automotive industry, which is highly sensitive to oil prices and has the highest demand for oil, will help reduce the industry’s dependence on crude oil [8].
Transportation is one of the major energy-consuming sectors, and China’s transportation demand is dominated by road traffic, and the energy use structure is highly oil-dependent, with more than 50% of oil consumed by the transportation sector; in terms of energy use structure, the share of oil products in the transportation sector’s energy consumption is nearly 86%, with road traffic oil (gasoline and diesel) accounting for more than 80% [9]. Currently, new energy vehicles consist of pure electric vehicles, plug-in hybrid vehicles, and fuel cell vehicles powered by non-conventional fuels as energy sources. As an effective alternative to conventional fuel vehicles, the development of new energy vehicles has become a national strategy and the Action Plan to Reach the Carbon Peak by 2030 proposes to accelerate the development of new energy vehicles and gradually reduce the proportion of conventional fuel vehicles in new vehicle production and sales and vehicle ownership, as well as to “ensure that the growth of carbon emissions in the transport sector remains within a reasonable range”, and it is proposed to implement green and low-carbon initiatives and to work toward achieving the peak of oil consumption in surface transport by 2030 [10]. Under the current power structure dominated by coal power, new energy vehicles can still achieve a carbon reduction of about 25% relative to fuel vehicles, and with future renewable energy generation and clean coal power generation new energy vehicles will help to achieve low-carbon transportation at the whole life-cycle basis. Clearly, new energy vehicles play a significant role in energy substitution. Kester et al. (2020) reveal that public awareness and acceptance of new energy vehicles can reduce their dependence on oil [11]. The current rapid increase in the production and sales of new energy vehicles in China reflects the gradual increase in consumer acceptance of new energy vehicles and, therefore, the reduction in consumer sensitivity to oil prices. According to the Chinese Society of Automotive Engineering, global sales of new energy vehicles exceeded 6.5 million units in major countries in 2021, with China’s sales reaching 3.521 million units, accounting for 13.4% of new vehicle sales in China. The cumulative global sales of new energy vehicles exceeded 16 million units by the end of 2021, with China accounting for more than 50% of the total, and the global new energy vehicle industry is developing significantly and has become a new growth point for the global economy.
The current demand for crude oil continues to grow, and the issue of excessive dependence on crude oil imports persists. Meanwhile, the development of new energy vehicles is bound to continue to accelerate, as a result of policies, changes in consumer demand, technological advancements, etc., and energy transition. This study aims to investigate whether the rapid development of new energy vehicles has already reduced China’s crude oil imports, thereby reducing the external dependence on crude oil.
2. Literature Review
As a key component of China’s Dual Carbon Policy in the transportation sector, the development of new energy vehicles is crucial for promoting the transition from oil consumption to clean energy and reducing foreign dependence on crude oil. Crude oil import dependence refers to the ratio of net crude oil imports to domestic crude oil consumption, which reflects China’s dependence on foreign crude oil and which is an important indicator of crude oil security [12]. Wang et al. (2018) used NMGM-ARIMA to forecast China’s foreign oil dependence from 2017 to 2030 in two dimensions, concluding that China’s foreign oil dependence will rise from 65% in 2016 to over 80% in 2030, requiring adjustments to the energy mix in sectors such as transportation [13]. Zhang (2013) decomposed the factors affecting oil import dependence into net oil imports and oil consumption, where the factors affecting the former are the amount of domestic oil production and world oil trade, and the factors affecting the latter are the stage of economic development, oil efficiency, and energy consumption structure, based on which the oil dependence was predicted [14]. For the impact of oil price changes, Shi (2000) found that oil price increases triggered a series of commodity price increases, but produced different impacts and consequences, in which the transportation sector shifted the burden to consumers and other production sectors after raising prices in response to rising costs [15]. Liu (2017) argues that international oil price risk transmission can affect not only the Chinese auto industry as a whole via transmission within the oil chain industries and related industries affected by oil prices, but also within the national economy, influencing the demand structure and subsequently the auto market [16]. Tan et al. (2019) demonstrated that, compared to auctioned quotas, the fuel tax results in greater car sales and higher social welfare. However, due to the continued increase in oil prices in the international market, a further increase in the fuel tax would reduce the demand for private automobiles, which would have a negative impact on economic growth [17].
For the impact of the transportation sector on energy, Yin et al. (2010) argue that the rapid growth of automobile sales and ownership will greatly stimulate China’s oil consumption demand, while excessive foreign dependence will make China’s oil security situation more severe, and they propose to improve the energy efficiency of traditional automobiles and vigorously develop new energy vehicles [18]. Wang et al. (2017) conducted a scenario analysis of energy consumption and CO2 reduction in China’s transportation sector, using different scenarios to examine the relative impacts of improving vehicle energy efficiency, promoting the use of electric vehicles, and increasing fossil fuel and CO2 taxes, suggesting that the Chinese government should improve vehicle fuel economy standards, promote electric vehicle technology advancement and market expansion of electric vehicles, and increase tax rates on conventional transportation energy and CO2, which will help reduce energy consumption and achieve peak CO2 emissions from China’s transportation sector as soon as possible [19]. Sheldon and Dua (2020) used the choice model to predict PEV market share under various subsidy scenarios, and the results showed PEVs have improved China’s new vehicle fleet fuel economy by roughly 2%, reducing total gasoline consumption by roughly 6.66 billion liters. However, the current PEV subsidy is expensive due to the influence of non-additional PEV purchasers, especially high-income consumers [20]. Woodmac’s study “Six themes that will determine the international oil market by 2035” also proposes that oil for transportation will determine the peak of oil demand, and the rapid development of new energy vehicles such as electric vehicles will have an impact on oil demand [21]. Bansal and Dua (2022) estimated the responsiveness of new car buyers in China and India to various fuel economy policies including income, as well as the potential for a rebound effect and the effectiveness of a feebate policy. Conditional on the purchase of a new car, fuel consumption in both markets was found to be relatively unresponsive to fuel price and income, which may mean that more effective policies may be needed to mitigate the environmental and energy impacts of the auto industry [22].
The current market share of new energy vehicles is increasing, which will reduce the demand for oil in the transportation sector and encourage the conversion of consumer demand from fuel cars to new energy vehicles; crude oil prices will have a direct impact on crude oil imports, essentially because crude oil prices affect crude oil demand in transportation, chemical and other industries, while domestic crude oil production and crude oil imports will cover crude oil demand, so domestic crude oil production is also a possible influencing factor for crude oil imports. Previous studies on crude oil imports focused mostly on predicting crude oil dependence, and the measurement of factors affecting crude oil dependence was more macro, with no specific analysis of the impact of crude oil consumption sectors on crude oil imports. In addition, the majority of studies on the impact of the transportation sector on energy consumption were qualitative or based on scenario analysis; fewer studies use empirical methods to analyze the impact of changes in the transportation sector, such as the development of new energy vehicles, on crude oil imports. This paper will use an empirical method to analyze quantitatively the impact of the development of new energy vehicles on China’s crude oil imports, taking international crude oil prices and domestic crude oil production into account.
3. Materials and Methods
3.1. Variable Selection and Data Sources
According to the above analysis, China’s crude oil production, the international crude oil price, and the development of new energy vehicles are selected as explanatory variables, and China’s crude oil imports are used as the response variable, with emphasis on analyzing the impact of the development of new energy vehicles and selecting specific indicators based on the principles of data representativeness, availability, and scientificity.
For the selection of indicators to measure the development of new energy vehicles, car ownership and new energy vehicle ownership are more indicative of China’s automotive oil consumption than sales data, which include export data, unregistered data, etc., some of which do not directly consume China’s refined oil products. However, car ownership data are only available on an annual basis, which is too infrequent, and there is a strong consistency in the trends of the sales and ownership indicators, as shown in Figure 1. Sales data were therefore used instead of car ownership data, and the new energy vehicle market share, that is, new energy car sales divided by car sales, was used to represent the development of new energy vehicles. According to the China Association of Automobile Manufacturers, the sales volumes in 2014 and 2015 were 75,000 and 331,000 vehicles, respectively, and the compound annual growth rate of China’s new energy vehicle sales from 2015 to 2021 was higher than 40%. The period span was chosen as 2015–2021, the frequency was monthly data, and the ratio of monthly car and new energy vehicle sales in China was used to represent China’s new energy vehicle development pattern at different points in time.
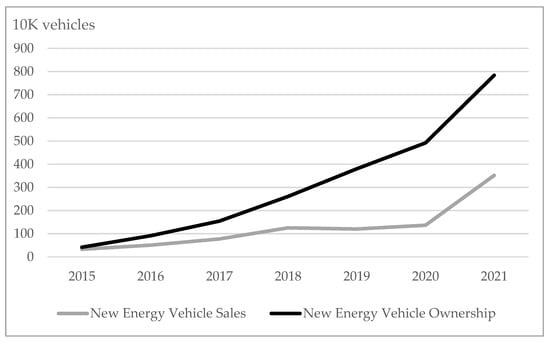
Figure 1.
Trends in Sales and Ownership Indicators.
The West Texas Intermediate (WTI) crude oil price, one of the three largest in the world crude oil market, was selected to represent the international crude oil price and the data were obtained from the website of Investing.com. Since the monthly data are only the closing price of the last trading day, it is not possible to measure the price situation of the month. Therefore, the daily crude oil data were collected and converted into the price denominated in CNY by using the data of the exchange rate between USD and CNY published by the China Foreign Exchange Trade Center, and the arithmetic average of the crude oil price transaction of the month was used to replace the crude oil price for that month. Data on crude oil imports and production are obtained from the monthly volume and value tables of imports of major commodities of the General Administration of Customs of the People’s Republic of China and production data of industrial products from the National Bureau of Statistics, respectively, for each year, with 10,000 tons as the unit.
3.2. Time Series Smoothness Test
The graphs of the time series of each data reveal that crude oil imports, automobile sales, and new energy vehicle sales are increasing, while the growth rate of crude oil imports is gradually decreasing. Therefore, taking the logarithm of each data, the coefficient of each explanatory variable measures the effect of the percentage change in the explanatory variable on the percentage change in the explained variable, i.e., elasticity. In Figure 2, there is a clear upward trend in the logarithmic market share of new energy vehicles over time.
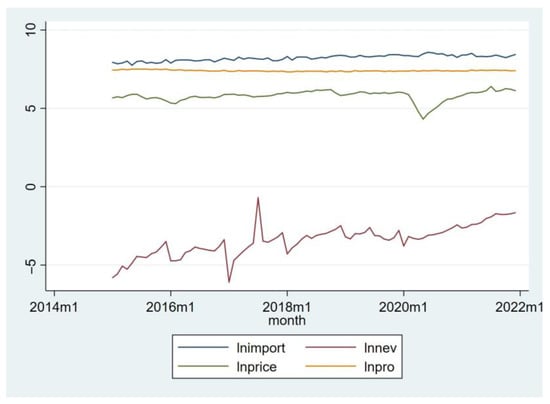
Figure 2.
Time trends of the logarithmic values of the variables.
As suggested by Schwert (1989) [23], the ADF test was further performed (Table 1) on the logarithmic values of each variable with lag order Pmax = [12 − (T/100)1/4] = 11.49, taking Pmax = 11 and sequentially making p = 10, 9, … until the lag order is 5, the last order lag term (L2D.) is significantly non-zero and the ADF statistic Z(t) = −3.610 < −3.469, and the null hypothesis is at 5% level of significance, i.e., the logarithm of the new energy vehicle market share is considered to contain no unit root and to be a smooth time series. The ADFs of crude oil imports, crude oil prices, and crude oil production are similarly smooth time series and meet the prerequisites for time series multiple regression analyses.

Table 1.
Logarithmic ADF test for the market share of new energy vehicles.
3.3. Multiple Linear Regression Modeling
The regression equation is as follows.
The variables are described as Table 2.
Table 2.
Description of model variables.
Based on the analysis in the introductory section, the paper makes the following hypotheses.
Hypothesis 1.
The higher the market share of new energy vehicles, the lower the crude oil imports.
Hypothesis 2.
The higher the crude oil production, the lower the crude oil imports.
Hypothesis 3.
The higher the price of crude oil, the lower the volume of crude oil imports.
4. Result and Discussion
4.1. Time Series Analysis
We calculate the total amount of crude oil imports, production, new energy vehicle sales, and car sales in each month of each year, and use (the total annual sales of new energy vehicles)/(total annual sales of cars) as the market share of new energy vehicles in that year, and the average of crude oil prices in each month as the crude oil price in that year, and calculate the average compound annual growth rate for 2015–2021, 2015–2018, and 2019–2021, respectively, and 2020–2021 year-on-year growth rate (Table 3).
Table 3.
Annual values of the variables and the compound annual growth rate over time.
Table 3.
Annual values of the variables and the compound annual growth rate over time.
| import | nev | price | pro | |
|---|---|---|---|---|
| 2015 | 33,549.00 | 1.25% | 303.15 | 21,393.80 |
| 2016 | 38,104.00 | 1.79% | 284.23 | 19,957.80 |
| 2017 | 41,394.70 | 2.65% | 343.75 | 19,190.80 |
| 2018 | 46,399.40 | 4.44% | 428.69 | 18,863.90 |
| 2019 | 50,588.70 | 4.68% | 392.93 | 19,126.70 |
| 2020 | 54,240.00 | 5.22% | 220.08 | 19,499.10 |
| 2021 | 51,323.80 | 13.43% | 449.41 | 19,939.40 |
| CAGR for 2015–2021 | 6.26% | 40.36% | 5.79% | −1.00% |
| CAGR for 2015–2018 | 8.44% | 37.25% | 9.05% | −3.10% |
| CAGR for 2019–2021 | 0.48% | 42.06% | 4.58% | 1.40% |
| Year-on-year growth rate 2020–2021 | −5.38% | 156.97% | 104.20% | 2.26% |
Note: Since the data for each year are calculated from monthly data, there may be errors with the officially published annual data. The images of each time series are shown in Figure 3.
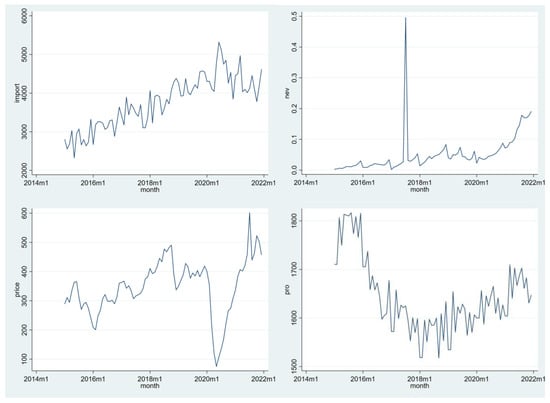
Figure 3.
Images of each time series.
Oil price growth has slowed slightly in recent years, with crude oil prices freezing in June 2020, primarily due to the impact of COVID-19 on global oil demand, with crude oil prices continuing to rise from July 2020 and rebounding to pre-epidemic levels in early 2021. With the recovery in global economic activity and a strong recovery in crude oil demand, coupled with the fact that OPEC+ still maintains its massive production cuts, the crude oil market generally maintains an oversupply situation, driving oil prices to continue to rise and somewhat limiting consumer demand for fuel vehicles.
Crude oil production as a whole showed a Smiling Curve of the first decrease and then increase, and the production growth rate turned from negative to positive in 2019, mainly due to the government’s promotion of the “2019–2025 Domestic Exploration and Production Accelerated Development Planning Program” in early 2019. Major oil state-owned enterprises expanded their investments in oil exploration and development, with PetroChina and Sinopec cooperating on oil storage and production. In addition, international oil development cooperation achieved a significant advancement.
The market share of new energy vehicles has increased rapidly over the past seven years, with a compound annual growth rate of over 40%. This is due to the factors such as national policy direction, investment and innovation by vehicle enterprises, and increased consumer recognition. The preferential policies for new energy vehicles in major cities at the early stage of development and the various restrictions on fuel vehicles have led to an increase in the number of consumers opting for new energy vehicles, and as the performance of new energy vehicles continues to improve, so has the consumers’ willingness to purchase. The data for January 2017 showed an obvious anomaly, which was mainly due to the expiration of the initial subsidy scheme for new energy vehicles at the end of 2016. Later, when the provinces and municipalities introduced new policies for subsidizing new energy vehicles, the market for new energy vehicles began to revive.
Additionally, the market share growth rate of the new energy vehicles in 2019 slowed significantly, with a growth rate of only about 5%. Table 4 illustrates that both auto sales and new energy vehicle sales decelerated, and the former sales decelerated more. All automobile-related industries were experiencing various degrees of hardship in 2019. Additionally, from a macro-economic standpoint, China’s GDP growth rate had decreased since the beginning of 2018. Downward pressure on the economy led to a decline in employment and income for the low-income consumers, which dampened their demand for automobiles. From a policy perspective, China VI vehicle emission standards rigorously regulated the control of pollutant emissions, and restricted the manufacturing and sale of automobiles.
Table 4.
Year-on-Year Growth Rates for Automobile-Related Indicators.
With the main outbreak of new energy vehicles in 2021, sales increased by nearly 160% year on year, ending three consecutive years of negative auto sales growth. China’s new energy vehicles are gradually getting rid of policy subsidy dependence and increasing marketization. From the policy perspective, the proposal of carbon neutrality and the “New Energy Vehicle Industry Development Plan (2021–2035)” point to the direction for the development of new energy vehicles in China. From the supply side, traditional independent car companies, new car makers, and joint venture brands have entered the new energy vehicle market to intensify competition and promote the overall performance and function iteration of new energy vehicles. From the consumer side, the consumer demand continues to expand, there is a huge market space for “second cars” for urban families, and new energy vehicles continue to penetrate lower-tier cities and rural areas, all of which have contributed to the rapid growth of new energy vehicle sales. On the other hand, the rebound of crude oil prices at the bottom of early 2021 and their rapid rise may have contributed to a certain extent to consumers choosing new energy vehicles over fuel vehicles.
Crude oil imports in 2015–2020 were on an overall upward trend, with the growth rate decreasing for the first time in 2021, and the increase in the last seven years is mainly contributed by the growth in 2015–2018. The growth of crude oil imports has slowed in recent years, and from Figure 3 and Table 3 it can be roughly inferred that because of the surge in oil prices in 2021 or the surge in sales of new energy vehicles, the compound annual growth rate from 2019 to 2021 and year-on-year growth rate between 2020 and 2021 of crude oil imports decreased faster. However, based on the historical data, even though the development of new energy vehicles maintains a high growth rate, the inhibiting effect on crude oil imports is not obvious, and the impact of crude oil production cannot be derived and needs to be further verified by the model.
4.2. Model Testing
For the test of autocorrelation, the results of the Breusch–Godfrey Test show the presence of first-order autocorrelation in the perturbation term. For the test of heteroskedasticity, the White test concluded that there was no heteroskedasticity.
For the endogeneity issue, this paper selects the indicator of the degree of development of new energy vehicles, which is expressed by new energy vehicle sales/vehicle sales, i.e., only the consumption of oil by vehicles is considered. We think it omitted other consumption channels such as industrial oil, and crude oil price, crude oil production, and the development level of new energy vehicles may all be related to it, resulting in endogenous. Since the data are in time series, we choose the lagged variables of these three explanatory variables as instrumental variables to conduct endogeneity tests, respectively, and all of them are tested to be not weak instrumental variables and satisfy the correlation conditions of instrumental variables. The original hypothesis is that “all explanatory variables are exogenous”. In light of the fact that the traditional Hausman test does not hold in the case of heteroskedasticity, the DWH test for heteroskedasticity is conducted. The test results show that at 5% significance level, both crude oil price and crude oil production significantly accept the null hypothesis, i.e., neither is an endogenous explanatory variable, while (new energy vehicle sales)/(car sales) rejects the null hypothesis and is considered endogenous explanatory variables, and all three are not endogenous explanatory variables at 1% significance level.
Due to the presence of serial correlation, generalized method of moments (GMM) is more efficient than 2SLS, and GMM remains robust and optimal under heteroskedasticity.
4.3. Regression Results and Analysis
The results obtained by GMM are shown in Table 5. The value obtained from the Wald test is 217.17, which is much greater than the critical value, with a confidence interval of 95% and a p-value of 0. Therefore, the model holds significantly.
Table 5.
GMM results.
Analyzing the coefficients, the coefficient of is −0.1632, which means that the volume of crude oil imports decreases by one unit for every 16.32% increase in crude oil price, i.e., the higher the crude oil price, the lower the volume of crude oil imports. This is consistent with Hypothesis 3, and the volume of crude oil imports is more sensitive to crude oil price; the coefficient of is −1.3399, which means that the volume of crude oil imports decreases by one unit for every 133.99% increase in crude oil production. It means that the higher the crude oil production, the lower the crude oil imports, which is consistent with Hypothesis 2, and the sensitivity of crude oil imports to crude oil prices is low; the coefficient of is 0.1553, which means that the larger the share of new energy vehicles, the higher the crude oil imports, which is inconsistent with Hypothesis 1.
Moreover, the regression results of the relationship between new energy vehicle market share and crude oil prices are as follows in Table 6. The coefficient of the price factor is positive and statistically significant, but it can only explain 7.56% of the change in the market share of new energy vehicles. Therefore, it can be concluded that the role of crude oil prices in increasing the market share of new energy vehicles by suppressing the demand for fuel vehicles and increasing the demand for new energy vehicles is, relatively, smaller, while the direct influence of crude oil prices on crude oil imports accounts for a larger proportion. The direct effect of crude oil prices on crude oil imports is substantially larger.
Table 6.
New Energy Vehicle Market Share and Crude Oil Price Regression Results.
In conclusion, it can be seen that the price is the most influential factor affecting China’s crude oil imports, that crude oil production still needs to be improved, which contributes less to the reduction of crude oil imports, and that the effect of new energy vehicles on limiting crude oil imports has yet to be seen; that is, the empirical results contradict the assumptions and findings made by theoretical inferences. Despite their rapid development in recent years, China’s new energy vehicles have not yet contributed to a reduction in the country’s dependence on crude oil imports. In the following, we provide some explanation for why the coefficient is positive.
Firstly, the impact of new energy vehicles on fuel vehicles has not yet been substantial. Although the current development of new energy vehicles is rapid, the market share is still less than 15% and the transportation sector’s energy use structure remains highly dependent on oil. From a technology and performance perspective, it is still in the period of new energy vehicle technology change. Plug-in hybrid vehicles, which account for nearly 20% of new energy vehicle sales, continue to consume a portion of gasoline, while hydrogen fuel vehicles are still at the stage of technological breakthroughs. The current electric car does not fully cover all the good basic characteristics of fuel cars, and the new energy vehicle battery life and charging experience have more room for improvement. Additionally, the research and development of hydrogen fuel cell vehicles, the development of intelligent vehicles and the layout of charging piles all rely on the supply-side policy to some extent. For example, whether new energy vehicles can replace fuel cars faster may depend on supply-side policies such as fuel tax and auction quota. From a cost perspective, the continuous rise in fuel prices directly pushed up the cost of fuel vehicles for daily commuting, and as a result of the impact of the sharp rise in raw material prices and national subsidies many new energy vehicle brands announced price increases, affecting consumer choice.
Secondly, oil consumption will continue to increase in the short to medium term, with petrochemical oil serving as the primary driver of this increase. China’s refining industry is robust, but the refining industrial structure is not reasonable enough. The capacity utilization is less than 80%, and there is a serious surplus, mainly because the growth rate of China’s refined oil consumption is decelerating while capacity expansion is still accelerating. As China’s transportation oil and refined oil demand gradually reach their peak, chemical oil will become the main factor to promote the continued growth of oil consumption, which is to “reduce oil and increase chemical”. In summary, it is expected that the new energy transition in the transportation sector will slow the growth rate of crude oil consumption to some extent, but oil consumption will still increase in the short to medium term, and future oil demand will gradually shift to other sectors dominated by petrochemicals.
5. Conclusions
From the demand side, the development of new energy vehicles in the transportation sector is gradually entering the market-oriented stage as a result of policy pull. However, the “New Energy Vehicle Industry Development Plan (2021–2035)” and the launch of China’s Dual Carbon Policy show that China continues to view new energy vehicles as an important strategy for carbon neutrality in the transportation sector. The solution to the key bottleneck that impedes the development of new energy vehicles will play a crucial role in breaking the highly oil-dependent energy structure and accelerating energy transition. On the one hand, in the future, the interaction between renewable energy power and new energy vehicle network will help the zero-carbon development of new energy vehicles from the whole lifecycle level, which urgently need to establish an intelligent active charging pile system to solve the difficult charging problem. With the deep vehicle network interaction, new energy vehicles, through two-way charging and discharging, will bring more economic benefits for families and even society [24]. On the other hand, the solution to key issues, such as the technological breakthrough of hydrogen fuel vehicles, will usher in a greater sales explosion in the future, and the energy structure within new energy vehicles will be more low-carbon, thereby fostering their growth. New energy vehicles’ contribution to reducing China’s dependence on crude oil imports will gradually increase as their market share increases. Both aspects must learn from the development path of new energy vehicles and increase marketization gradually through policy guidance and market regulation.
The demand side needs to take into account the development of new energy vehicles and the demand for crude oil in the chemical industry, recognizing the irreplaceable role of crude oil as an essential chemical raw material in the short to medium term. China’s petrochemical industry production process is mainly based on fossil resources such as oil and gas and coal as raw materials, and the total energy consumption of the petrochemical industry ranks among the highest in the industrial sectors. This is due to the shortage of high-end products such as fine chemicals and new chemical materials, and the high proportion of basic chemical products in the industrial structure. The strong demand for new high-end chemical materials on the domestic market will encourage the promotion of the functionalization, differentiation, and high added value of petrochemical products.
From the internal supply perspective, the “Fourteenth Five-Year Plan” for a modern energy system points out that the traditional energy sector should prioritize energy security and protect the domestic fossil energy supply, and that the gradual withdrawal of traditional energy sources should be based on a safe and reliable alternative to new energy sources. First, enhance production to ensure the supply of crude oil and to encourage the expansion of oil and gas reserves. China will continue to promote oil and gas exploration on the premise of balancing resource and environmental protection, and increase investment in technological innovation in oil and gas exploration. Second, play the role of unconventional oil and gas substitution. China needs to deepen the unconventional oil and gas revolution, and carry out a series of unconventional oil and gas key technology research, explorations and improvements. Third, promote the use of renewable energy. The major oil fields should vigorously promote the construction of photovoltaic power generation, wind power, and other renewable energy projects, use renewable energy to promote green development and green production of oil and gas, reduce carbon emissions in the process of increasing oil and gas storage, and achieve the unity of economic and environmental benefits.
From the perspective of China’s oil price mechanism, China’s oil prices are highly dependent on international crude oil prices and oil price fluctuations have a negative impact on oil-related industries via price transmission, requiring the use of sound crude oil and refined oil futures markets to hedge the risks associated with international crude oil price fluctuations, as well as the use of fiscal instruments such as taxation to regulate refined oil prices.
Regarding the caveats and limitations of this study, it is difficult to obtain monthly data on new energy vehicle sales by province in China, which is an important explanatory variable for this study, so we conducted a time-series analysis rather than panel-data analysis. In the absence of monthly data at a province-level in China or other regions/countries, we carried out a time-series analysis of China as one unit and drew conclusion based on the short-time observation. Nonetheless, heterogeneity and endogeneity are not well controlled for in this research. Future research should employ a dynamic panel study with adequate panel data to handle these issues and obtain more accurate findings. In addition, we do not have access to the monthly ownership data of new energy vehicles, so we use the monthly sales of new energy vehicles as a proxy. As a result, the measurement of the reduction effect of new energy vehicle development on crude oil consumption may not be accurate. Meanwhile, we need to focus on the impact of supply-side policies, such as ownership restrictions and fuel tax, and so on. Vehicle ownership restrictions have had a large impact. If these restrictions had not been implemented, the number of new cars sold would have been higher in the restricted cities and the whole of China. Ownership restrictions have reduced the fuel consumption and tailpipe GHG emissions of new cars. Given the externalities associated with automobiles, some policies may be implemented to restrict vehicle ownership [25]. Considering the social welfare, the choice of fuel tax or auction quota or other policy instruments is very important. The fuel tax will not only control the number of vehicles, but also reduce vehicle usage and the externalities related to vehicle use [17].
Author Contributions
Conceptualization, Z.G. and S.S.; methodology, Z.G.; software, Z.G. and S.S.; investigation, Z.G. and S.S.; resources, Z.G. and S.S.; data curation, Z.G. and S.S.; writing—original draft preparation, Z.G.; writing—review and editing, Z.G., S.S., Y.W., J.N., and X.Q.; visualization, Y.W. and J.N.; supervision, X.Q.; project administration, X.Q.; funding acquisition, X.Q. All authors have read and agreed to the published version of the manuscript.
Funding
This research received no external funding.
Data Availability Statement
Not applicable.
Acknowledgments
We are grateful for the support from Sophia University.
Conflicts of Interest
The authors declare no conflict of interest.
References
- Zhang, S.X.; Ma, B.Y. Development Trend of World Energy and Future Development Directions of China’s Energy. Nat. Resour. Econ. China 2019, 10, 20–27, 33. [Google Scholar]
- BP. BP Statistical Review of World Energy 2022, 71st ed.; BP p.l.c.: London, UK, 2022. [Google Scholar]
- Zhou, J.P. Global energy transformation and deepening China’s reform & opening up in all respects. Int. Pet. Econ. 2019, 27, 34–42. [Google Scholar]
- Zou, C.N.; He, D.B.; Jia, C.Y.; Xiong, B.; Zhao, Q.; Pan, S.Q. Connotation and pathway of world energy transition and its significance for carbon neutral. Acta Pet. Sin. 2021, 42, 233–247. [Google Scholar]
- Wang, K.-H.; Su, C.-W.; Umar, M. Geopolitical risk and crude oil security: A Chinese perspective. Energy 2021, 219, 119555. [Google Scholar] [CrossRef]
- Maghyereh, A.; Abdoh, H. Asymmetric effects of oil price uncertainty on corporate investment. Energy Econ. 2010, 86, 104622. [Google Scholar]
- Yang, Y.; Yu, H.Y.; Lu, G.; Wang, L.M.; Zhao, Y.; Hao, L.S.; Ren, D.M.; Fang, W.; An, Z.H.; Cai, G.T. Centennial Changes in World Energy and National Energy Security. J. Nat. Resour. 2020, 35, 2803–2820. [Google Scholar]
- Zhili, D.; Boqiang, L.; Chunxu, G. Development path of electric vehicles in China under environmental and energy security constraints. Resour. Conserv. Recycl. 2019, 143, 17–26. [Google Scholar]
- Dai, J.Q.; Peng, T.B.; Han, B.; Wang, L.N.; Zang, H.M. Research on the low-carbon transformation path of China’s transportation sector and its impact on oil demand under the “double carbon” goal. Int. Pet. Econ. 2021, 29, 1–9. [Google Scholar]
- The State Council. Action Plan for Carbon Dioxide Peak before 2030. Available online: http://www.gov.cn/zhengce/content/2021-10/26/content_5644984.htm (accessed on 1 November 2021).
- Kester, J.; Sovacool, B.K.; de Rubens, G.Z.; Noel, L. Novel or normal? Electric vehicles and the dialectic transition of Nordic automobility. Energy Res. Soc. Sci. 2020, 69, 101642. [Google Scholar] [CrossRef]
- Yan, J.R.; Zhao, Y.; Cui, P.P.; Tang, W.M. Evolution of Temporal and Spatial Pattern of China’s Crude Oil Import Trade from the Perspective of Petroleum Security. Econ. Geogr. 2020, 40, 112–120. [Google Scholar]
- Wang, Q.; Li, S.Y.; Li, R.R. China’s dependency on foreign oil will exceed 80% by 2030: Developing a novel NMGM-ARIMA to forecast China’s foreign oil dependence from two dimensions. Energy 2018, 163, 151–167. [Google Scholar] [CrossRef]
- Zhang, Q. Study on the Dependence of China’s Oil Import; Wuhan University: Wuhan, China, 2013. [Google Scholar]
- Shi, D. The Formation Mechanism of International Oil Price and Its Impact on China’s Economic Development. Econ. Res. J. 2000, 12, 48–53. [Google Scholar]
- Liu, Y. Research on Transmission Mechanism of International Oil Price Fluctuation to China’s Automobile Market. Prices Mon. 2017, 5, 15–18. [Google Scholar]
- Tan, J.; Xiao, J.; Zhou, X. Market equilibrium and welfare effects of a fuel tax in China: The impact of consumers’ response through driving patterns. J. Environ. Econ. Manag. 2019, 93, 20–43. [Google Scholar] [CrossRef]
- Yin, J.P.; Sun, D.Y. Automobile Consumption Growth and China’s Oil Security. Reform. Strategy 2010, 26, 44–46. [Google Scholar]
- Wang, H.L.; Ou, X.M.; Zhang, X.L. Mode, technology, energy consumption, and resulting CO2 emissions in China’s transport sector up to 2050. Energy Policy 2017, 109, 719–733. [Google Scholar] [CrossRef]
- Sheldon, T.L.; Dua, R. Effectiveness of China’s plug-in electric vehicle subsidy. Energy Econ. 2020, 88, 104773. [Google Scholar] [CrossRef]
- WOODMAC. By 2035, six major themes of the international oil market will be determined—The development scale and cost of shale oil in the United States. The cost competition between shale oil and traditional oil and gas, OPEC production reduction strategy and geopolitical crisis will determine the future oil market supply; Transportation oil will determine the peak of oil demand. The rapid development of electric vehicles will have an impact on oil demand. The demand for petrochemical raw materials will be strong in the future. World Pet. Ind. 2017, 24, 21–25. [Google Scholar]
- Bansal, P.; Dua, R. Fuel consumption elasticities, rebound effect and feebate effectiveness in the Indian and Chinese new car markets. arXiv 2022, arXiv:2201.08995. [Google Scholar] [CrossRef]
- Schwert, G.W. Tests for Unit Roots: A Monte Carlo Investigation. J. Bus. Econ. Stat. 1989, 7, 147–159. [Google Scholar]
- Zhao, Y.; Yan, Z.; Pan, Z.; Suo, L.; Fang, X.; Chen, X.; Zhang, Q. Analysis on Safety and Stability Detection Between Electric Vehicle Charging Piles and Power Grid. In Proceedings of the 2022 Power System and Green Energy Conference (PSGEC), Shanghai, China, 7–12 August 2022. [Google Scholar]
- Liu, A.; Dua, R.; Hu, W.M.; Ku, A.L. Choosing to diet: The impact and cost-effectiveness of China’s vehicle ownership restrictions. Transp. Res. Part D Transp. Environ. 2022, 111, 103456. [Google Scholar]
Disclaimer/Publisher’s Note: The statements, opinions and data contained in all publications are solely those of the individual author(s) and contributor(s) and not of MDPI and/or the editor(s). MDPI and/or the editor(s) disclaim responsibility for any injury to people or property resulting from any ideas, methods, instructions or products referred to in the content. |
© 2023 by the authors. Licensee MDPI, Basel, Switzerland. This article is an open access article distributed under the terms and conditions of the Creative Commons Attribution (CC BY) license (https://creativecommons.org/licenses/by/4.0/).