

Impact of V2G Flexibility on Congestion Management in the German Transmission Grid


Abstract
:1. Introduction
2. Modeling of V2G in Transmission Grids
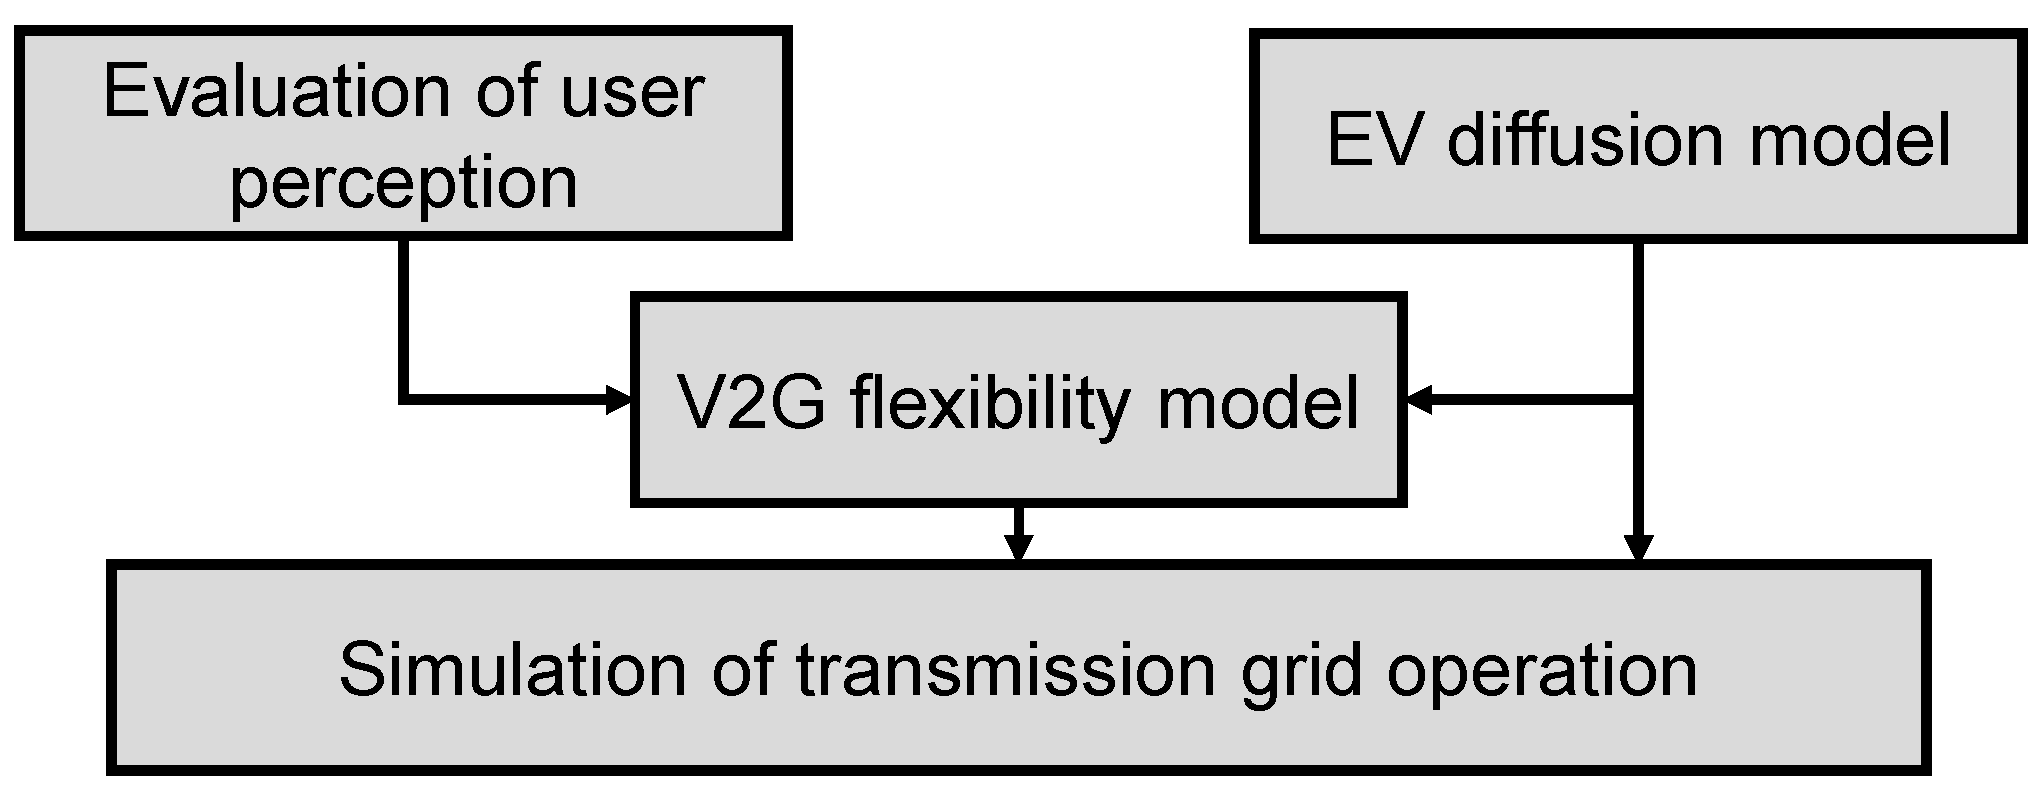
2.1. Model Overview
2.2. User Requirements
2.3. EV Diffusion
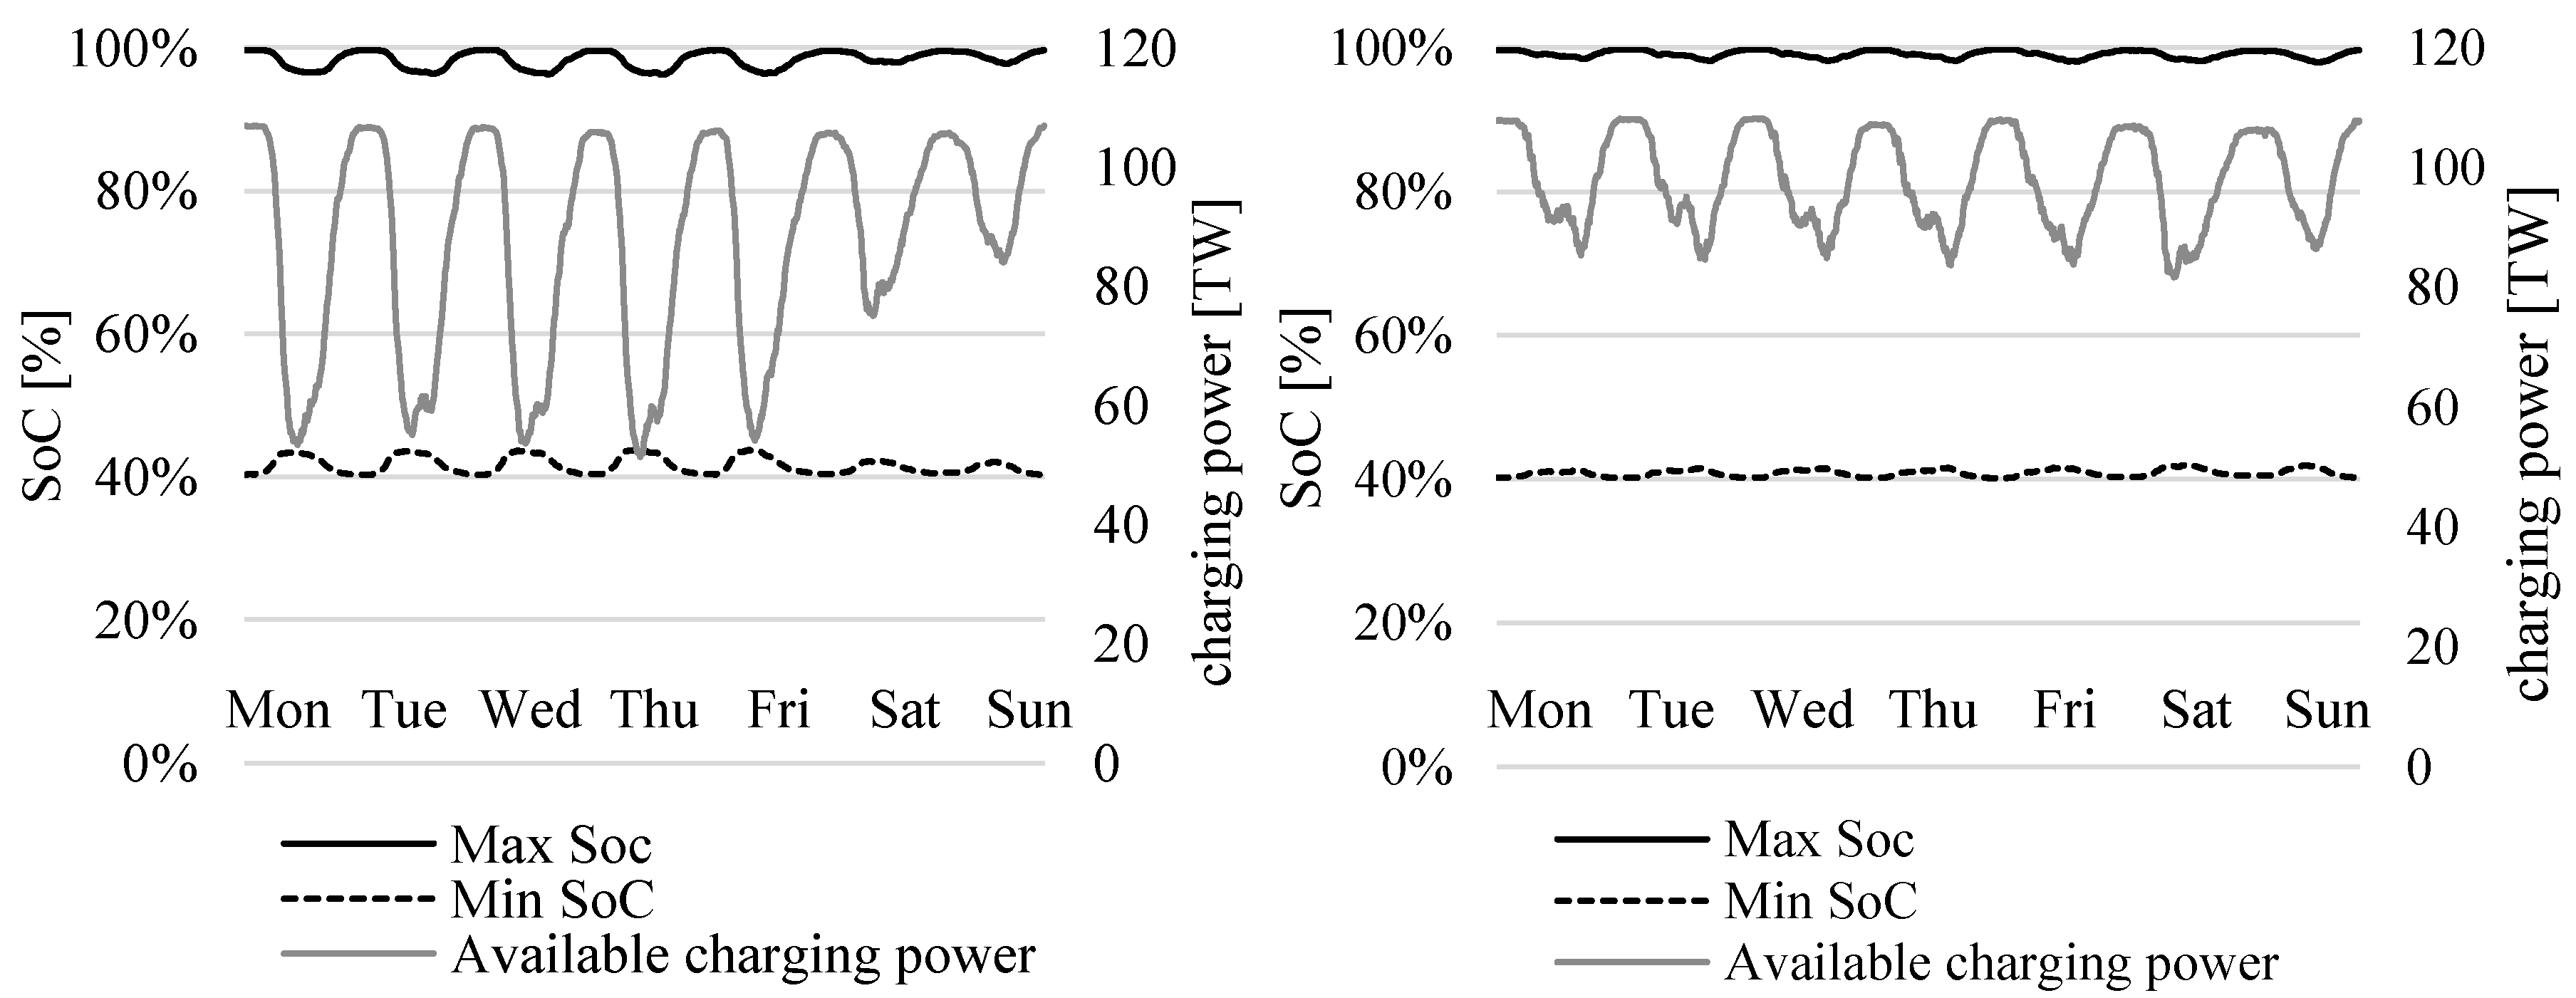
2.4. EV Flexibility
2.5. Transmission Grid
3. Case Study
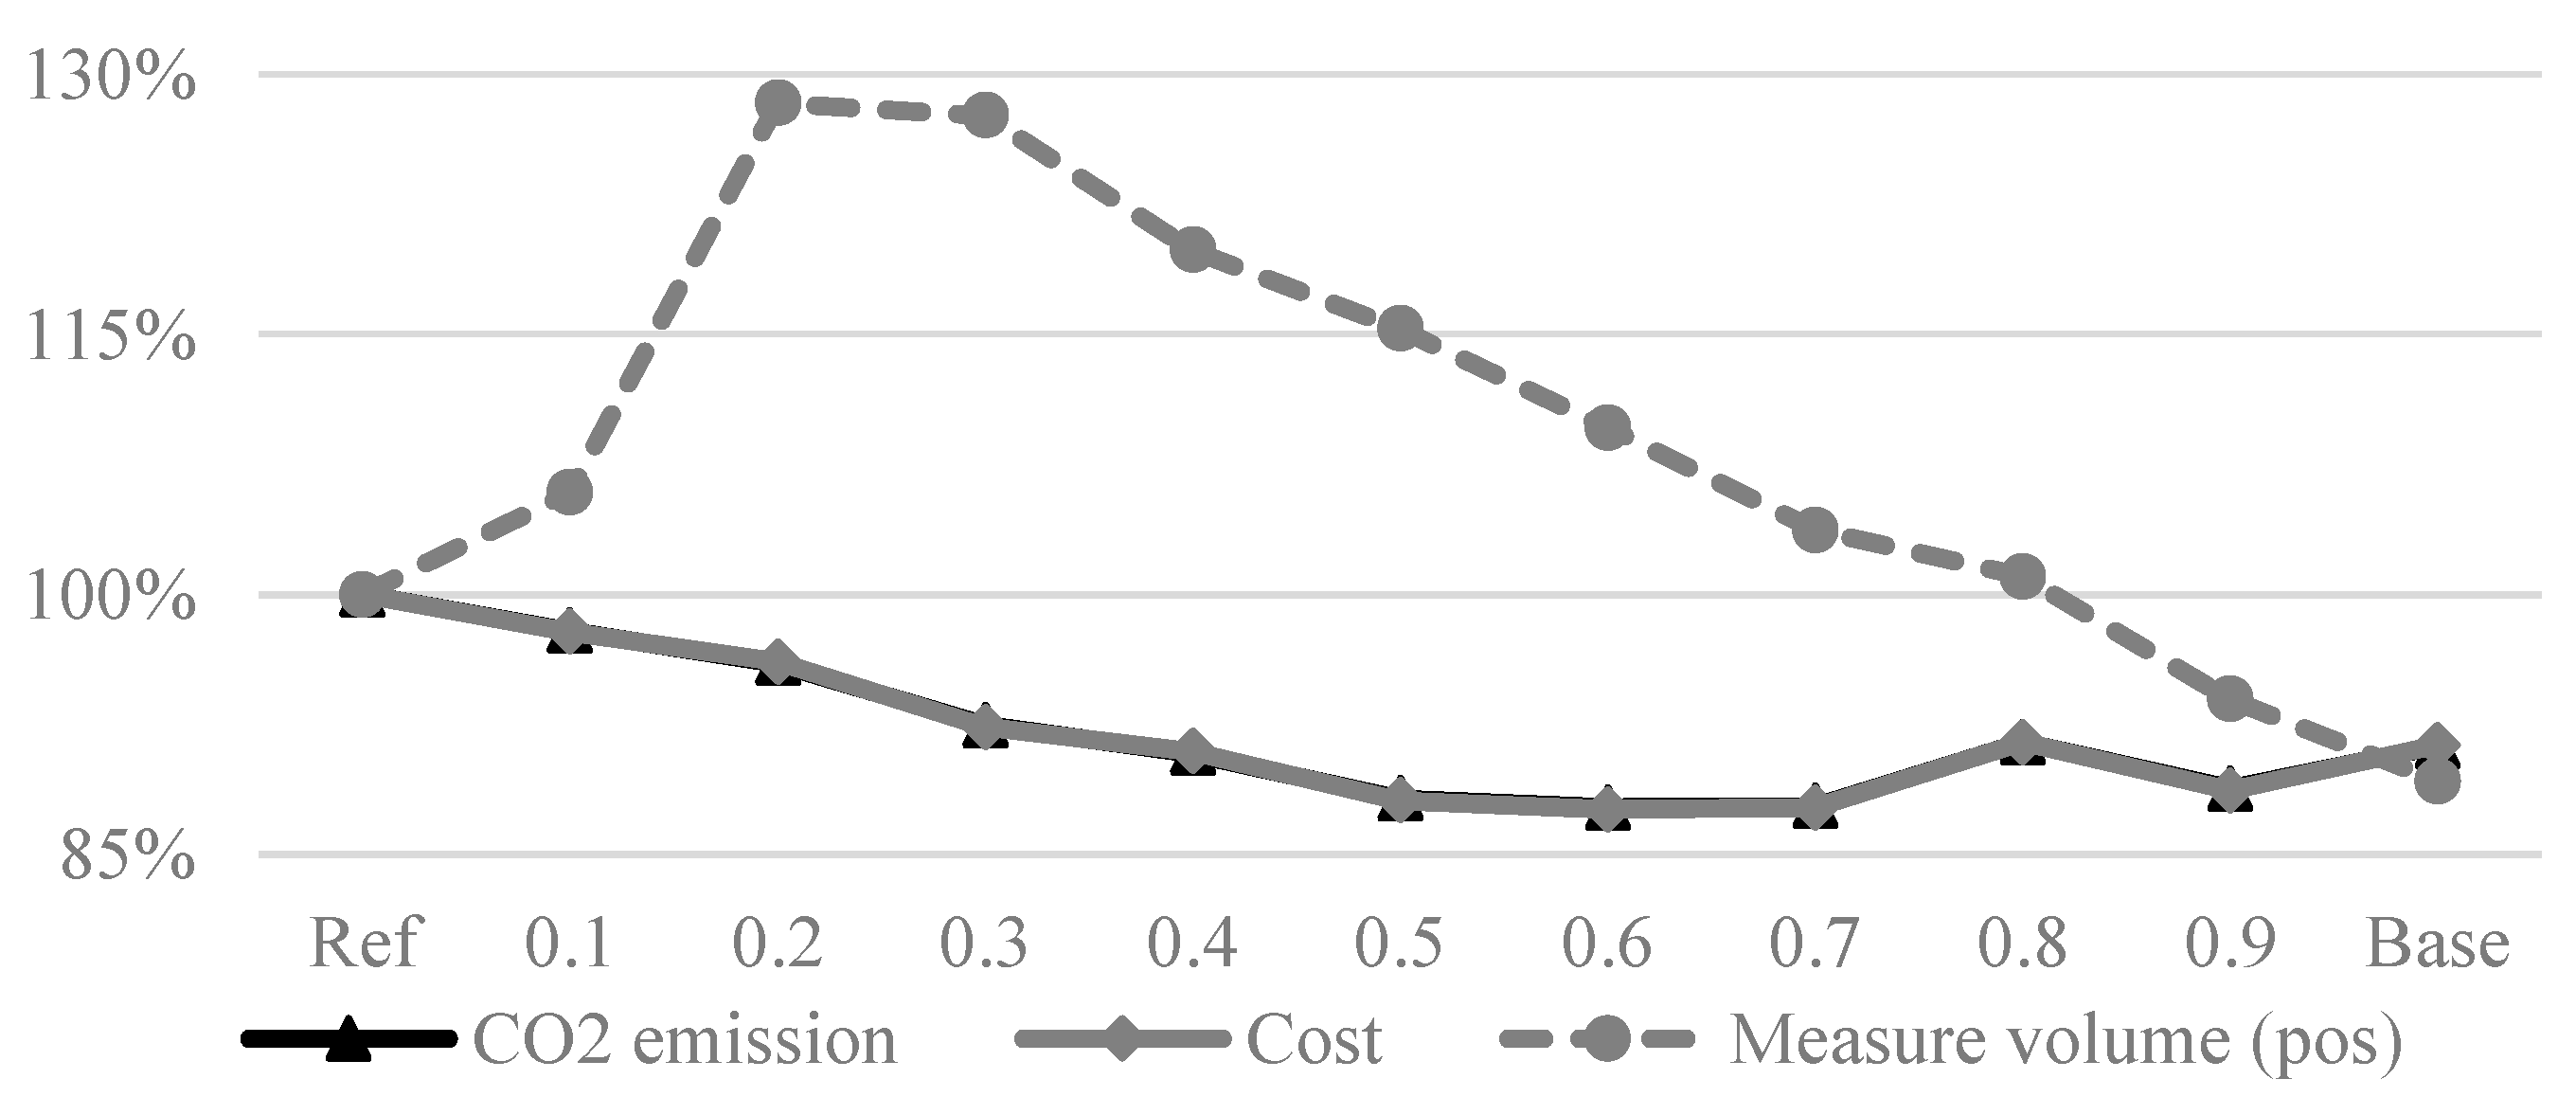
4. Results
5. Conclusions
Author Contributions
Funding
Data Availability Statement
Conflicts of Interest
References
- SPD. Bündnis 90/Die Grünen und FDP, Koalitionsvertrag: Mehr Fortschritt Wagen. Bündnis für Freiheit, Gerechtigkeit und Nachhaltigkeit. 2021. p. 178. Available online: https://www.bundesregierung.de/resource/blob/974430/1990812/1f422c60505b6a88f8f3b3b5b8720bd4/2021-12-10-koav2021-data.pdf?download=1 (accessed on 24 November 2023).
- Blumberg, G.; Broll, R.; Weber, C. The impact of electric vehicles on the future European electricity system–A scenario analysis. Energy Policy 2022, 161, 112751. [Google Scholar] [CrossRef]
- Kern, T.; Kigle, S. Modeling and evaluating bidirectionally chargeable electric vehicles in the future European energy system. Energy Rep. 2022, 8, 694–708. [Google Scholar] [CrossRef]
- Slednev, V.; Jochem, P.; Fichtner, W. Impacts of electric vehicles on the European high and extra high voltage power grid. J. Ind. Ecol. 2021, 26, 824–837. [Google Scholar] [CrossRef]
- Staudt, P.; Schmidt, M.; Gärttner, J.; Weinhardt, C. A decentralized approach towards resolving transmission grid congestion in Germany using vehicle-to-grid technology. Appl. Energy 2018, 230, 1435–1446. [Google Scholar] [CrossRef]
- Loschan, C.; Schwabeneder, D.; Lettner, G.; Auer, H. Flexibility potential of aggregated electric vehicle fleets to reduce transmission congestions and redispatch needs: A case study in Austria. Int. J. Electr. Power Energy Syst. 2023, 146, 108802. [Google Scholar] [CrossRef]
- Hoffrichter, A.; Offergeld, T.; Blank, A. Simulation of Transmission Grid Operation Incorporating Flexibility at Distribution Level. In Proceedings of the 2019 16th International Conference on the European Energy Market (EEM), Ljubljana, Slovenia, 18–20 September 2019. [Google Scholar]
- Noel, L.; de Rubens, G.Z.; Kester, J.; Sovacool, B.K. Vehicle-To-Grid; Springer: Cham, Switzerland, 2019. [Google Scholar]
- Delmonte, E.; Kinnear, N.; Jenkins, B.; Skippon, S. What do consumers think of smart charging? Perceptions among actual and potential plug-in electric vehicle adopters in the United Kingdom. Energy Res. Soc. Sci. 2020, 60, 101318. [Google Scholar] [CrossRef]
- Krueger, H.; Cruden, A. Integration of electric vehicle user charging preferences into Vehicle-to-Grid aggregator controls. Energy Rep. 2020, 6, 86–95. [Google Scholar] [CrossRef]
- Yilmaz, S.; Cuony, P.; Chanez, C. Prioritize your heat pump or electric vehicle? Analyzing design preferences for Direct Load Control programmes in Swiss households. Energy Res. Soc. Sci. 2021, 82, 102319. [Google Scholar] [CrossRef]
- Baumgartner, N.; Kellerer, F.; Ruppert, M.; Hirsch, S.; Mang, S.; Fichtner, W. Does experience matter? Assessing user motivations to accept a vehicle-to-grid charging tariff. Transp. Res. Part D Transp. Environ. 2022, 113, 103528. [Google Scholar] [CrossRef]
- Noel, L.; Carrone, A.P.; Jensen, A.F.; de Rubens, G.Z.; Kester, J.; Sovacool, B.K. Willingness to pay for electric vehicles and vehicle-to-grid applications: A Nordic choice experiment. Energy Econ. 2018, 78, 525–534. [Google Scholar] [CrossRef]
- Chen, C.-F.; de Rubens, G.Z.; Noel, L.; Kester, J.; Sovacool, B.K. Assessing the socio-demographic, technical, economic and behavioral factors of Nordic electric vehicle adoption and the influence of vehicle-to-grid preferences. Renew. Sustain. Energy Rev. 2020, 121, 109692. [Google Scholar] [CrossRef]
- Ensslen, A.; Ringler, P.; Dörr, L.; Jochem, P.; Zimmermann, F.; Fichtner, W. Incentivizing smart charging: Modeling charging tariffs for electric vehicles in German and French electricity markets. Energy Res. Soc. Sci. 2018, 42, 112–126. [Google Scholar] [CrossRef]
- Ensslen, A.; Will, C.; Jochem, P. Simulating Electric Vehicle Diffusion and Charging Activities in France and Germany. World Electr. Veh. J. 2019, 10, 73. [Google Scholar] [CrossRef]
- Jochem, P.; Vilchez, J.J.G.; Ensslen, A.; Schäuble, J.; Fichtner, W. Methods for forecasting the market penetration of electric drivetrains in the passenger car market. Transp. Rev. 2018, 38, 322–348. [Google Scholar] [CrossRef]
- Kraftfahrt-Bundesamt. Number of Electric Vehicles in Germany from 2012 to 2022. Available online: https://www.kba.de/DE/Statistik/Produktkatalog/produkte/Fahrzeuge/fz13_b_uebersicht.html?nn=3514348 (accessed on 24 November 2023).
- Ried, S.; Dengiz, T.; Soldner, S.; Jochem, P. Aggregating load shifting potentials of electric vehicles for energy system models. In Proceedings of the 2020 17th International Conference on the European Energy Market (EEM), Stockholm, Sweden, 16–18 September 2020. [Google Scholar]
- Ecke, L.; Chlond, B.; Magdolen, M.; Vortisch, P. Deutsches Mobilitätspanel (MOP)—Wissenschaftliche Begleitung Und Auswertungen Bericht 2019/2020: Alltagsmobilität Und Fahrleistung, Institute for Transport Studies (KIT). 2020. Available online: https://daten.clearingstelle-verkehr.de/192/233/Bericht_MOP_20_21.pdf (accessed on 24 November 2023).
- Ruppert, M.; Slednev, V.; Ardone, A.; Fichtner, W. Dynamic Optimal Power Flow with Storage Restrictions Using Augmented Lagrangian Algorithm. In Proceedings of the Power Systems Computation Conference, Dublin, Ireland, 11–15 June 2018. [Google Scholar]
- Ruppert, M.; Slednev, V.; Finck, R.; Ardone, A.W. Fichtner. Utilizing distributed flexibilities in the european transmission grid. In Advances in Energy System Optimization; Springer International Publishing: New York, NY, USA, 2020. [Google Scholar]
- Slednev, V.; Bertsch, V.; Ruppert, M.; Fichtner, W. Highly resolved optimal renewable allocation planning in power systems under consideration of dynamic grid topology. Comput. Oper. Res. 2018, 96, 281–293. [Google Scholar] [CrossRef]
- Happ, H.H. Optimal Power Dispatch—A Comprehensive Survey. IEEE Trans. Power Appar. Syst. 1977, 96, 841–854. [Google Scholar] [CrossRef]
- Frank, S.; Rebennack, S. An introduction to optimal power flow: Theory, formulation, and examples. IE Trans. 2016, 48, 1172–1197. [Google Scholar] [CrossRef]
- Perau, C.; Slednev, V.; Ruppert, M.W.; Fichtner, W. Regionalization of four storylines for the decarbonization of the European power system including flexibilities. In Proceedings of the IEWT Conference, Vienna, Austria, 8–10 September 2021. [Google Scholar]
- VDA, Number of Private Vehicle Registrations in Germany from 1955 to 2022. 2023. Available online: https://www.vda.de/en/news/facts-and-figures/annual-figures/new-registrations (accessed on 24 November 2023).


| Sample | (in km) | |||||||
|---|---|---|---|---|---|---|---|---|
| M | SD | SE | Min | Max | q0.25 | q0.5 | q0.75 | |
| N = 1196 | 119.01 | 98.37 | 2.84 | 0 | 500 | 50 | 100 | 150 |
| Nlow = 691 | 119.75 | 97.91 | 3.73 | 0 | 500 | 50 | 100 | 150 |
| Nmed = 241 | 126.05 | 104.78 | 6.75 | 15 | 500 | 50 | 100 | 150 |
| Nhigh = 264 | 110.64 | 93.16 | 5.73 | 1 | 500 | 50 | 100 | 120 |
| Scenario | BEV Count | Charging Location | Charging Power | Battery Capacity | Consumption | Efficiency | Availability Market | Availability Grid Operation | Safety Range | Target Range |
|---|---|---|---|---|---|---|---|---|---|---|
| Base | 15 million | Home charging | 11 kW | 50 kWh | 15 kWh/100 km | 90% | 100% | 100% | 40% | 56.2% |
| Work | Home- and workplace charging | |||||||||
| Reduced | 10 million | Home charging | ||||||||
| Grid | 15 million | Home charging | 20% |
| (TWh) | Positive Thermal Redispatch | Negative Thermal Redispatch | Positive Hydro Redispatch | Negative Hydro Redispatch | RES Curtailment | Exchange Adjustment |
|---|---|---|---|---|---|---|
| Congestion management | 16.10 | −0.20 | 0.35 | −0.38 | −16.02 | 0.21 |
Disclaimer/Publisher’s Note: The statements, opinions and data contained in all publications are solely those of the individual author(s) and contributor(s) and not of MDPI and/or the editor(s). MDPI and/or the editor(s) disclaim responsibility for any injury to people or property resulting from any ideas, methods, instructions or products referred to in the content. |
© 2023 by the authors. Licensee MDPI, Basel, Switzerland. This article is an open access article distributed under the terms and conditions of the Creative Commons Attribution (CC BY) license (https://creativecommons.org/licenses/by/4.0/).
Share and Cite
Ruppert, M.; Baumgartner, N.; Märtz, A.; Signer, T. Impact of V2G Flexibility on Congestion Management in the German Transmission Grid. World Electr. Veh. J. 2023, 14, 328. https://doi.org/10.3390/wevj14120328
Ruppert M, Baumgartner N, Märtz A, Signer T. Impact of V2G Flexibility on Congestion Management in the German Transmission Grid. World Electric Vehicle Journal. 2023; 14(12):328. https://doi.org/10.3390/wevj14120328
Chicago/Turabian StyleRuppert, Manuel, Nora Baumgartner, Alexandra Märtz, and Tim Signer. 2023. "Impact of V2G Flexibility on Congestion Management in the German Transmission Grid" World Electric Vehicle Journal 14, no. 12: 328. https://doi.org/10.3390/wevj14120328
APA StyleRuppert, M., Baumgartner, N., Märtz, A., & Signer, T. (2023). Impact of V2G Flexibility on Congestion Management in the German Transmission Grid. World Electric Vehicle Journal, 14(12), 328. https://doi.org/10.3390/wevj14120328