Article

Impact of Electric Vehicle Charging Synchronization on the Urban Medium Voltage Power Distribution Network of Frederiksberg

by
Tim Unterluggauer
1,*,
F. Hipolito
2,
Sergey Klyapovskiy
1,† and
Peter Bach Andersen
1
1
Department of Wind and Energy Systems, Technical University of Denmark, 2800 Kongens Lyngby, Denmark
2
Department of Management Engineering, Technical University of Denmark, 2800 Kongens Lyngby, Denmark
*
Author to whom correspondence should be addressed.
Current address: Utiligize ApS, Gammel Kongevej 1, 1610 Copenhagen, Denmark.
World Electr. Veh. J. 2022, 13(10), 182; https://doi.org/10.3390/wevj13100182
Submission received: 1 September 2022 / Revised: 26 September 2022 / Accepted: 27 September 2022 / Published: 30 September 2022

Abstract

:
The uptake of electric vehicles (EVs) may pose a challenge to power distribution networks (PDNs). While smart charging can be deployed to relieve stress on the grid, user-centric smart charging strategies could also exacerbate peak power demand due to synchronization when optimizing charging with regard to different objectives, such as charging costs. In this paper, we assess the charging demand emerging from a large fleet of EVs, with models for the decision to charge and distribution of the steady-state state-of-charge (SoC). These are applied to the municipality of Frederiksberg, Denmark, using data from the Danish national travel survey. Home and workplace charging are mapped to the urban 10 kV medium voltage PDN of Frederiksberg considering different charging behaviors and degrees of synchronization. Results indicate that the likelihood of severe congestion in the power distribution network is low and that it can be attributed to rare scenarios in which high synchronization is observed, particularly when maintaining the normal steady-state demand. Despite the low likelihood, preventive measures should be devised to mitigate such scenarios, especially if additional high-power consumers are connected.

1. Introduction

Electrification of road transport, particularly personal vehicle utilization, has been identified as an important means to address the global challenge of reducing carbon emissions [1]. The growth of the EV market share has stimulated extensive research in the analysis of the impact of uncontrolled charging on both low [2,3] and medium voltage [4,5] PDNs. Works include the impact analysis for different grid topologies, e.g., rural, suburban or urban PDNs [6,7], for different countries [2,8,9,10] or commonly used test systems [11,12,13] due to a lack of data. The use of smart charging to mitigate this risk on the PDN has also been largely covered in the literature [14,15]. While several definitions of smart charging exist, optimally smart charging should consider both the power systems’ and vehicle users’ benefits [16].
However, recent studies also show that the coincidence factor (CF) of uncontrolled charging with increasing fleet size and charging power is expected to be rather low, typically less than 25 % [17,18], and thus might not pose the primary risk of overloading PDNs. The CF is defined as the ratio of the simultaneous maximum demand of a group of consumers (EV demand for the purpose of this work) to the sum of their individual maximum demands within a specified period. In contrast, little attention has been dedicated to the analysis of the potential negative impacts of a large-scale simultaneous start of charging stemming from different optimization strategies or the unforeseen use of the system, such as user-centric smart charging strategies that do not consider network constraints and the large-scale response of EV users to distribution network tariffs [11,19,20] or the malicious manipulation of charging control resulting from cyberattacks [21,22].
The first encompasses the risks posed by the synchronization of charging to external signals, such as electricity spot price and carbon emission fluctuations, or in its simplest form, to distribution network tariff variations. While several Danish companies offer such smart charging services [23,24], the existing literature [11,19] indicates that cost minimization could be a driving force for undesirable synchronization effects in home charging. Furthermore, network tariffs aim at incentivizing customers to shift demand away from peak load times. One example is the recently announced new tariff system of the Danish distribution system operator (DSO) Radius [25], where prices for households during peak load periods in winter will be roughly nine times higher than during low load periods. While tariffs can be a means to relieve stress on the grid, several pilot projects related to network tariffs also point towards the potential adverse effects of high rebound effects causing secondary peaks [26,27,28,29] due to undesirable synchronization at the intersection of two pricing periods.
The interplay of network tariffs and electricity price-based smart charging schemes (based on 24 h forecasts) could increase the CF, stemming from EV users deciding to charge on the given day. In addition, price-based smart charging could potentially increase the CF even further when considering multi-day forecasts in the optimization, thus rising the potential for simultaneous charging of a large fleet of EVs on the same day at the same time. Despite the potential for large impacts, little attention has been dedicated to quantifying and analyzing such impact on PDNs [14,20,30,31].
We address this knowledge gap in the paper by analyzing the potential impact of different degrees of charging simultaneity by comparing several EV charging scenarios. Recent literature credits home and workplace charging with the greatest potential for EV flexibility due to long idle times [32]. Therefore, we focus our analysis on these two charging locations where smart charging might be pursued most frequently, with the risk of adverse synchronization effects if PDN constraints are not taken into account. Furthermore, this paper focuses its analysis on the municipality of Frederiksberg, the inner part of the metropolitan area of the city of Copenhagen (Denmark). Due to its high population density and heterogeneous combination of charging demand, it is a good case study for assessing the impact of EV adoption on the power grid in the urban context. This municipality is currently part of a comprehensive project, FUSE [33], dedicated to analyzing the impacts of the electrification of private road transport, both from the perspective of transport demand and from the power grid supply standpoint. By combining real data from user behavior, baseline power consumption in the PDN and its topology, we offer a practical approach to analyze power grid utilization in real-world scenarios. We focus the analysis on the medium voltage PDN as part of a two-step approach. First, we access the boundaries of the impact on the medium voltage PDN. Second, we proceed with the analysis of the impact on the low voltage grid in future work. This approach addresses the lack of real-world case studies that simultaneously consider the transportation and power distribution perspectives [34] and aims at assisting DSOs to understand the potential impact of high charging synchronization in urban areas.
The main contributions of the paper are:
  • Providing a large-scale case study based on real data for modelling the PDN and EV demand,
  • Making use of novel steady-state SoC and decision-to-charge models to be able to simulate and analyze different charging patterns,
  • Providing a novel and straightforward charging allocation methodology to map EV charging events to the PDN,
  • Addressing the lack of studies devoted to analyzing the grid impact of charging synchronization which might become more prominent in the future when EV users will follow the same user-centric smart charging objective.
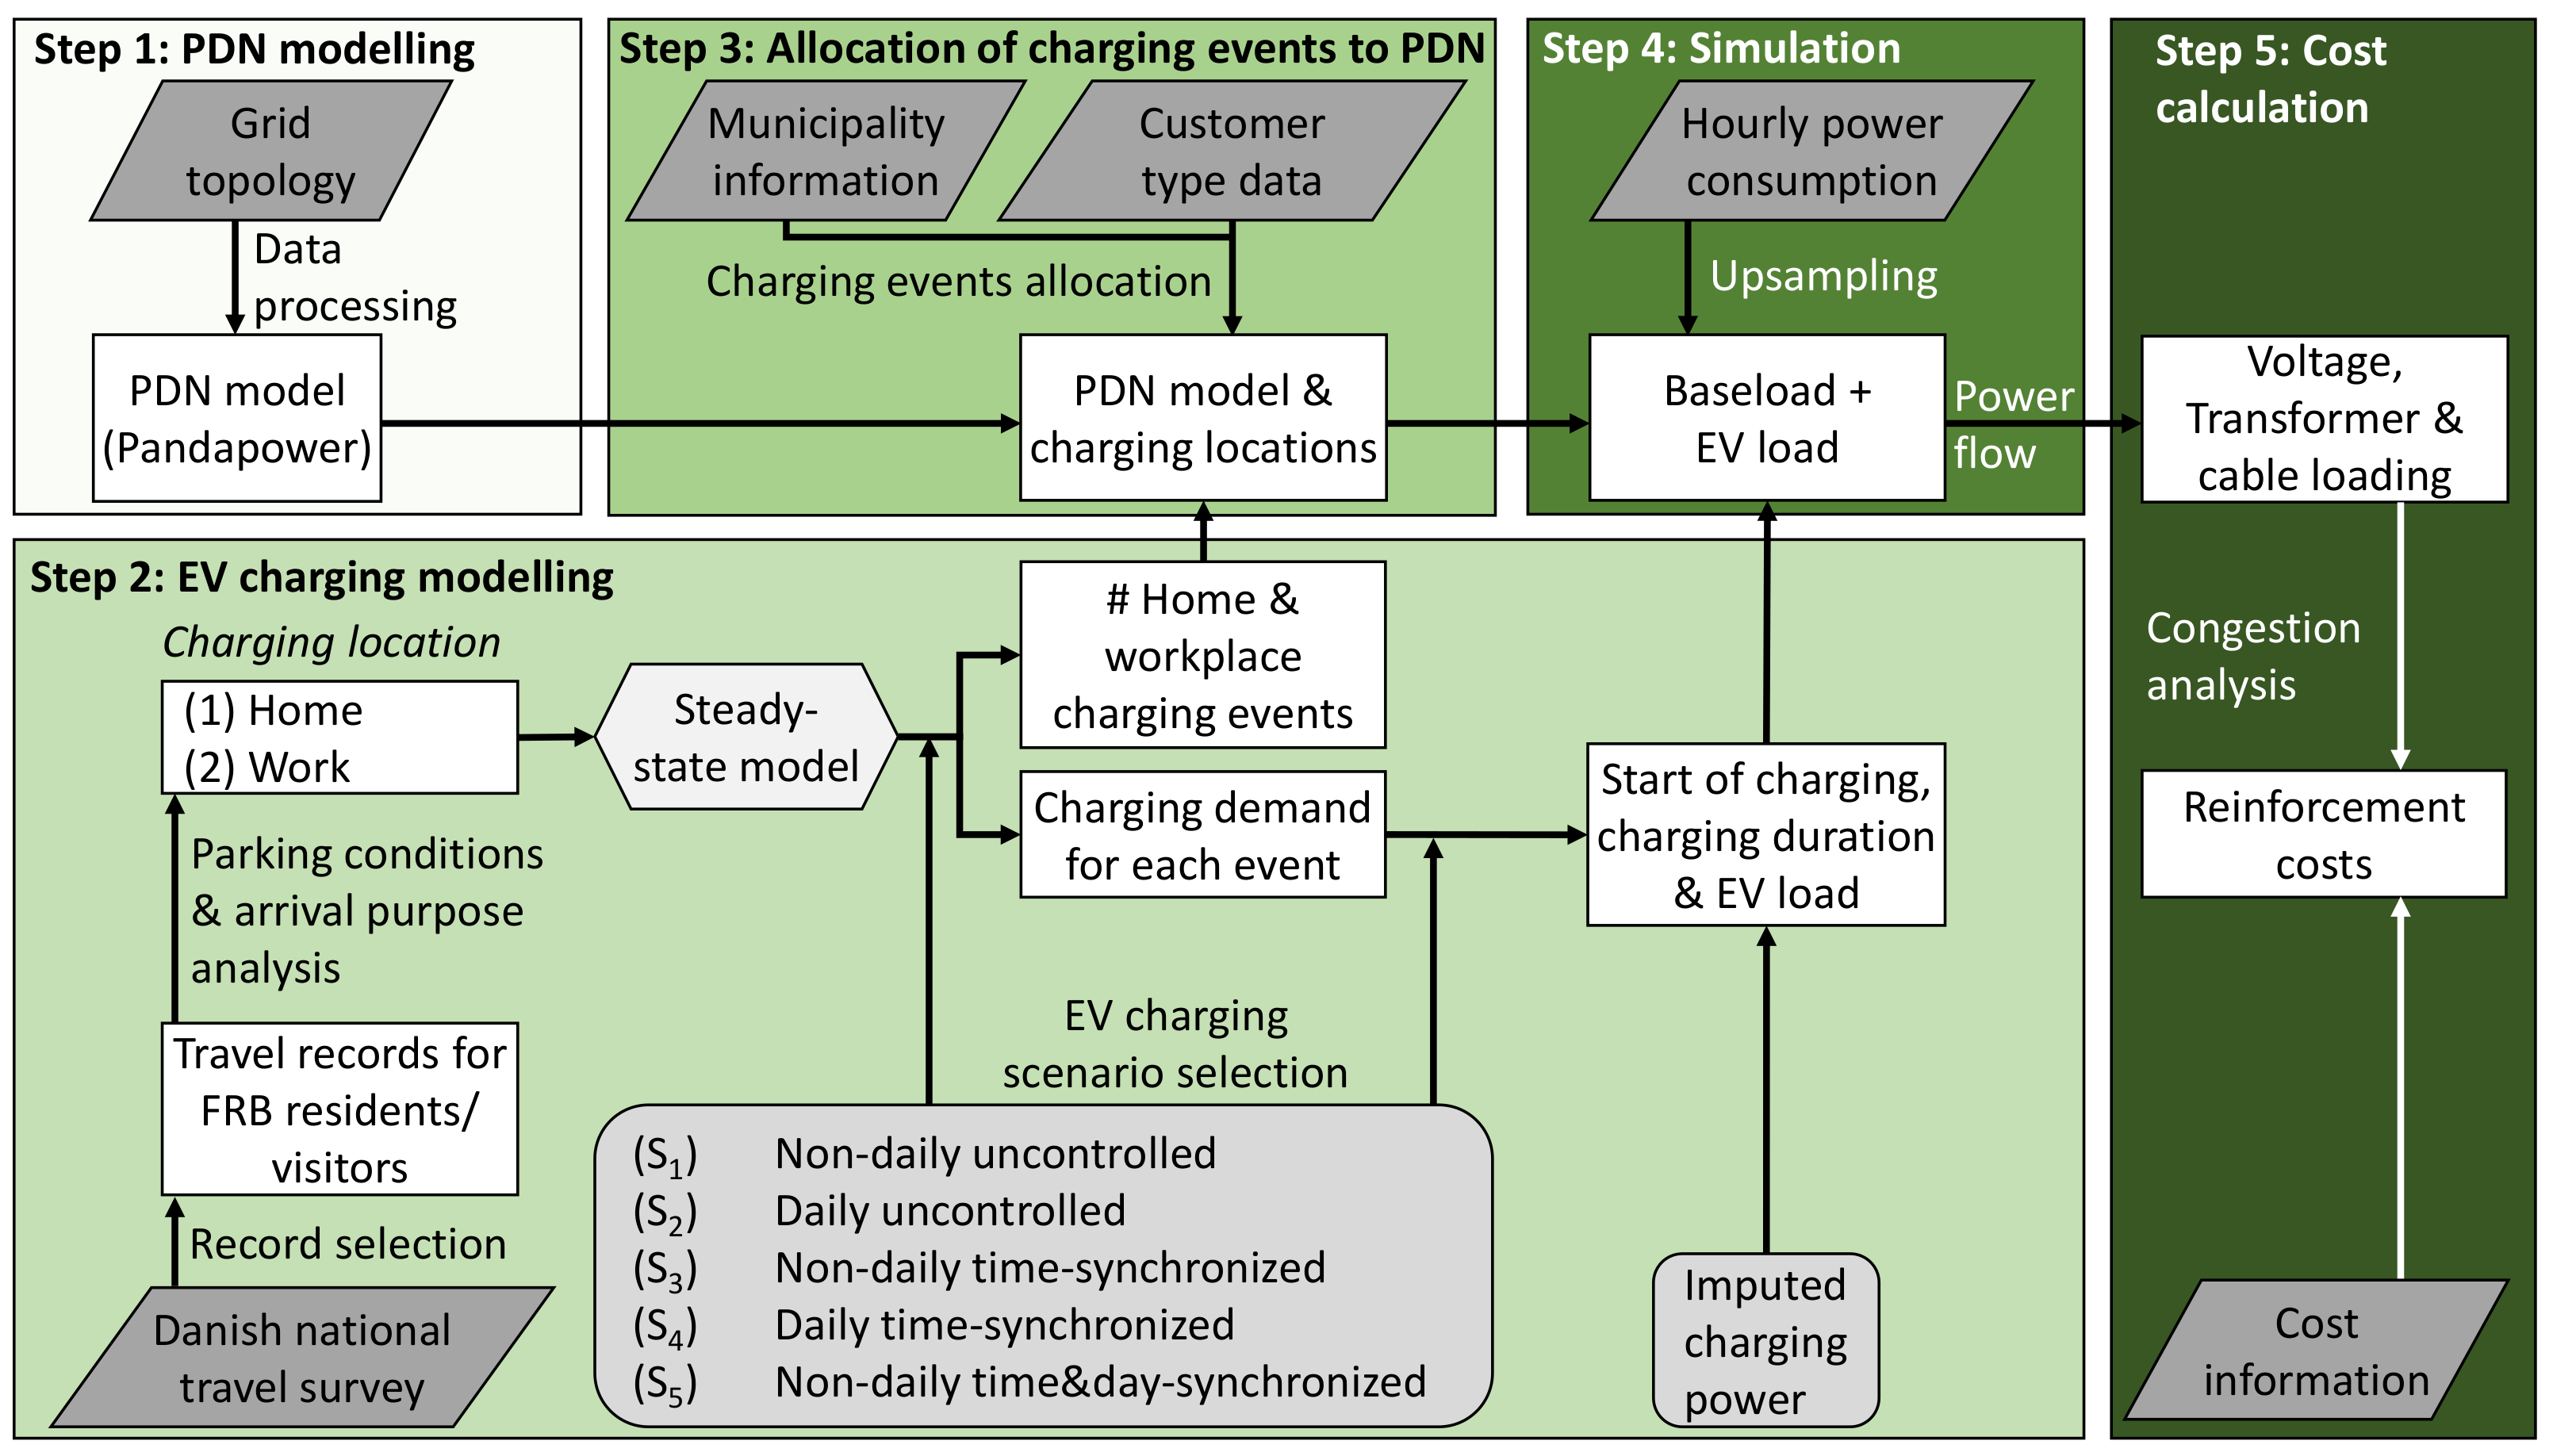
The subsequent parts of this paper are organized as follows: Section 2 provides an overview of the methodology introduced in this paper; Section 3 and Section 4 present and discuss the key findings; finally, conclusions are given in Section 5.

2. Methodology

An overview of the methodology of this paper is illustrated in Figure 1 and consists of five steps, to be discussed in the following. The different steps are highlighted by large rectangles ranging from light to dark green.

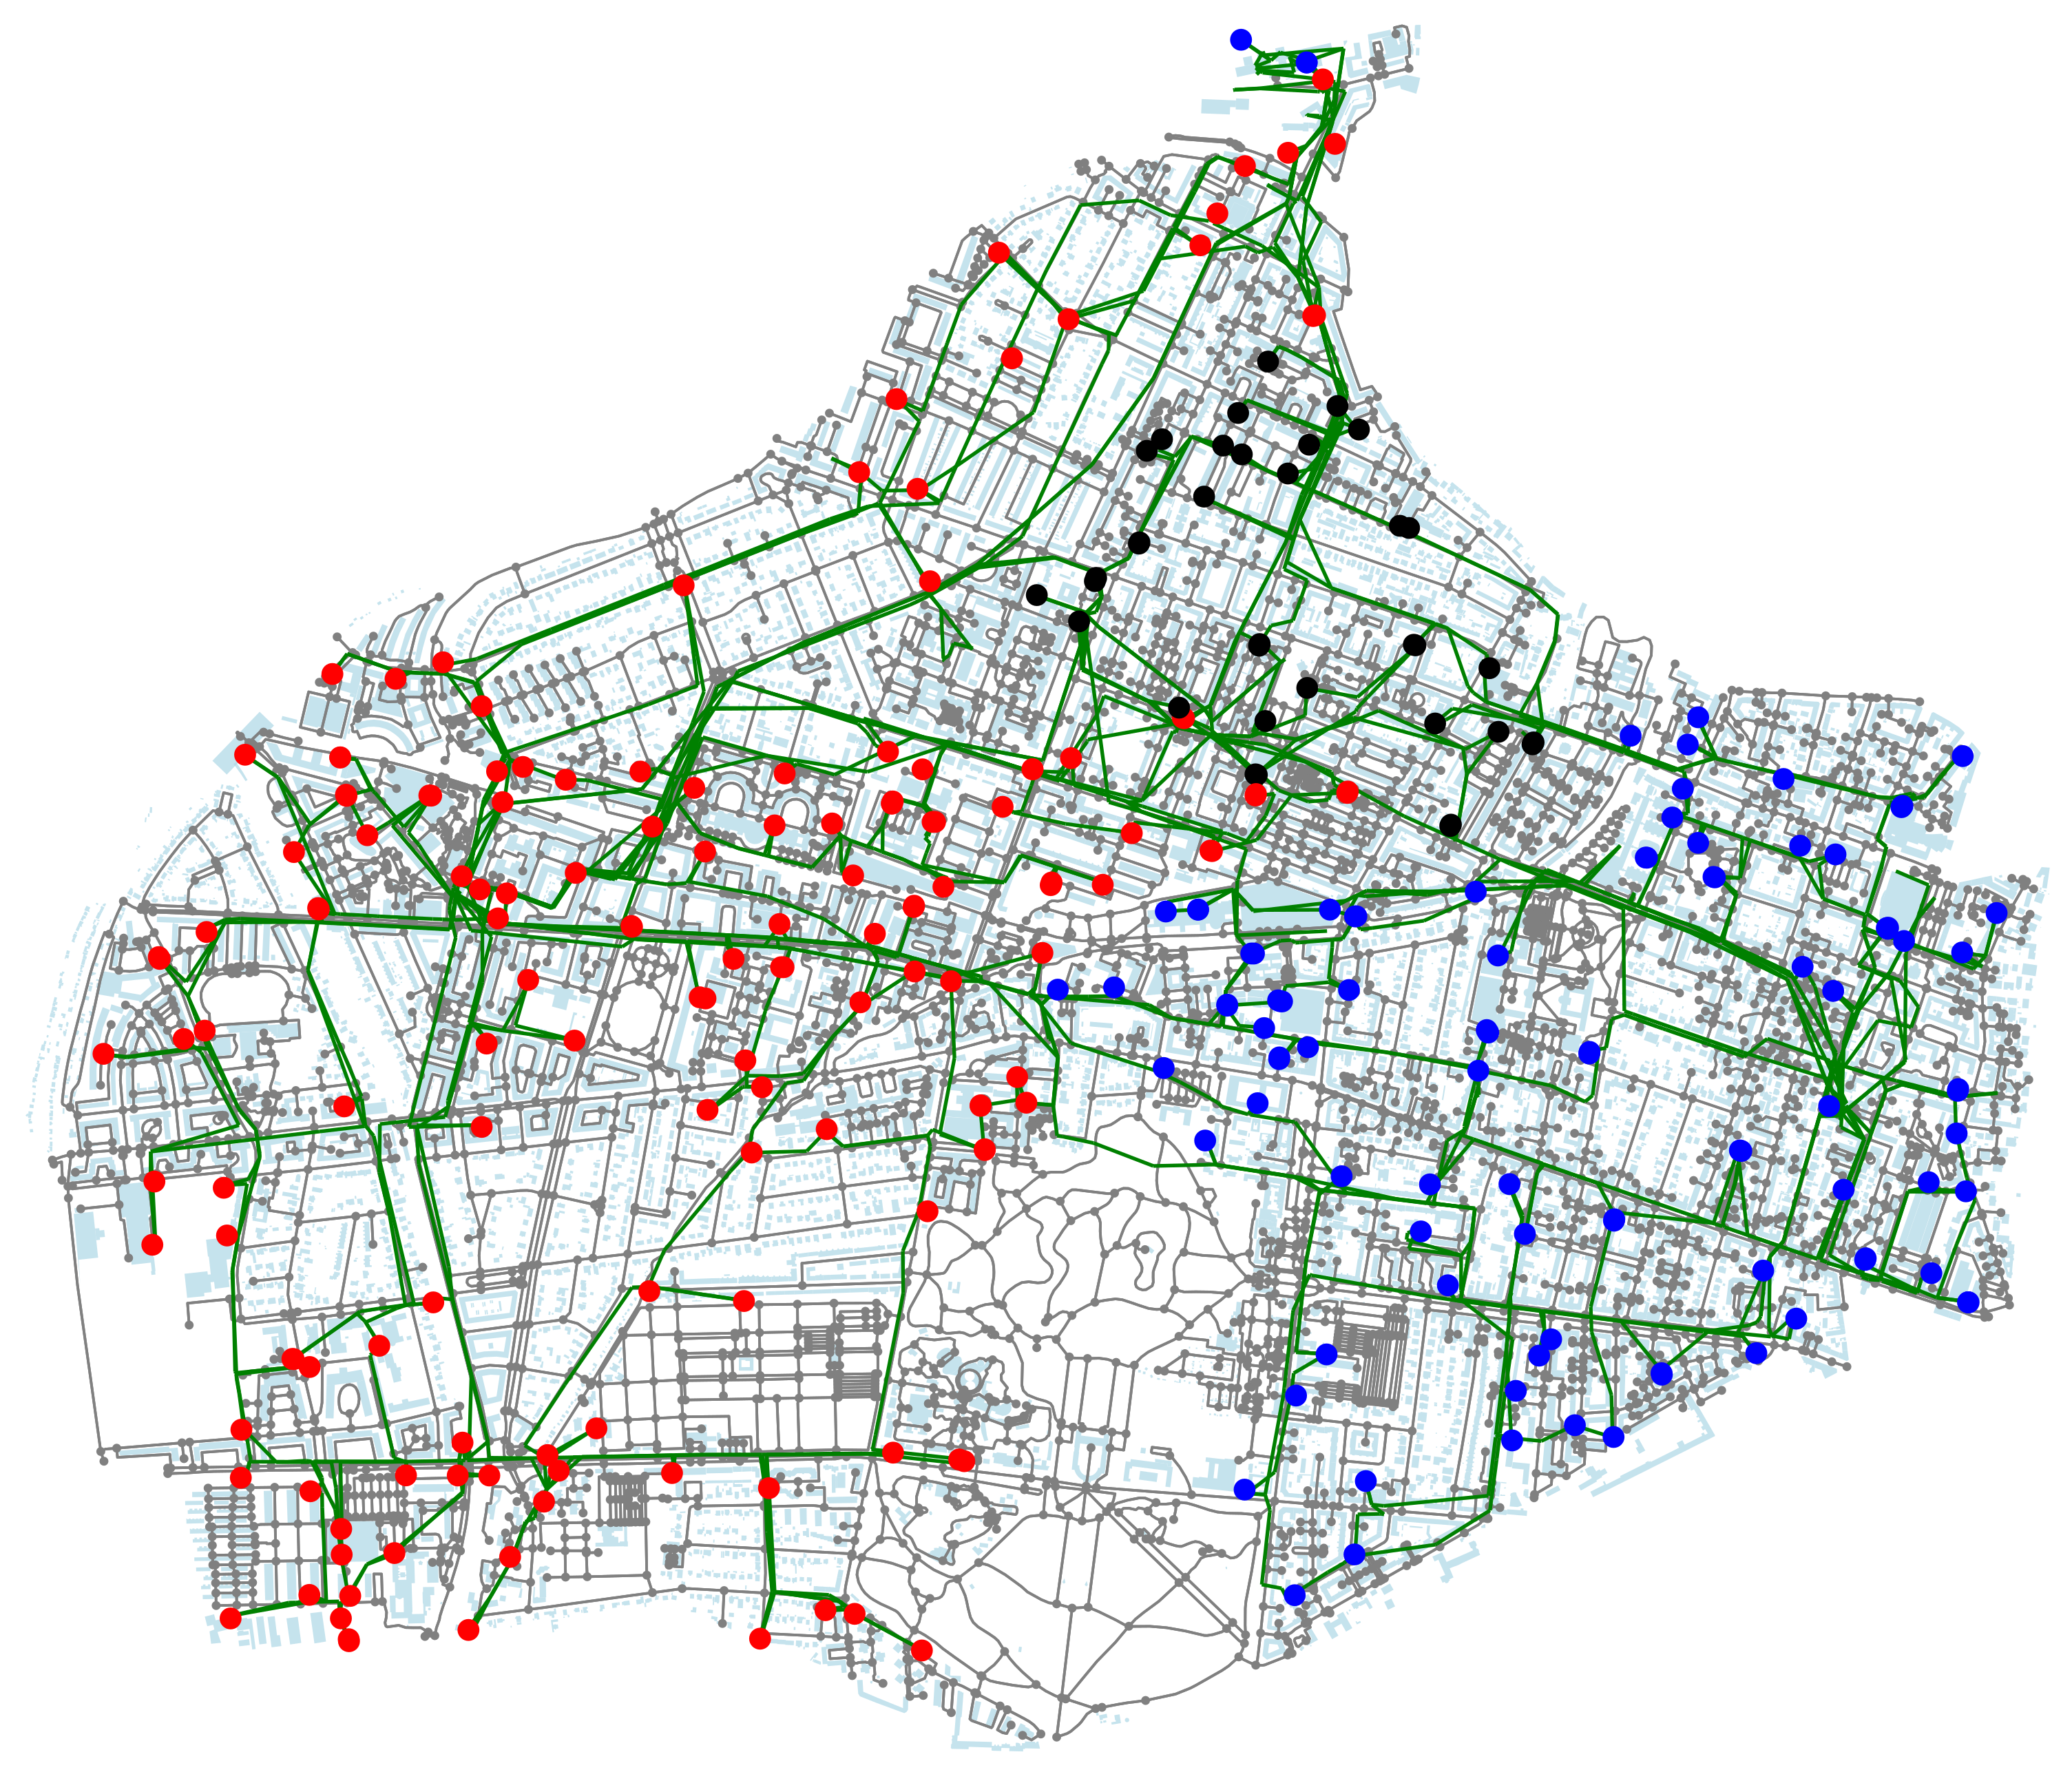
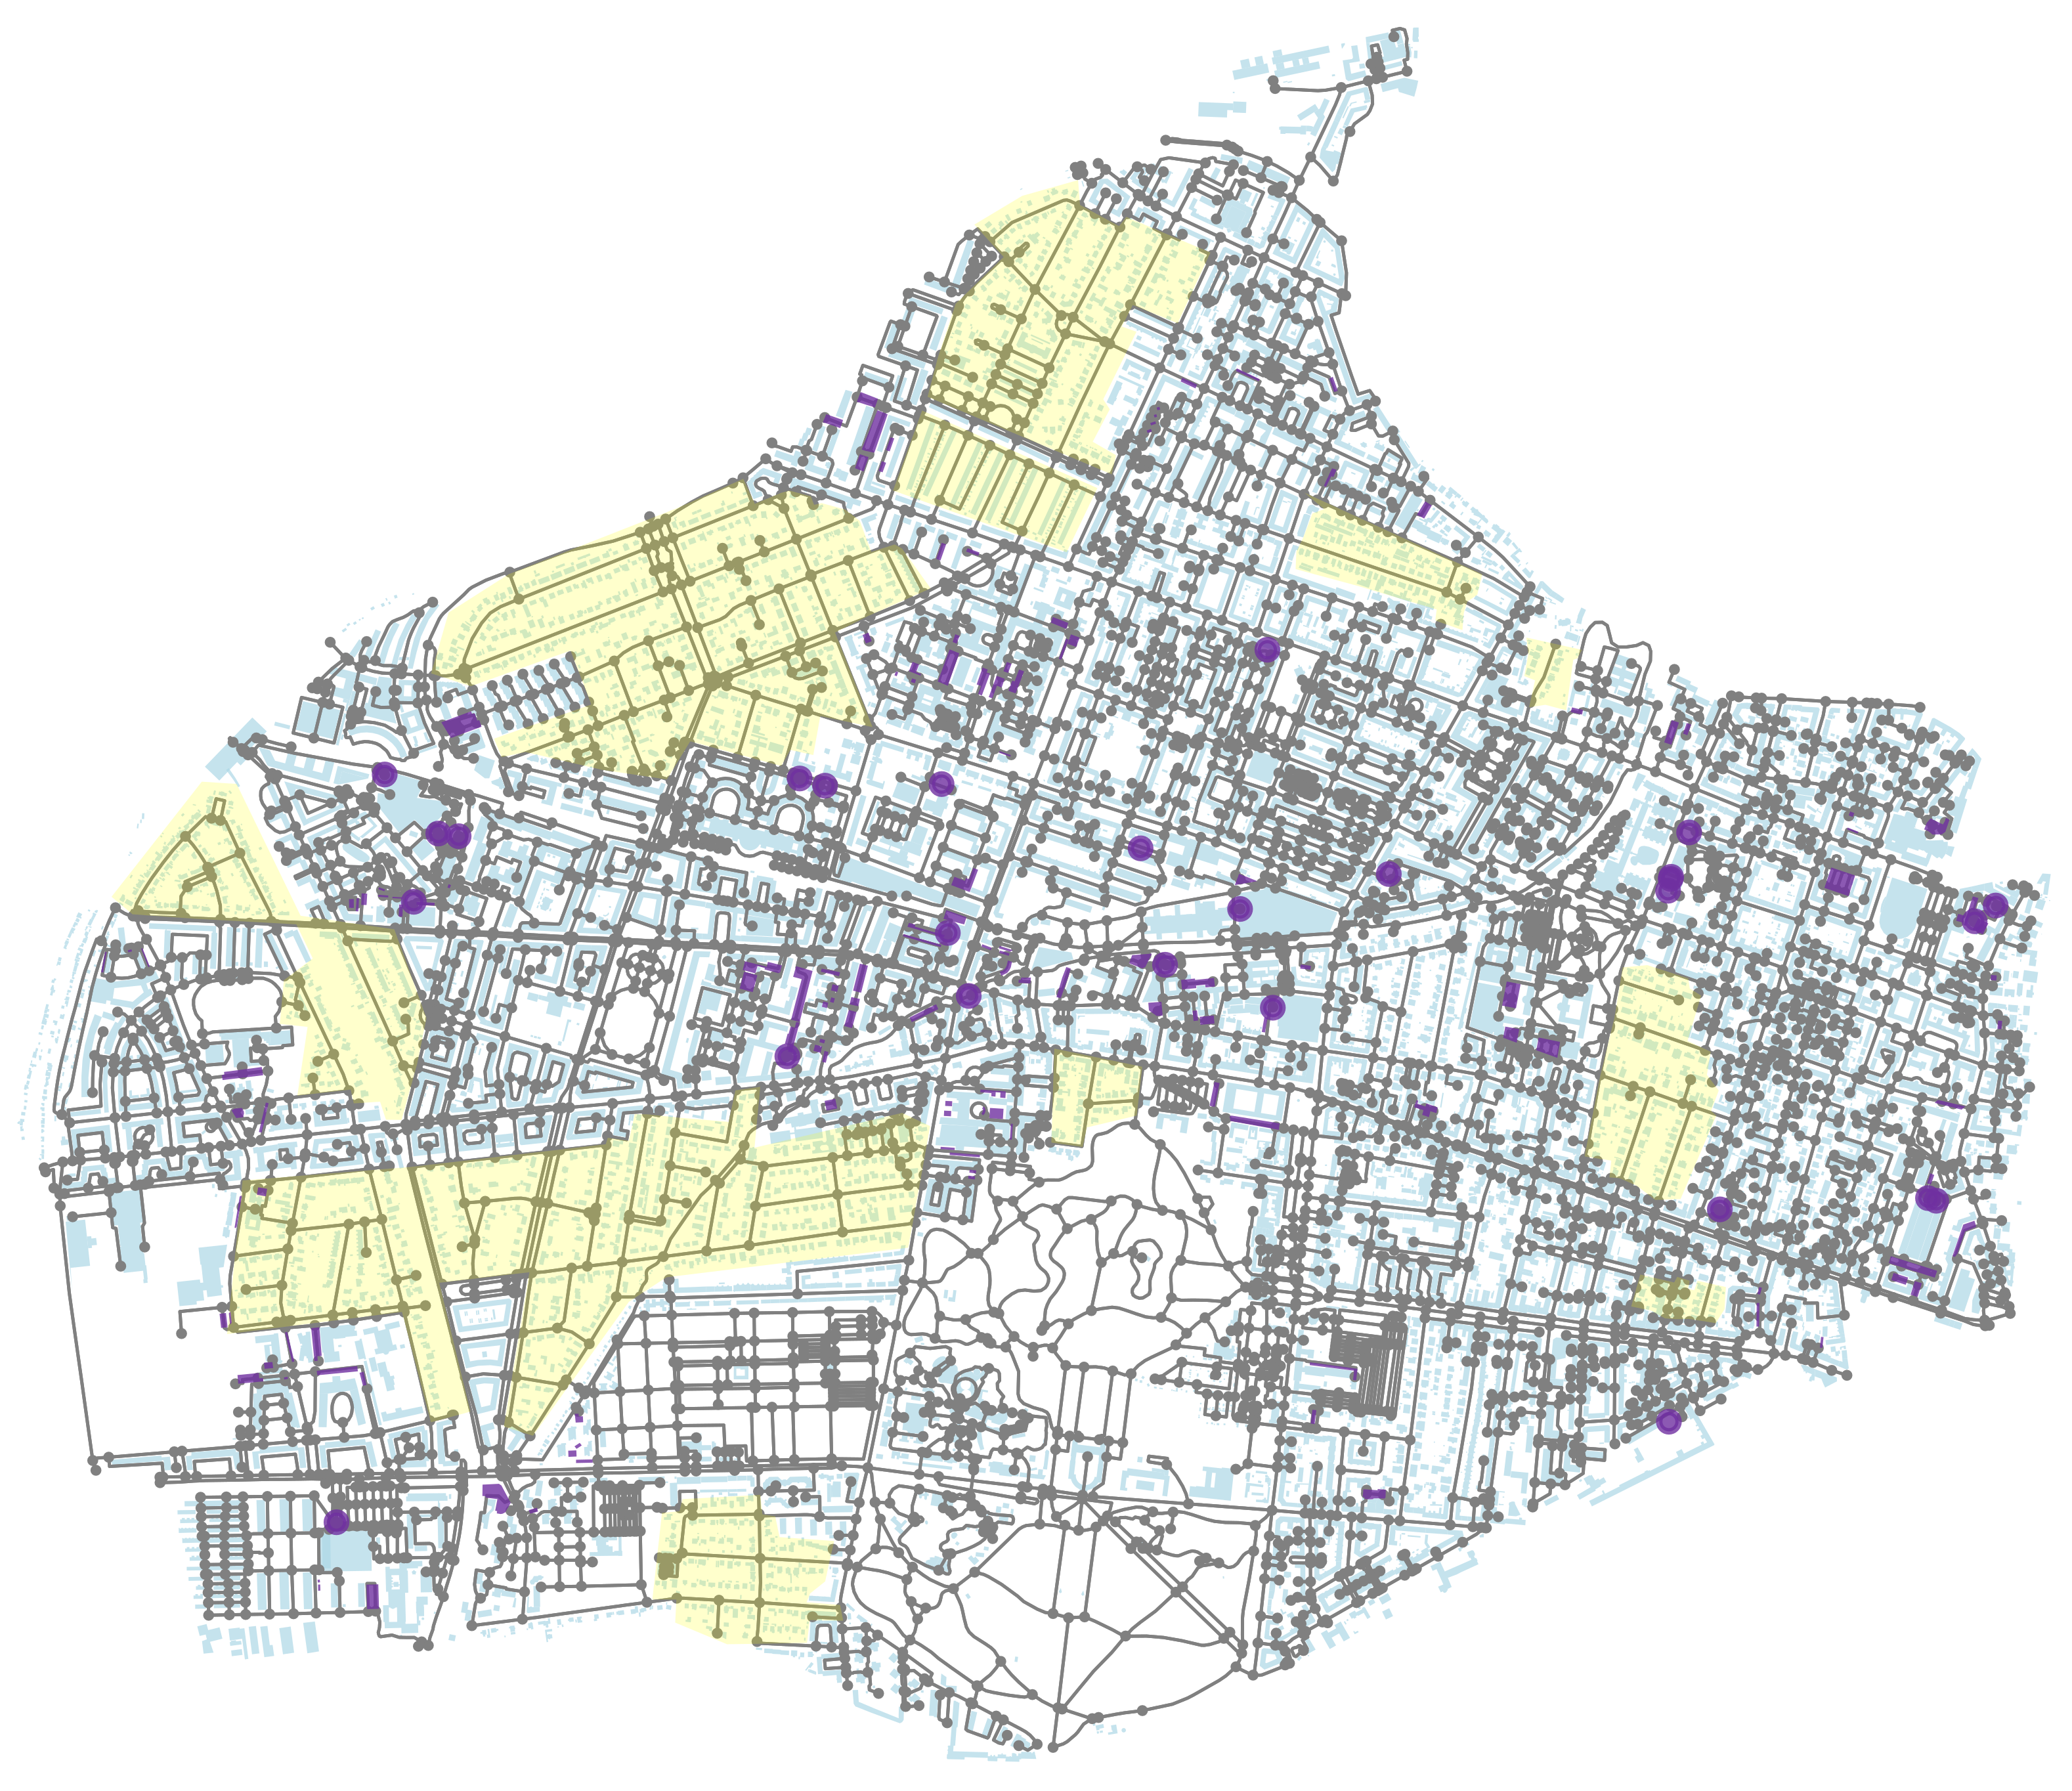
2.1. Power Distribution Network Modelling

The modelling software to analyze the PDN in Frederiksberg makes use of the Python package Pandapower. This package allows for a straightforward representation of the 10 kV PDN of Frederiksberg to simulate the power flow in the respective infrastructure. For the purpose of this paper, we focus the analysis on the 10/0.4 kV transformers and the respective feeding underground cables. The power grid network topology is defined based on data collected from the DSO for this area, Radius, which provided the location and characteristics of its transformers and respective cables. In normal operation, the PDN of Frederiksberg is divided into three independent networks labelled FRBi with i = {1, 2, 3}. Each PDN has its own main station 30/10 kV coupled to multiple feeders connecting the respective transformers. Additional connections between the PDNs exist, which can be deployed as tie-lines to connect the transformers in contingency scenarios. In this work, we only consider normal operation in which the three PDNs are operated independently. A brief description of the PDNs’ main characteristics is given in Table 1, and the layout is illustrated in Figure 2.

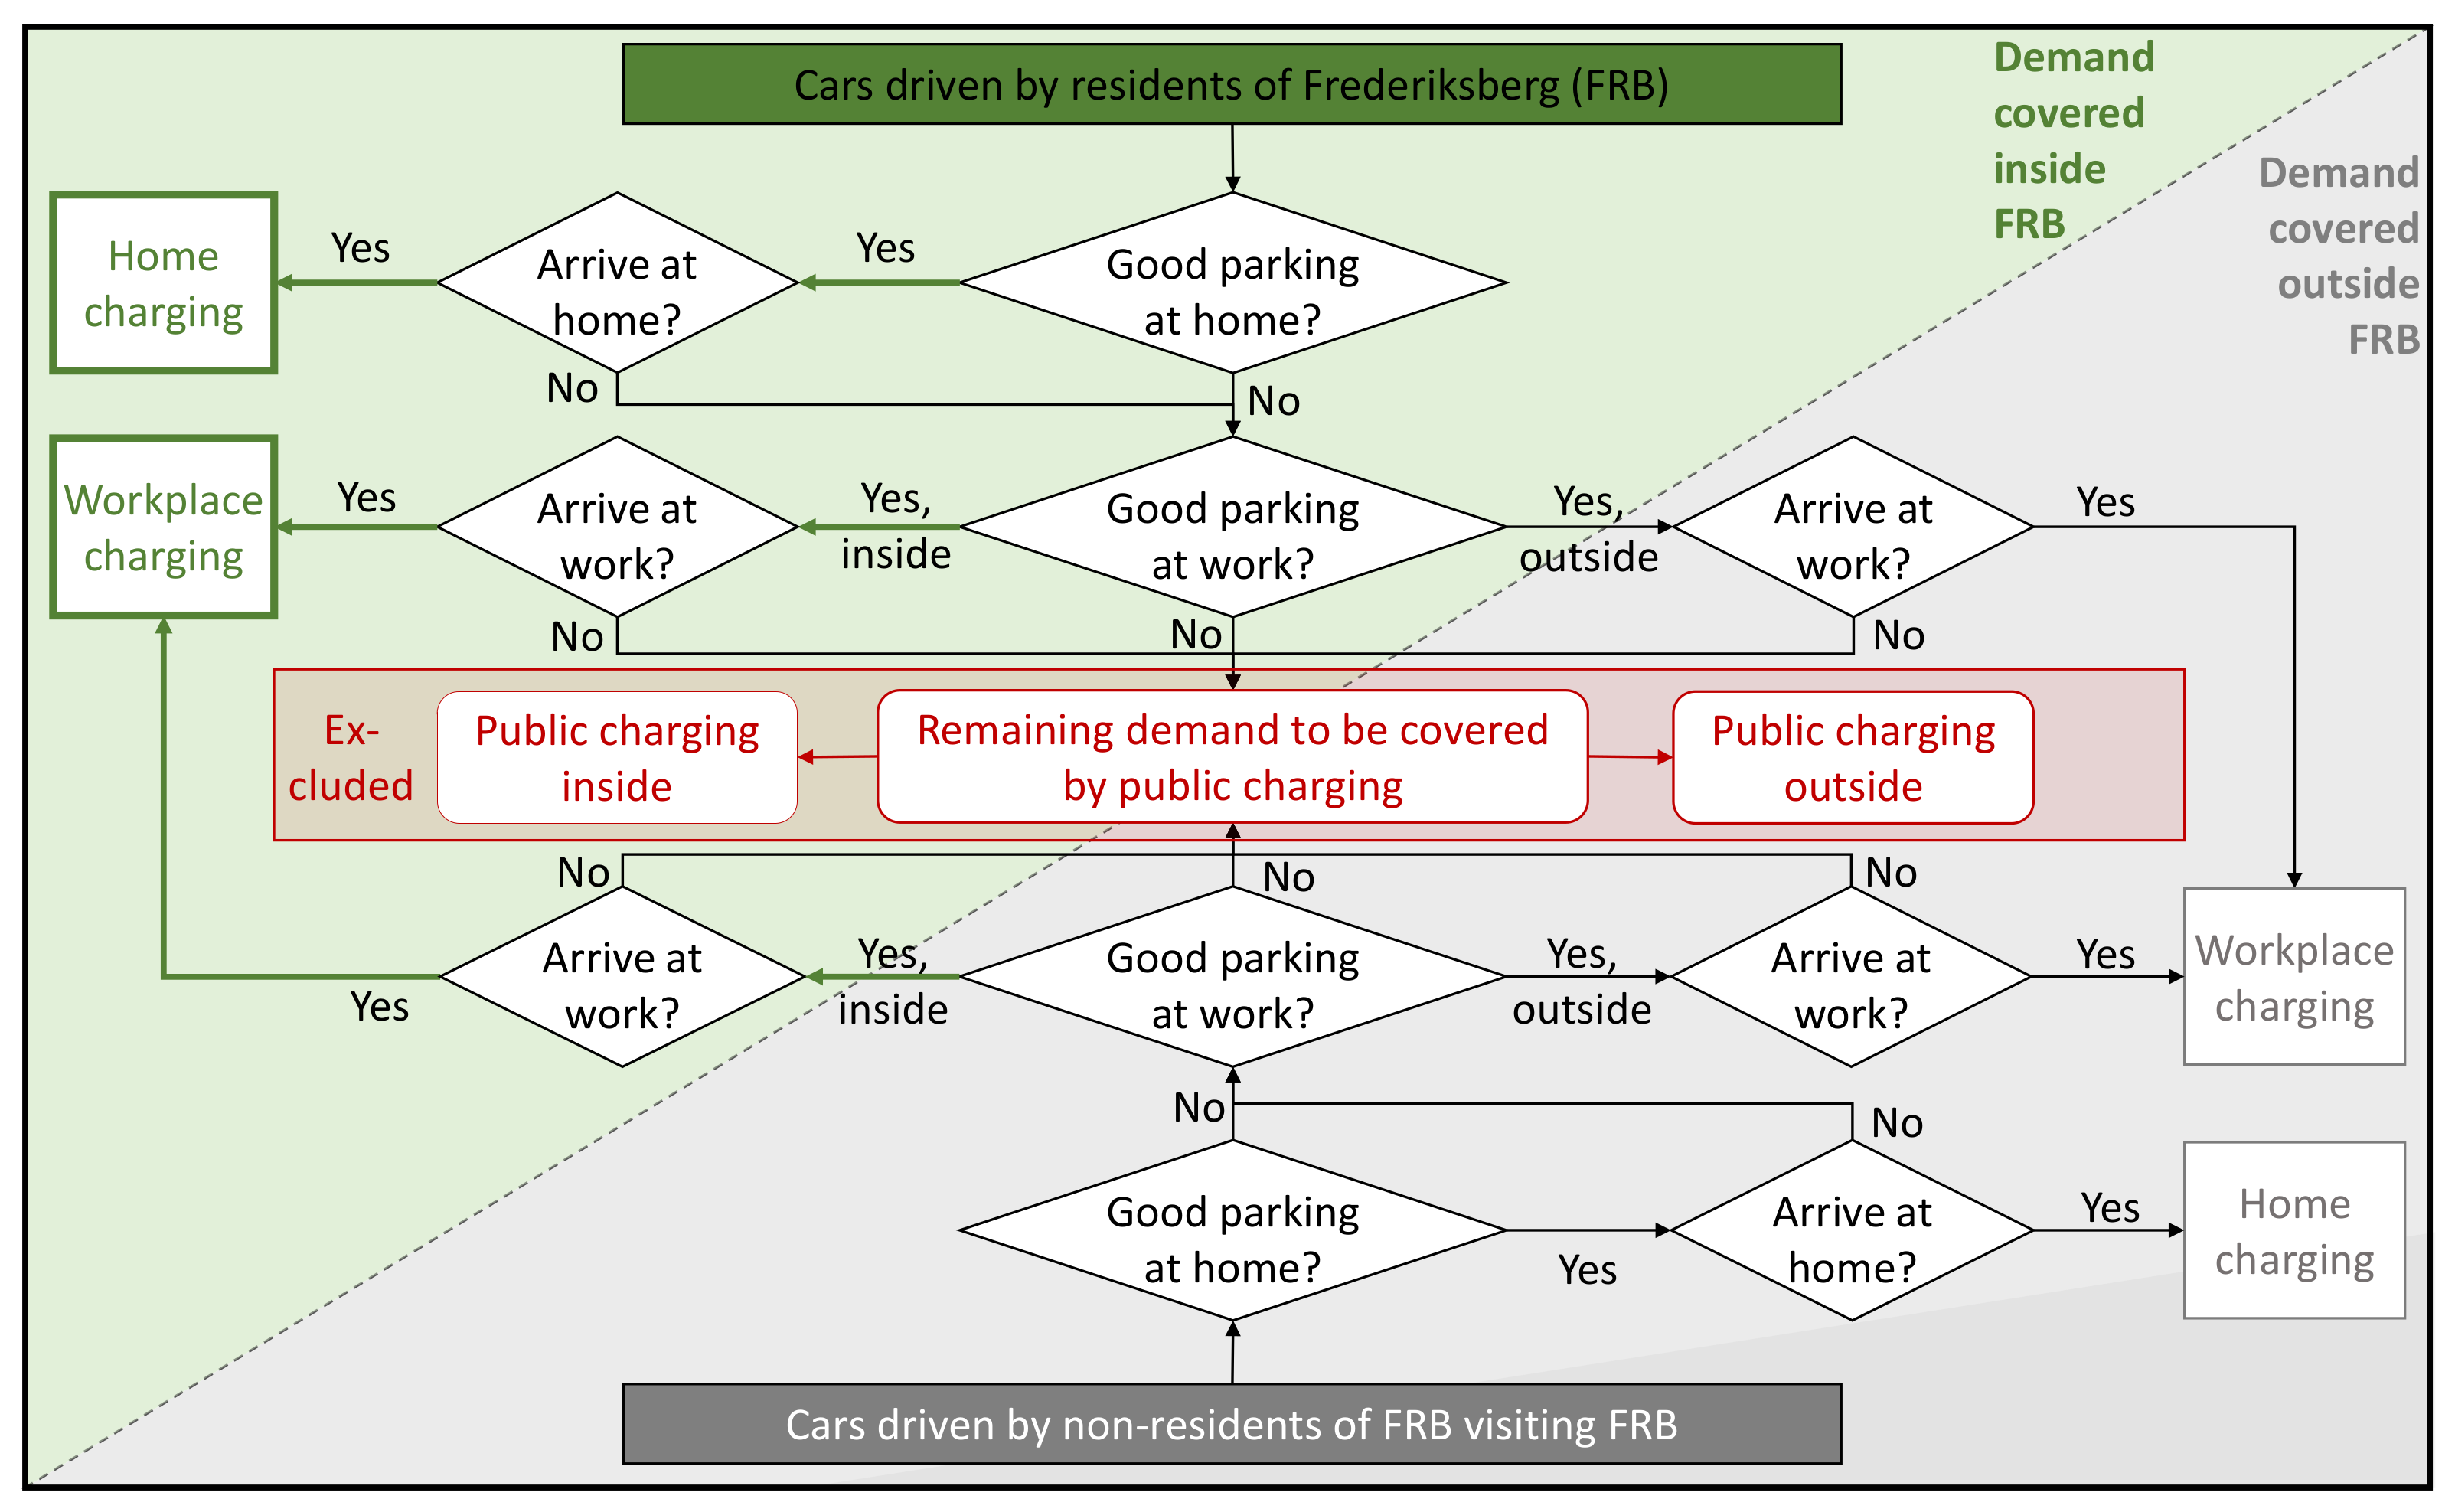
2.2. EV Charging Modelling

The evaluation of the daily EV demand is based on two pillars. The first is travel records (private car trips only) from the Danish national travel survey in the years 2006–2019 [36]. The second is the models for the decision to charge and steady-state SoC distributions introduced in [35], where the decision to charge is represented by a simple parametric model that takes as inputs only the SoC level and relative daily range, i.e., the ratio of daily-driven distance to the vehicle’s range. Moreover, this model can also be used to infer an initial steady-state distribution of SoC levels that is consistent with real-world utilization, thus preventing either under or overcharging due to poor representation of the initial SoC levels.
From the travel survey, we collected all travel records for private car utilization that visited Frederiksberg at least once, which defined the donor pool of representative travel records. Since the travel survey samples a small fraction of the population yearly, each record includes a calibration factor λ that ensures a representative picture of the population in each year. We used this calibration factor to generate an expanded pool of travel records, such that each donor record spawns λ records in the expanded pool. In this process, we utilized origin–destination traffic matrices to introduce random variation to the location of each activity in the expanded pool of records, while still preserving the traffic patterns. By making use of the information available, we characterized the records by home residency and workplace municipalities, the parking conditions and the type of day. The travel survey does not indicate the specific day for each record, rather it identifies the respective type of day. Normal weekdays, defined as Monday to Thursday where the next day is not a holiday or special day, comprise the bulk of the travel records, approximately 57.4 % of all records. The next largest subset of records concerns Fridays or weekdays prior to holidays, accounting for approximately 14.6 % . The remaining groups contain even smaller shares of the donor pool, making these susceptible to non-representative variations from outlier records. Therefore, we restricted our analysis to travel records from the largest group.
In addition, we leveraged the data on parking conditions at home and work to identify the potential access to home and workplace charging, which we used to categorize the records into non-overlapping subgroups, as depicted in Figure 3. Given the scarcity of records for EVs in the travel survey, we used records from vehicles with conventional drive-trains. For each record, we attributed a battery capacity based on a review of new EV specifications, assuming a fleet with a mean capacity of 68 kWh with a standard deviation of 18 kWh and set the mean rate of conversion for all records at η = 0.2 kWh/km.
The models introduced in [35] were then used to determine the required energy to meet travel requirements δ ε , the probability of charging at a given day p d , as well as the mean interval between charging events d p .

2.2.1. Classification of Travel Records

The distribution of the charging events was determined by a hierarchical filtering process, based on the parking conditions at home and work, as well as the travel diaries details, as depicted in Figure 3. To begin with, we segregated the records according to the residency municipality to identify the share of charging events from residents and the demand emerging from visitors. The visitors comprise any person that at any point in their travel record drives into the selected municipality. Then, we started the hierarchical filtering process. First, we assessed the parking conditions at home as indicated in the travel survey [36]. For those with reliable access to parking at their premises (i.e., in carport/garage or in the front yard/driveway) or on/next to the property (i.e., reserved, always or normally space parking), we inferred that home charging will be available to such drivers. If the travel records indicate that the vehicle returns home on that day, we attributed the demand from this record to home charging. Second, remaining records were then screened for good parking conditions at work. Those include a permanent parking space provided by the employer, as well as free parking, defined as always or normally available. By the same token, we attributed workplace charging if the travel records indicated a visit to the workplace on that day. Since the workplace municipality can be different from the residency, we accounted for the contribution inside and outside Frederiksberg. The remaining demand was assigned to charging using the public infrastructure and was exempt from our impact analysis within this work. It is worth noting that we are likely overestimating the penetration of home and workplace charging by assuming that everyone who has conditions to have a charger will install one. Hence, the results shown in this paper should be interpreted as upper bounds to the share of charging demand met at home and the workplace.

2.2.2. Charging Scenarios and Energy Demand

Even though the market share of EVs in Denmark remains low so far [37], for the purpose of this paper, we considered an ambitious scenario of full electrification of the private passenger car fleet of the year 2020, i.e., 24,252 cars [38]. Assuming a homogeneous distribution of EVs at the national level and present-day traffic patterns, we should expect in this scenario that the total number of EVs transiting in Frederiksberg daily reaches N t = N r + N v = 59,070, where N r = 24,252 and N v = 34,818 are the number of EVs from residents and visitors, respectively. To ensure a representative load profile, we randomly sampled travel records for each day in the power flow simulation, collecting N r residents and N v visitors. We collected travel records for 40 weekdays of peak loading to be discussed in more detail in Section 2.4.
Based on this set of records, we ran five base scenarios S i for EV charging to analyze the impact on the PDN, namely:
  • ( S 1 ) uncontrolled non-daily charging,
  • ( S 2 ) uncontrolled daily charging,
  • ( S 3 ) time-synchronized non-daily charging,
  • ( S 4 ) time-synchronized daily charging, and
  • ( S 5 ) time-and day-synchronized non-daily charging.
The first and second scenarios concern unconstrained charging, in which no management is imposed on the charging process and the EVs charge upon arrival. S 1 sets a baseline for the charging demand, in which drivers charge δ ε with a mean interval of d p days, according to the decision model and steady-state demand introduced in [35]. In this scenario, only a subset of EVs charge on a given day, as determined by the aforementioned decision model. It is worth noting that most EVs will charge on a non-daily basis, yet a small portion could require daily charging. Hence, we refer to the charging pattern determined by the decision model as non-daily charging behavior. In contrast, S 2 probes the impact of satisfying the energy demand on a daily basis, i.e., charging δ ε / d p every day. In this scenario, we forced all EVs to charge their daily demand independent of the decision model. The impact of high charging simultaneity was addressed in the remaining scenarios. Scenarios S 3 and S 4 follow the charging patterns of scenarios S 1 and S 2 , respectively, but the charging process is controlled and only allowed to start, if altogether possible, after the coordination signal time. Both scenarios illustrate intraday synchronization (labelled as T.S. for time-synchronization), where the charging starts simultaneously for the EVs that will charge on the given day. In brief, scenarios S 3 and S 4 concern different levels of demand. In S 3 , the demand is governed by the steady-state model, which leads to a fraction of the total EVs charging each day to cover their multi-day energy demand. In contrast, S 4 concerns a scenario where each EV charges daily the amount required to satisfy its daily demand. For large fleets, the aggregated energy demand in both cases should be similar, but distributed over a much larger number of vehicles in S 4 than in S 3 . Conversely, the duration of charge events is considerably smaller in S 4 than in S 3 . Hence, S 4 represents the potential peak power demand. Finally, S 5 simulates an extreme demand case as a combination of S 3 and S 4 . This scenario should be understood as a worst-case scenario which explores peak power and peak energy demand in a single day. In this scenario, all EVs charge their steady-state demand δ ε as in S 3 (i.e., the demand accumulated since the last charge) on the same day as in S 4 , thus representing the extreme case of synchronizing charging on the same day at the same time (labelled as T.D.S. for time- and day-synchronization). For large fleets of EVs driving different distances every day, such a scenario should be extremely unlikely, as it would require a commensurate alignment of the steady-state charging cycle of all vehicles.
In scenarios S 1 and S 3 , the number of charging events is determined by the probability p d of each EV charging on a given day, as defined in [35]. For the purpose of this paper, we drew a random number from a uniform distribution in the interval r [ 0 , 1 ] and defined the acceptance criteria for the decision to charge as r p d . Consequently, the number of charging events in said scenarios was stochastic in nature and smaller than the number of events in the remaining scenarios. Conversely, in the remaining scenarios, we observed as many charging events as records matching the filtering criteria depicted in Figure 3.
A summary of the maximum number of home N H and workplace N W charging events and the respective charged energy is presented in Table 2, where the total charging demand for j charging events at the location X for S 1 , S 3 and S 5 is defined as E X = j δ ϵ j and for S 2 and S 4 as E X = j δ ϵ j / d p .
Having identified the EV demand and number of charging events for each scenario, we will now focus our attention on the simulation of the charging events.

2.2.3. Simulation of Charging Events

In this paper, we are interested in the power grid impact of normal AC charging. Recently released EV models are converging towards supporting three-phase 11 kW AC charging, in line with the most common configuration of normal charging stations in Denmark. We frame our analysis assuming a large EV fleet capable of fully utilizing this type of infrastructure. Hence, throughout this paper we consider the charging power to be 11 kW, regardless of the scenario under analysis and the EV’s SoC. Therefore, the charging duration is determined by dividing the required energy by the constant charging power.
Given the daily variation of demand on the PDN, we consider different scenarios for charging control according to a broadcasting control signal or a common objective. For home charging, we consider two sub-scenarios, namely a and b. In sub-scenario a, the control signal delays the start of charging until midnight, i.e., 24:00 (00:00 of the next day), whereas sub-scenario b delays charging until 18:00. Scenario a was devised to illustrate the impact of charging synchronization due to a simultaneous response to price variations, such as to distribution network tariffs where the low price period starts at midnight [25]. Conversely, scenario b was chosen to illustrate the impact of EV charging during the peak loading period. Although such a scenario is rather unlikely, it could occur when controlling charging to provide ancillary services to the transmission system or through malicious manipulation of charging as a result of cyberattacks. During working hours, we consider only one synchronization control signal that takes place at 10:00 and affects only vehicles charging at the workplace. Therefore, the start of charging at a location X is defined as t s , X = max ( t c , X , t a , X ) , where t c , X is the synchronization control signal time (for uncontrolled charging in S 1 and S 2 we set t c , X = 00:00) and t a , X is the arrival time at the location. When travel records include multiple visits to home or workplace, we select the arrival time as follows: for home charging we consider the last arrival, whereas for workplace we take the first. Vehicles visiting the home location during the day, but not terminating the day at home, are exempted from the synchronization and start charging immediately upon arrival.
A set of labels was introduced to distinguish home from workplace charging strategies, namely H i and W i , as the sub-scenarios a and b only apply to home charging. A summary of the configuration of each scenario can be found in Table 3. Charging events were simulated over a period of 24 h in 15 min resolution starting at 05:00 on the given day to be able to both capture early charging at work and late charging at home without compromising capturing the majority of EV demand throughout one day. Furthermore, it is worth noting that some records encompass parking durations that are insufficient to fully charge the EV. While scarce and mostly affecting workplace charging, our simulations force vehicles to complete charging.

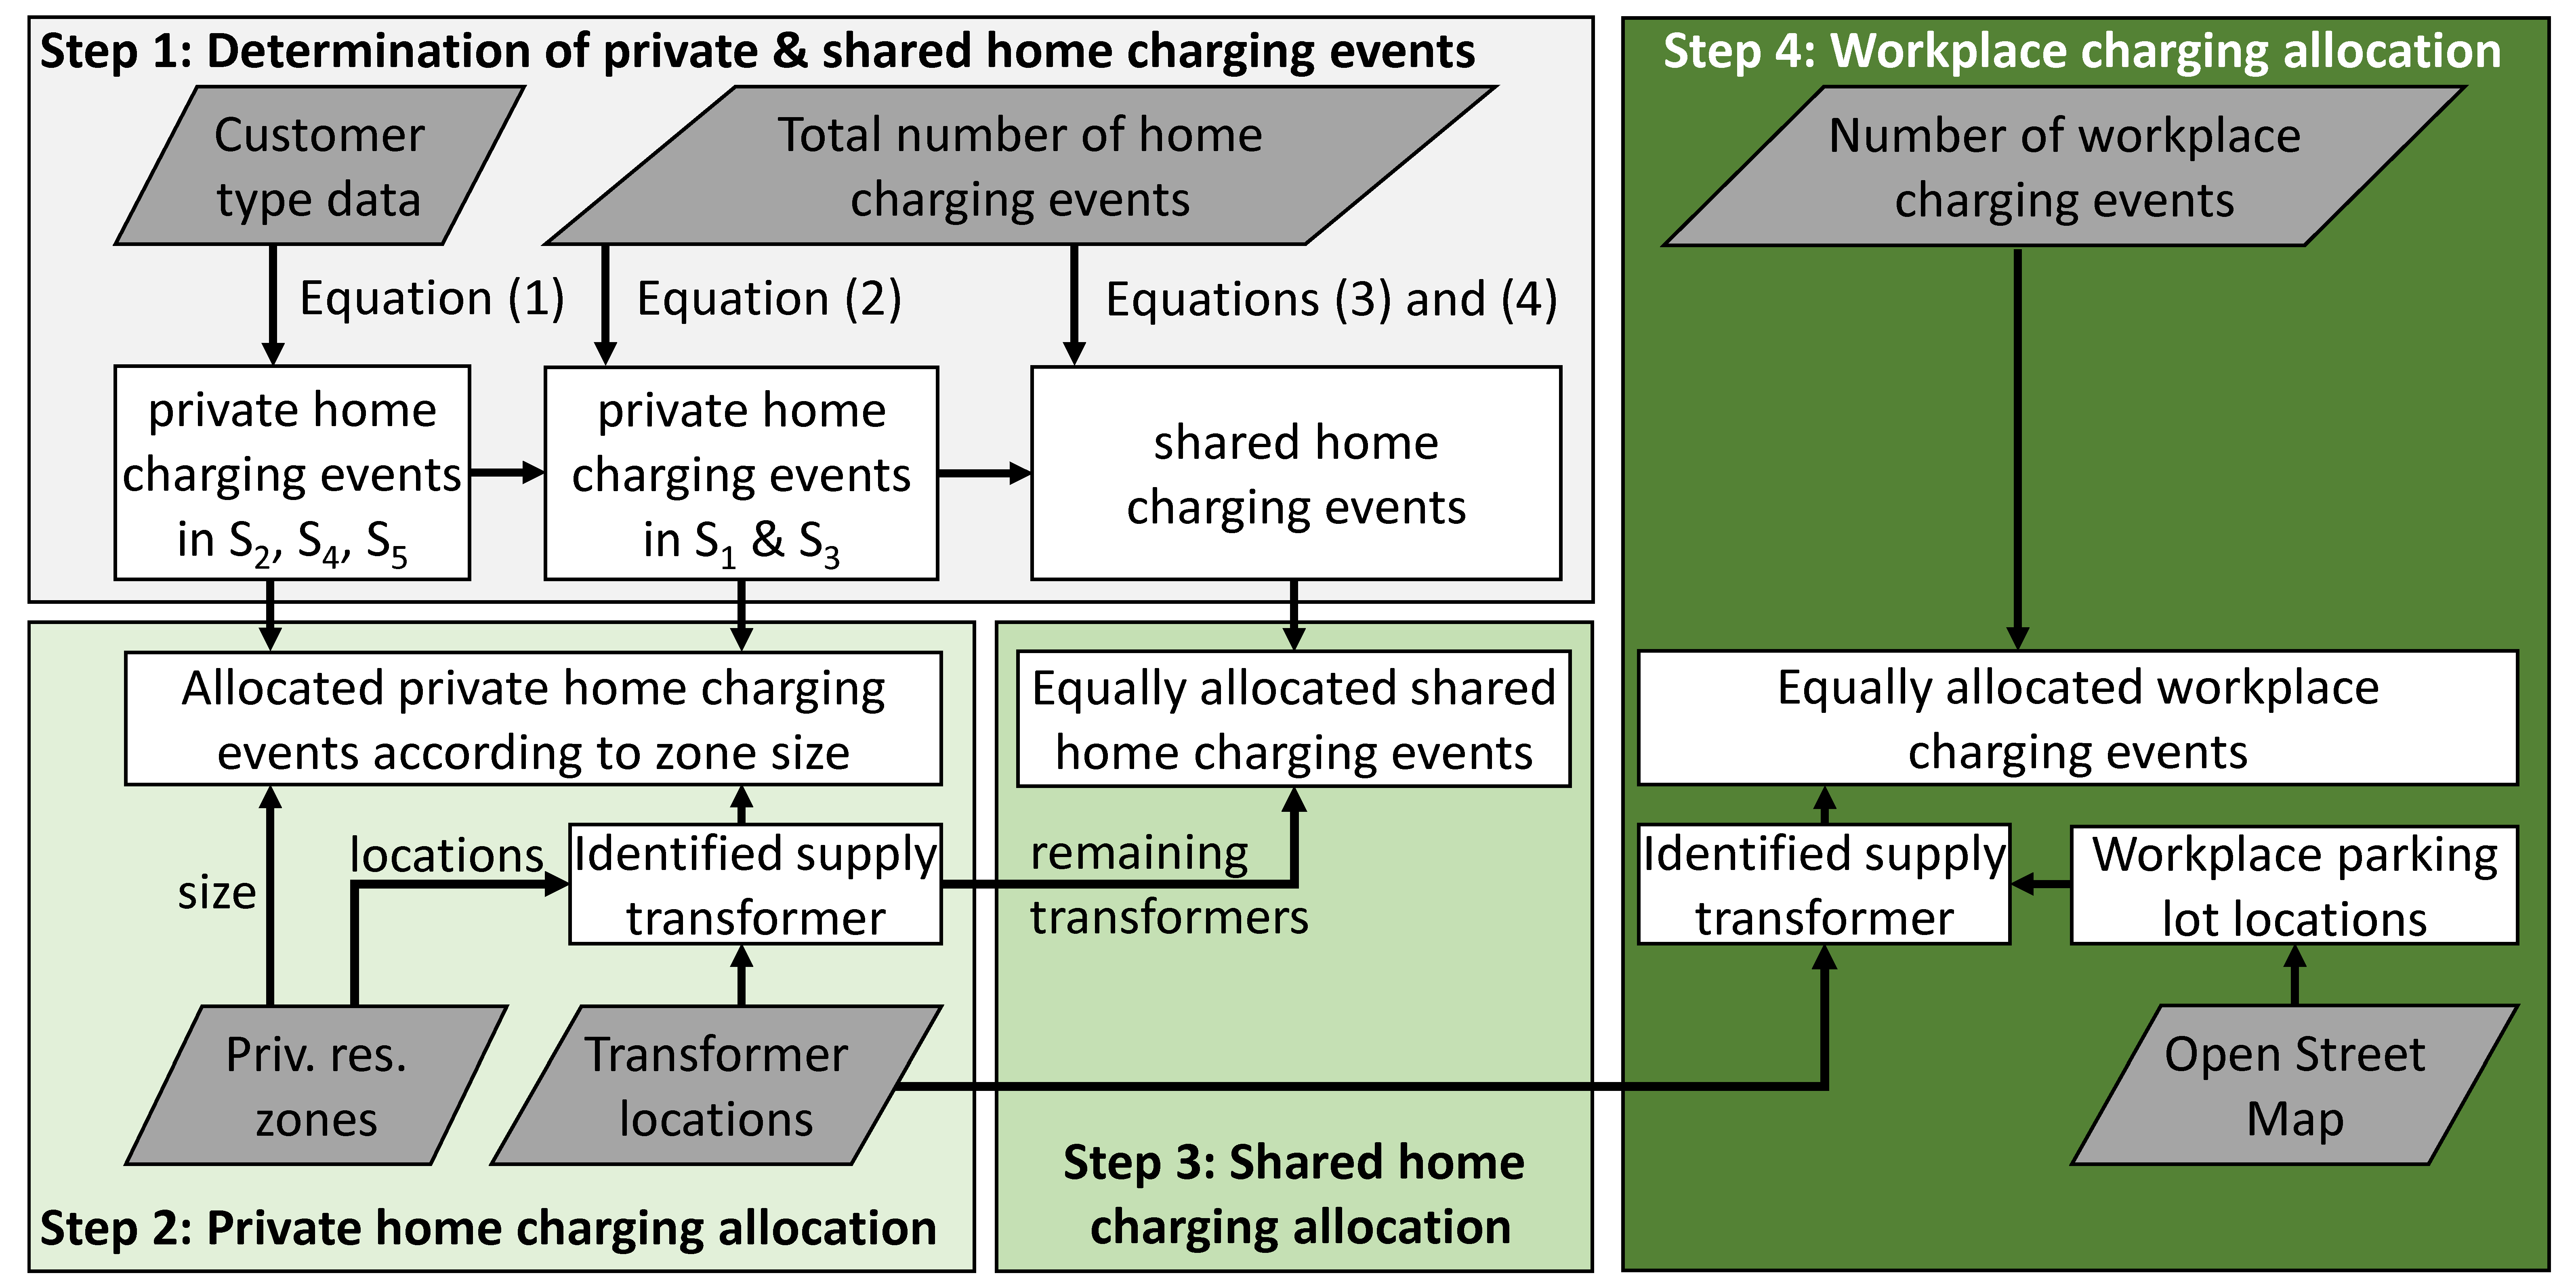
2.3. Allocation of Charging Events to the Power Distribution Network

Having modelled the PDN topology as discussed in Section 2.1 with its tripartite nature, we now have to allocate the charging events to the different transformers. The PDNs under consideration contain multiple classes of transformers, ranging from public to private (owned by consumers) and finally reserve. For the purpose of our simulations, we only allocated charging events to transformers from the public infrastructure. The remaining transformers were accounted for in the simulation, but no additional EV load was added. The distribution of charging events also accounted for the type of housing associated with home charging, such that private home charging was mapped to single-family infrastructure (i.e., detached, semi-detached or terraced houses) and shared home charging was associated with denser housing infrastructure, e.g., apartment blocks. The allocation procedure was based on an analysis of the topology of Frederiksberg municipality, with the aim to identify the areas that are primarily dedicated to workplace parking and private residential housing areas, as illustrated in Figure 4.
This procedure can be summarized in four broad steps, as shown in Figure 5.
First, we divided home charging events according to the type of charging infrastructure used, i.e., private or shared. Based on customer type data provided by the DSO, we inferred that the number of daily private home charging events N H , p during one day in S 2 , S 4 and S 5 equates roughly to 80% of the total number of private houses H p in Frederiksberg (detached, semi-detached or terraced), as described in Equation (1).
N H , p S 2 , 4 , 5 = H p 0.8 .
for S 1 and S 3 , the number of private home charging events needed to be reduced to account for the fact that fewer EVs will charge on the given day. To achieve such a task, as shown in Equation (2), the number of private home charging events was multiplied with the ratio between the total number of home charging events in S 1 / S 3 and the total number of home charging events in S 2 / S 4 / S 5 .
N H , p S 1 , 3 = N H , p S 2 , 4 , 5 N H S 1 , 3 / N H S 2 , 4 , 5   .
the number of shared home charging events N H , s h was then calculated as the difference between total and private home charging events accordingly, namely
N H , s h S 2 , 4 , 5 = N H S 2 , 4 , 5 N H , p S 2 , 4 , 5   ,
N H , s h S 1 , 3 = N H S 1 , 3 N H , p S 1 , 3   .
In the second step, we considered the allocation of private home charging events. The respective charging events are distributed to the transformers that supply residential zones with predominantly single-family houses. This attribution is based on the overlap of single-family housing zones (including a vicinity buffer) and the location of the transformers, with the number of events being proportional to the relative size of the respective housing zone. The third step concerned the allocation of shared home charging. Shared home charging events were distributed uniformly over the remaining transformers, i.e., those that do not supply single-family housing zones. The fourth step handled the allocation of the load from workplace charging. It began with the identification of transformers that can supply this load, based on the locations of workplace parking lots near company or institution offices and other intensive labor locations. This part of the procedure relied on public data collected from OpenStreetMap. Workplace charging events were then allocated to the nearest transformers using the shortest path between the transformer and respective location, according to the real road and public walking paths in Frederiksberg. Finally, it is important to note that the allocation procedure has to be repeated for each simulation scenario and simulated day, as the number of charging events is dependent on the configuration of each scenario and sampled records.
A summary of the maximum number of charging events allocated to each of the three PDNs is depicted in Table 4. In addition, we observed that the amount of charging events allocated to a single transformer in scenarios S 1 and S 3 were in the following ranges: 2 to 25 for private home, 11 to 12 for shared home and 18 to 19 for workplace charging events. In scenarios S 2 , S 4 and S 5 , the number of events increased considerably, but private homes continued to exhibit the largest interval and shared and workplace exhibited minimal variation as in the other scenarios. The respective ranges read: 11 to 108 private home, 51 to 52 shared home and 65 to 66 workplace charging events.

2.4. Power Flow Simulation and Reinforcement Cost Calculation

The power flow simulation is a computationally demanding problem to solve. Since the PDN needs to be properly dimensioned for the days of highest loading, we made use of the provided power consumption data for 2020 to select all days in which at least one transformer experienced its maximum loading. Based on this criterion, we identified a total number of 67 days of peak load, which fell within the periods January–March and August–December. Furthermore, as discussed in Section 2.2, we considered only normal weekdays. By this token, the size of the identified pool was further reduced to 40. By focusing on this reduced sample, we were able to effectively reduce the computational load and analyze multiple EV charging scenarios.
To be able to assess the EV impact on the PDNs, both in terms of voltage deviations and transformer and cable overloading, the provided baseload and estimated EV load were aggregated for each transformer within the networks. The baseload data for each transformer is only available in hourly resolution. Hence, we made use of cubic interpolation to infer the load in a 15 min timescale. Moreover, as previously mentioned, the EV demand was modelled for a period of 24 h starting at 05:00 on the given day of peak load. Thus, the baseload of the PDNs was chosen accordingly within the same period. While the baseload varies according to the day, the estimated EV load also exhibits variation for each day due to the sampling, as discussed in Section 2.2. It is worth noting that the reactive power of EV charging is neglected within this work. Finally, the Newton–Raphson method was used for the power flow simulation of each selected day in 15 min resolution.
To assess the reinforcements cost associated with the overloading of transformer and cables observed in our simulations, we assumed a typical cost of 133 k€/km for cable and 21.64 k€ for transformer replacements, as used in Refs. [39,40].

3. Results

Having discussed the methodology of the paper, this section is dedicated to the main results of our work. Here, we address the findings for both the EV and aggregated demand, as well as the power flow simulation.

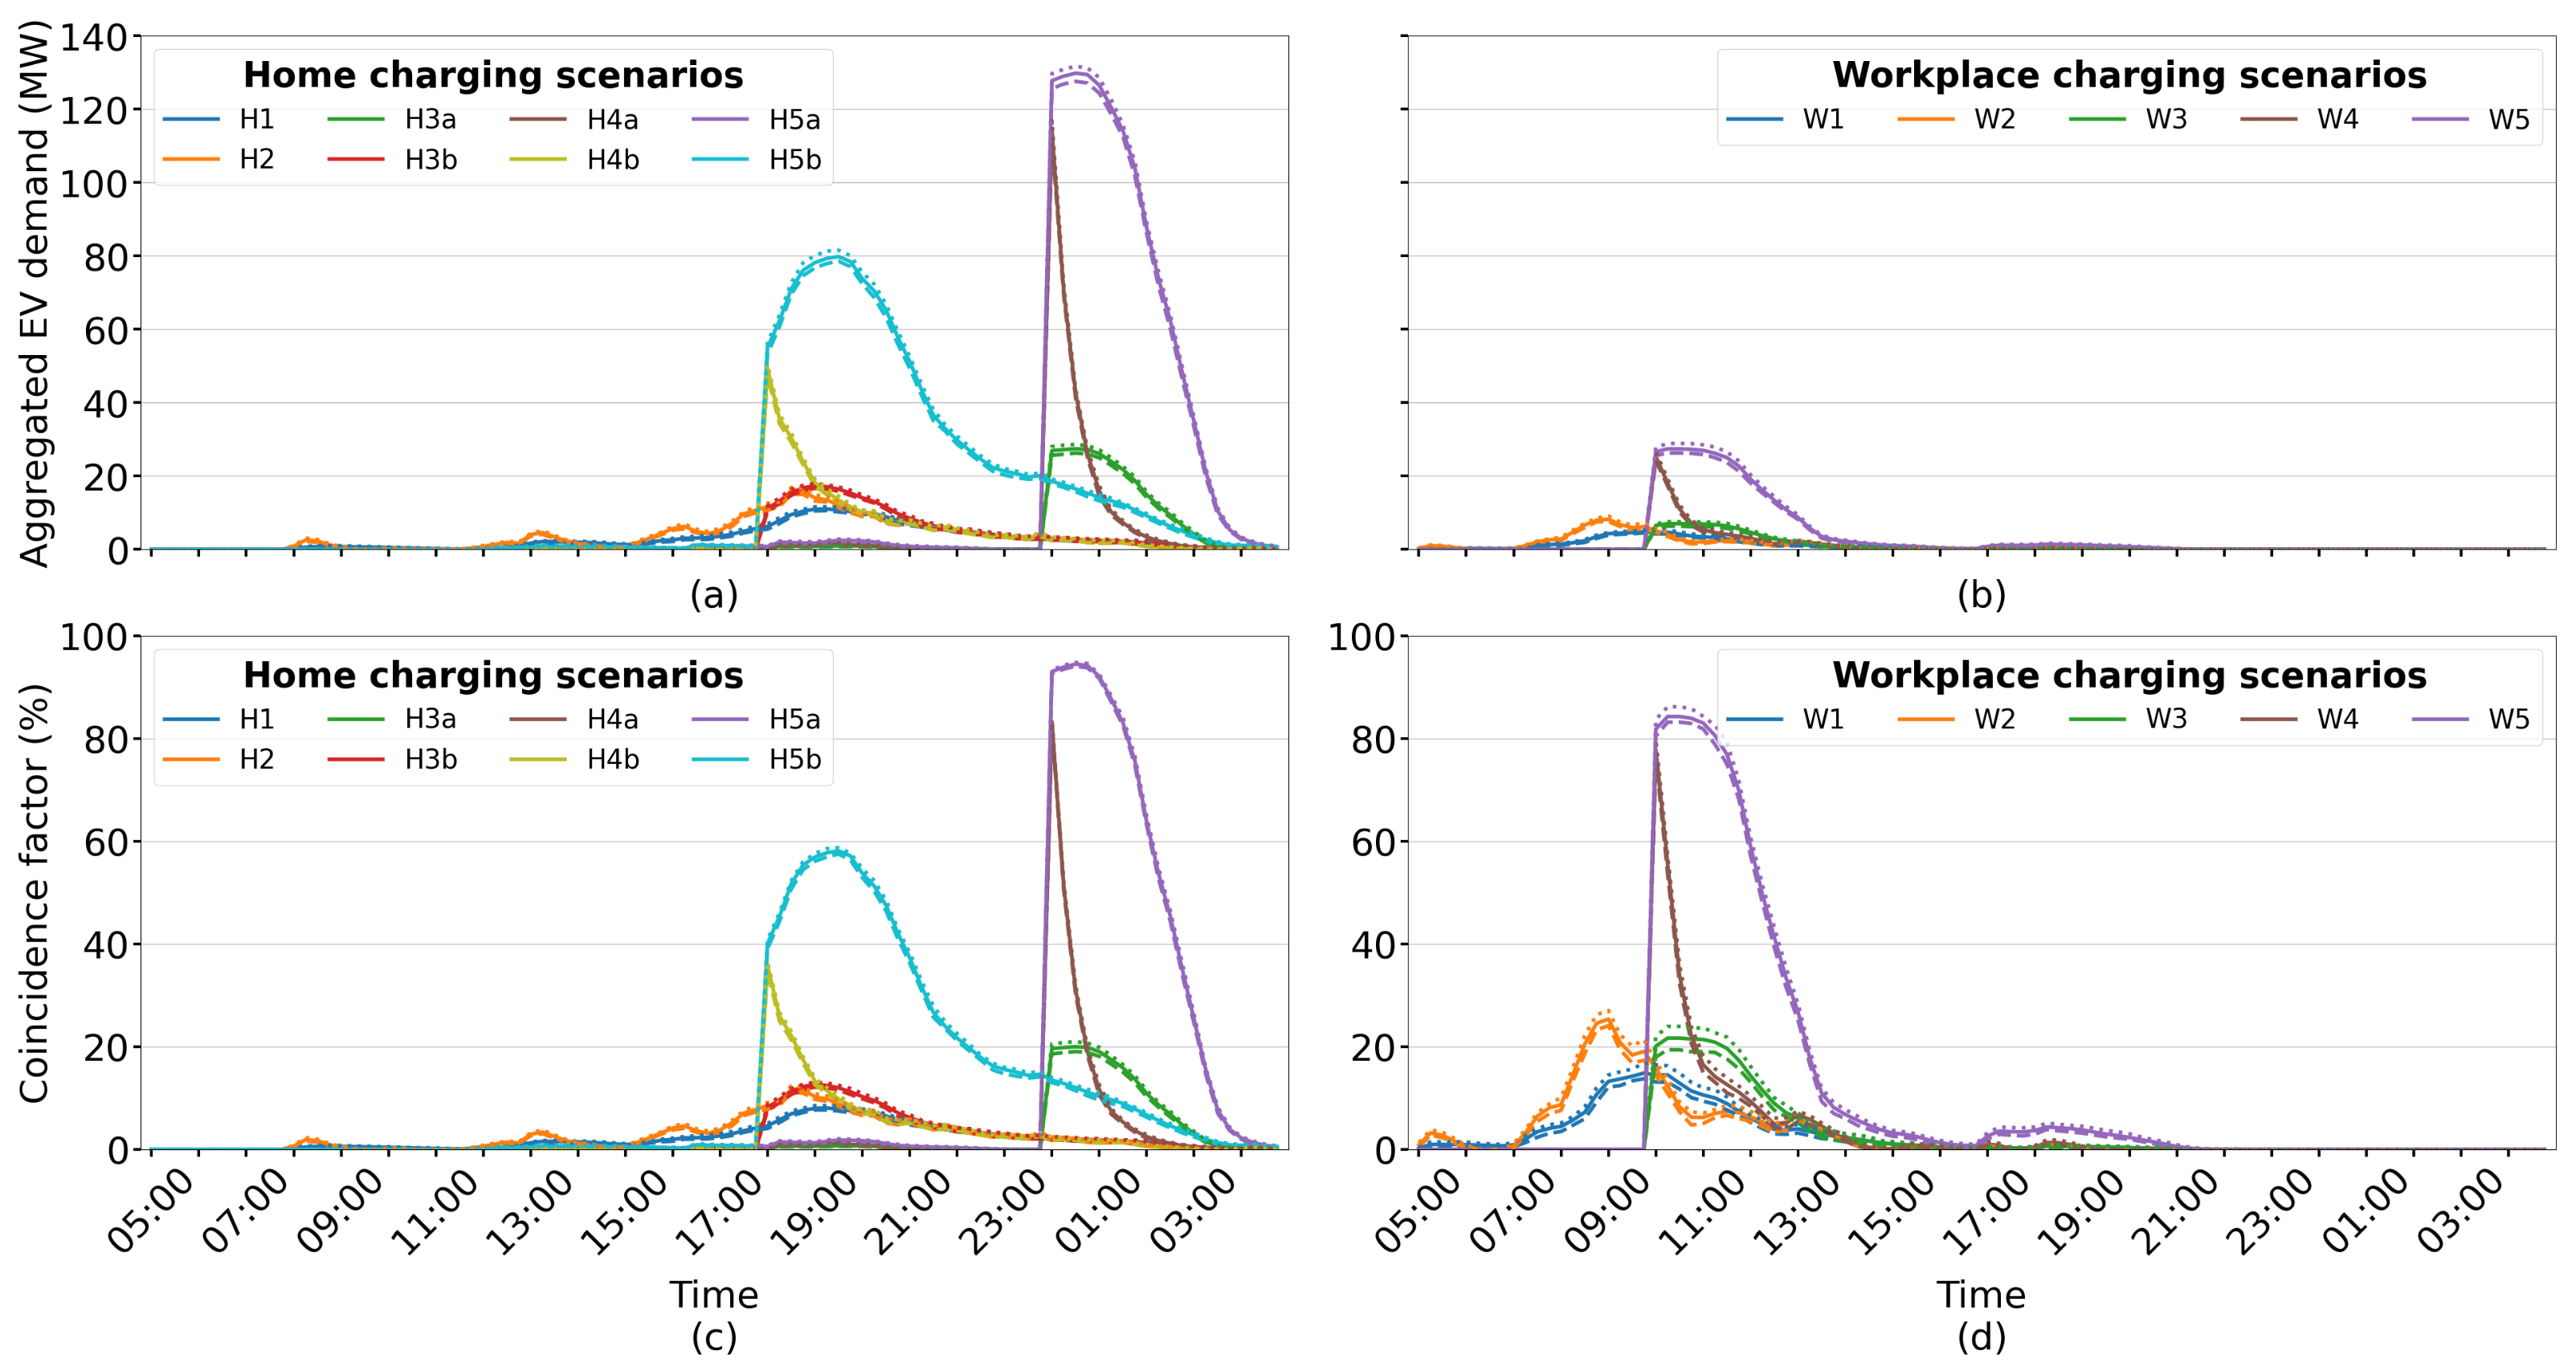
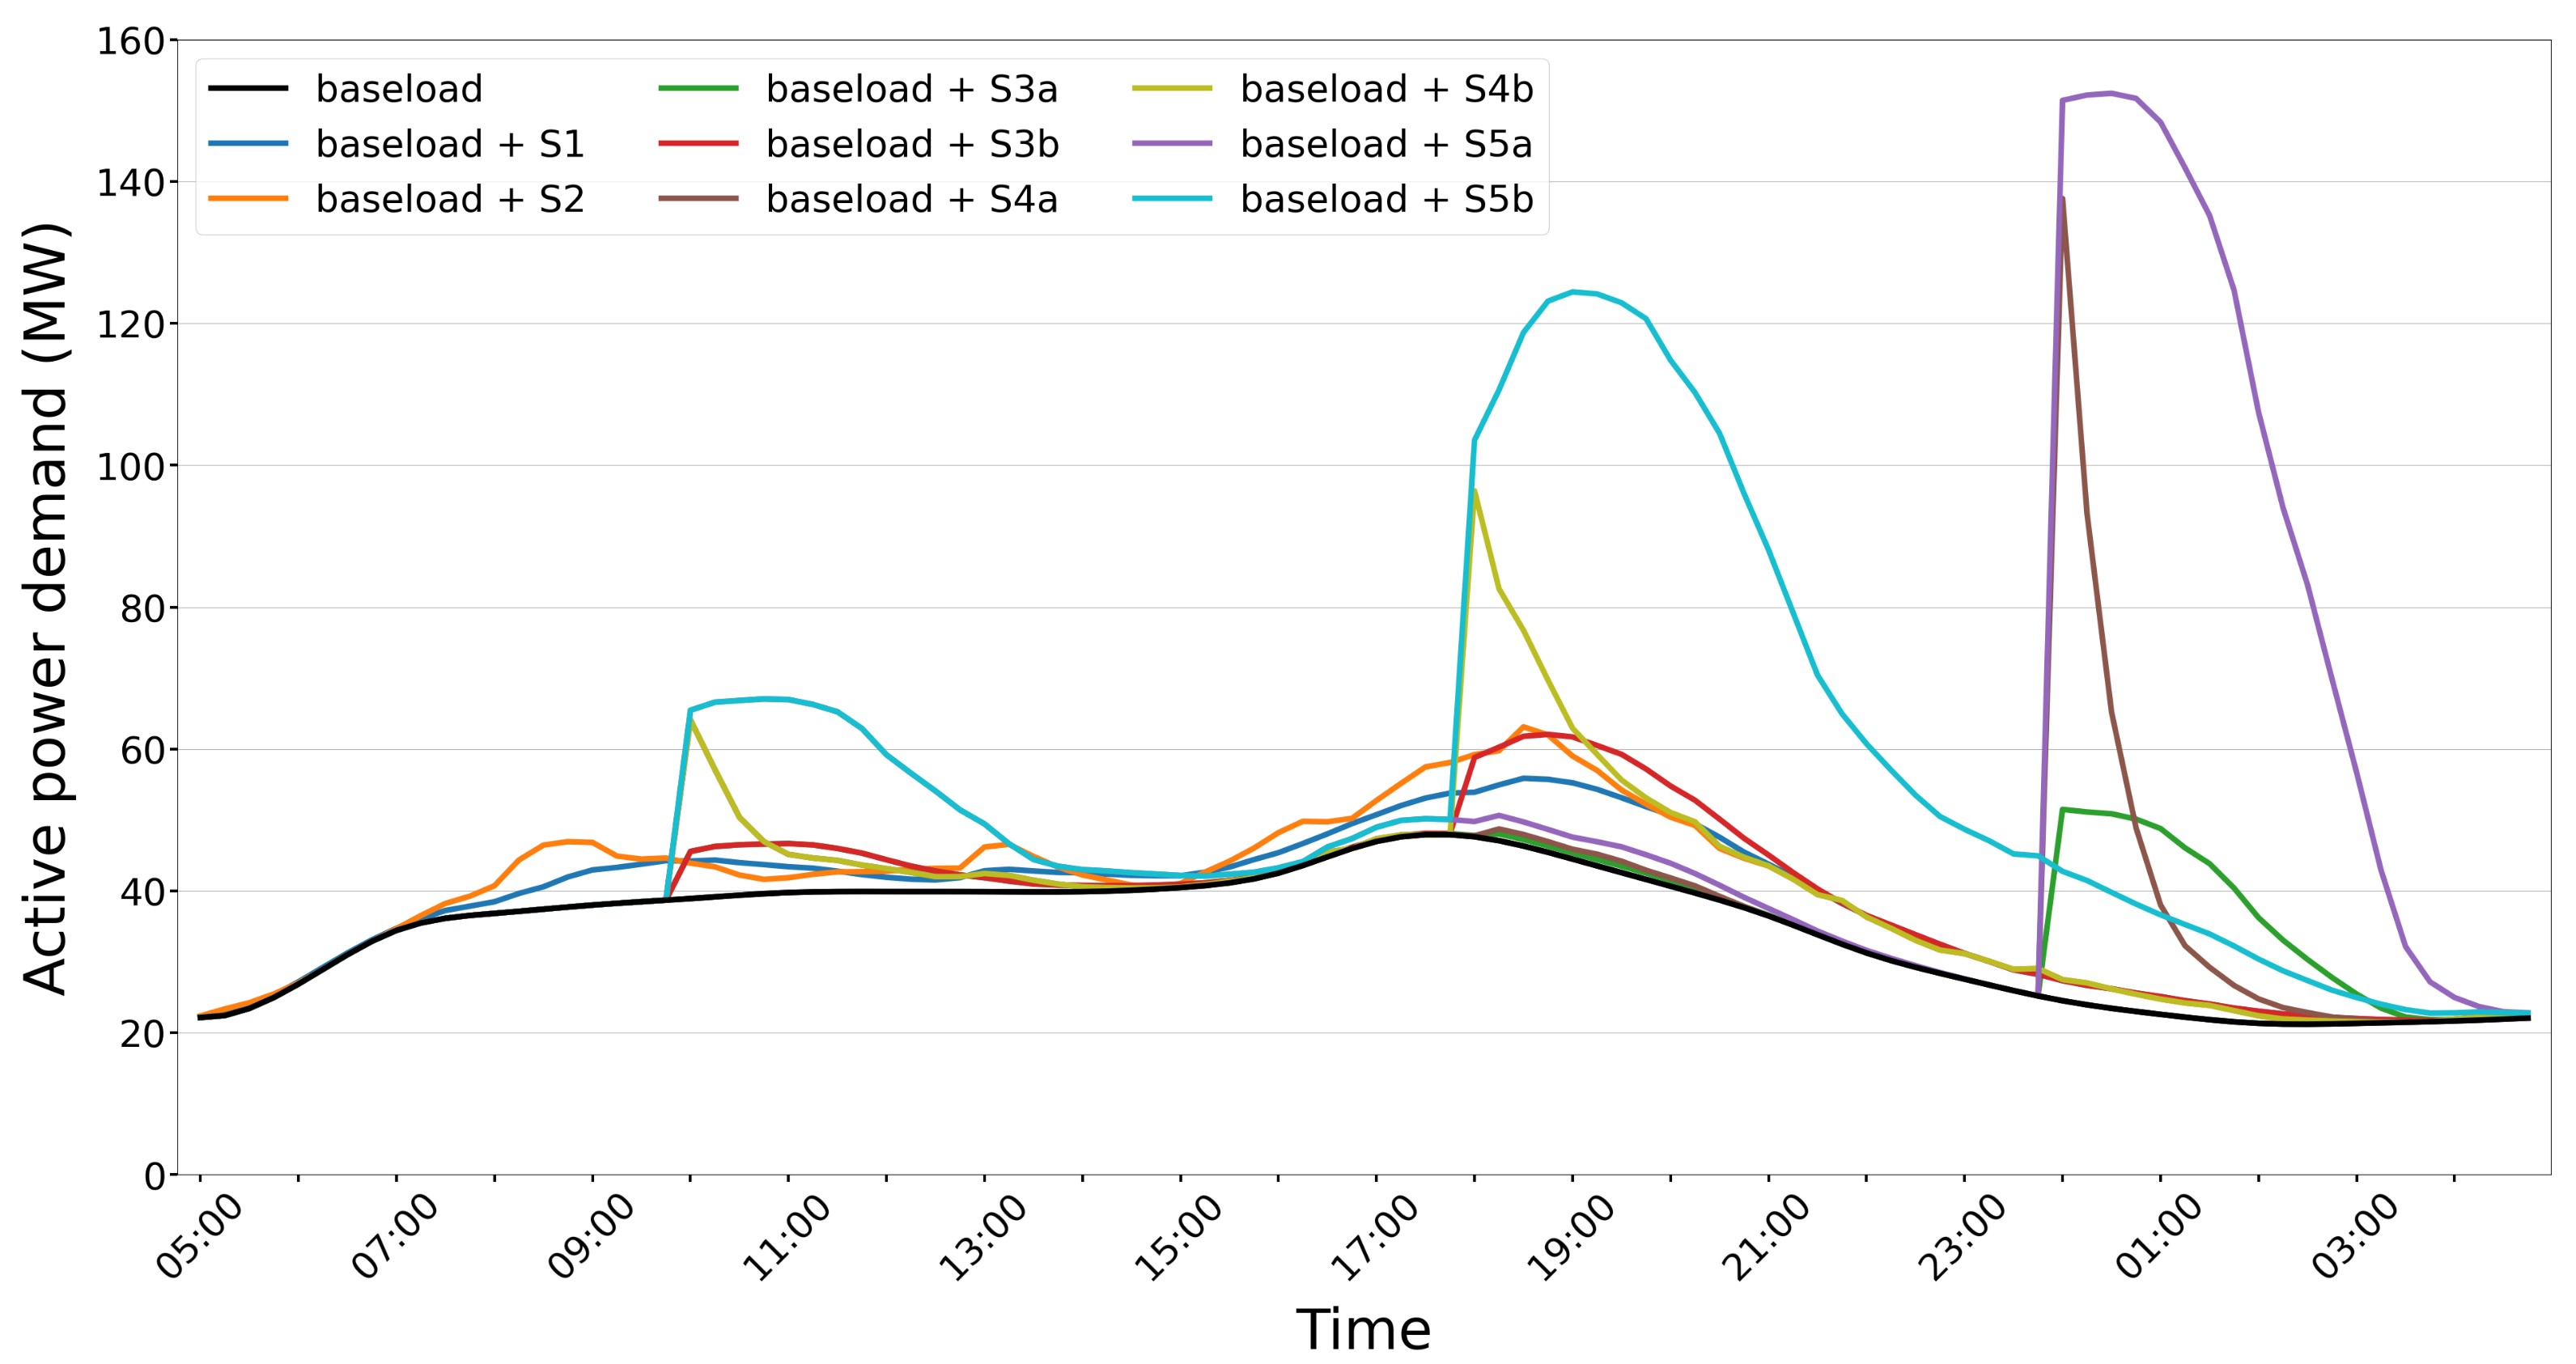
3.1. EV Demand and Aggregated Power Consumption

To begin with, we focus on the estimated EV demand and aggregated power consumption for Frederiksberg. This estimate serves as an input to the power flow simulations. Figure 6 illustrates the aggregated EV demand over the course of 24 h and associated CF. The CF was calculated for each type of charging location separately as the ratio between the simultaneous maximum charging demand of EVs charging at home or work, respectively, and the sum of their individual maximum charging demand. Therefore, the CF can be understood as the share of EVs charging at the same time in relation to the total number of EVs with the opportunity to charge at home or work, respectively.
By comparing home charging scenarios a and b, it can be seen that charging synchronization at midnight led to a significant higher peak load compared to synchronizing at 18:00, as the majority of EVs arrived at home and charged at the same time. For scenario a, a maximum CF of 94.8 % is observed. The CF decreases significantly to 58.7 % in scenario b, with a similar variation in the maximum peak power demand, respectively, 131.7 and 81.6 MW. Furthermore, the time of synchronization also has an impact on the magnitude of experienced peak load in S 4 and S 5 . While synchronization at midnight led to similar peak loads in both scenarios, the peak load in S 5 was notably higher when considering synchronization time at 18:00 due to longer charging durations.
A summary of the time and scale of the maximum peak load and maximum CF is provided in Table 5. Comparing the results to the existing literature, the CF in H 1 and H 4 a is similar to results in [18], which estimates the CF of a fleet of 10,000 EVs to be 9 % for non-daily uncontrolled charging and 83 % for daily price-responsive charging starting at 22:00.
The aggregated active power demand for Frederiksberg is illustrated in Figure 7. For scenarios S 1 S 3 , an increase in peak load of less than 32 % was experienced. In contrast, the peak load increased by roughly 183 % , 100 % , 215 % and 157 % in S 4 a , S 4 b , S 5 a and S 5 b , respectively. Thus, charging synchronization of a large fleet of EVs at midnight could cause higher concerns compared to the synchronization at 18:00 where the EV load coincides with the baseload of the system.

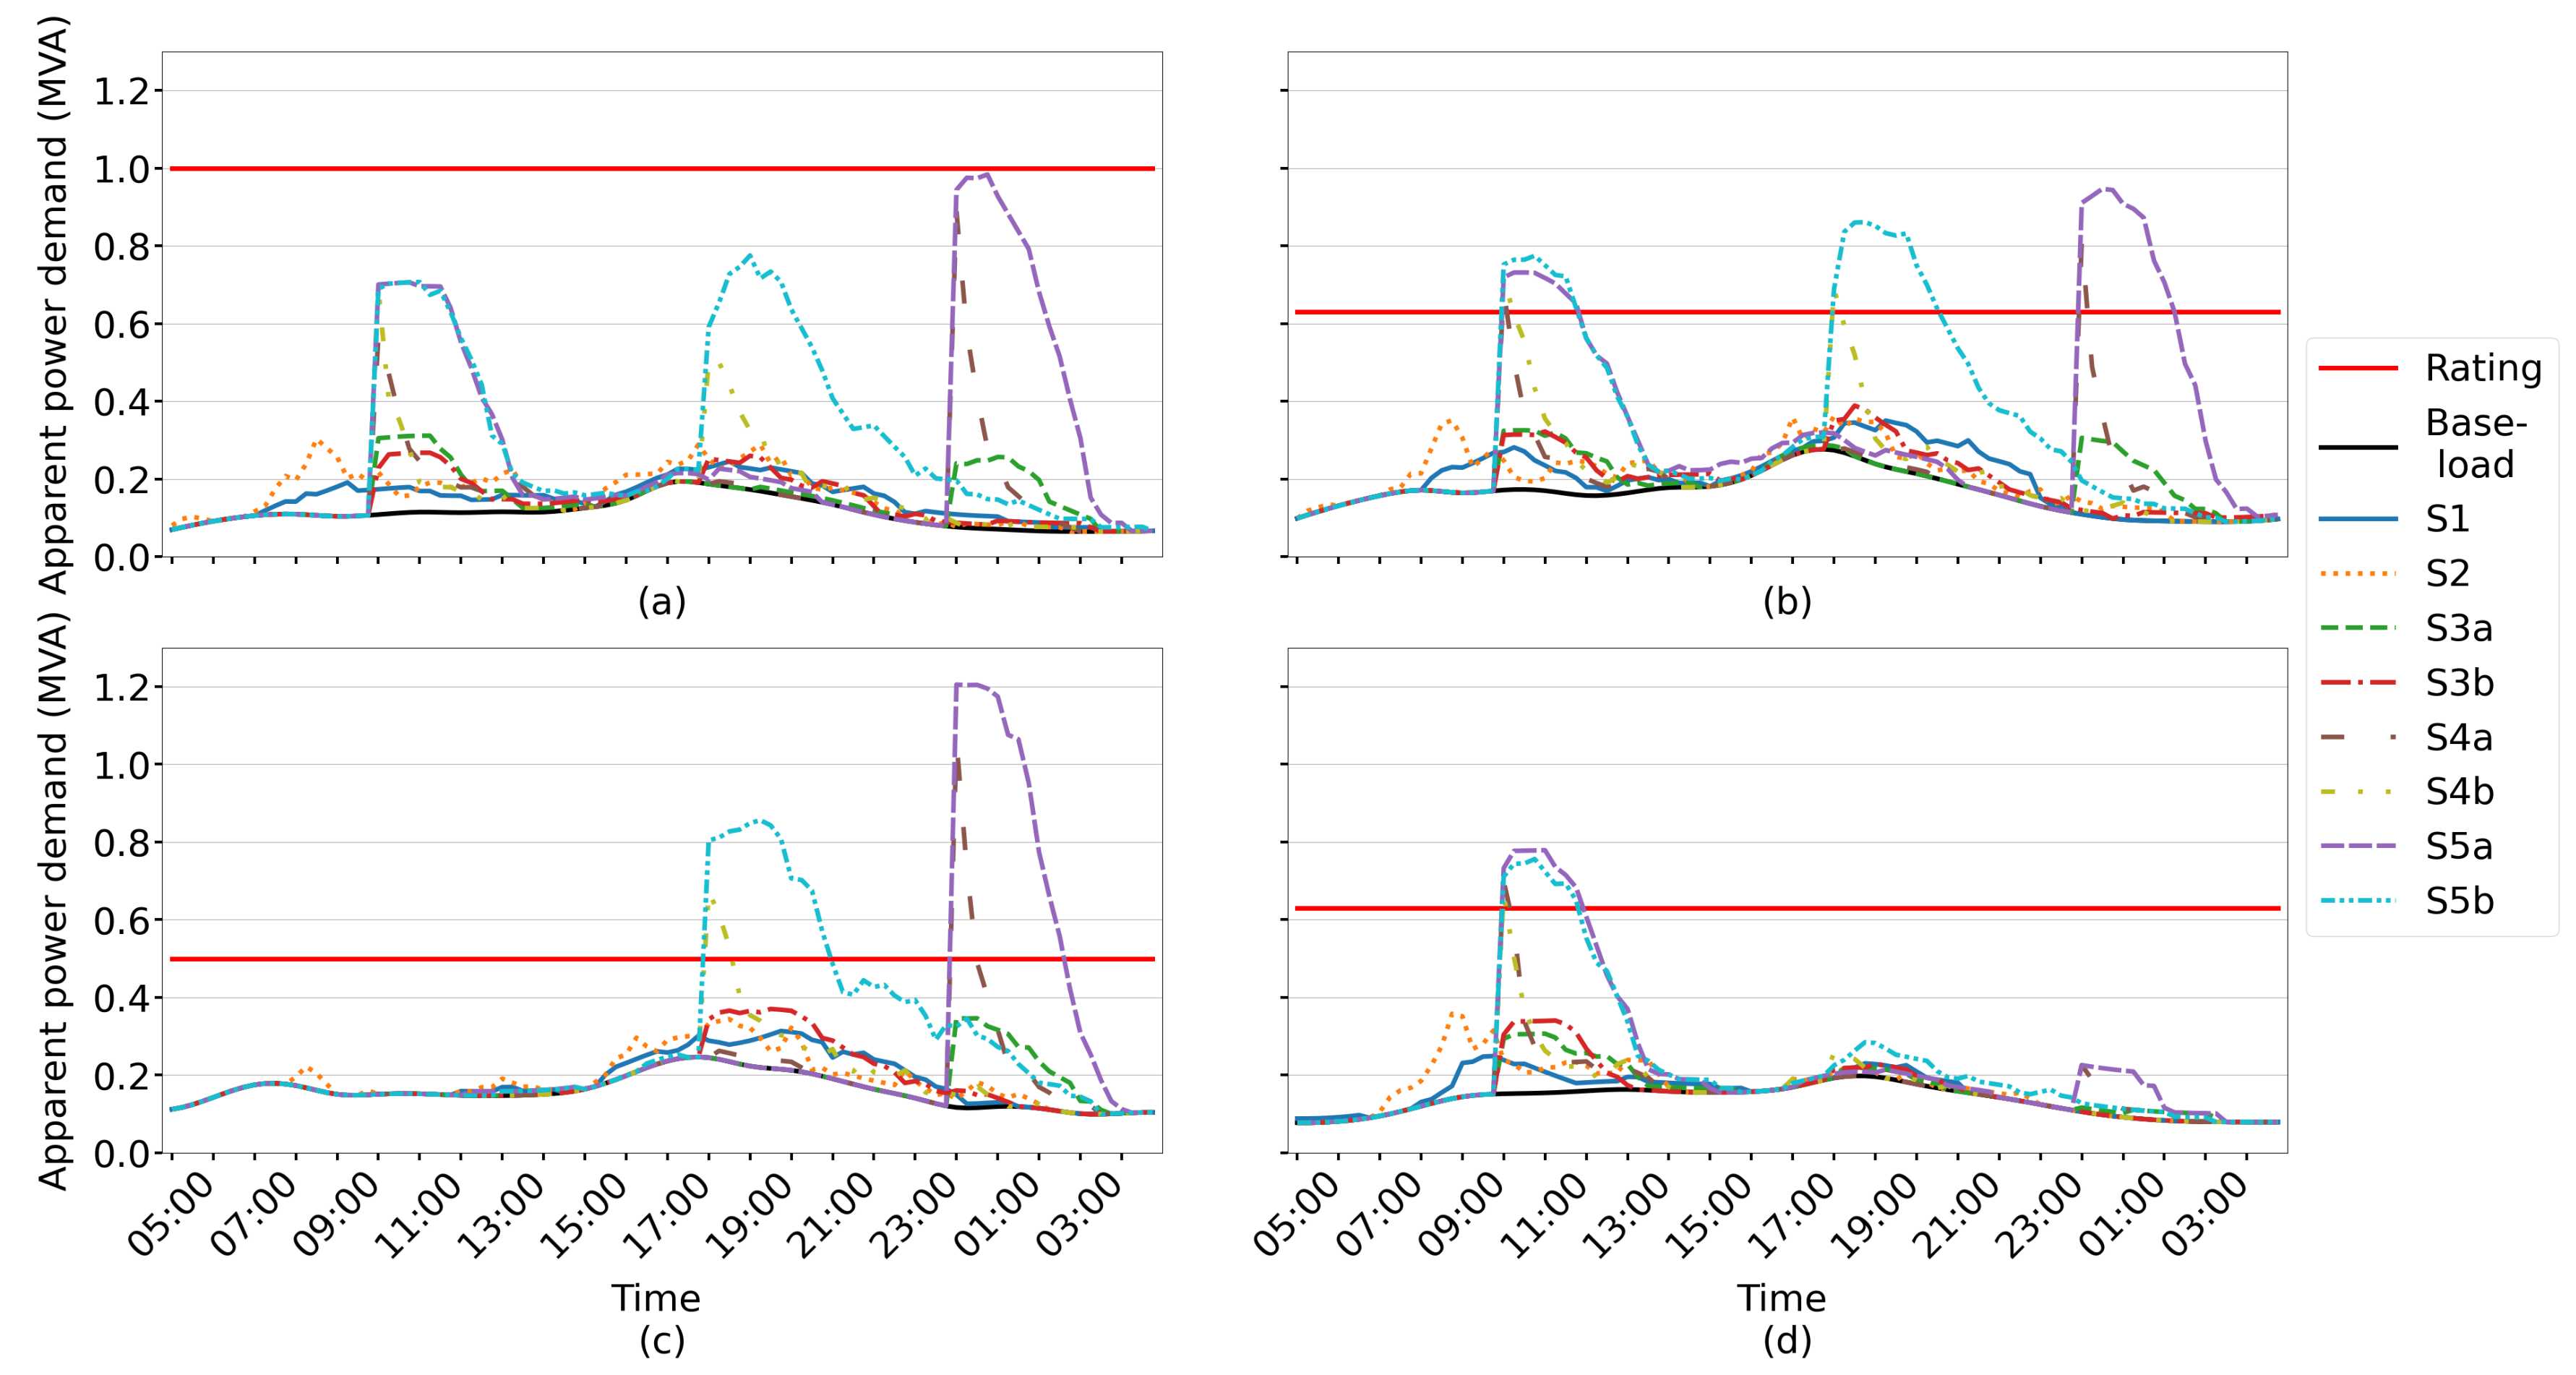
3.2. Power Distribution Network Impact and Reinforcement Costs

The EV impact on the PDNs of Frederiksberg was evaluated with respect to bus voltages and the loading of transformers and underground cables. The replacement of a PDN’s components is a time-consuming process, and thus it is important for DSO planners to look at components that could potentially face congestion in the future to be able to make timely decisions regarding network reinforcements. To analyze the loading of components, two thresholds are considered, namely 75% and 100%. A summary of the total number of transformers and cables loaded above 75 % and 100 % , as well as the respective cable length and the estimated reinforcement costs, is shown in Table 6. Voltage violations were not experienced in any of the simulated scenarios and are thus not further addressed in this section. Comparing the loading of transformers and cables, it can be seen that transformer overloading was more prominent. For scenarios S 1 S 3 b , no cable overloads were recorded, and a maximum of two transformers experienced overload situations. For the extreme scenarios S 4 and S 5 , a notable number of transformers and cables experienced congestion. Compared to home charging synchronization at 18:00 (b), synchronization at midnight (a) exerted a significantly higher impact on the PDNs, both in terms of transformer and cable overloading, indicated by a significant increase in reinforcement costs.
To showcase the impact of home and workplace charging, we illustrate the loading of four different transformers in Frederiksberg over the course of 24 h starting at 05:00 on 6 January 2020 in Figure 8. Here, we consider four different examples, starting with no overloading in any scenario (subplot (a)). Examples of overloading caused by either home or workplace charging are shown in subplot (c) and (d). Finally, an example of both workplace and home charging causing overloading is depicted in subplot (b). Thus, even though the home charging demand is estimated to be significant higher than the workplace charging demand, synchronized charging at work also contributes to potential congestion.

4. Discussion

Results indicate that even if full EV penetration is reached, uncontrolled charging is not likely to cause any significant challenge to the urban PDNs of Frederiksberg. Furthermore, even in the case of time-synchronized charging, the grid impact is negligible, assuming a non-daily charging behavior of EVs. However, high synchronization of charging caused by smart charging objectives that do not consider PDN constraints could potentially lead to severe congestion within the PDN when the number of EVs charging on a given day is high, i.e., assuming daily charging patterns or the synchronization of charging on the same day. Those worst-case scenarios, represented by S 4 and S 5 (and respective sub-scenarios), while rare and unlikely, should be taken into consideration. Charging operators should be incentivized or mandated to implement algorithms that avoid such scenarios. Smart charging schemes considering PDN constraints that were not explored within this paper could be used as dampening mechanisms to curb excessive demand surges, e.g., by spreading charging over low price periods. Grid-aware smart charging could not only avoid the occurrence of such extreme scenarios, but also mitigate the small impact experienced in the other scenarios.
Furthermore, one important aspect to mention is the potential mutually interacting relationship between electricity prices and large-scale EV charging. Within this work, any potential implication of EV charging on the spot market is neglected because those implications are in large part uncertain. For the purpose of the paper, we consider that EV users will also be able to exploit any form of price variation in the future. Another important facet is the fact that full electrification of private passenger transport is still a long way off, and most PDN equipment will have to be renewed before then, as it reaches the end of its service life. Nonetheless, the results obtained in this work could provide valuable insights for planning and prioritizing such reinforcements of the grid in the near future.
Moreover, several factors not taken into account within this work could have a significant impact on the results, which can either reduce or aggravate the load on the PDN. Concerning the former, the scenarios introduced in this paper represent extremes both in terms of charging patterns and control, as well as in terms of the availability of home and workplace charging. Therefore, results should be taken as illustrative upper bounds for the expected impact on the grid. Regarding the charging pattern, each charging scenario assumes the same charging behavior for all EV users. However, in reality, charging behavior is complex in nature, involves multiple patterns (e.g., daily vs. non-daily), is subject to different control strategies (e.g., uncontrolled vs. smart-charging) and different implementations of controls (i.e., the control will vary between charging operators), and variable charging power is likely a critical element. On top of this, future market products offered by charging operators could add another dimension of complexity by offering potential financial benefits to the customers. Regarding charger installation, we assume throughout this paper that all EV owners with access to good parking conditions, either at home or work, will have access to a charger, which could lead to overestimating the number of users with access to charging at those locations. Furthermore, workplace and housing associations are prime candidates for the utilization of load sharing solutions in their charging infrastructure, which should naturally dampen high-demand surges. Last but not least, constraints in the low voltage PDN may also dampen the impact on the medium voltage PDN, i.e., bottlenecks might materialize on the low voltage level before any congestion is experienced on the medium voltage level.
In contrast to the abovementioned factors that will likely dampen demand, we now delve into four factors that can aggravate demand. First, our simulations are based on present-day numbers of vehicles and driven distance, which fails to account for the likely growth in the number of private cars, as expected by the Danish authorities [41]. Second, given the constraints associated with travel records, we assessed the impact of EV charging on the grid based only on normal weekdays data, which covers the days when high synchronization is most likely to occur. Yet, it is important to note that high demand could also occur during weekends or holidays. Third, the impact of public charging is not considered in the present study. Even in the least impactful scenario of evenly distributed utilization of public charging, this will add additional load to the power grid. The fourth factor concerns the spatial dispersion of charging infrastructure and respective connections to the PDN. As previously discussed, the likelihood of global synchronization of demand on the entire grid is rather low. Yet, congestion could also arise from excessive concentration of charging in areas with a limited number of transformers and reduced cable connections, leading to hot spots of demand that could locally overload the power grid.

5. Conclusions

This paper probes the impact of full electrification of private vehicle utilization on the urban medium voltage PDN of Frederiksberg (Denmark), both in terms of transformer and cable loading, as well as voltage deviations. Making use of a Danish travel survey data, we estimated the future EV demand for home and workplace charging, that will have to be served by the PDN. To identify potential congestion in the PDN, we devised five different charging strategies comprising different charging patterns and degrees of control. We simulated the impact of each charging scenario on top of the present base load, selecting 40 weekdays of peak loading within the system. Three of the five charging scenarios focused on a highly simultaneous start of charging to account for a potential high level of charging synchronization in the future caused by user-centric smart charging objectives, such as cost minimization, that do not consider PDN related constraints.
The results indicate that transformer overloading is the primary concern for the analyzed PDN, with cable overloading being less prominent and no detected voltage violations. Moreover, uncontrolled charging does not pose a massive concern for the PDN, mostly due to a low CF of charging, which does not exceed 13 % and 27 % at home or work, respectively. Furthermore, even with high charging synchronization, no severe impacts are to be expected when EVs are not charged on a daily basis given a low CF of less than 24 % for both types of charging locations. However, rare events involving either time-synchronization for daily charging patterns or day- and time-synchronization for non-daily charging patterns could lead to a massive increase in CF of up to 95 % . Such events could lead to severe congestion within the PDN, resulting in overloading risk of up to 63 % of transformers and 11 % of cables. Finally, due to a higher coincidence factor of home charging at midnight, synchronization during the night could potentially pose a bigger challenge to PDNs compared to the synchronization at peak loading times in the evening.
Future work involves the modelling of a more realistic mix of charging patterns and control to account for the diversity of EV user behavior and charging preferences and the inclusion of public charging to analyze the impact on the PDN. Our future work will also focus on analyzing the impact on the low voltage PDN, which may be subject to more significant challenges from electric vehicle synchronization, especially with regard to home charging.

Author Contributions

Conceptualization, T.U. and S.K.; methodology, T.U., S.K. and F.H.; software, T.U., S.K. and F.H.; validation, T.U. and F.H.; formal analysis, T.U.; investigation, T.U., S.K. and F.H.; resources, P.B.A.; data curation, T.U., S.K. and F.H.; writing—original draft preparation, T.U.; writing—review and editing, T.U., F.H. and P.B.A.; visualization, T.U.; supervision, P.B.A.; project administration, T.U.; funding acquisition, P.B.A. All authors have read and agreed to the published version of the manuscript.

Funding

The work in this paper has been supported by the research project FUSE (EUDP grant nr. 64020-1092). Website: http://www.fuse-project.dk.

Data Availability Statement

Restrictions apply to the availability of these data. Data was obtained from DTU and can be requested at https://www.cta.man.dtu.dk/english/national-travel-survey/access_to_tu-data. Furthermore, this work uses data provided by the DSO Radius (https://radiuselnet.dk/). This data is not publicly available due to legal restrictions.

Conflicts of Interest

The authors declare no conflict of interest.

Abbreviations

The following abbreviations are used in this manuscript:
CFCoincidence factor
DSODistribution system operator
EVElectric vehicle
FRBFrederiksberg
PDNPower distribution network
SoCState-of-charge

References

  1. Wolfram, P.; Lutsey, N. Electric Vehicles: Literature Review of Technology Costs and Carbon Emissions; The International Council on Clean Transportation: Washington, DC, USA, 2016; pp. 1–23. [Google Scholar]
  2. Calearo, L.; Thingvad, A.; Suzuki, K.; Marinelli, M. Grid Loading Due to EV Charging Profiles Based on Pseudo-Real Driving Pattern and User Behavior. IEEE Trans. Transp. Electrif. 2019, 5, 683–694. [Google Scholar] [CrossRef]
  3. Haider, S.; Schegner, P. Simulating the Impacts of Uncontrolled Electric Vehicle Charging in Low Voltage Grids. Energies 2021, 14, 2330. [Google Scholar] [CrossRef]
  4. Jones, C.B.; Lave, M.; Vining, W.; Garcia, B.M. Uncontrolled Electric Vehicle Charging Impacts on Distribution Electric Power Systems with Primarily Residential, Commercial or Industrial Loads. Energies 2021, 14, 1688. [Google Scholar] [CrossRef]
  5. Bitencourt, L.d.A.; Borba, B.S.; Dias, B.H.; Maciel, R.S.; Dias, D.H.; Oliveira, L.W. Electric vehicles charging optimization to improve the insertion considering the Brazilian regulatory framework. Energy Storage 2019, 1, e76. [Google Scholar] [CrossRef]
  6. Yu, Y.; Shekhar, A.; Mouli, G.C.R.; Bauer, P.; Refa, N.; Bernards, R. Impact of uncontrolled charging with mass deployment of electric vehicles on low voltage distribution networks. In Proceedings of the 2020 IEEE Transportation Electrification Conference & Expo (ITEC), Chicago, IL, USA, 23–26 June 2020; pp. 766–772. [Google Scholar]
  7. Stiasny, J.; Zufferey, T.; Pareschi, G.; Toffanin, D.; Hug, G.; Boulouchos, K. Sensitivity analysis of electric vehicle impact on low-voltage distribution grids. Electr. Power Syst. Res. 2021, 191, 106696. [Google Scholar] [CrossRef]
  8. Neaimeh, M.; Wardle, R.; Jenkins, A.M.; Yi, J.; Hill, G.; Lyons, P.F.; Hübner, Y.; Blythe, P.T.; Taylor, P.C. A probabilistic approach to combining smart meter and electric vehicle charging data to investigate distribution network impacts. Appl. Energy 2015, 157, 688–698. [Google Scholar] [CrossRef]
  9. Procopiou, A.T.; Quirós-Tortós, J.; Ochoa, L.F. HPC-based probabilistic analysis of LV networks with EVs: Impacts and control. IEEE Trans. Smart Grid 2016, 8, 1479–1487. [Google Scholar] [CrossRef]
  10. Yu, Y.; Reihs, D.; Wagh, S.; Shekhar, A.; Stahleder, D.; Mouli, G.R.C.; Lehfuss, F.; Bauer, P. Data-Driven Study of Low Voltage Distribution Grid Behaviour With Increasing Electric Vehicle Penetration. IEEE Access 2022, 10, 6053–6070. [Google Scholar] [CrossRef]
  11. Humayd, A.S.B.; Bhattacharya, K. A Novel Framework for Evaluating Maximum PEV Penetration Into Distribution Systems. IEEE Trans. Smart Grid 2018, 9, 2741–2751. [Google Scholar] [CrossRef]
  12. Boglou, V.; Karavas, C.S.; Arvanitis, K.; Karlis, A. A fuzzy energy management strategy for the coordination of electric vehicle charging in low voltage distribution grids. Energies 2020, 13, 3709. [Google Scholar] [CrossRef]
  13. Sun, W.; Neumann, F.; Harrison, G.P. Robust Scheduling of Electric Vehicle Charging in LV Distribution Networks Under Uncertainty. IEEE Trans. Ind. Appl. 2020, 56, 5785–5795. [Google Scholar] [CrossRef]
  14. Veldman, E.; Verzijlbergh, R.A. Distribution grid impacts of smart electric vehicle charging from different perspectives. IEEE Trans. Smart Grid 2014, 6, 333–342. [Google Scholar] [CrossRef]
  15. Crozier, C.; Morstyn, T.; McCulloch, M. The opportunity for smart charging to mitigate the impact of electric vehicles on transmission and distribution systems. Appl. Energy 2020, 268, 114973. [Google Scholar] [CrossRef]
  16. IRENA. Electric Vehicle Smart Charging—Innovation Landscape Brief. Technical Report. 2019. Available online: https://irena.org/-/media/Files/IRENA/Agency/Publication/2019/Sep/IRENA_EV_smart_charging_2019.pdf?la=en&hash=E77FAB7422226D29931E8469698C709EFC13EDB2 (accessed on 15 September 2022).
  17. Bollerslev, J.; Andersen, P.B.; Jensen, T.V.; Marinelli, M.; Thingvad, A.; Calearo, L.; Weckesser, T. Coincidence Factors for Domestic EV Charging From Driving and Plug-In Behavior. IEEE Trans. Transp. Electrif. 2022, 8, 808–819. [Google Scholar] [CrossRef]
  18. Gonzalez Venegas, F.; Petit, M.; Perez, Y. Plug-in behavior of electric vehicles users: Insights from a large-scale trial and impacts for grid integration studies. eTransportation 2021, 10, 100131. [Google Scholar] [CrossRef]
  19. Verzijlbergh, R.A.; De Vries, L.J.; Lukszo, Z. Renewable energy sources and responsive demand. Do we need congestion management in the distribution grid? IEEE Trans. Power Syst. 2014, 29, 2119–2128. [Google Scholar] [CrossRef]
  20. Jones, C.B.; Vining, W.; Lave, M.; Haines, T.; Neuman, C.; Bennett, J.; Scoffield, D.R. Impact of Electric Vehicle customer response to Time-of-Use rates on distribution power grids. Energy Rep. 2022, 8, 8225–8235. [Google Scholar] [CrossRef]
  21. Sayed, M.A.; Atallah, R.; Assi, C.; Debbabi, M. Electric vehicle attack impact on power grid operation. Int. J. Electr. Power Energy Syst. 2022, 137, 107784. [Google Scholar] [CrossRef]
  22. Soykan, E.U.; Bagriyanik, M.; Soykan, G. Disrupting the power grid via EV charging: The impact of the SMS Phishing attacks. Sustain. Energy, Grids Netw. 2021, 26, 100477. [Google Scholar] [CrossRef]
  23. Monta ApS. Skær Ned på Din Elregning og CO2 Udslip. Available online: https://monta.com/dk/hjemmeladning/ (accessed on 16 September 2022).
  24. True Energy. Smart Charge with True Energy. Available online: https://www.trueenergy.io/ev-charging/ (accessed on 16 September 2022).
  25. Radius. De Højere Elpriser Medfører ÆNdringer i Nettariffen. Available online: https://radiuselnet.dk/elnetkunder/tariffer-og-netabonnement/prisaendringer/#:~:text=P%C3%A5%20grund%20af%20de%20h%C3%B8je,skemaet%20l%C3%A6ngere%20nede%20p%C3%A5%20siden (accessed on 16 September 2022).
  26. GEOTAB Energy. Charge the North: Phase Two—Charging Infrastructure with Dynamic and Distributed Price Signals for Load Shaping—Final Report. Technical Report. 2021. Available online: https://5vtj648dfk323byvjb7k1e9w-wpengine.netdna-ssl.com/wp-content/uploads/2021/07/geotab-charge-the-north-report-2-2021-DS03521.pdf (accessed on 15 September 2022).
  27. Alexeenko, P.; Bitar, E. Achieving Reliable Coordination of Residential Plug-in Electric Vehicle Charging: A Pilot Study. arXiv 2021, arXiv:2112.04559. [Google Scholar]
  28. van Bokhoven, P.; Gardien, L.; Klapwijk, P.; Refa, N.; Berende, M.; van Zante, A.; Heinen, J.W.; Kats, R. Charge Management of Electric Vehicles at Home—Testing Smart Charging with a Home Energy Management System. Technical Report. 2020. Available online: https://elaad.nl/wp-content/uploads/2022/08/rapport_charge-management-of-electric-vehicles-at-home.pdf (accessed on 14 September 2022).
  29. Esther Dudek, K.; Platt, N.S. Electric Nation Customer Trial Final Report. Technical Report. 2019. Available online: https://eatechnology.com/media/girhcnsc/electric-nation-customer-trial-report.pdf (accessed on 14 September 2022).
  30. Kröger, D.; Rauma, K.; Spina, A.; Rehtanz, C. Scheduled charging of electric vehicles and the increase of hosting capacity by a stationary energy storage. In Proceedings of the 25th International Conference on Electricity Distribution (CIRED 2019), Madrid, Spain, 3–6 June 2019. [Google Scholar]
  31. Mahat, P.; Handl, M.; Kanstrup, K.R.; Lozano, A.P.; Sleimovits, A. Price based electric vehicle charging. In Proceedings of the 2012 IEEE Power and Energy Society General Meeting, San Diego, CA, USA, 22–26 July 2012; pp. 1–8. [Google Scholar]
  32. Sadeghianpourhamami, N.; Refa, N.; Strobbe, M.; Develder, C. Quantitive analysis of electric vehicle flexibility: A data-driven approach. Int. J. Electr. Power Energy Syst. 2018, 95, 451–462. [Google Scholar] [CrossRef] [Green Version]
  33. FUSE—Frederiksberg Urban Smart Electromobility. Available online: http://www.fuse-project.dk (accessed on 31 March 2022).
  34. Unterluggauer, T.; Rich, J.; Andersen, P.B.; Hashemi, S. Electric vehicle charging infrastructure planning for integrated transportation and power distribution networks: A review. eTransportation 2022, 12, 100163. [Google Scholar] [CrossRef]
  35. Hipolito, F.; Vandet, C.; Rich, J. Charging, steady-state SoC and energy storage distributions for EV fleets. Appl. Energy 2022, 317, 119065. [Google Scholar] [CrossRef]
  36. Baescu, O.; Christiansen, H. The Danish National Travel Survey Annual Statistical Report TU0619v2; Technical Report; DTU Management: Copenhagen, Denmark, 2020. [Google Scholar]
  37. Danmarks Statistik. BIL54: Bestand af Motorkøretøjer Efter Brugerforhold, Køretøjstype, Område, Drivmiddel og tid. Available online: https://www.statbank.dk/statbank5a/SelectVarVal/Define.asp?MainTable=BIL54&PLanguage=0&PXSId=0&wsid=cftree (accessed on 31 March 2022).
  38. Danmarks Statistik. BIL707: Bestanden af Køretøjer pr 1 Januar Efter Område og Køretøjstype. Available online: https://www.statistikbanken.dk/bil707 (accessed on 31 March 2022).
  39. Klyapovskiy, S.; You, S.; Michiorri, A.; Kariniotakis, G.; Bindner, H.W. Incorporating flexibility options into distribution grid reinforcement planning: A techno-economic framework approach. Appl. Energy 2019, 254, 113662. [Google Scholar] [CrossRef]
  40. Klyapovskiy, S.; You, S.; Cai, H.; Bindner, H.W. Incorporate flexibility in distribution grid planning through a framework solution. Int. J. Electr. Power Energy Syst. 2019, 111, 66–78. [Google Scholar] [CrossRef]
  41. Finansministeriet. Grøn Skattereform Aftale om Grøn Skattereform; Technical Report; Finansministeriet: Copenhagen, Denmark, 2020.
Figure 1. Methodology of the paper to determine the impact of different charging strategies on the power distribution network of Frederiksberg (FRB). While dark-gray-shaded rhomboids depict the input data, gray-shaded shapes represent the external parameter. The light-gray-shaded hexagon represents the external models [35] used in this work. White-shaded rectangles illustrate results obtained in each step of the process.
Wevj 13 00182 g001
Figure 2. Visualization of the urban power distribution network of Frederiksberg. The grid topology is shown on the footprint of the municipality, with gray lines indicating roads and walking paths and buildings represented in light blue. The 10/0.4 kV transformers i = {1, 2, 3} are illustrated by red, blue, and black solid dots. Medium voltage underground cables for all PDNs are shown in green.
Wevj 13 00182 g002
Figure 3. Representation of the segmentation of travel records according to residency and workplace municipality, as well as the parking conditions at the respective locations.
Wevj 13 00182 g003
Figure 4. Visualization of the municipality of Frederiksberg, with gray lines indicating roads and walking paths, and buildings represented in light blue. The identified residential housing areas with predominantly single-family houses are highlighted with a yellow shade, and the primary workplace parking areas are represented in a purple shade.
Wevj 13 00182 g004
Figure 5. Charging event allocation methodology. Dark-gray-shaded rhomboids indicate the input data, and white-shaded rectangles illustrate the results obtained in each step of the process.
Wevj 13 00182 g005
Figure 6. EV demand simulation results. The aggregated EV demand over 24 h is illustrated for (a) home and (b) workplace charging scenarios. Furthermore, the concomitant coincidence factor is illustrated for (c) home and (d) workplace charging scenarios. Average, minimum and maximum values for the 40 demand profiles are illustrated by solid, dashed and dotted lines, respectively.
Wevj 13 00182 g006
Figure 7. Aggregated active power demand of all three power distribution networks in Frederiksberg, illustrated from 05:00 on 6 January 2020 to 04:45 on 7 January 2020. While the black plot indicates the aggregated baseload, the aggregated demand (comprising both baseload and EV load) is illustrated by different colors for each charging scenario.
Wevj 13 00182 g007
Figure 8. Transformer loading illustrated for a period of 24 h starting at 05:00 on 6 January 2020. Four different 10 / 0.4 kV transformers are presented, illustrating a: (a) no-overload scenario; and congestion scenarios caused by (b) both work and home charging; (c) solely home charging; and (d) solely workplace charging. Transformer ratings and the baseload are indicated by red and black lines. Colored lines in different shapes indicate the aggregated apparent power demand (baseload + EV demand) in each scenario.
Wevj 13 00182 g008
Table 1. Summary of the power distribution network infrastructure in Frederiksberg. For each FRBi, there are N t r i transformers connected to N c i cables covering a total length L c i .
FRBi N tr i N c i L c i (km)
115222293.4
29815760.0
3346119.9
Table 2. Maximum number of charging events and respective energy demand per day during the simulation time span. Results are segregated by home and workplace charging for each scenario under consideration.
S 1 S 2 S 3 S 4 S 5
N H 279312,686279312,68612,686
N W 867308986730893089
E H   ( MWh ) 68.481.268.481.2350.5
E W   ( MWh ) 21.226.121.226.183.4
Table 3. Summary of the characteristics of each charging scenario S i , including sub-scenarios a and b, as well as H i and W i . The non-daily (n.d.) charging demand δ ε is defined as the required energy according to the steady-state model, whereas the daily demand is δ ε / d p as introduced in the definition of S i .
S 1 S 2 S 3 a S 3 b S 4 a S 4 b S 5 a S 5 b
H 1 , W 1 H 2 , W 2 H 3 a , W 3 H 3 b , W 3 H 4 a , W 4 H 4 b , W 4 H 5 a , W 5 H 5 b , W 5
patternn.d.dailyn.d.n.d.dailydailyn.d.n.d.
controlnonenoneT.S.T.S.T.S.T.S.T.D.S.T.D.S.
t c , H nonenone24:0018:0024:0018:0024:0018:00
t c , W nonenone10:0010:0010:0010:0010:0010:00
Table 4. Summary of charging events allocation in the FRBi networks. We list the maximum number of events allocated to a private home n H , p ( i ) , a shared home n H , s h ( i ) and workplace n W ( i ) charging for each scenario under consideration.
n H , p ( 1 ) n H , sh ( 1 ) n W ( 1 ) n H , p ( 2 ) n H , sh ( 2 ) n W ( 2 ) n H , p ( 3 ) n H , sh ( 3 ) n W ( 3 )
S 1 , S 3 a S 3 b 2751312480218213131135374
S 2 , S 4 a S 5 b 1244595317109537341116541606263
Table 5. Summary of the aggregated EV peak power demand for each charging scenario, decomposed according to home and workplace contributions. We list its magnitude P max , time t max and coincidence factor C F max .
P max (MW) t max CF max (%)
H 1 11.619:158.5
H 2 16.918:3012.4
H 3 a 28.600:3021.0
H 3 b 18.019:0013.1
H 4 a 116.824:0083.7
H 4 b 50.418:0036.5
H 5 a 131.700:3094.8
H 5 b 81.619:3058.7
W 1 5.310:0016.8
W 2 9.109:0027.0
W 3 7.610:1523.9
W 4 26.610:0079.8
W 5 28.910:1586.2
Table 6. Summary of reinforcement costs required to match the increased load in each scenario S i . We indicate the number of transformers n t r n t r 1 , n t r 2 , n t r 3 , cables n c n c 1 , n c 2 , n c 3 and total cable length l c l c 1 , l c 2 , l c 3 (km) per PDN in Frederiksberg that exceed 75% and 100% of the nominal capacity. The last column contains an estimate for the total costs C T (k€) associated with the respective reinforcement.
n tr n c l c (km) C T (k€)
Load (%)>75>100>75>100>75>100>75>100
S 1 5, 1, 01, 0, 00, 0, 00, 0, 00, 0, 00, 0, 013022
S 2 12, 7, 01, 1, 00, 0, 00, 0, 00, 0, 00, 0, 041143
S 3 a 6, 2, 01, 0, 00, 0, 00, 0, 00, 0, 00, 0, 017322
S 3 b 7, 2, 01, 0, 00, 0, 00, 0, 00, 0, 00, 0, 019522
S 4 a 120, 69, 3259, 40, 932, 9, 016, 3, 016.5, 5.3, 08, 2.1, 076763680
S 4 b 74, 52, 1434, 21, 412, 2, 02, 0, 05.1, 1.3, 00.4, 0, 038781333
S 5 a 122, 69, 3286, 67, 2534, 13, 019, 4, 017.6, 7.1, 09.2, 3.3, 081035509
S 5 b 112, 69, 3254, 38, 821, 9, 011, 2, 010.1, 5.3, 04.9, 1.3, 066562983
Publisher’s Note: MDPI stays neutral with regard to jurisdictional claims in published maps and institutional affiliations.

