1. Introduction
With 16% of worldwide emissions emerging from transport-related activities [
1], transforming transportation with new vehicle concepts and mobility modes play a vital role in reaching target climate goals and reduction in emissions of noise and pollutants, and improve living conditions. Light electric vehicles (LEV) show great promise in this regard owing to their efficiency and low ratio of vehicle weight to payload, resulting in low energy consumption and, thus, lower greenhouse gas emissions per driven kilometer. Not only are the emissions significantly lower than those of cars with internal combustion engines, but also the comparison with EVs shows a significant advantage of LEVs in terms of both energy consumption in operation and resource requirements for production [
2]. When situated in a multi and inter modal environment, they have a certain potential to replace car trips and, thus, reduce emissions [
3].
Today’s market offers a large variety of LEV models, from electric scooters and e-bikes up to two-, three-, and four-wheelers that fall under categories L1e to L7e according to EU regulation 168/2013 [
4]. LEVs address diverse target groups and applications and, accordingly, differ regarding design and technical features. Common characteristics of all LEVs are that they are battery−electric and have a much lower weight and energy consumption per kilometer travelled compared to passenger cars with electric or other drive systems. The study analyses the following selection of LEV categories: e-scooters, e-bikes, and “e-bike+” that allow transport of cargo or children, speed pedelecs (L1e), mopeds (L1e), motorcycles (L3e), and three types of microcars differing in maximum speed and number of wheels (L5e, L6e, L7e).
Section 2.1 provides detailed information on each category.
In order to quantify the theoretical potential of emission reduction, this study models a scenario in 2030, in which a major modal shift away from trips with full-sized passenger cars to LEVs has taken place. For the analysis, today’s mobility patterns are maintained, with only a few trips still made by car, such as very long trips or trips with many occupants. This setting was chosen to avoid complex influences affecting the potential of LEVs, in the spirit of a ceteris paribus. For future studies, it would be interesting to investigate more complex scenarios involving different forms of mobility such as public transport or long-distance trains in combination with LEVs to gain differentiated insights into their potential, as well as possible adverse effects. The study uses Germany as an example of a national savings potential, as cars play an important role there, both as a means of mobility and as a sector of the economy.
2. Materials and Methods
2.1. LEV Properties
For the potential analyses and calculation of life cycle emissions, technical characteristics per evaluated vehicle categories are required, such as the maximum design speed, which determines the use on highways. In addition, values are needed that are derived on the basis of technical properties, as they do not result directly from this. This is the case for the maximum trip length for which a trip is considered to be substitutable. The so-called “relevant trip length” defines a trip length that is well-drivable with a specific LEV category on the basis of the literature and expert assessments. It is shorter than the technical electric range.
Most parameters such as maximum design speed, weight, battery capacity, technical electrical range, and seating capacity are based on exemplary models for the analyses. The data were taken from manufacturer information and sales websites, as far as available, or calculated on the basis of technical data. The energy consumption per kilometer is either taken from the sources described, or calculated with electric range and battery capacity if not provided. As vehicles differ considerably regarding maximum design speed, there are no standardized test cycles for assessing the energy consumption per kilometer that apply to all categories. This is considered tolerable, as the trip duration is also not necessarily kept constant for the replaced trips. The lack of standardized driving cycles, different handling of manufacturer specifications, and the high influence of user behavior complicate the estimation of energy consumption. In contrast to the technical parameters, which are based on today’s technological status, for modelling a scenario for the year 2030, an increased lifetime mileage compared to today’s vehicle mileage is assumed, resulting from expected technological progress. Although it is likely that other technical parameters also improve, these were left at the current level, in order to make a conservative estimate.
Table 1 provides an overview of the values used for the further potential analysis.
The maximum design speed indicates the speed used within the analyses. According to EU regulation 168/2013 [
5], for the categories evaluated in the study, it is limited to 45 km/h for light two-wheel vehicles (L2e−B) and for microcars (L6e), to 90 km/h for microcars of category L7e (depending on sub-categories), and is not limited for vehicles belonging to category L3e or L5e.
For each category that was used for analyzing the trip substitution potential and for assessing life cycle emissions, an exemplary LEV model that is available (soon) on the market serves as basis for definition of the technical parameters. The selection process of LEV categories and respective exemplary models for deriving LEV properties aimed for (1) covering a broad spectrum of properties and capabilities in order to satisfy a full range of use cases and, thus, offering a high trip substitution potential, (2) capturing the differences between LEV categories and models, (3) limiting the number of selections to maintain an achievable modelling effort leading to comprehensible and memorable results, and (4) choosing models with low expected emission values, e.g., having a battery capacity corresponding to a required range, and not significantly higher. According to these aims, the technical parameters defined for each category do not represent average values of models available on the market or sold units in each category, but offer values for each category that are realistic on the one hand (as based on existing models) and oriented towards sustainability on the other hand, which does not necessarily correspond to average values of each category. The sustainability aspect refers in particular to choosing vehicles with rather low weight and battery capacity. A certain exception is the exemplary model of the L5e category, as here a model with three seats and a relatively high maximum design speed was aimed for, and no vehicle was found that combines these characteristics with a relatively small battery capacity.
2.2. Trip Substitution
This study uses data from the German national travel survey “Mobilität in Deutschland 2017” (MiD) [
6], which surveyed 156,000 households, resulting in a dataset containing 960,000 trips. The dataset itself provides weighting and extrapolation factors that can be used to calculate the daily mobility pattern of the entire German population [
7]. Based on this data, this study analyses the theoretical substitutability of car trips by LEVs of various categories considering their constraints. Real-world, market-ready LEVs were taken as reference for using technical properties of 9 types of LEVs, ranging from e-scooters and speed bikes to microcars, as described in
Section 2.1. Their constraints regarding relevant travel distance, occupants, trip purposes, weather, age of driver, impairments, and street category were compared with the characteristics of the surveyed car trips. The relevant travel distance describes the distance that is assumed to be comfortably driven with an LEV per day and is lower than the technical electrical range. The number of persons reported for each trip is compared with the seating configuration of the LEVs, considering also if adults or children are travelling, which affects the suitability of the categories e-bike+, moped, and motorcycle. Regarding trip purposes, some trips dedicated to shopping and accompaniment of other persons, as well as professional trips, are excluded and considered as unsuitable for LEVs. The MiD data also provide information on weather conditions. Heavy rain, snowfall, or icy roads were defined as not usable with two-wheeled vehicles and vehicles without weather protection. The use of two-wheeled vehicles was also limited by the age of the driver, introducing a maximum age of 70 for these kind of vehicles for the analysis. Walking impairments are another exclusion criterion for the use of two-wheeled LEVs. Otherwise, it was assumed that people who can use a passenger car can also take a microcar. Regarding the use of different road categories, the maximum design speed of the respective LEVs was taken into account. This determines whether a vehicle is allowed to use motorways in Germany, for which the vehicle must be able to travel at least 60 km/h. For example, microcars have a higher relevant travel distance and are appropriate for most street types and all-weather conditions and, therefore, offer a broader range of suitability than e-bikes (
Table 2). Only if all constraints that characterize a trip are fulfilled is an LEV classified as suitable for this trip.
Since everyday trips are seldom independent of each other but usually belong to trip chains of an individual, substitutability was not only tested for individual trips, but also on the level of the associated trip chain. As the trips surveyed in the MiD dataset mostly start and end at the same location, they can be regarded as round trips. With this approach, daily car trips in Germany that could be substituted by an LEV were determined. Finally, identified trips were translated into substituted vehicle km for one day according to the trip single lengths reported in the MiD dataset.
2.3. Life Cycle Assessment and Emission Reduction Potential
Quantifying emissions savings by LEVs versus conventional passenger cars both during vehicle use phase and production requires a life cycle analysis (LCA) comparison. Scarce data and research for new LEV types and models for components and vehicle use behavior presents a challenge for analyzing potential emission reduction. Based on an analysis of currently available LEVs and prototypes, a representative set of technical characteristics was defined for every LEV category (see
Table 1). Range and battery capacity represent upper boundaries of current vehicles, as we assume the technical characteristics to be representative for the year 2030 to which we refer in our analysis.
The LCA analysis of LEVs is based on modelling the production and vehicle use greenhouse gas (CO
2eq) emissions of e-scooters, e-bicycles, e-mopeds, and small 4 wheelers. Models using the material and energy flow software Umberto and the ecoinvent 3.7 [
8] database are created using material flow details from the available literature. The data for vehicle characteristics and material composition of the vehicles are taken from various data sources. For e-scooters, several authors analyzed the production and use, and data for this study are taken from [
9,
10]. In case of e-bikes, we used data and the bill of materials from [
11]. For the e-mopeds and motorcycles, we referred to [
12,
13]. For microcars, less information on representative vehicles of these classes is available. Therefore, we assumed that the generic microcars that we consider in our study have a similar material composition as a small electric vehicle, which is available in [
14]. We adapted all vehicle material data to the technical characteristics of the generic LEVs in
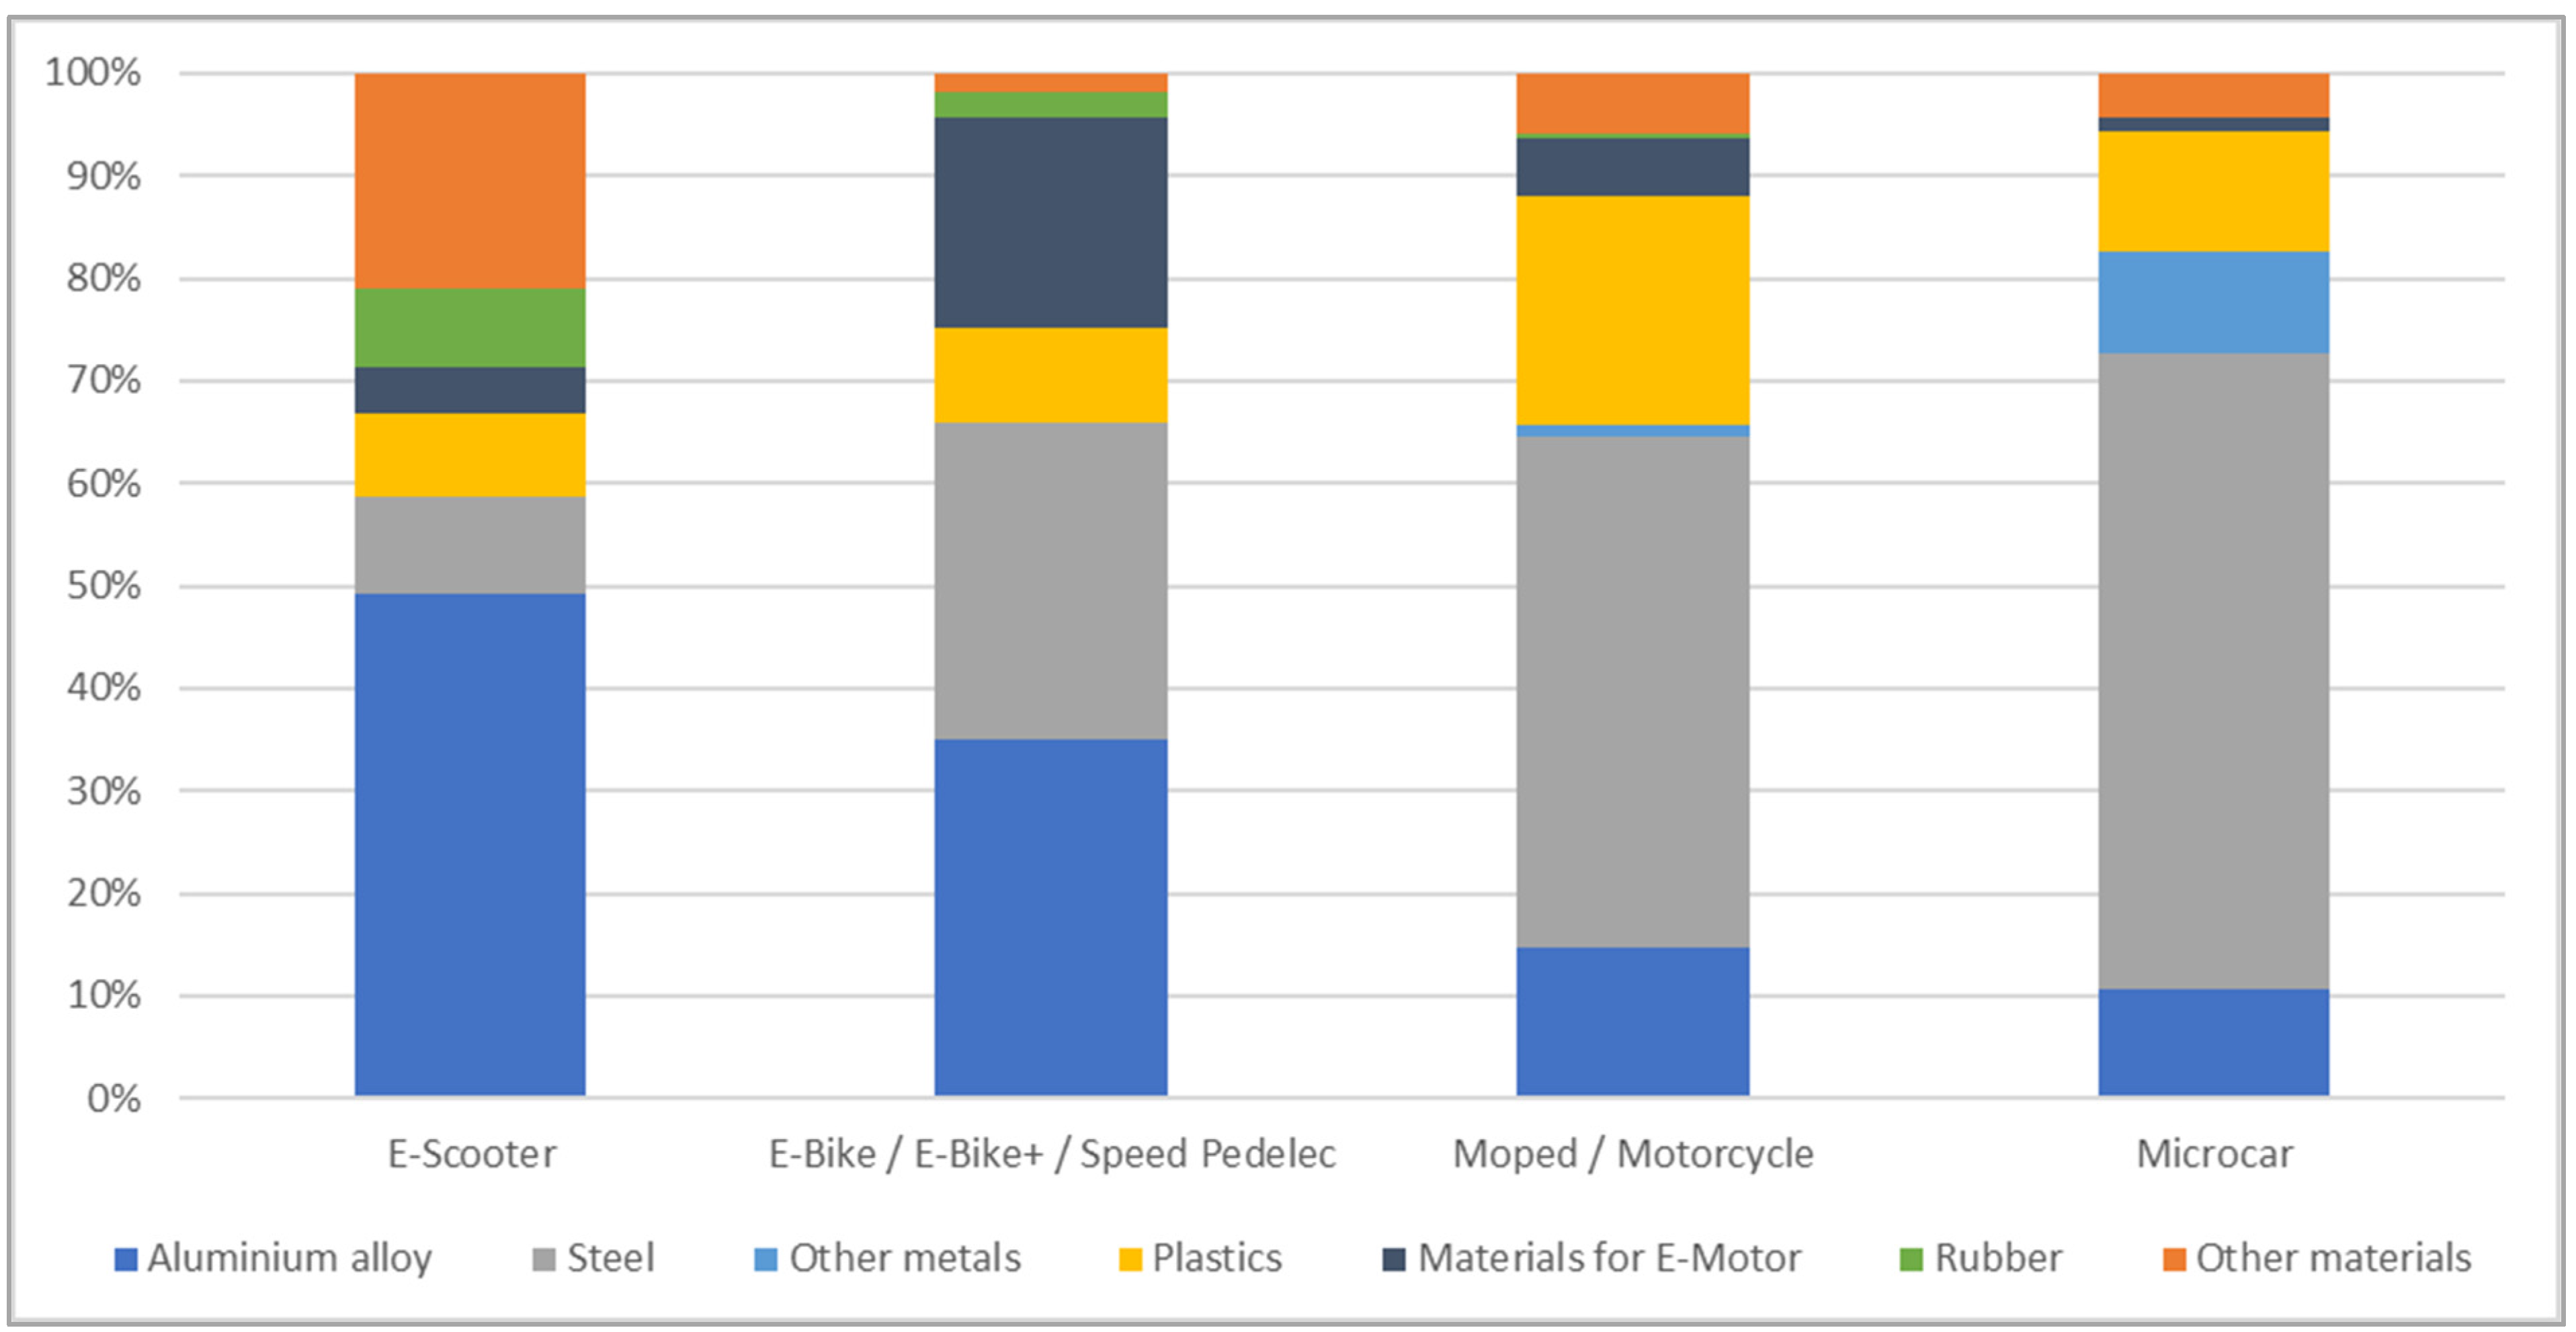
Table 1. While aluminium is the dominant material for e-scooters, the share of steel increases with the vehicle size (
Figure 1) The lithium ion battery is assumed to be a NMC type for all vehicles. The production of these batteries is adapted from the production process in the GREET model [
15] and combined with background data of the ecoinvent database. Lifetime mileage (see
Table 1) plays a crucial role in the emission reduction potential, and care is taken by accounting for uncertainty emerging from the literature-derived vehicle use, as well as suitable battery and material properties.
The production of the passenger cars was calculated according to data from the ecoinvent 3.7 database [
8]. We distinguish mid-class passenger cars with different drive trains, such as gasoline or diesel vehicles, cars using compressed natural gas (CNG), and hybrid and plug-in hybrid electric vehicles, as well as battery electric vehicles (BEV). The vehicle lifetime mileage for all drive train types is assumed to be 200,000 km. Emissions for the vehicle operation were taken from the handbook of emission factors [
16]. Such emissions from the use of conventional fuels in internal combustion engines do not occur for purely electric vehicles, that is, all LEVs and BEVs. The electricity mix for the vehicle use is taken from [
17]. The report describes pathways for the electricity system in Germany until 2035. From this, we derived an electricity production mix for the year 2030 with a renewable share of 74%. Conventional electricity production in this scenario consists mainly of natural gas and a smaller share of coal and lignite. A second scenario having a higher share of renewable energies (76%) and significantly lower share of lignite is derived from this report, and used for a sensitivity analysis.
In order to calculate the overall emission-saving potential for the passenger car substitution, we analyzed which LEVs are suitable for the trips identified from MiD (see
Section 2.2), and chose the LEV with the lowest CO
2eq emissions as a substitute for the passenger car. The passenger car emissions are averaged according to a reference fleet for 2030 [
18] containing a BEV share of 35% in the new vehicle fleet and 14% in the stock. Using this information, the difference in CO
2eq emissions between the average car and a LEV trip (emissions per km times trip length, 2030 scenario, Germany) is calculated using the following formula:
where
i = trip in MiD dataset;
l = trip length;
Ec = stock-weighted LCA emission of passenger car; and
ELEV lowest = LCA emission of least emitting substitutable LEV for given trip.
As shown in Equation (1), when estimating the emission reduction potential from LEV substitution, the least LCA-based emission-producing LEV was selected when multiple LEVs satisfied a trip’s constraints. This value is based on trips made on a representative day as reported in
Section 2.2. Finally, the daily trips are aggregated and upscaled for one year.
3. Results
3.1. Potential of Substituting Car Trips and Mileage
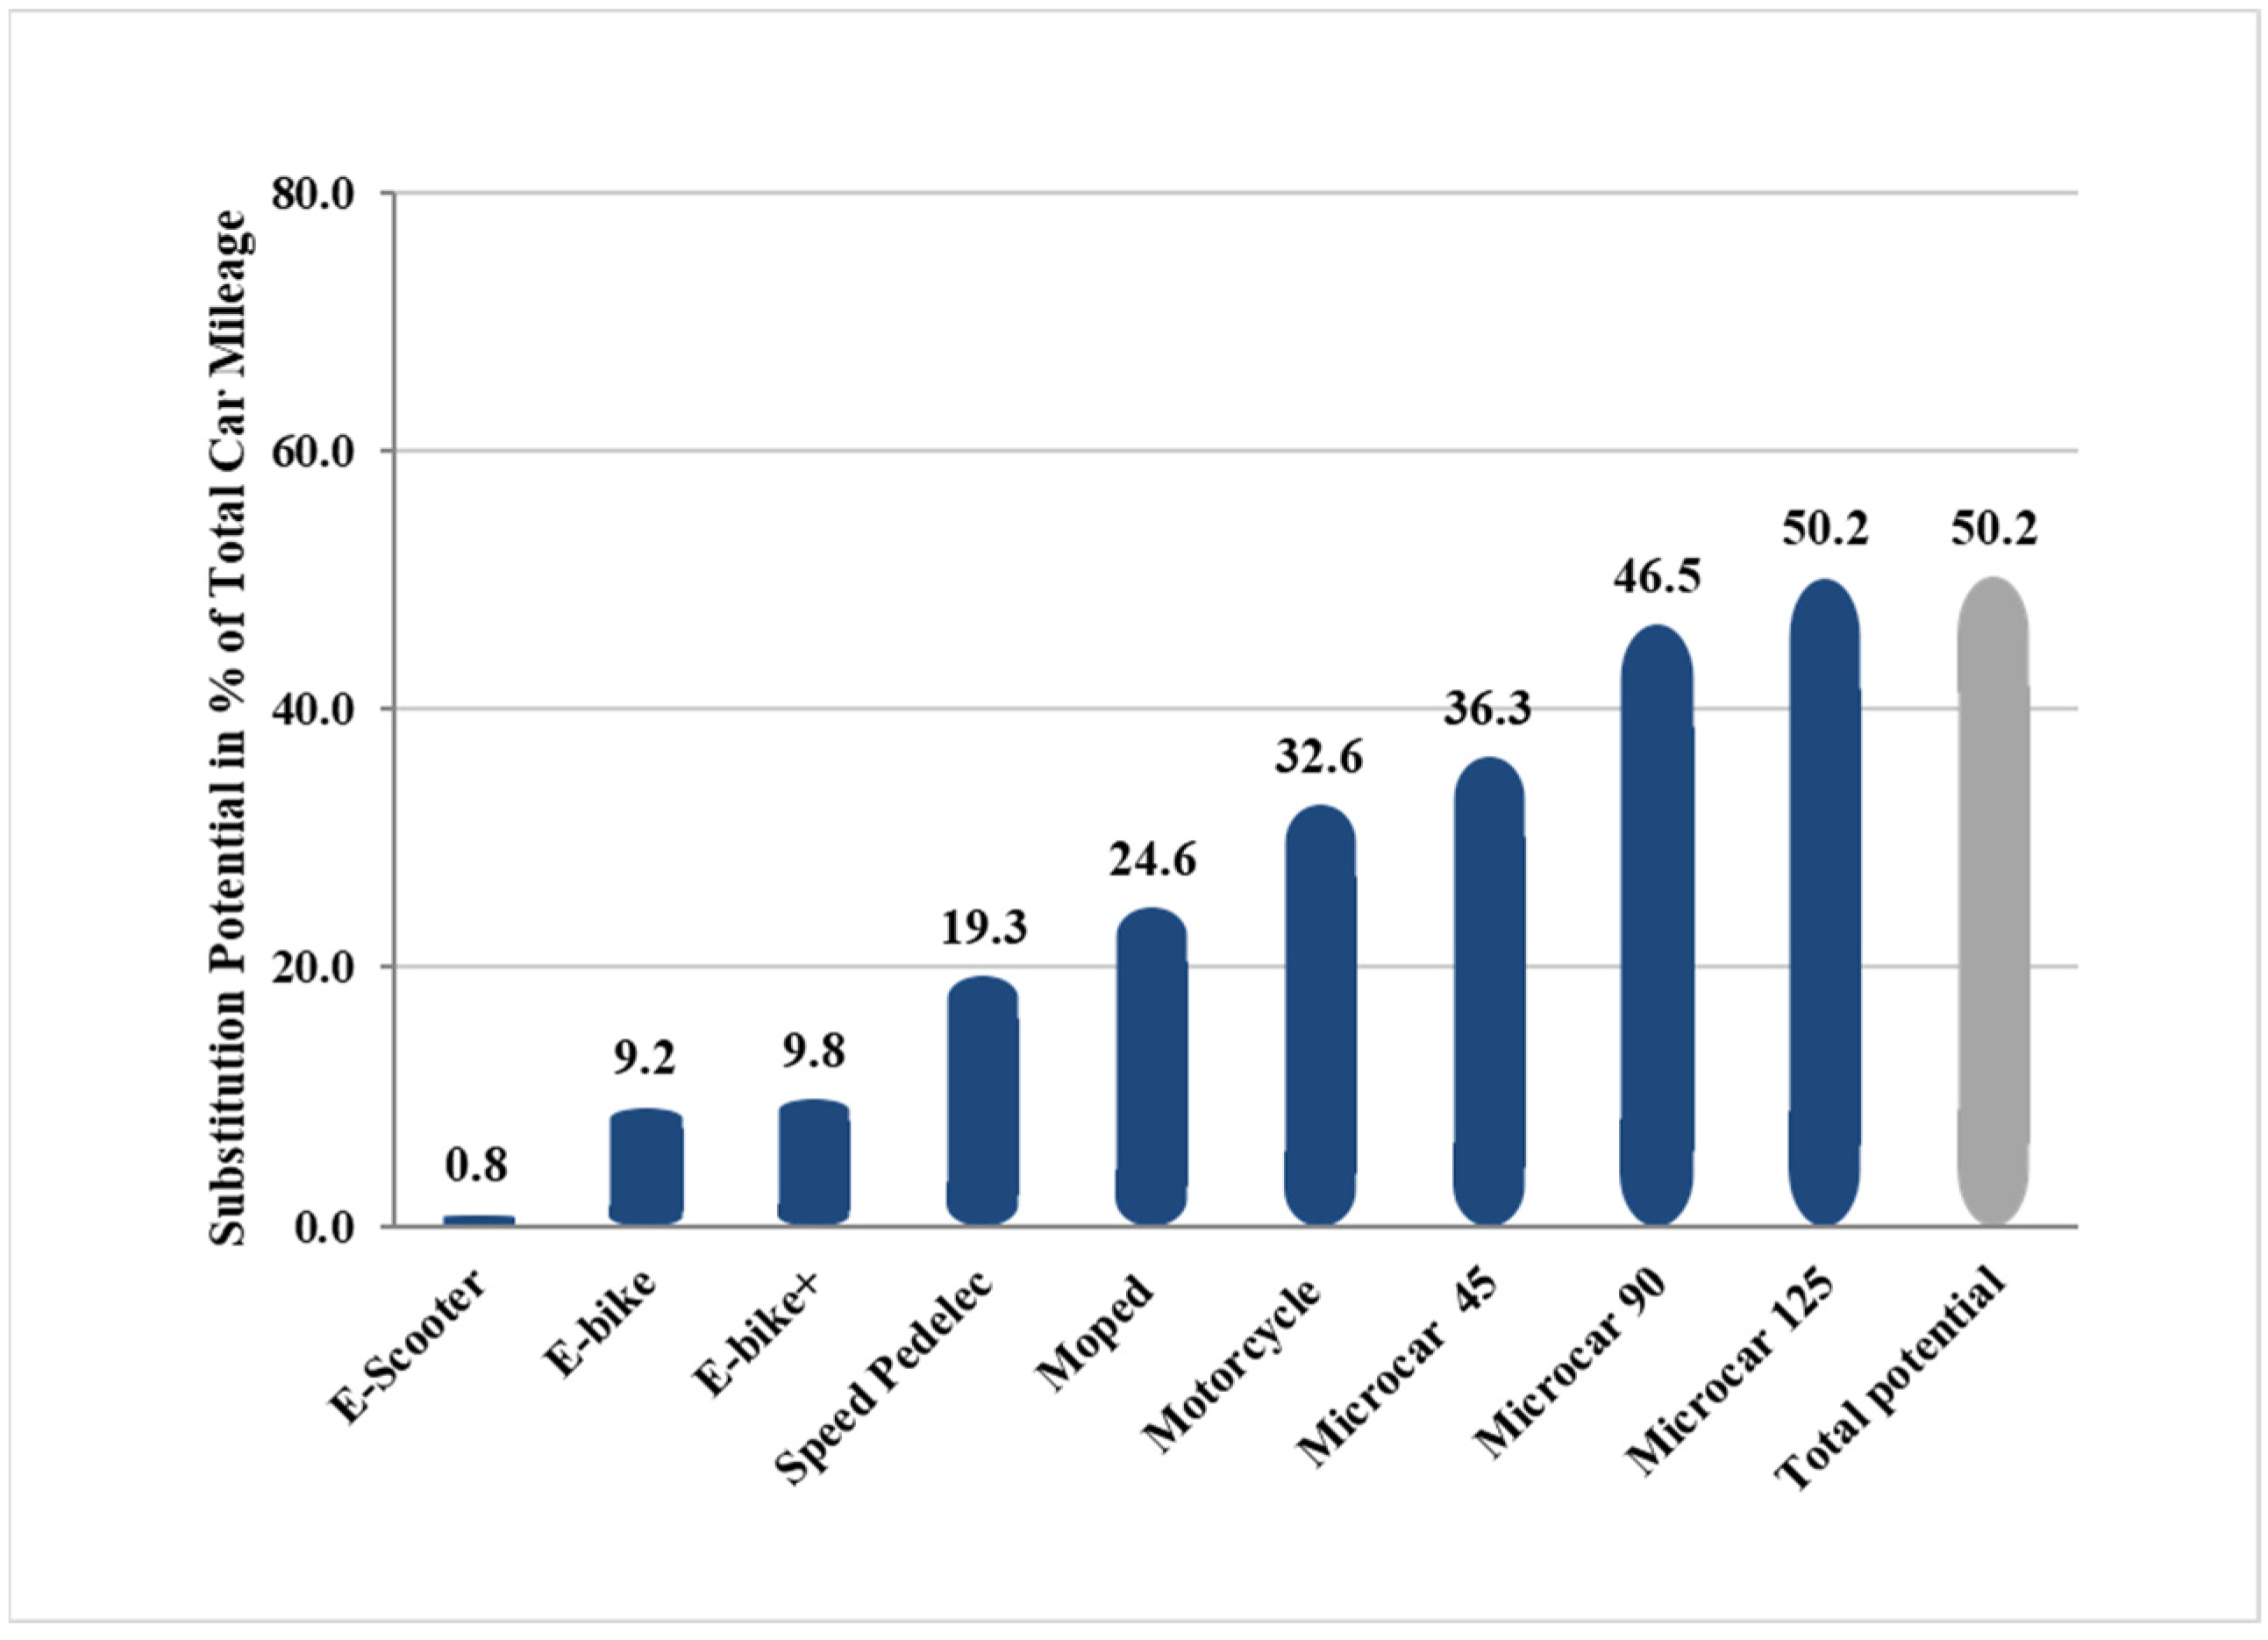
Figure 2 shows the maximum potential of mileage substitution by the considered LEVs with a baseline range of these vehicles. A maximum of 76% of all trips accounted by the dataset can be substituted, which accounts for 50% of the mileage driven in Germany (
Figure 2).
The difference between the trip substitution potential and the substitution potential in terms of car mileage is mainly based on the fact that a significant proportion of car mileage in Germany results from long distance car trips (see [
7]), which could not be substituted by LEVs due to their limited range. Due to their different characteristics, there is a considerable difference in the car mileage that each LEV could substitute. While the e-scooter, as the simplest LEV model in these calculations, could only substitute under 1% of all car mileage in Germany, e-bikes already could substitute up to almost 20% of car mileage. Two-wheeled LEV models of the category moped and motorcycle offer a substitution potential that ranges from around 25 to 33% of car mileage. With the four-wheeled microcars, LEV models offer characteristics quite similar to small ordinary combustion engine cars, which is also reflected in the results: up to around 50% of all car mileage in Germany could be substituted by these types of LEVs. Since the microcar 125 offers the highest range and the most space for passengers among the LEV models, its substitution potential is equal to the total potential that results from the sum of all car trips that can be substituted by the LEV models.
3.2. Emission Reduction Potential
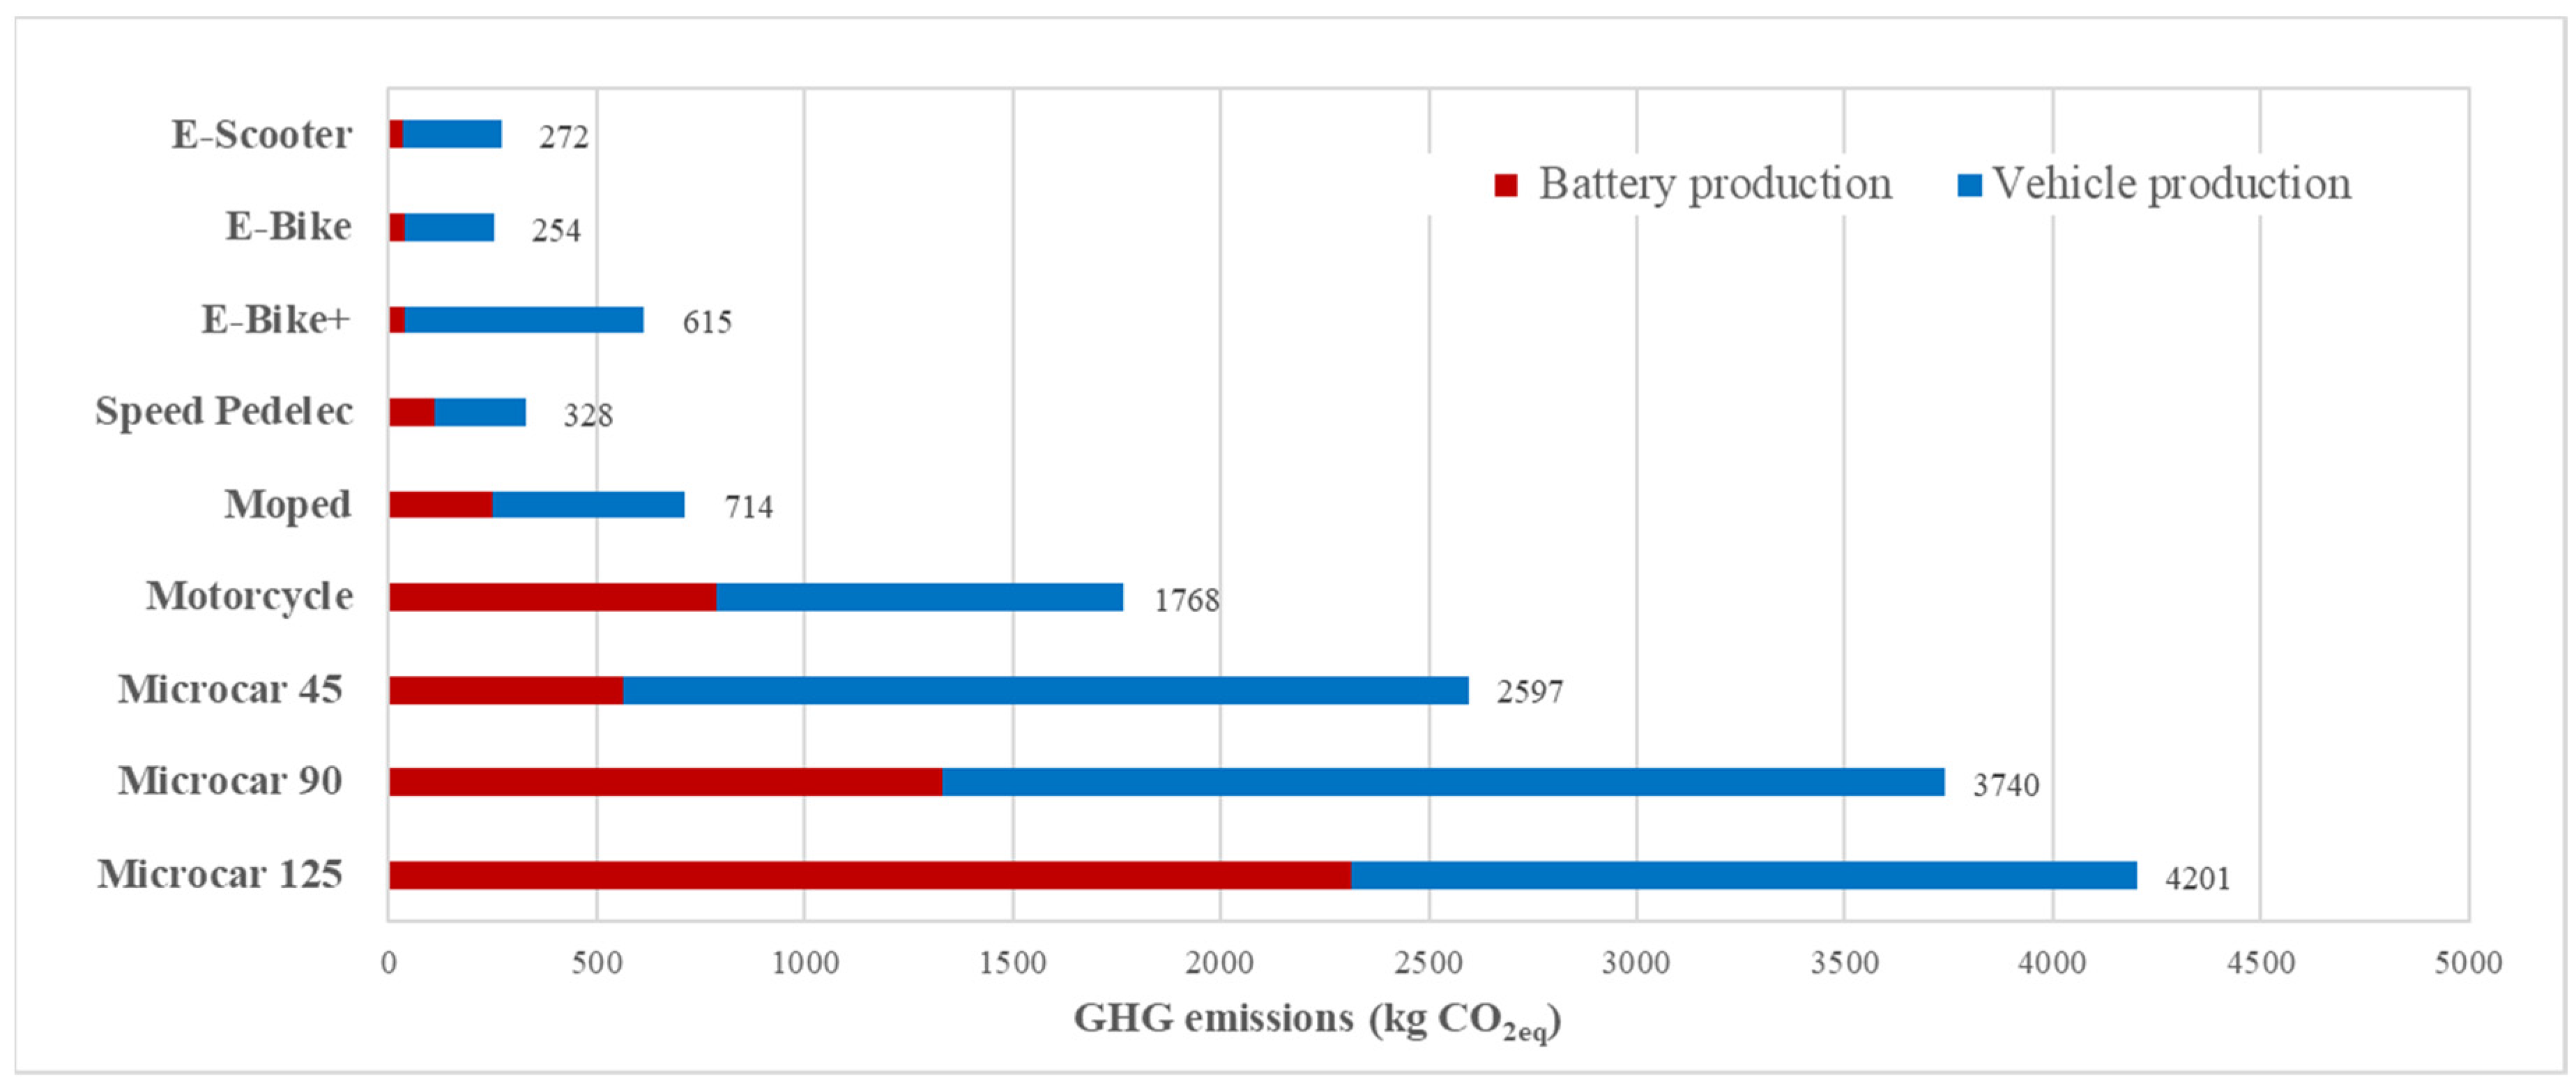
Battery size and capacity are found to play a decisive role in the overall greenhouse gas emissions. Emissions from battery and materials are directly related to battery capacity and vehicle weight. Consequently, microcars and motorcycles cause considerably more greenhouse gas emissions than smaller two−wheeler LEVs (
Figure 3). The microcars with the largest batteries (microcar 125 km/h) have around 16 times higher greenhouse gas emissions in their production stage than an e-bike. More than half of these microcar emissions stem from the production of the traction battery. Comparing the technical electric range of more than 250 km possible with this battery and the assumed relevant travel distance of 140 km per day, an optimization of battery size in relation to the vehicle use bears some emission reduction potential.
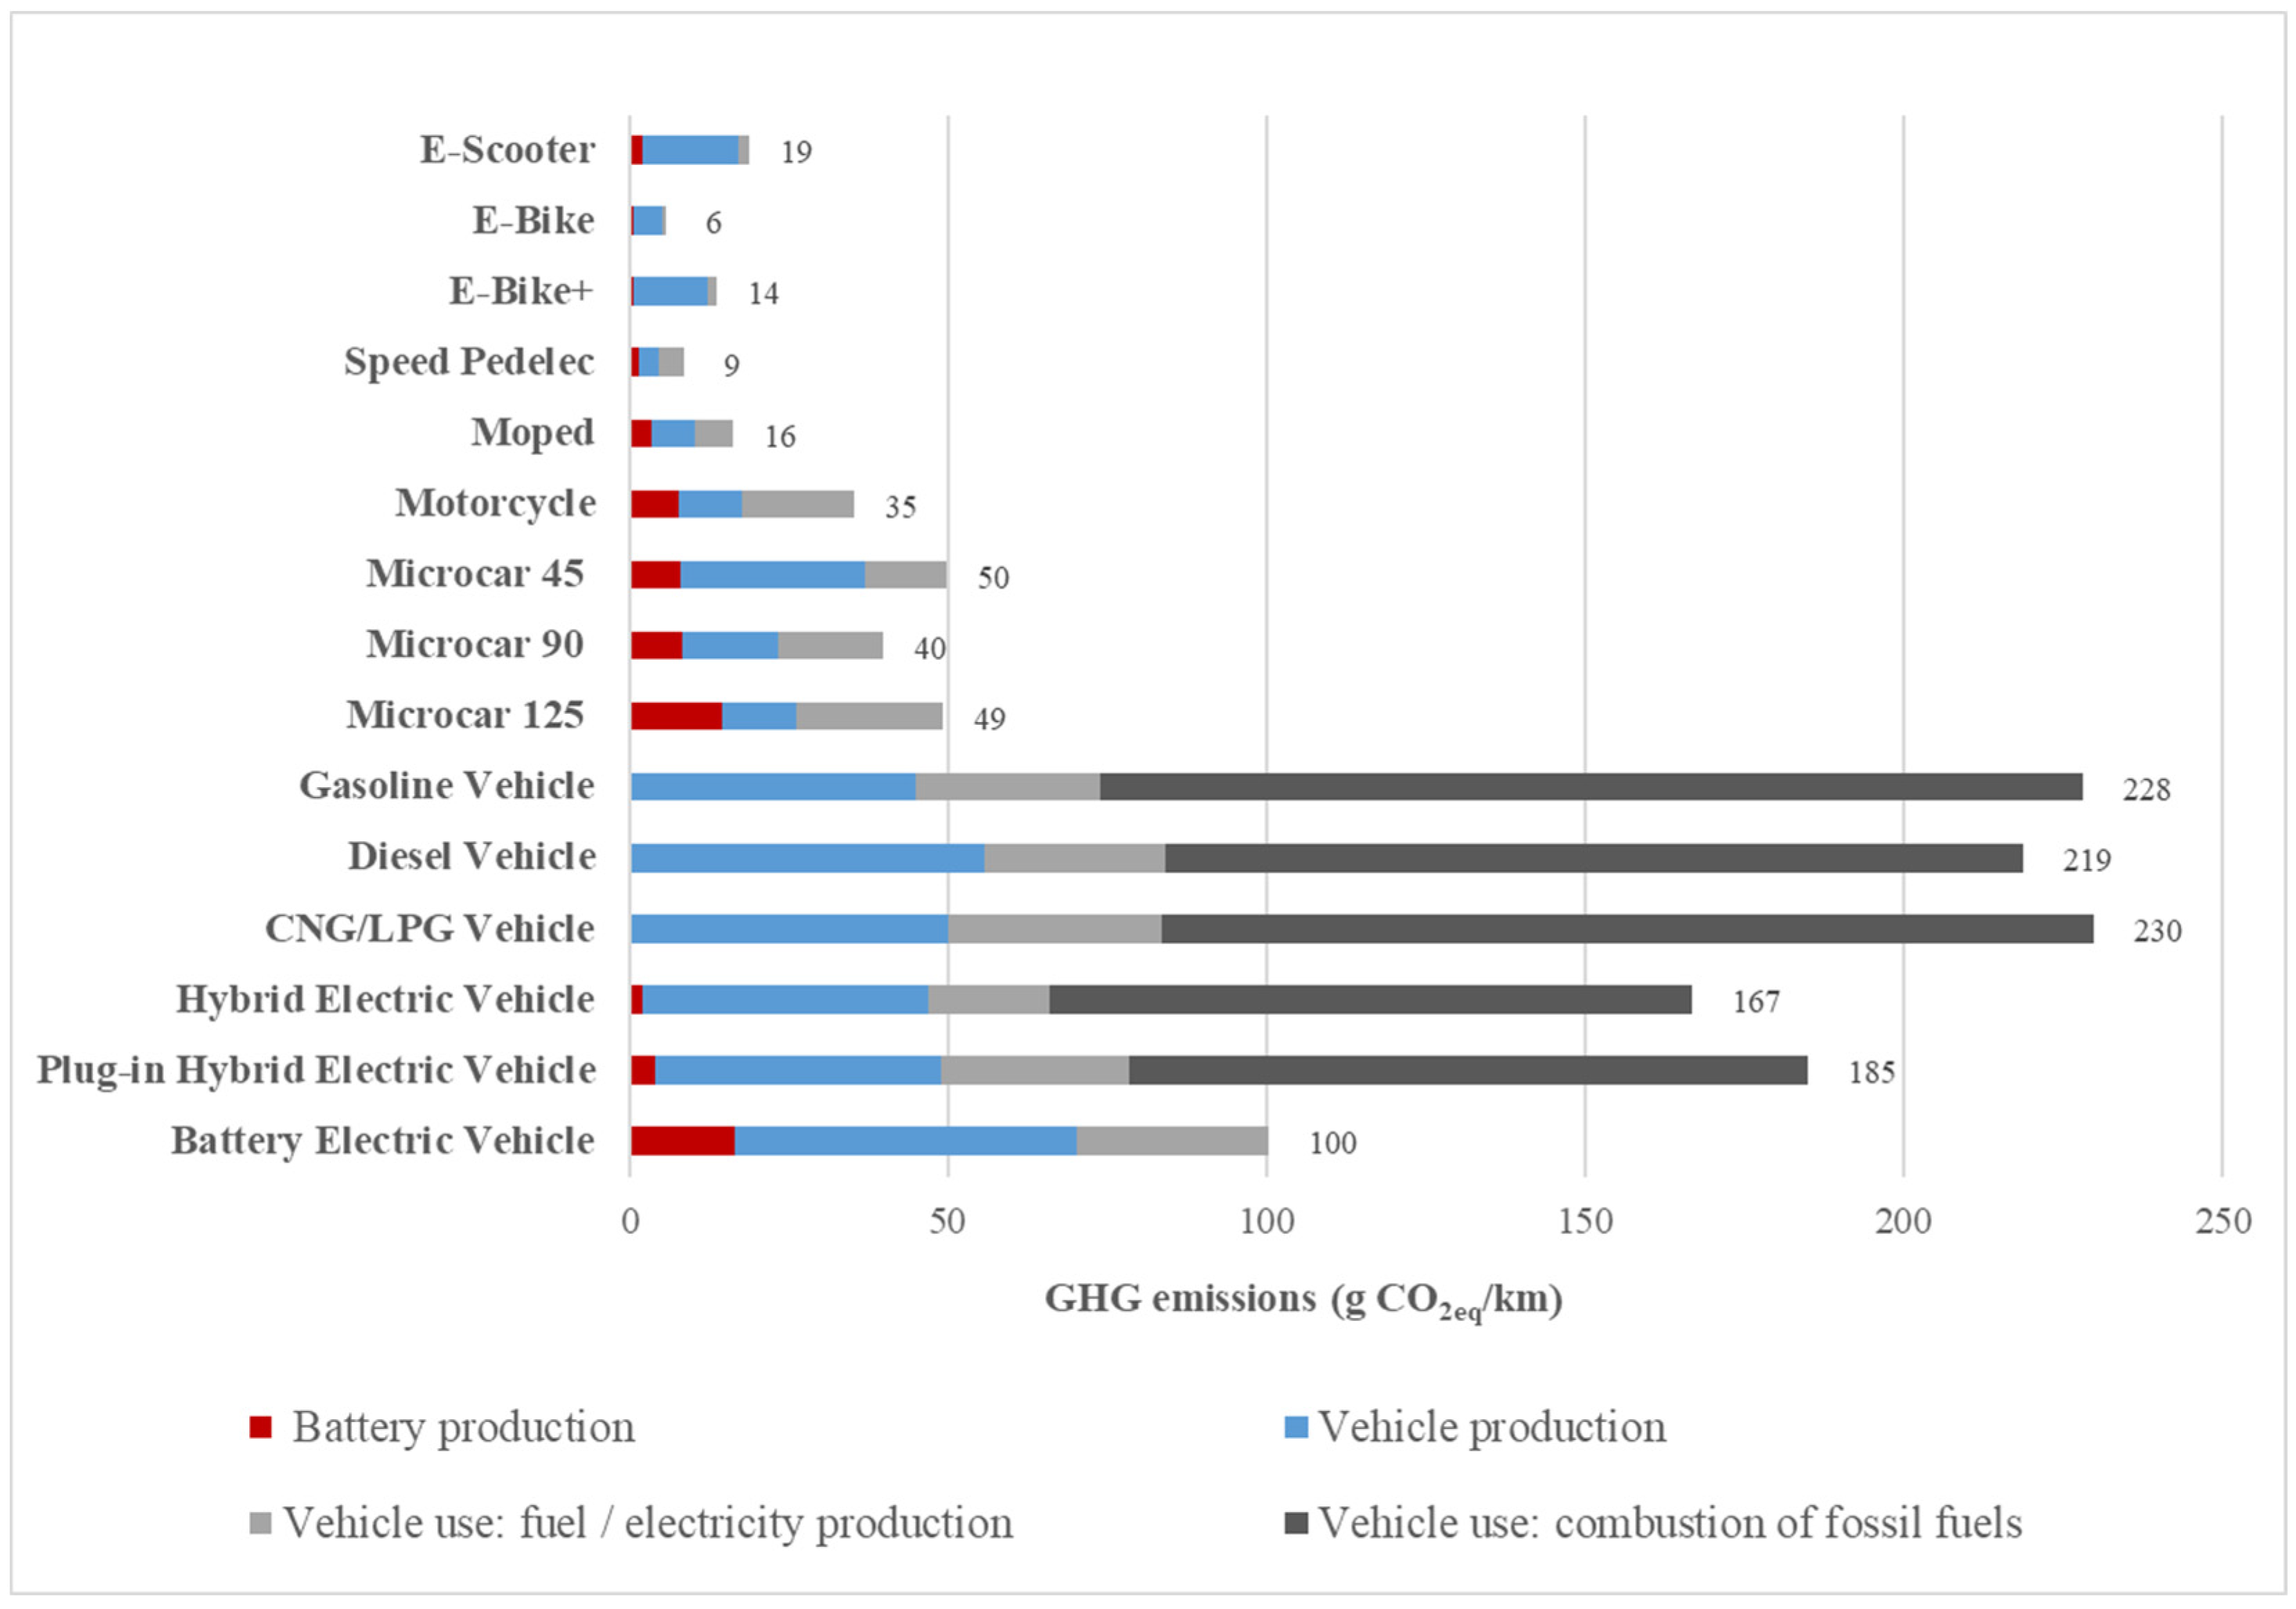
For a per-kilometer greenhouse gas emission comparison with passenger cars, lifetime mileages of the vehicles are highly relevant, as they reflect the different technical characteristics, as well as the different utilities, of the vehicle types. Due to the higher lifetime mileages of the microcar 90 km/h and microcar 125 km/h, the greenhouse gas emissions on a per km basis are closer to the smaller LEVs, which have a lower lifetime mileage (
Figure 4).
For the vehicle-use stage, apart from the direct emissions of fuel combustion, the indirect emissions of the traction electricity supply are decisive for the results. The greenhouse gas emissions for the baseline energy mix of 2030 amount to around 230 g CO
2eq per kWh. Compared to the emissions from fossil fuel combustion and production, the emissions from the traction electricity supply lead to significantly lower emissions in the case of electric vehicles. This applies for BEVs in comparison to other drive trains for the passenger car, and also for the LEVs. Due to their lower energy consumption for operation, the LEVs in the worst case still cause only half of the greenhouse gas emission emissions of a BEV, and less than a quarter of conventional gasoline or diesel passenger cars (
Figure 4).
When analyzing the substitutable trips with low-emission LEVs, the average greenhouse emissions of the LEVs (substituted mileage weighted average) is 24 g CO
2eq/km including vehicle production. This is only 12% of the replaced passenger car greenhouse gas emissions of 203 g CO
2eq/km. The average passenger car emissions represent the vehicle stock composition as described in
Section 2.3. This difference results in a high emission reduction potential. With the identified mileage substitution potential of 50% (see
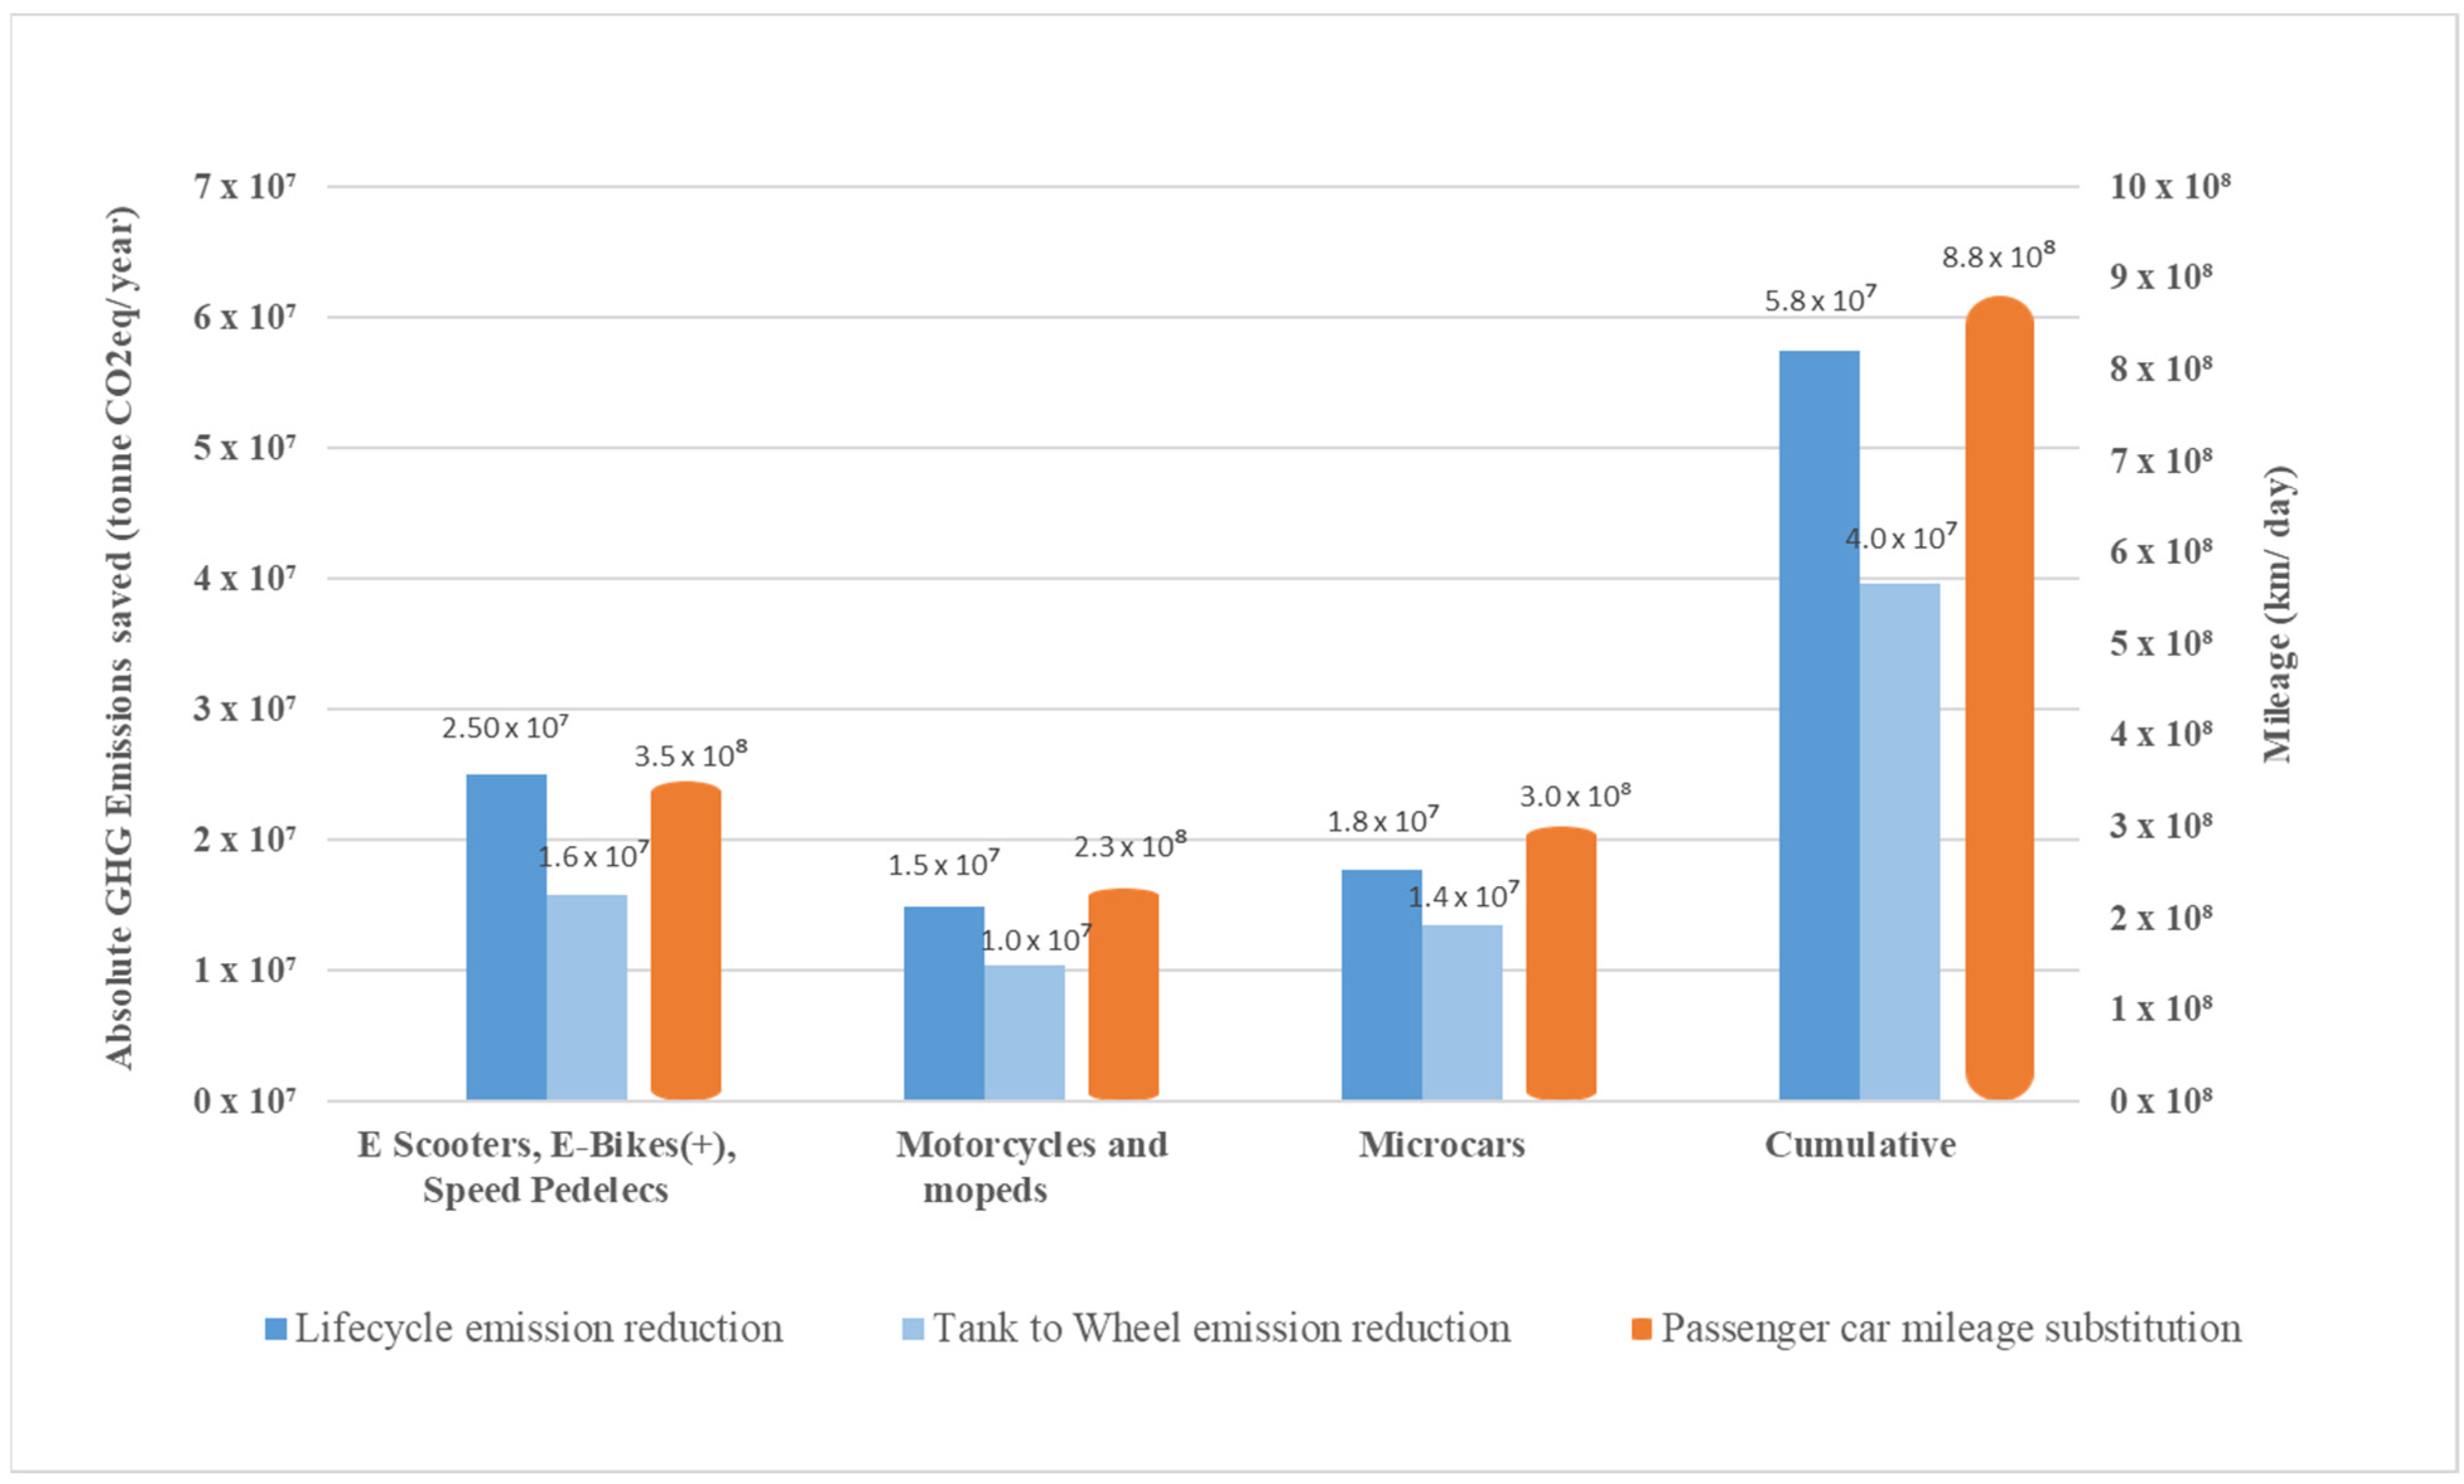
Section 3.1), an overall saving of 44% would be achieved compared to the use of passenger cars on these trips. In absolute numbers, this amounts to 157 kilo tons CO
2eq per day compared to 356 kilo tons CO
2eq per day. This is equivalent to a reduction of 58 Mio tons CO
2eq per year (
Figure 5). Overall, all LEV types contribute to this emission reduction potential with a slightly higher potential for small two-wheelers compared to microcars, mopeds, and motorcycles (
Figure 5). This can be understood with the fact that even with similar passenger car mileage substitution for e-scooters, e-bikes, and speed pedelecs when compared to microcars, they save more emissions on LCA and tank-to-wheel basis (
Figure 5), given their lower LCA emissions per kilometer (
Figure 4).
When evaluating the reduction potential that is allocated to the transport sector, only emissions on a tank-to-wheel basis would be considered. The analysis of the emission reduction potential with the tank-to-wheel system boundary leads to savings of 40 million tons CO
2eq per year (
Figure 5), with e-bikes having the highest contribution.
3.3. Sensitivity Analysis
A sensitivity analysis was performed with respect to influencing parameters such as vehicle range, lifetime mileage, and energy mix possibilities.
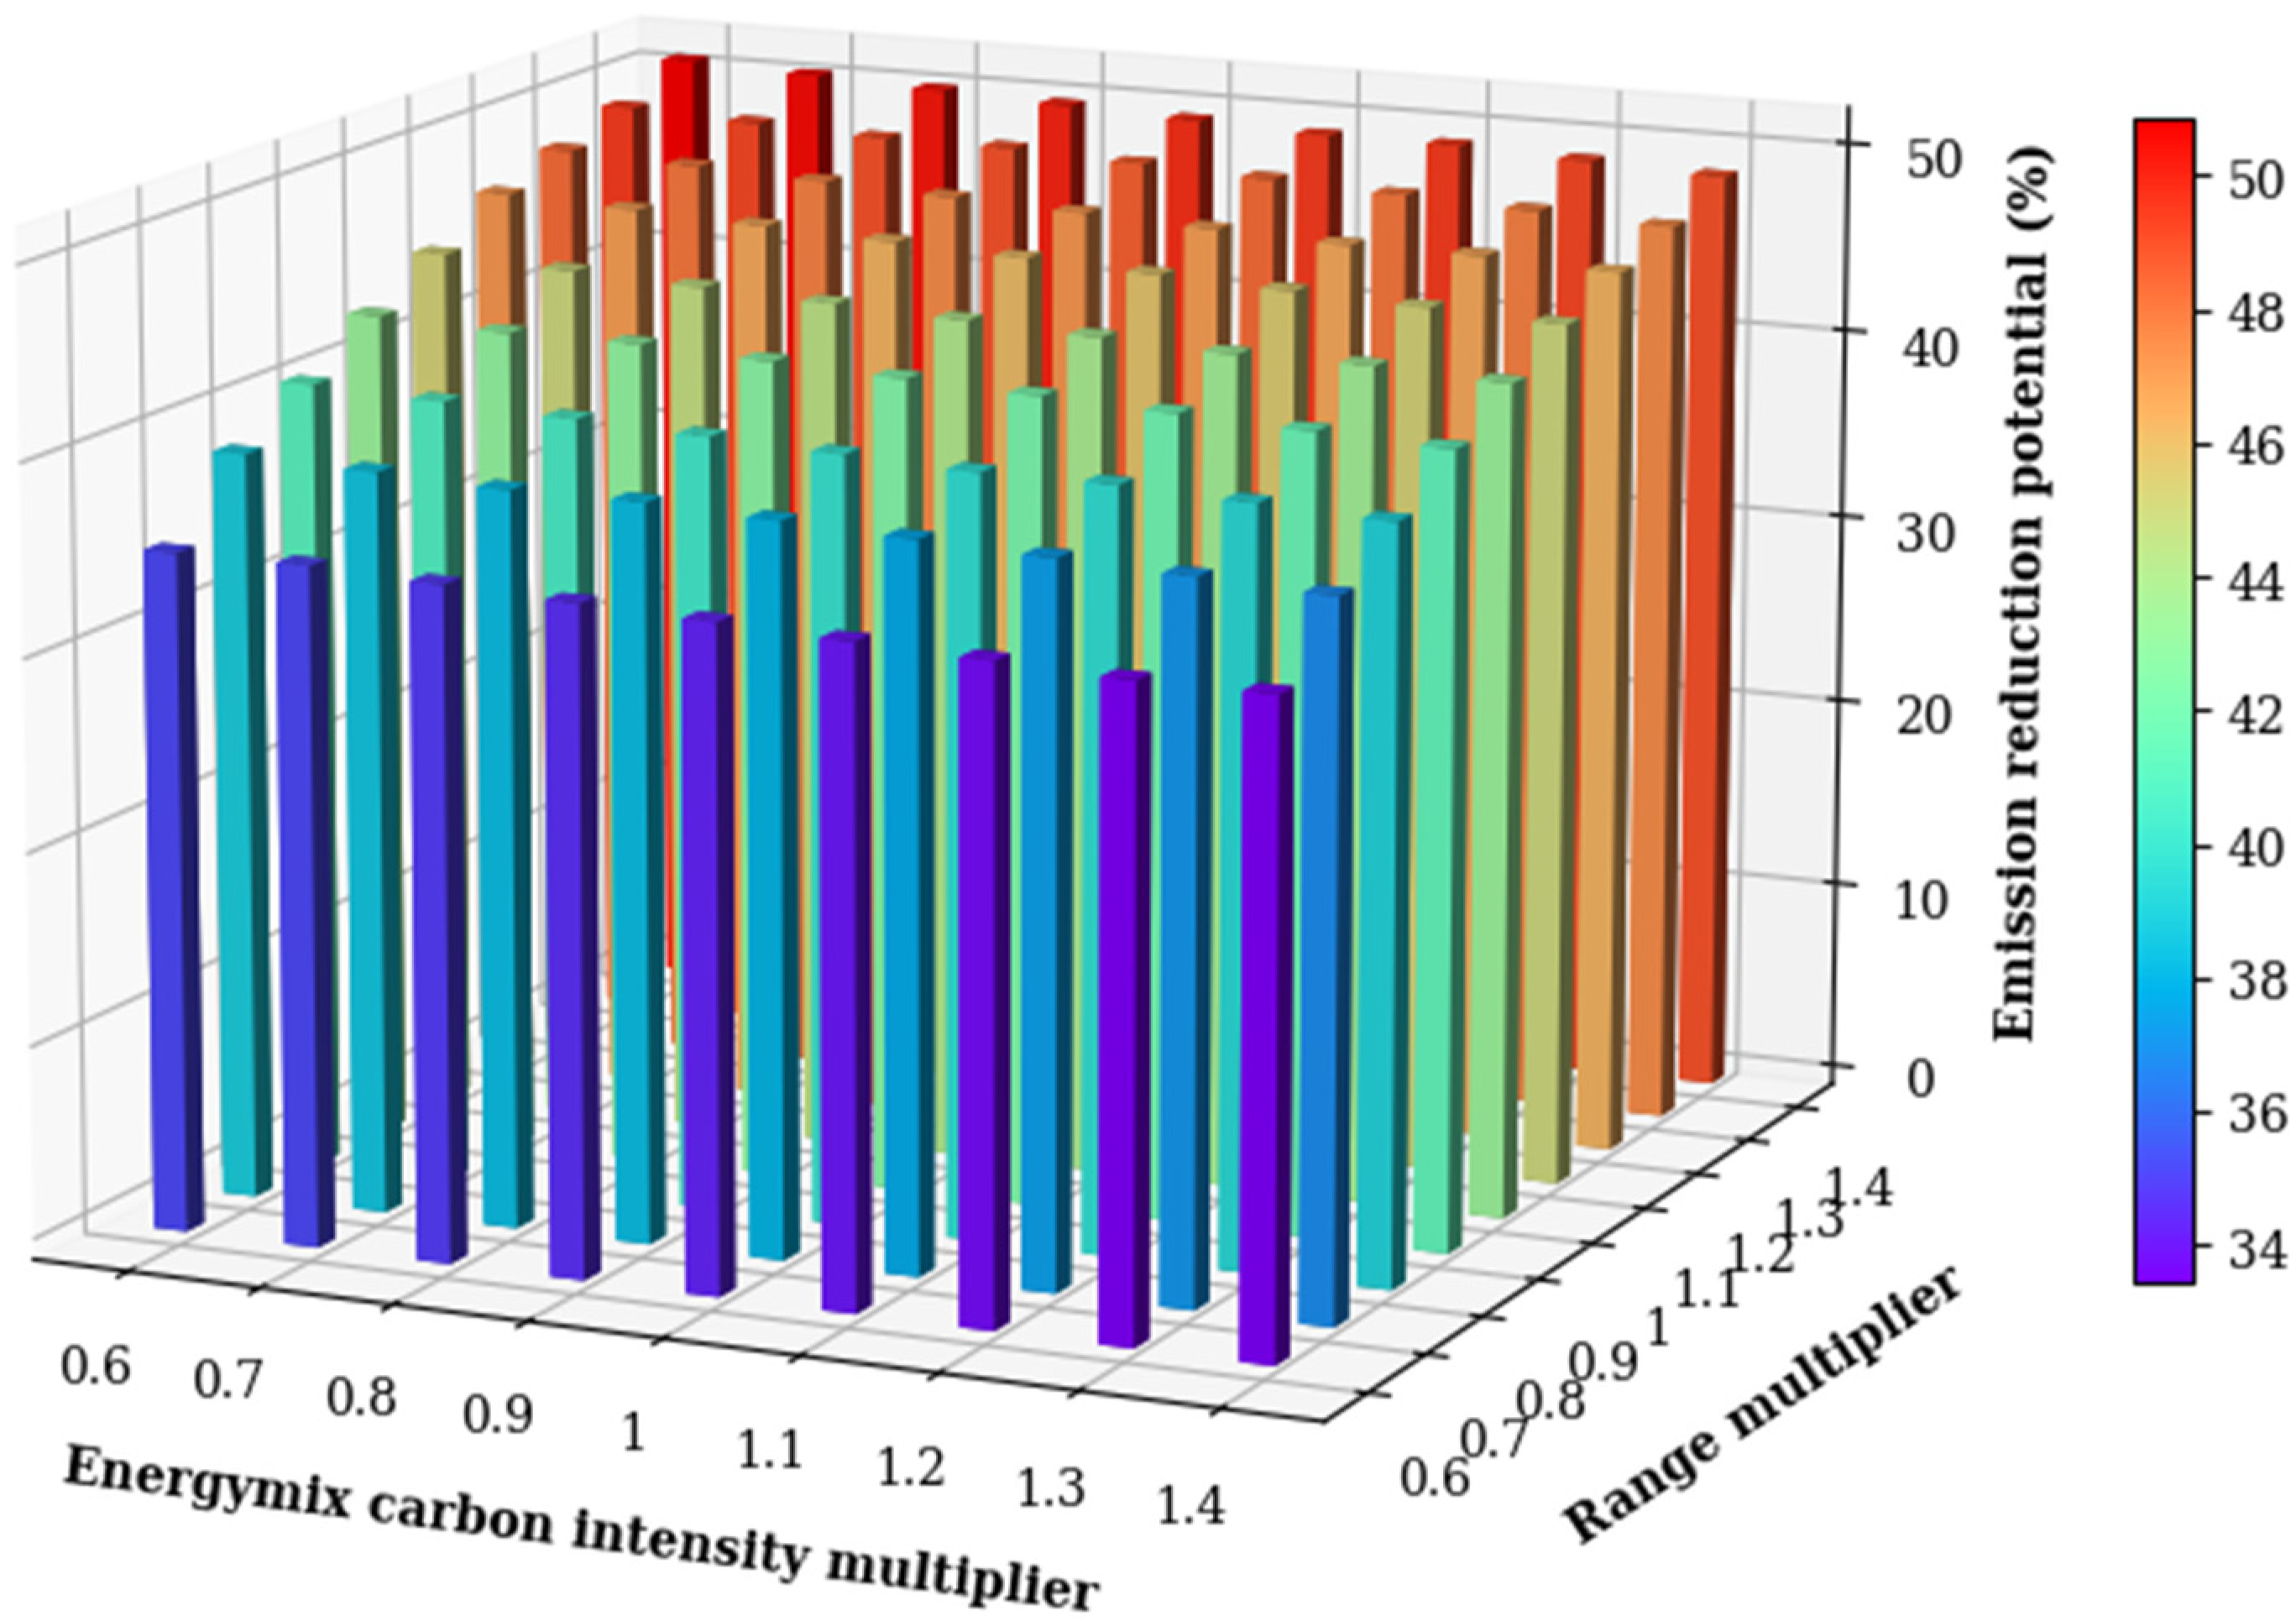
Figure 6 shows the variation in the LCA-based emission reduction potential by substituting emission optimum LEVs for passenger car trips. The variation is shown as a function of a common range multiplier applied to the range of all LEVs, which is the relevant travel distance in
Table 2 when considered for trip substitution and an energy mix carbon intensity multiplier that affects the emissions generated during LEV vehicle use. The alternative energy mix is related to around 140 g CO
2eq per kWh compared to 230 g CO
2eq per kWh of the baseline electricity mix. For the sensitivity analysis, a range between these two electricity mixes is used. The multipliers are applied to the baseline vehicle scenario parameters as explained in
Table 1 and
Table 2. This results in the carbon intensity for the electricity mix in the sensitivity analysis vary from 138 to 322 g CO
2eq per kWh.
As can be seen, the emission reduction potential varies from 33% to 51% of the total passenger car and motorcycle emissions calculated from the MiD dataset when both multipliers are varied from 0.6 to 1.4 times the baseline scenario value. The gradient of the resulting surface is more aligned towards the range multiplier direction, i.e., higher percentage change in emission reduction potential by change in range multiplier as more trips can be substituted by lower emitting LEVs. The effect of this seems larger than reducing the carbon intensity of the energy mix to as low as 60% of the assumed base scenario. On an average across this variable space, with a 10% increase in range, the emission reduction potential increases by approximately 2%, whereas for a 10% decrease in carbon intensity of the energy mix, the emission reduction potential increases by approximately 0.3%. It should be noted that rate of change of emission reduction potential is not constant with respect to the range multiplier, since it is also a function of the trip distribution in the MiD dataset and the parameters of the LEVs considered for substitution.
4. Discussion and Conclusions
The analysis quantifies a significant theoretical potential for decreasing greenhouse gas emissions with LEVs, and is a first step that sets the ground for future scientific work evaluating approaches and obstacles to realizing the emissions reduction potential of LEVs. It, thereby, gives way to further research on LEVs, and urges both policy makers and general users to steer towards comprehensive measures that to encourage a switch from cars to LEVs. Looking at today’s trends in the vehicle market in Germany, such as the increasing sales of SUVs, it seems obvious that the identified potential can only be realized if extensive measures are taken, and even then only in parts. High profit margins make it attractive for manufacturers to sell large, heavy, and expensive vehicles, which could be one of many reasons why hardly any LEVs are found in the portfolios of major manufacturers. However, also on the buyer side, there are currently still many obstacles to the market success of LEVs, which need to be illuminated in further studies.
The potential for trip substitution and reduction in greenhouse gas emissions might seem high at first glance, however, given that 60% of the car mileage in Germany results from trips under 50 km, and some LEVs can cover even longer trips, the result with 50% mileage replacement potential and respective emission reduction is plausible. Conservative assumptions were made regarding technical properties, substitutability of trips, and replaced vehicles. Evaluation of data from the German Federal Motor Transport Authority on new battery electric cars registered in Germany in the recent years show a trend towards batteries with higher capacity than today. As long as battery technology does not improve significantly regarding production-related greenhouse gas emissions, the life cycle impacts of electric cars would tend to worsen, and the relative potential of LEVs to reduce greenhouse gases would improve. Furthermore, it would be interesting to expand the scope of the study and analyze the extent to which LEVs can support modal shift and multimodal mobility. For instance, long car trips could be partly covered by using a privately owned or shared EV in combination with long-distance trains, thereby, further reducing emissions. A mix of mobility solutions is necessary for future sustainable mobility, as LEVs are no stand-alone solution for substituting car trips and reducing car ownership. Extensive sustainability effects would be achieved with a holistic mobility approach, integrating LEVs in a system together with a high share of public transport, active modes, low private care ownership, attractive vehicle-sharing offers, and other sustainable mobility components such as reducing the number of trips by approaches such as the city of short distances.
The analyses quantify as a first step of theoretical potential to substitute car trips and, thereby, reduce greenhouse gas emissions, not considering aspects of user acceptance, or possible changes in mobility behavior, infrastructure, or political framework conditions. Future research should, therefore, evaluate paths towards greater use of LEVs, with specific measures to promote a sustainable and safe use of LEVs, and investigate social aspects, such as user acceptance and preferences in mode choice, as well as technological aspects such as improved vehicle safety.
Author Contributions
Conceptualization, S.E., M.B. and L.G..; methodology, S.E., I.D., M.B., L.G. and R.S.; software, S.E., I.D., L.G. and R.S.; validation, I.D., M.B. and L.G.; formal analysis, I.D. and R.S.; investigation, S.E., I.D. and M.B.; resources, S.E. and L.G.; data curation, I.D.; writing—original draft preparation, S.E., I.D., M.B., L.G. and R.S; writing—review and editing, S.E., I.D. and M.B.; visualization, I.D. and R.S.; supervision, S.E. and M.B.; project administration, M.B.; funding acquisition, M.B. All authors have read and agreed to the published version of the manuscript.
Funding
This research was funded by LEVA EU.
Data Availability Statement
Not applicable.
Acknowledgments
We thank the members of the scientific panel of this project for the constructive comments and fruitful discussion. We further thank our colleagues Robert Hahn and Stephan Schmid for supporting us with a critical review of our results.
Conflicts of Interest
The authors declare no conflict of interest.
References
- IEA. Global CO2 Emissions by Sector. Available online: https://www.iea.org/data-and-statistics/charts/global-co2-emissions-by-sector-2019 (accessed on 22 December 2021).
- Brost, M.; Ewert, A.; Schmid, S.; Eisenmann, C.; Gruber, J.; Klauenberg, J.; Stieler, S. Elektrische Klein− und Leichtfahrzeuge: Chancen und Potenziale für Baden−Württemberg (Small and Light Electric Vehicles: Opportunities and Potential for Baden−Württemberg). Project Report. 2019. Available online: https://elib.dlr.de/133048/1/LEV_e−mobil_BW_Leichtfahrzeug_Studie.pdf (accessed on 3 March 2022).
- Gebhardt, L.; Ehrenberger, S.; Wolf, C.; Cyganski, R. Can shared E−scooters reduce CO2 emissions by substituting car trips in Germany? Transp. Res. Part D Transp. Environ. 2011, 109, 103328. [Google Scholar] [CrossRef]
- Regulation (EU) No 168/2013 of the European Parliament and of the Council of 15 January 2013 on the Approval and Market Surveillance of Two− or Three−Wheel Vehicles and Quadricycles (Text with EEA Relevance). Available online: https://eur−lex.europa.eu/legal−content/EN/TXT/?uri=CELEX%3A02013R0168−20201114 (accessed on 12 April 2022).
- Brost, M.; Gebhardt, L.; Ehrenberger, S.; Dasgupta, I.; Hahn, R. The Potential of Light Electric Vehicles for Climate Protection through Substitution for Passenger Car Trips−Germany as a Case Study. Project Report 2022. Available online: https://elib.dlr.de/186036/1/2022−03−24_LEV4Climate_DLR_LEVA−EU_report.pdf (accessed on 24 May 2022).
- Federal Ministry of Transport and Digital Infrastructure (BMVI). Mobillitaet in Deutschland (Mobility in Germany). Available online: http://www.mobilitaet−in−deutschland.de/publikationen2017.html (accessed on 22 December 2021).
- Nobis, C.; Köhler, K. Mobilität in Deutschland–MiD Nutzerhandbuch (User Guide), Study by infas, DLR, IVT and infas 360 (FE−Nr. 70.904/15); Federal Minister of Transport and Digital Infrastructure: Bonn/Berlin, Germany, 2018; Available online: www.mobilitaet−in−deutschland.de (accessed on 23 September 2021).
- Wernet, G.; Bauer, C.; Steubing, B.; Reinhard, J.; Moreno-Ruiz, E.; Weidema, B. The Ecoinvent Database Version 3 (Part I): Overview and Methodology. Int. J. Life Cycle Assess. 2016, 21, 1218–1230. Available online: www.ecoinvent.org (accessed on 23 September 2021). [CrossRef]
- Severengiz, S.; Finke, S.; Schelte, N.; Wendt, N. Life Cycle Assessment on the Mobility Service E−Scooter Sharing. In Proceedings of the 2020 IEEE European Technology and Engineering Management Summit, E−TEMS 2020. Dortmund, Germany, 5–7 March 2020. [Google Scholar]
- Moreau, H.; Meux, L.J.; Zeller, V.; D’Ans, P.; Ruwet, C.; Achten, W.M.J. Dockless e−scooter: A green solution for mobility? Comparative case study between dockless e−scooters, displaced transport, and personal e−scooters. Sustainability 2020, 12, 1803. [Google Scholar] [CrossRef]
- Bonilla-Alicea, R.J.; Watson, B.C.; Shen, Z.; Tamayo, L.; Telenko, C. Life cycle assessment to quantify the impact of technology improvements in bike−sharing systems. J. Ind. Ecol. 2020, 24, 138–148. [Google Scholar] [CrossRef]
- Kerdlap, P.; Gheewala, S.H. Electric Motorcycles in Thailand—A Life Cycle Perspective. J. Ind. Ecol. 2016, 20, 1399–1411. [Google Scholar] [CrossRef]
- Cox, B.L.; Mutel, C.L. The environmental and cost performance of current and future motorcycles. Appl. Energy 2018, 212, 1013–1024. [Google Scholar] [CrossRef]
- Helmers, E.; Dietz, J.; Weiss, M. Sensitivity Analysis in the Life−Cycle Assessment of Electric vs. Combustion Engine Cars under Approximate Real−World Conditions. Sustainability 2020, 12, 1241. [Google Scholar] [CrossRef]
- Dai, Q.; Kelly, J.; Dunn, J.; Benavides, P. Update of Bill−of−Materials and Cathode Materials Production for Lithium−Ion Batteries in the GREET® Model, Memo 2018. Available online: www.greet.es.anl.gov (accessed on 23 September 2021).
- INFRAS. Handbook Emission Factors for Road Transport (HBEFA); Bundesamt für Umwelt BAFU: Bern, Switzerland; Umweltbundesamt GmbH: Vienna, Austria; Umweltbundesamt: Dessau, Germany; Swedish Transport Adiministration: Borlänge, Sweden; Norwegian Environment Agency: Oslo, Norway; Joint Research Centre: Ispra, Italy, 2017. [Google Scholar]
- Drees, T.; Medert, H.; Meinecke, M.; Halici, C. Netzentwicklungsplan Strom 2035 (2021), Zweiter Entwurf|Übertragungsnetzbetreiber CC−BY−4.0. 2021. Available online: https://www.netzentwicklungsplan.de/sites/default/files/paragraphs-files/NEP_2035_V2021_2_Entwurf_Teil1.pdf (accessed on 18 January 2022).
- Kopernikus−Projekt Ariadne, Ariadne−Report: Deutschland auf dem Weg zur Klimaneutralität 2045−Szenarien und Pfade im Modellvergleich. 2021. Available online: https://ariadneprojekt.de/publikation/deutschland-auf-dem-weg-zur-klimaneutralitat-2045-szenarienreport/ (accessed on 2 February 2022).
| Publisher’s Note: MDPI stays neutral with regard to jurisdictional claims in published maps and institutional affiliations. |
© 2022 by the authors. Licensee MDPI, Basel, Switzerland. This article is an open access article distributed under the terms and conditions of the Creative Commons Attribution (CC BY) license (https://creativecommons.org/licenses/by/4.0/).


 ,
, 


