
Inductive Power Transmission System for Electric Car Charging Phase: Modeling plus Frequency Analysis


Abstract
:1. Introduction
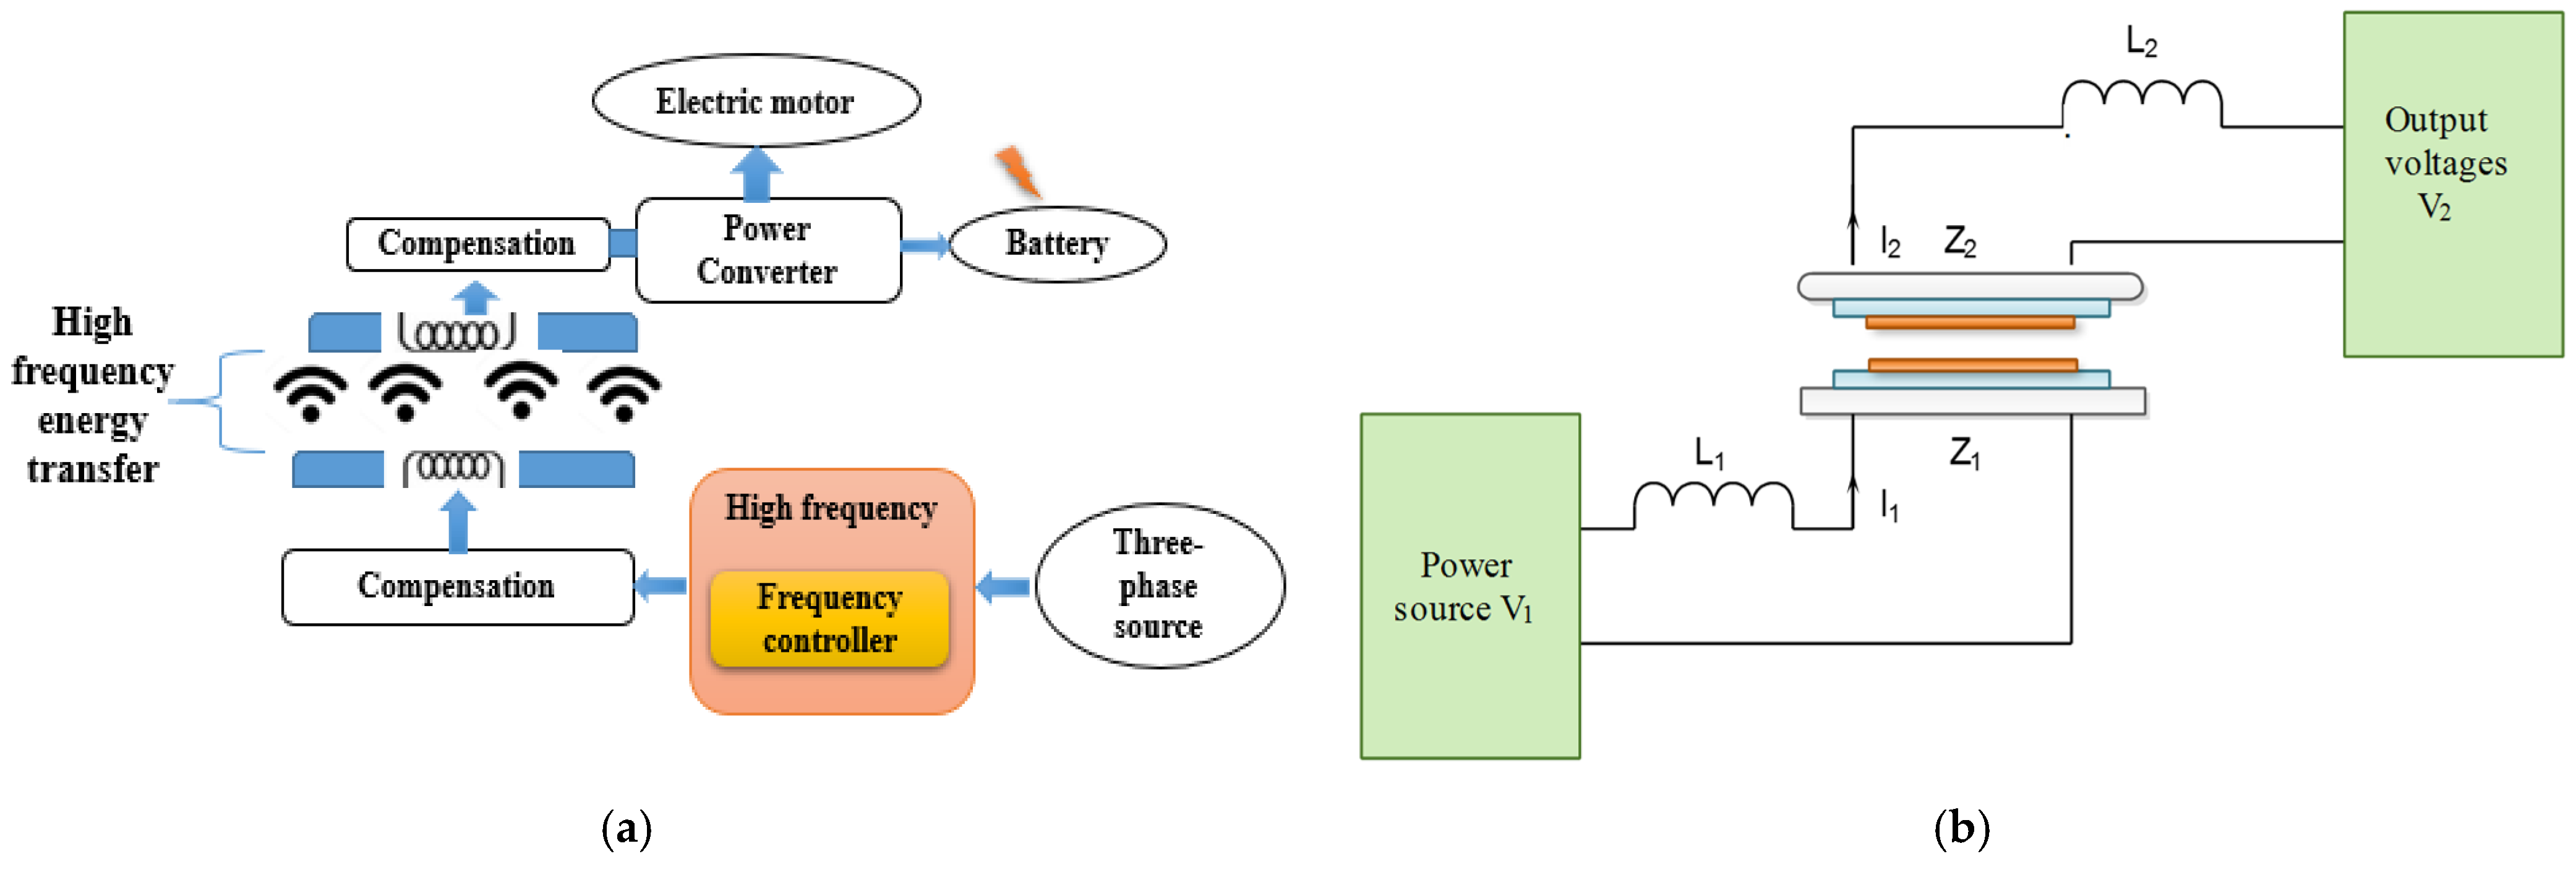
2. Wireless Charging System Presentation and Modelisation
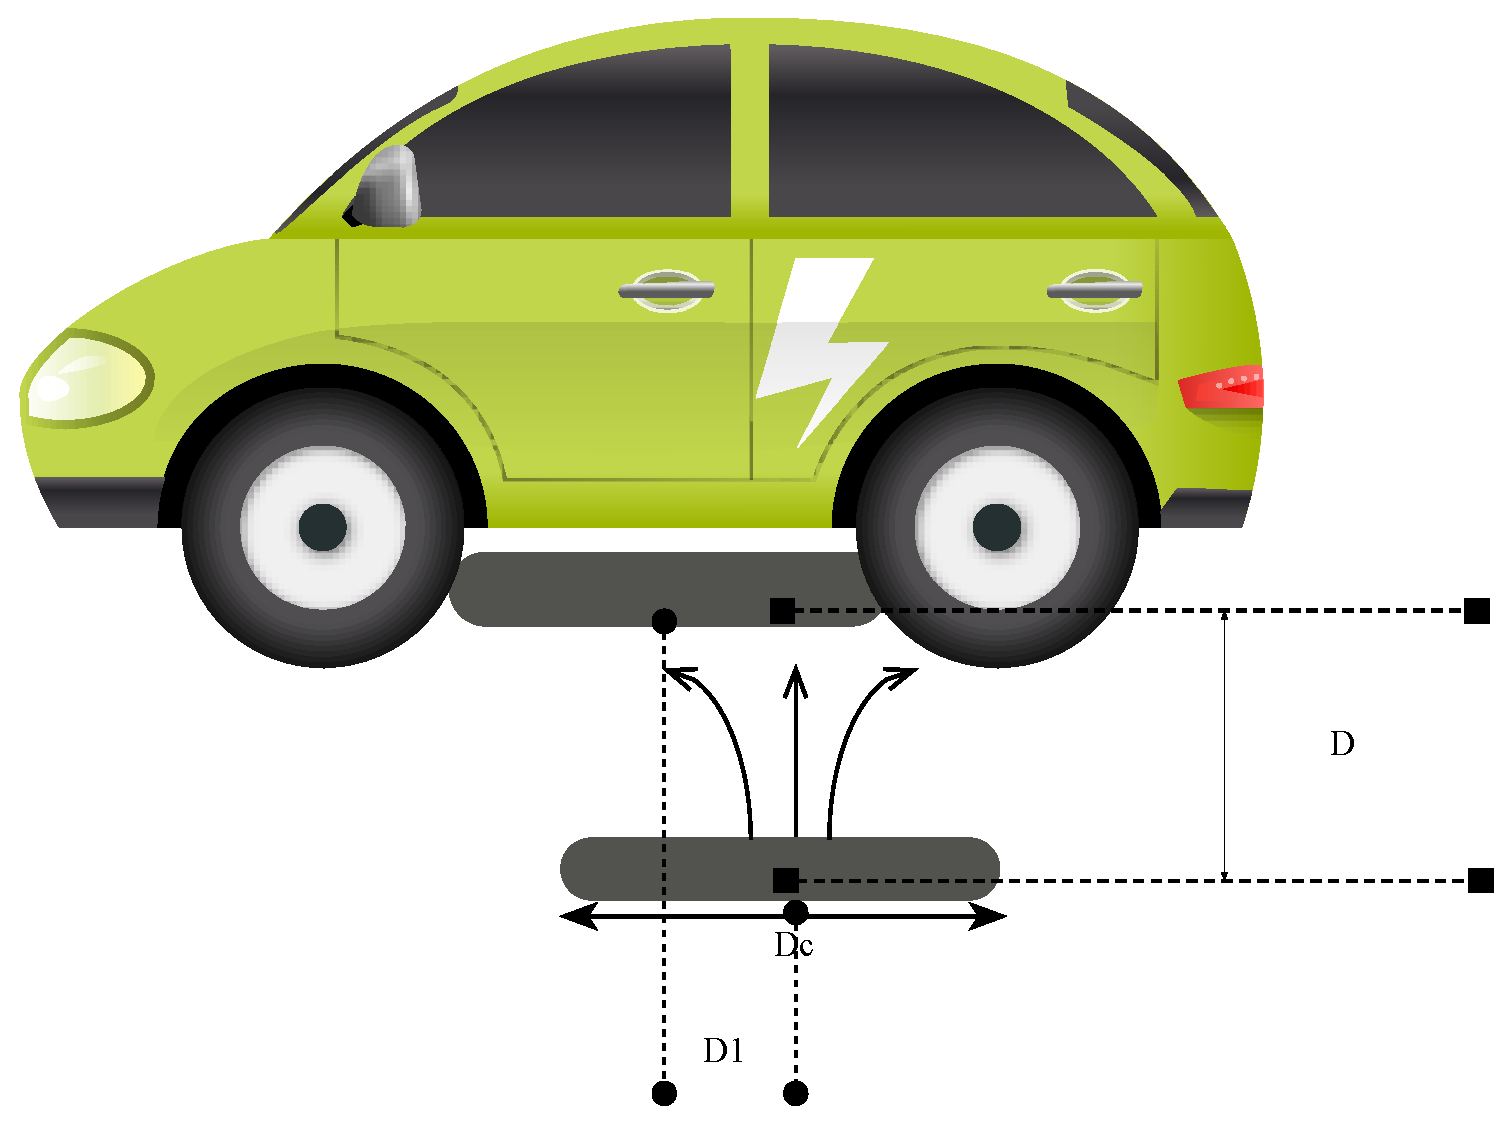
2.1. The Position of the Frequency Controller
2.2. Model of the Wireless Charging System
2.2.1. Static Modeling
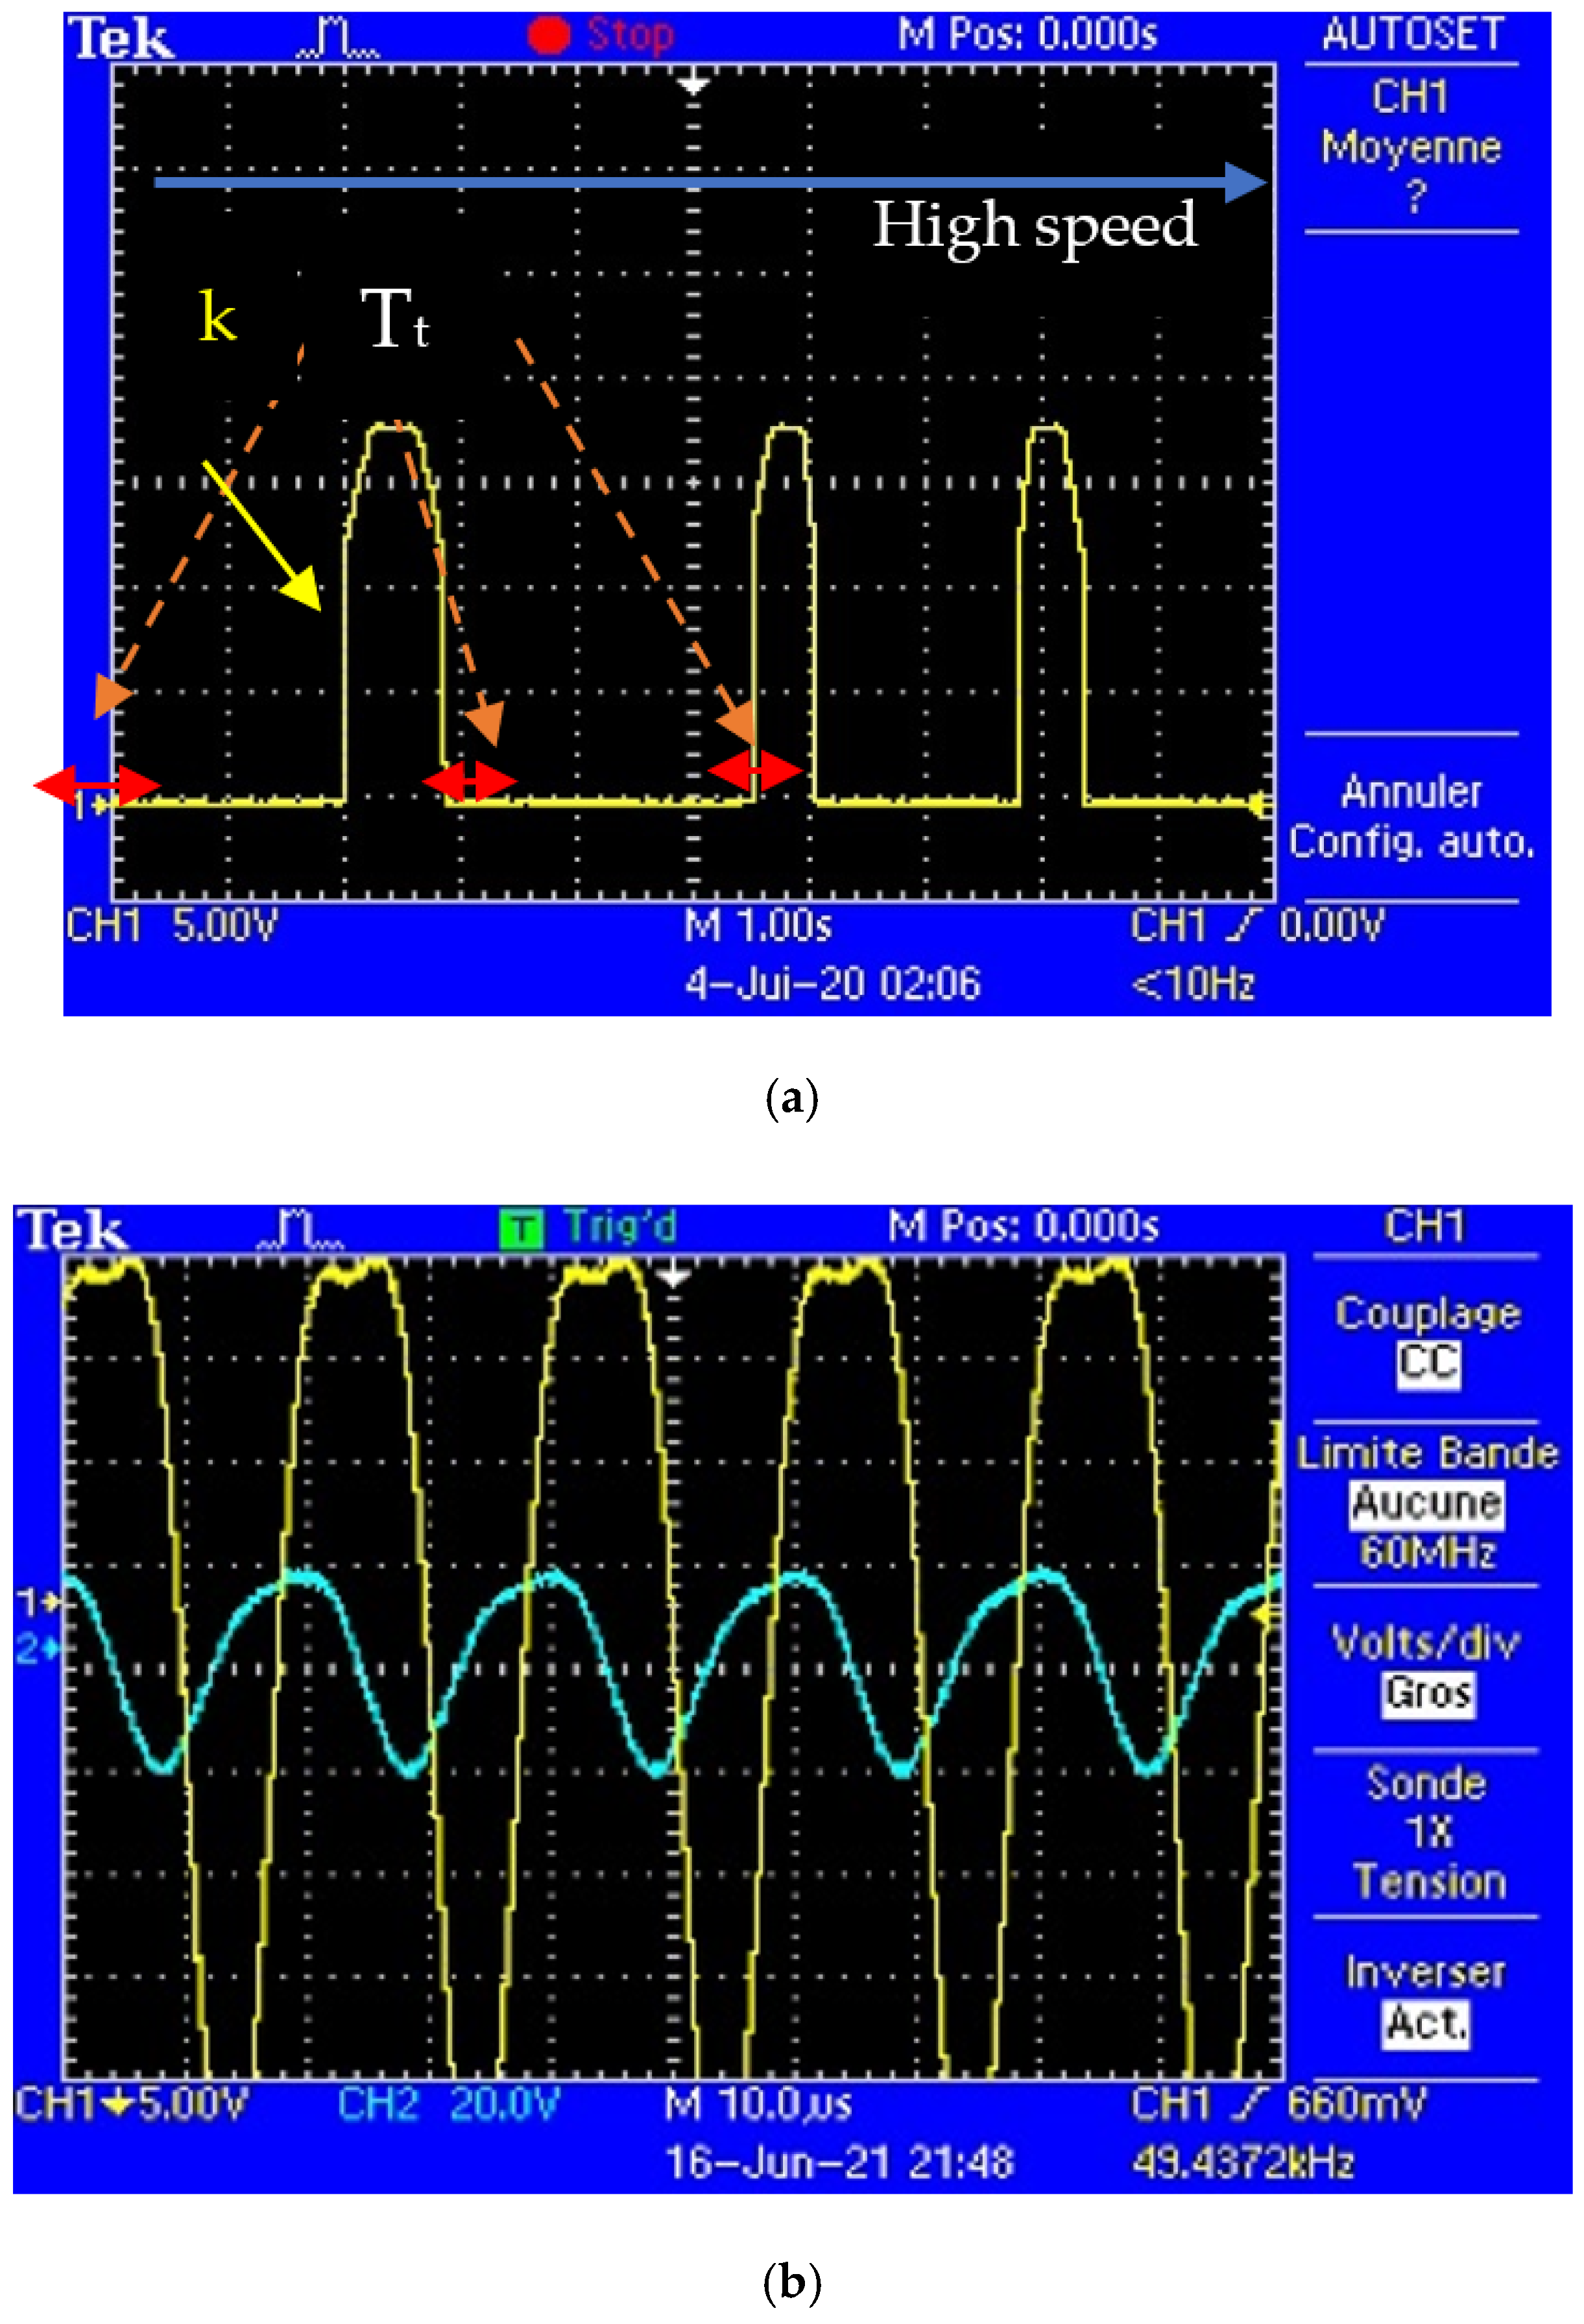
2.2.2. Dynamic Modeling
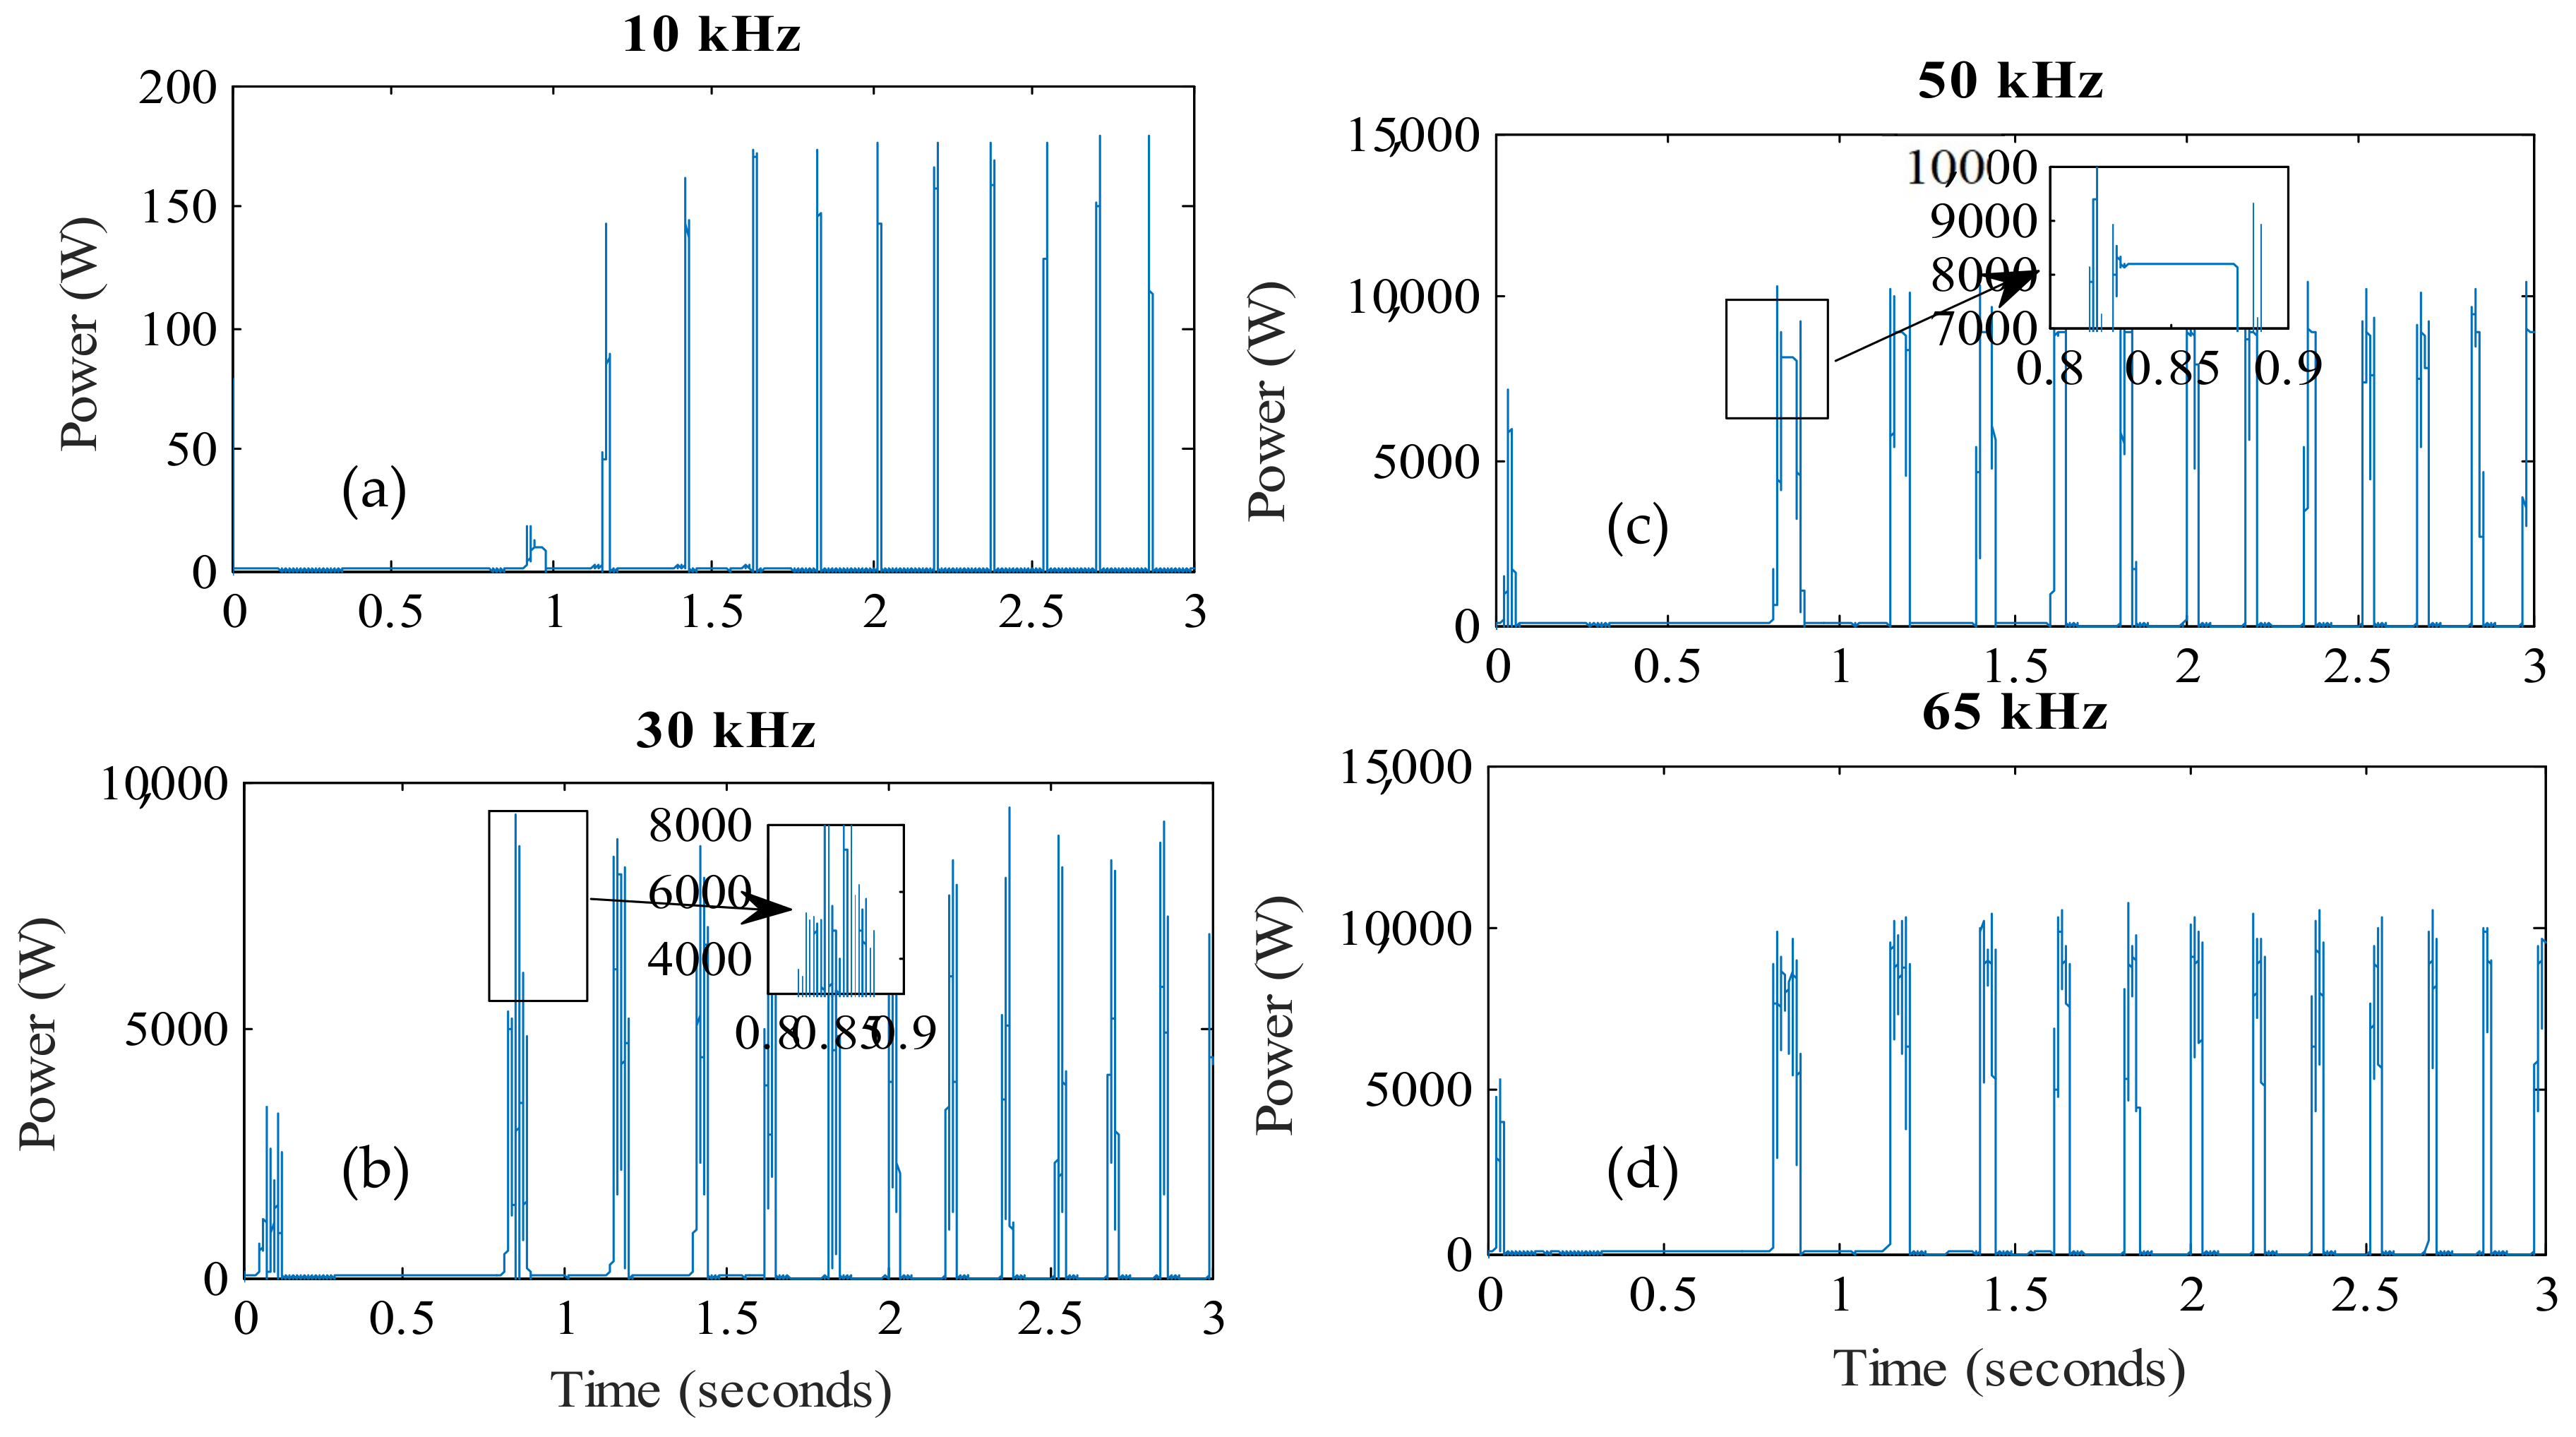
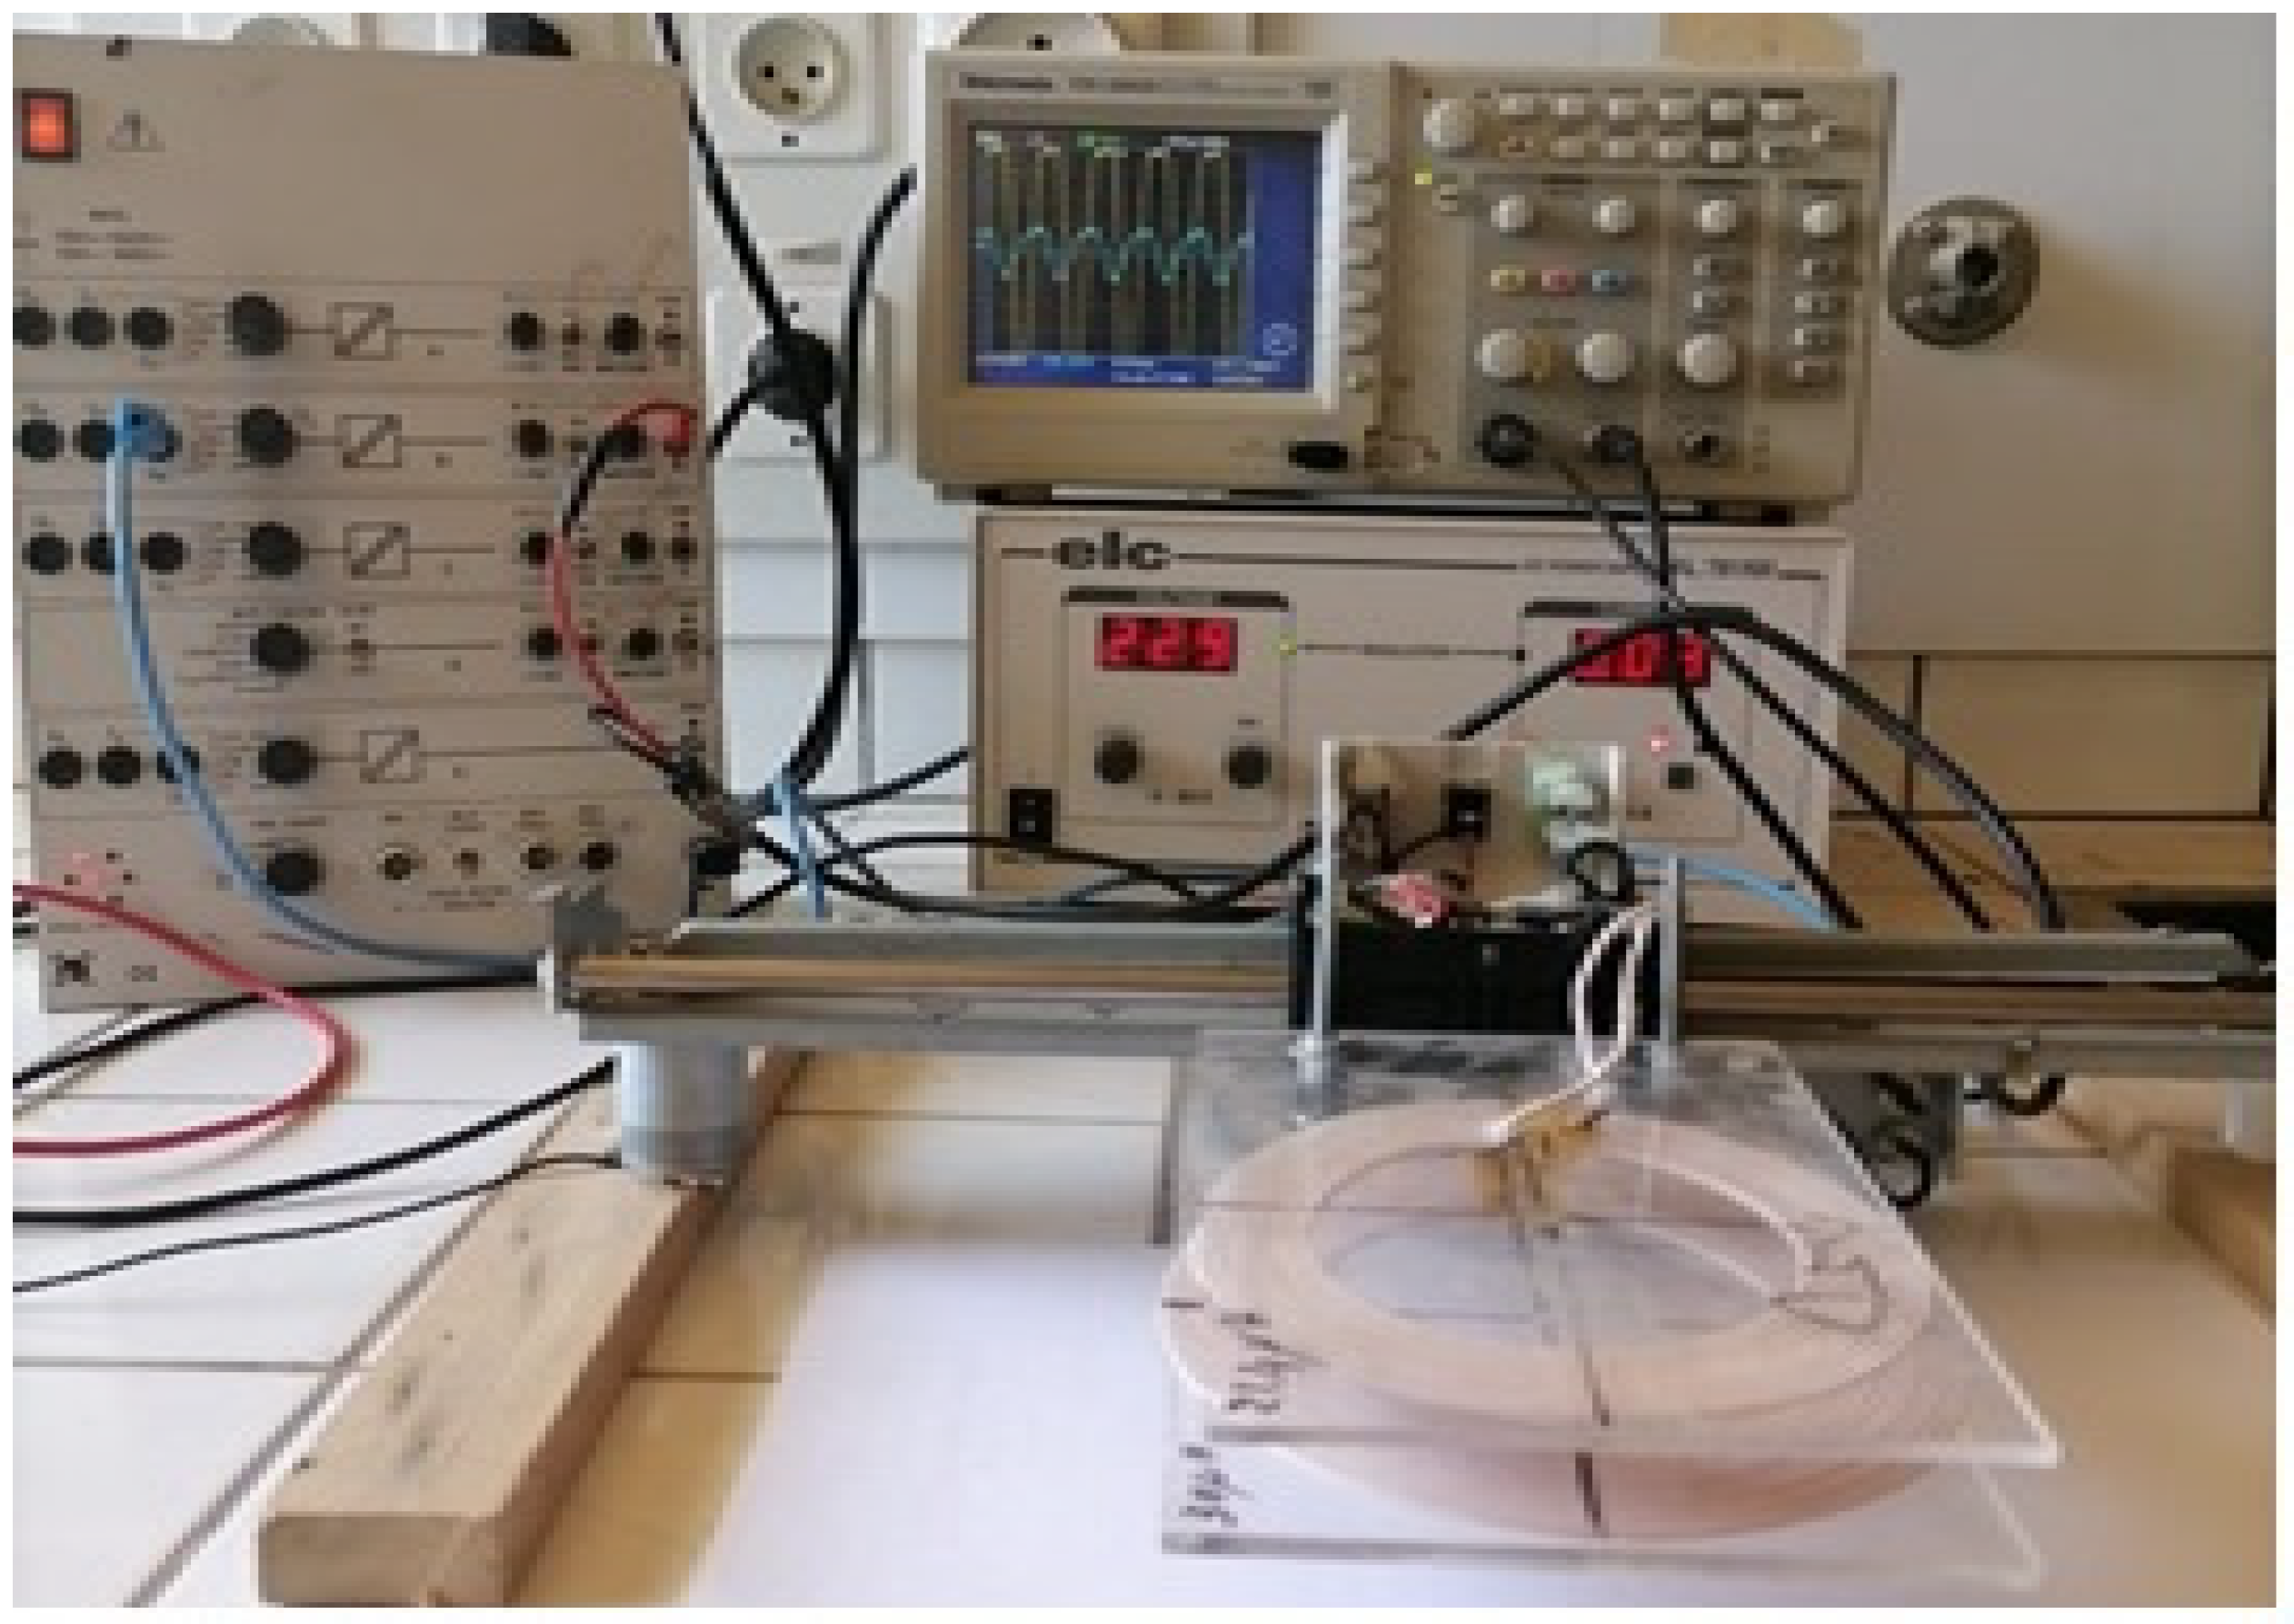
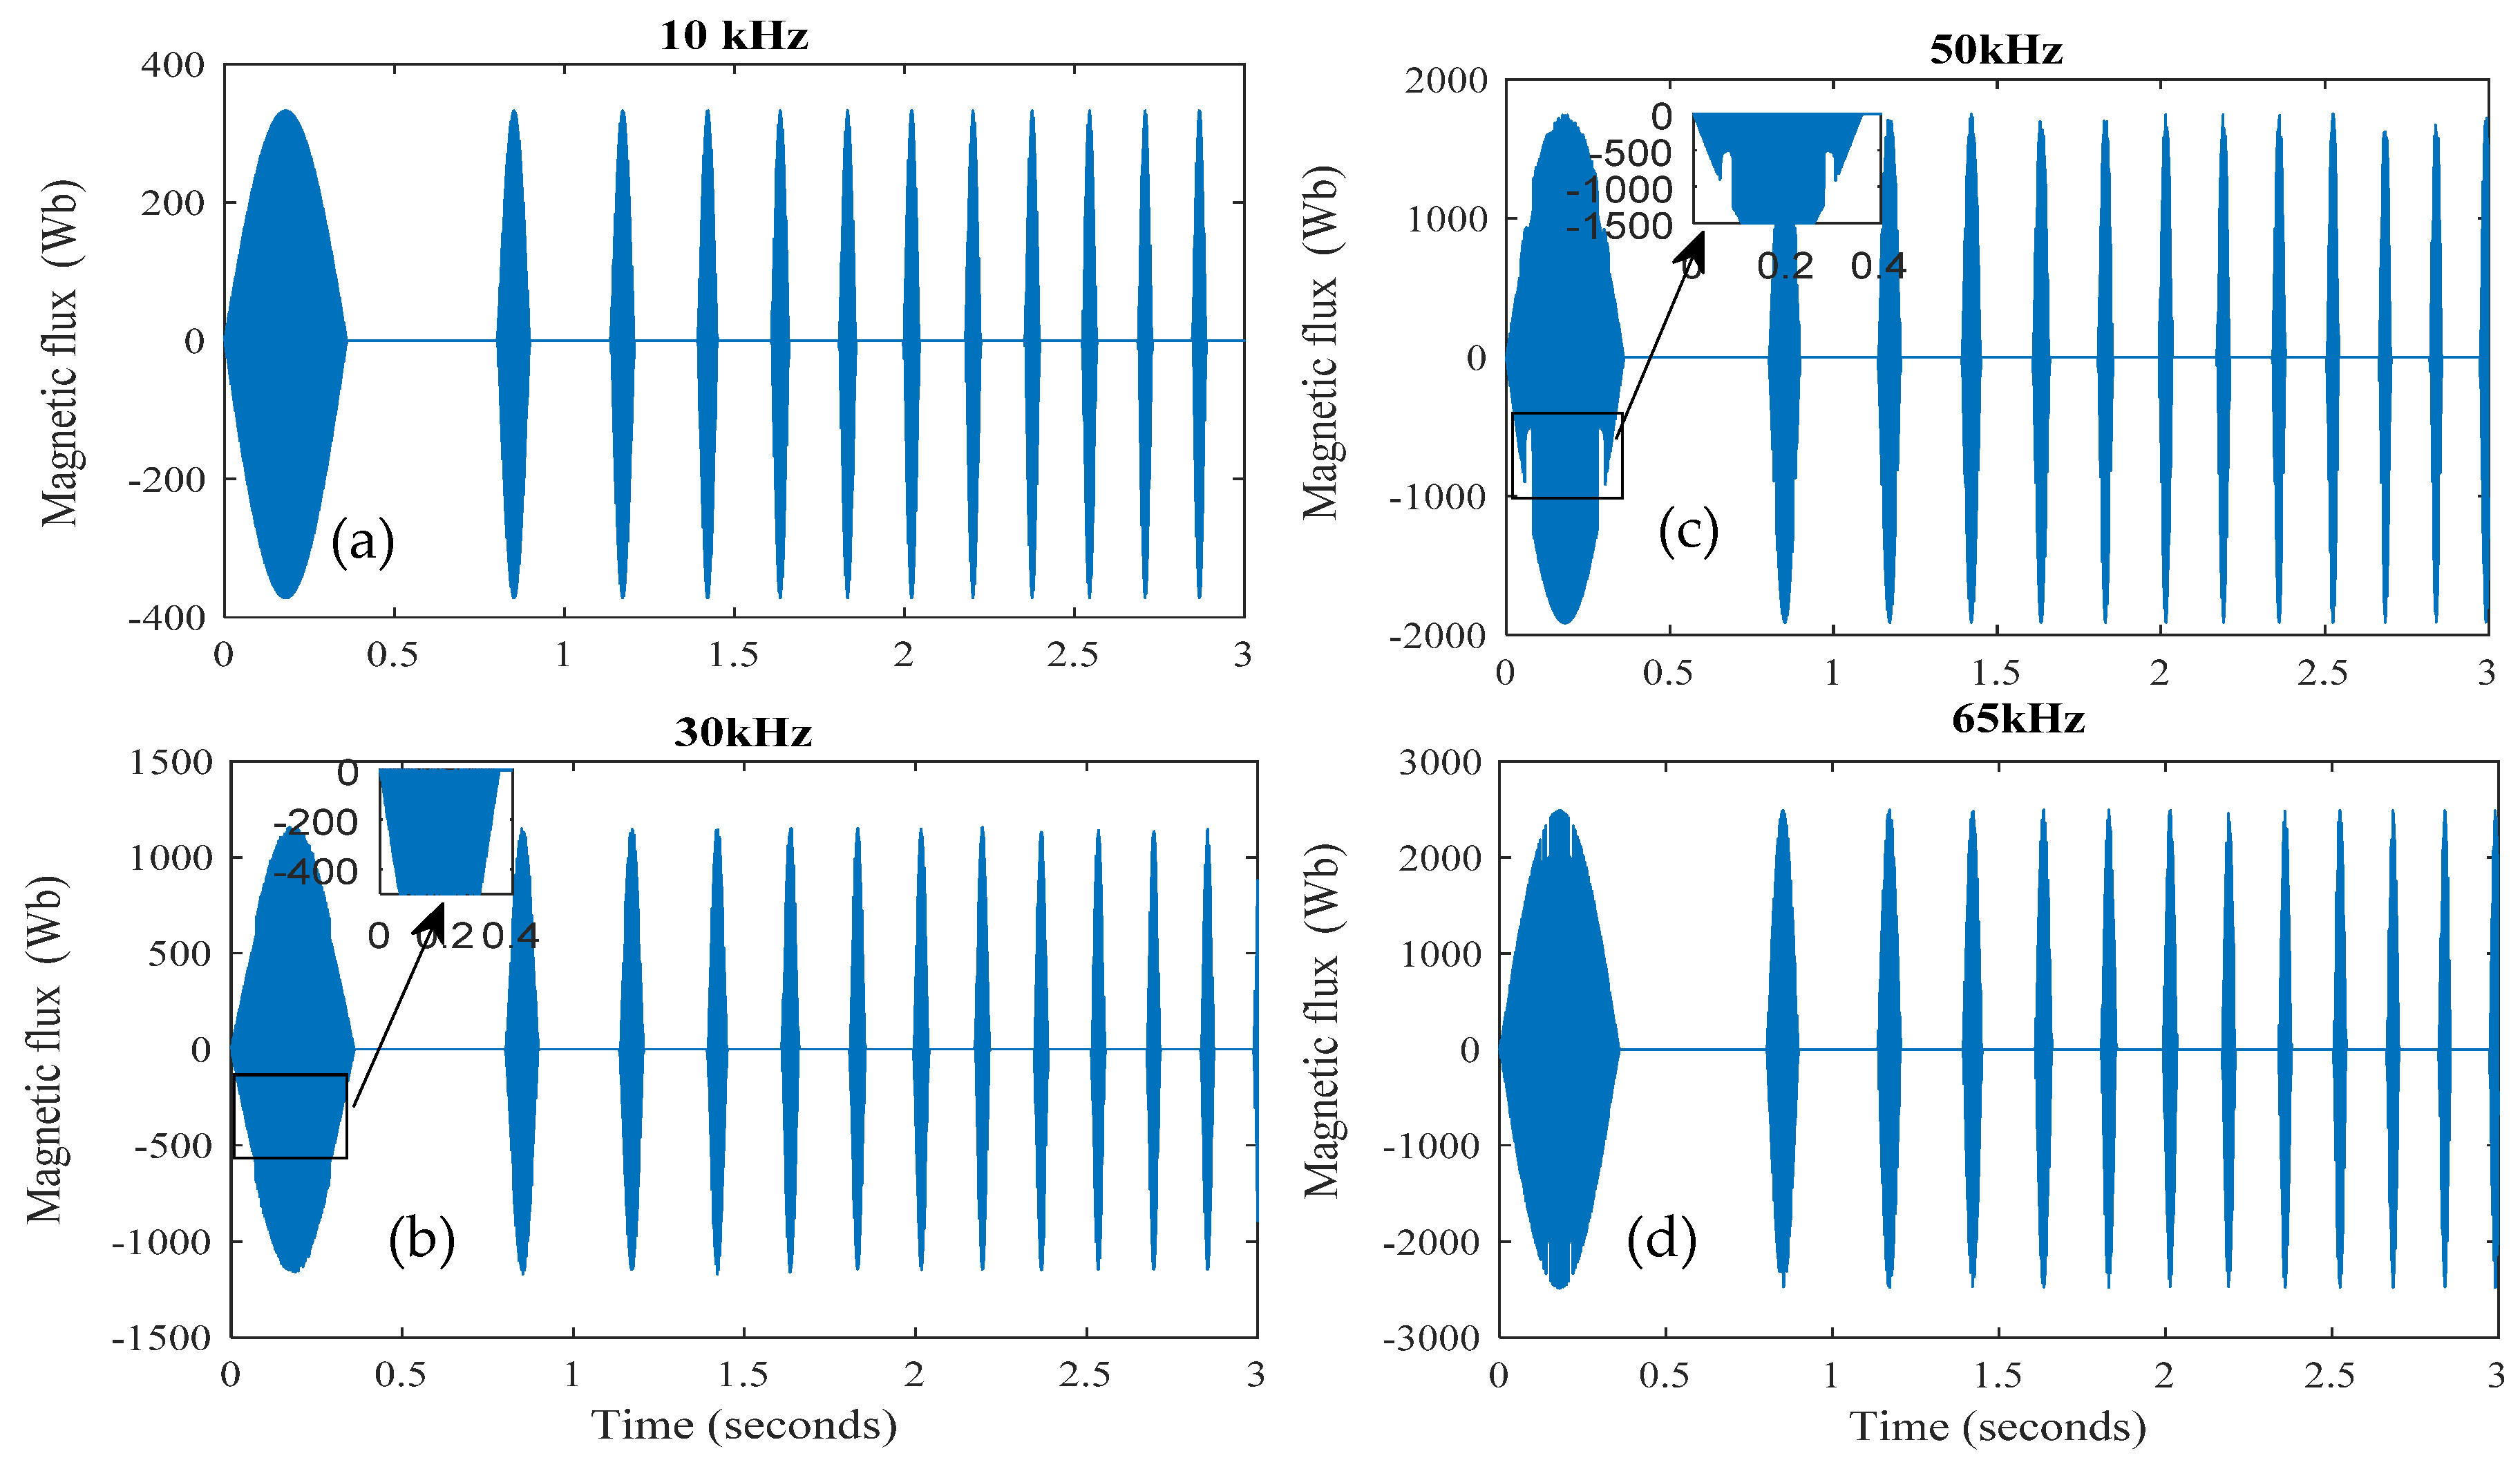
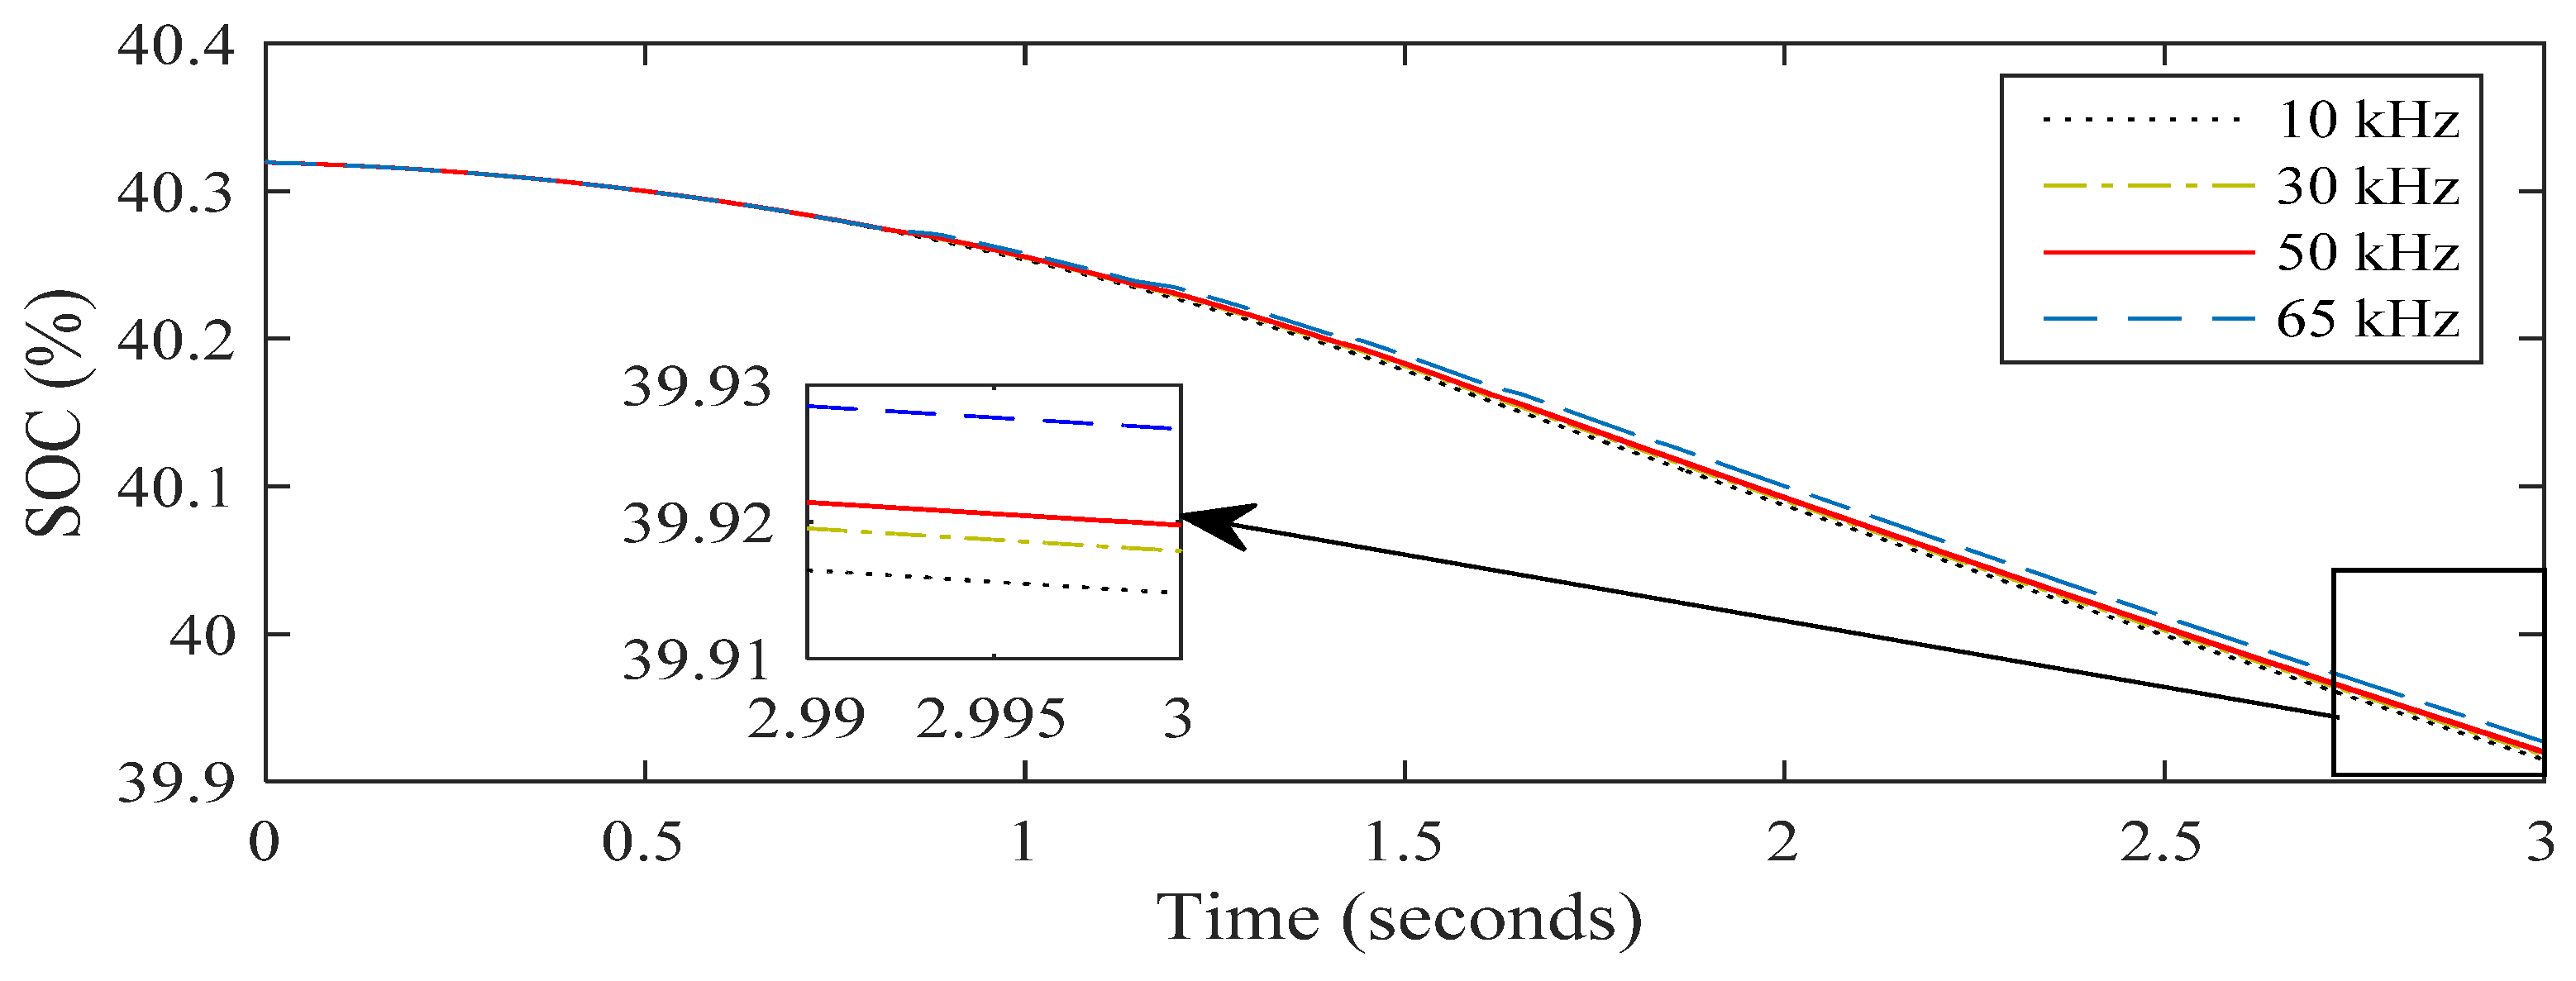
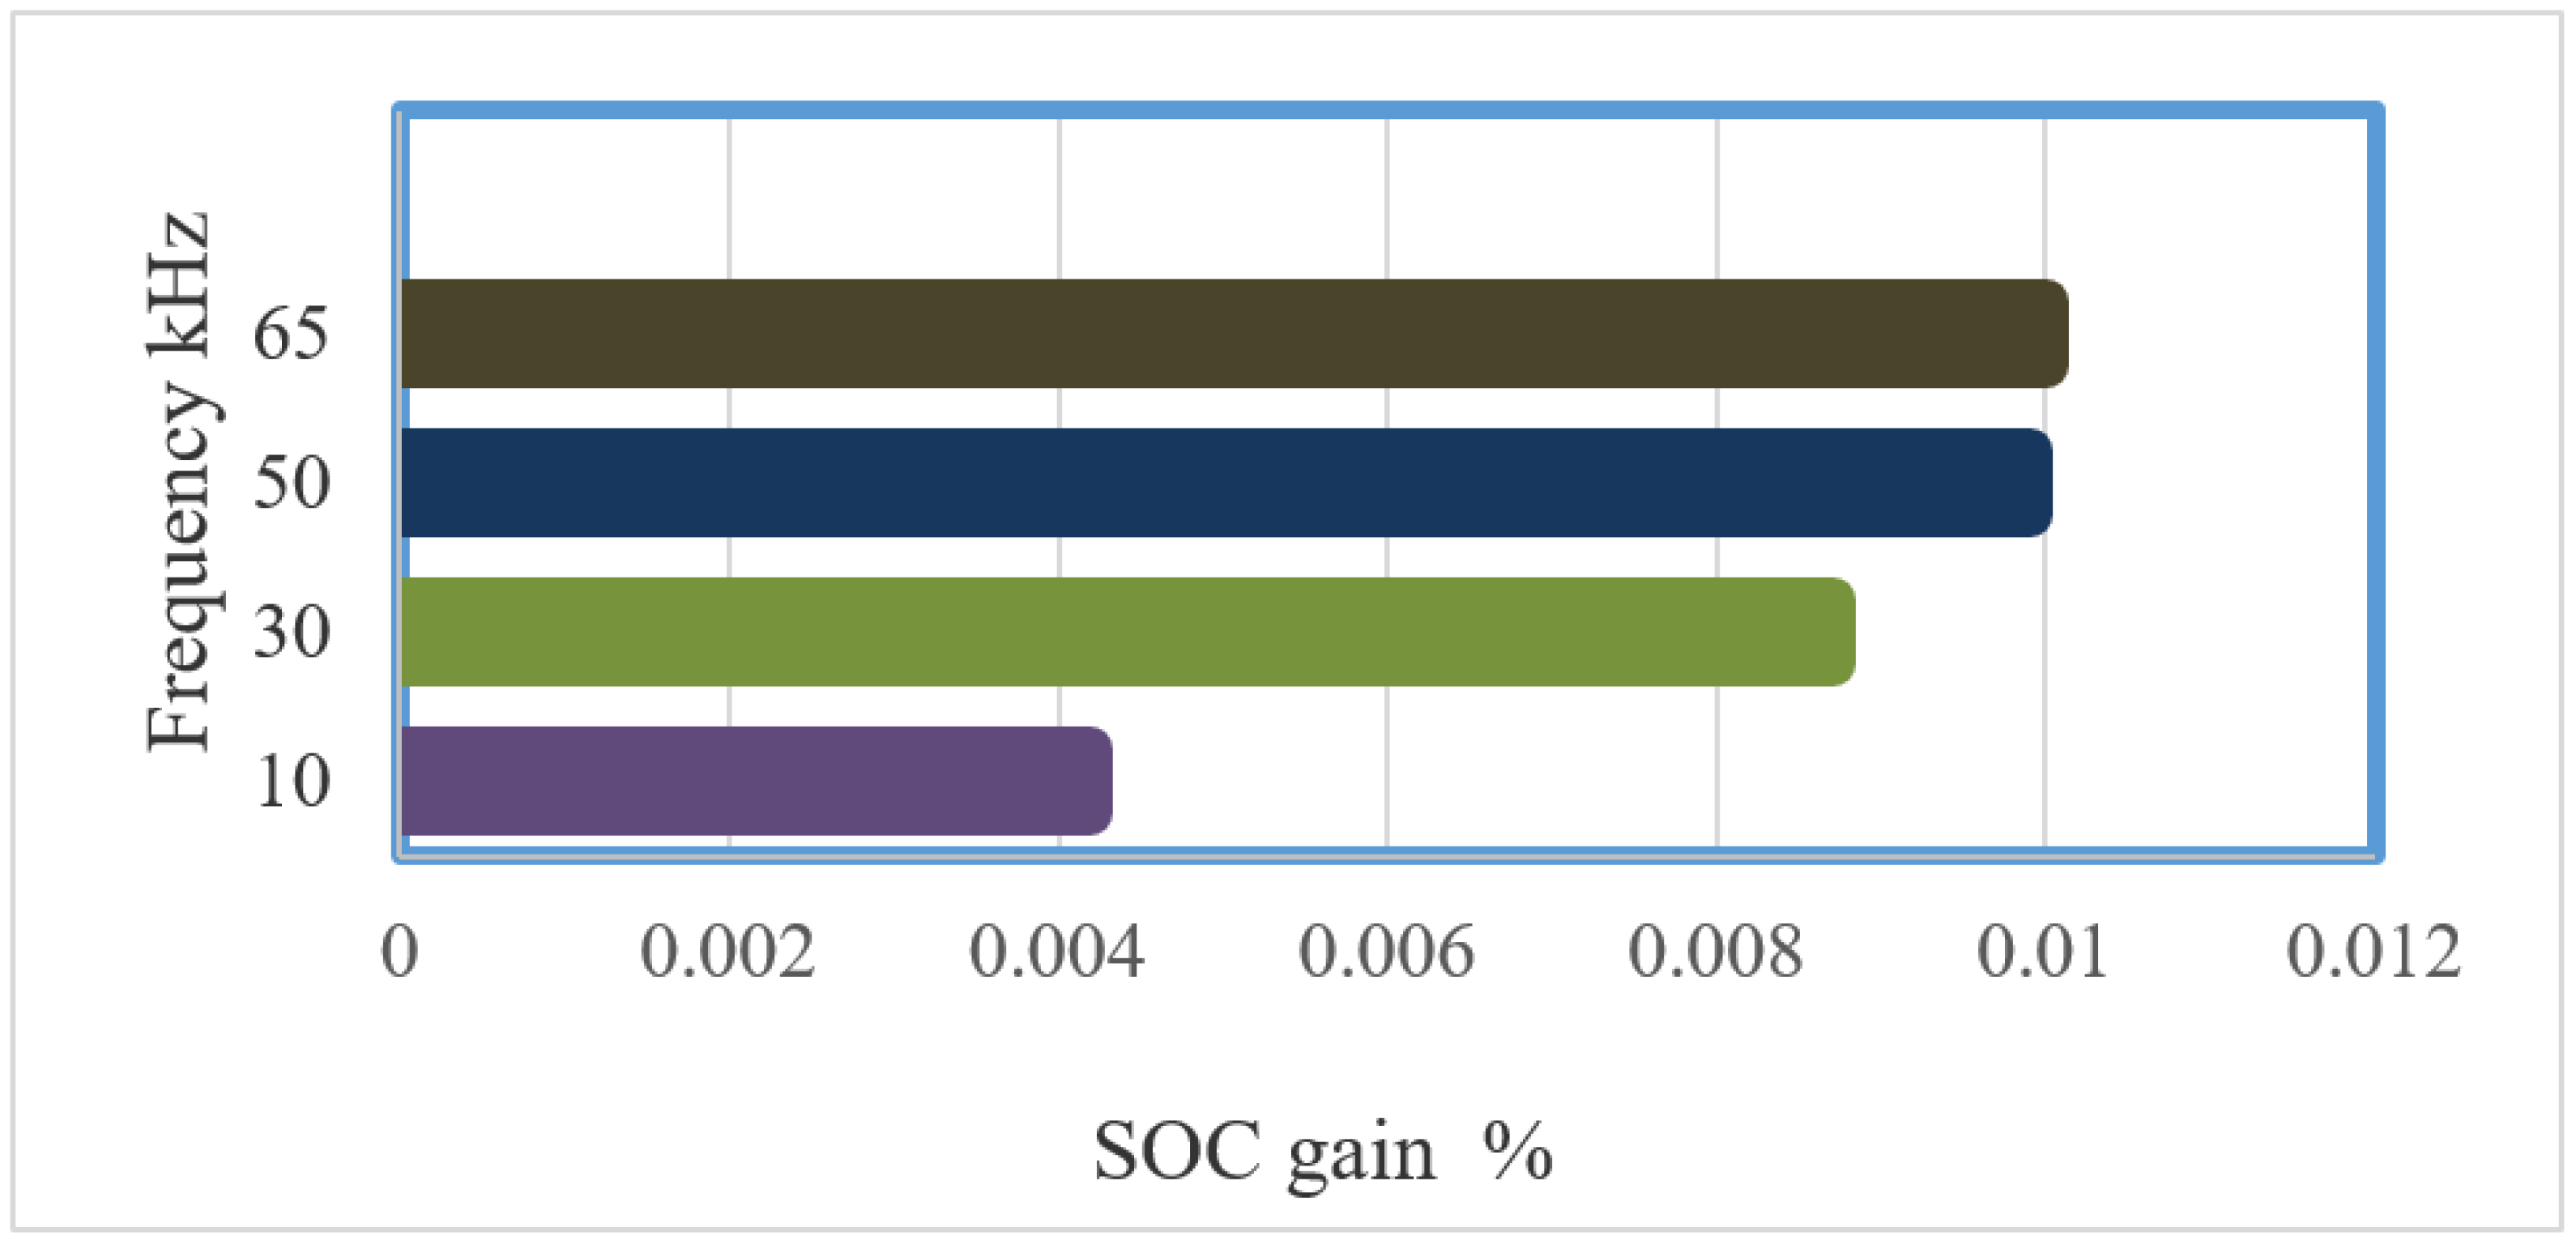
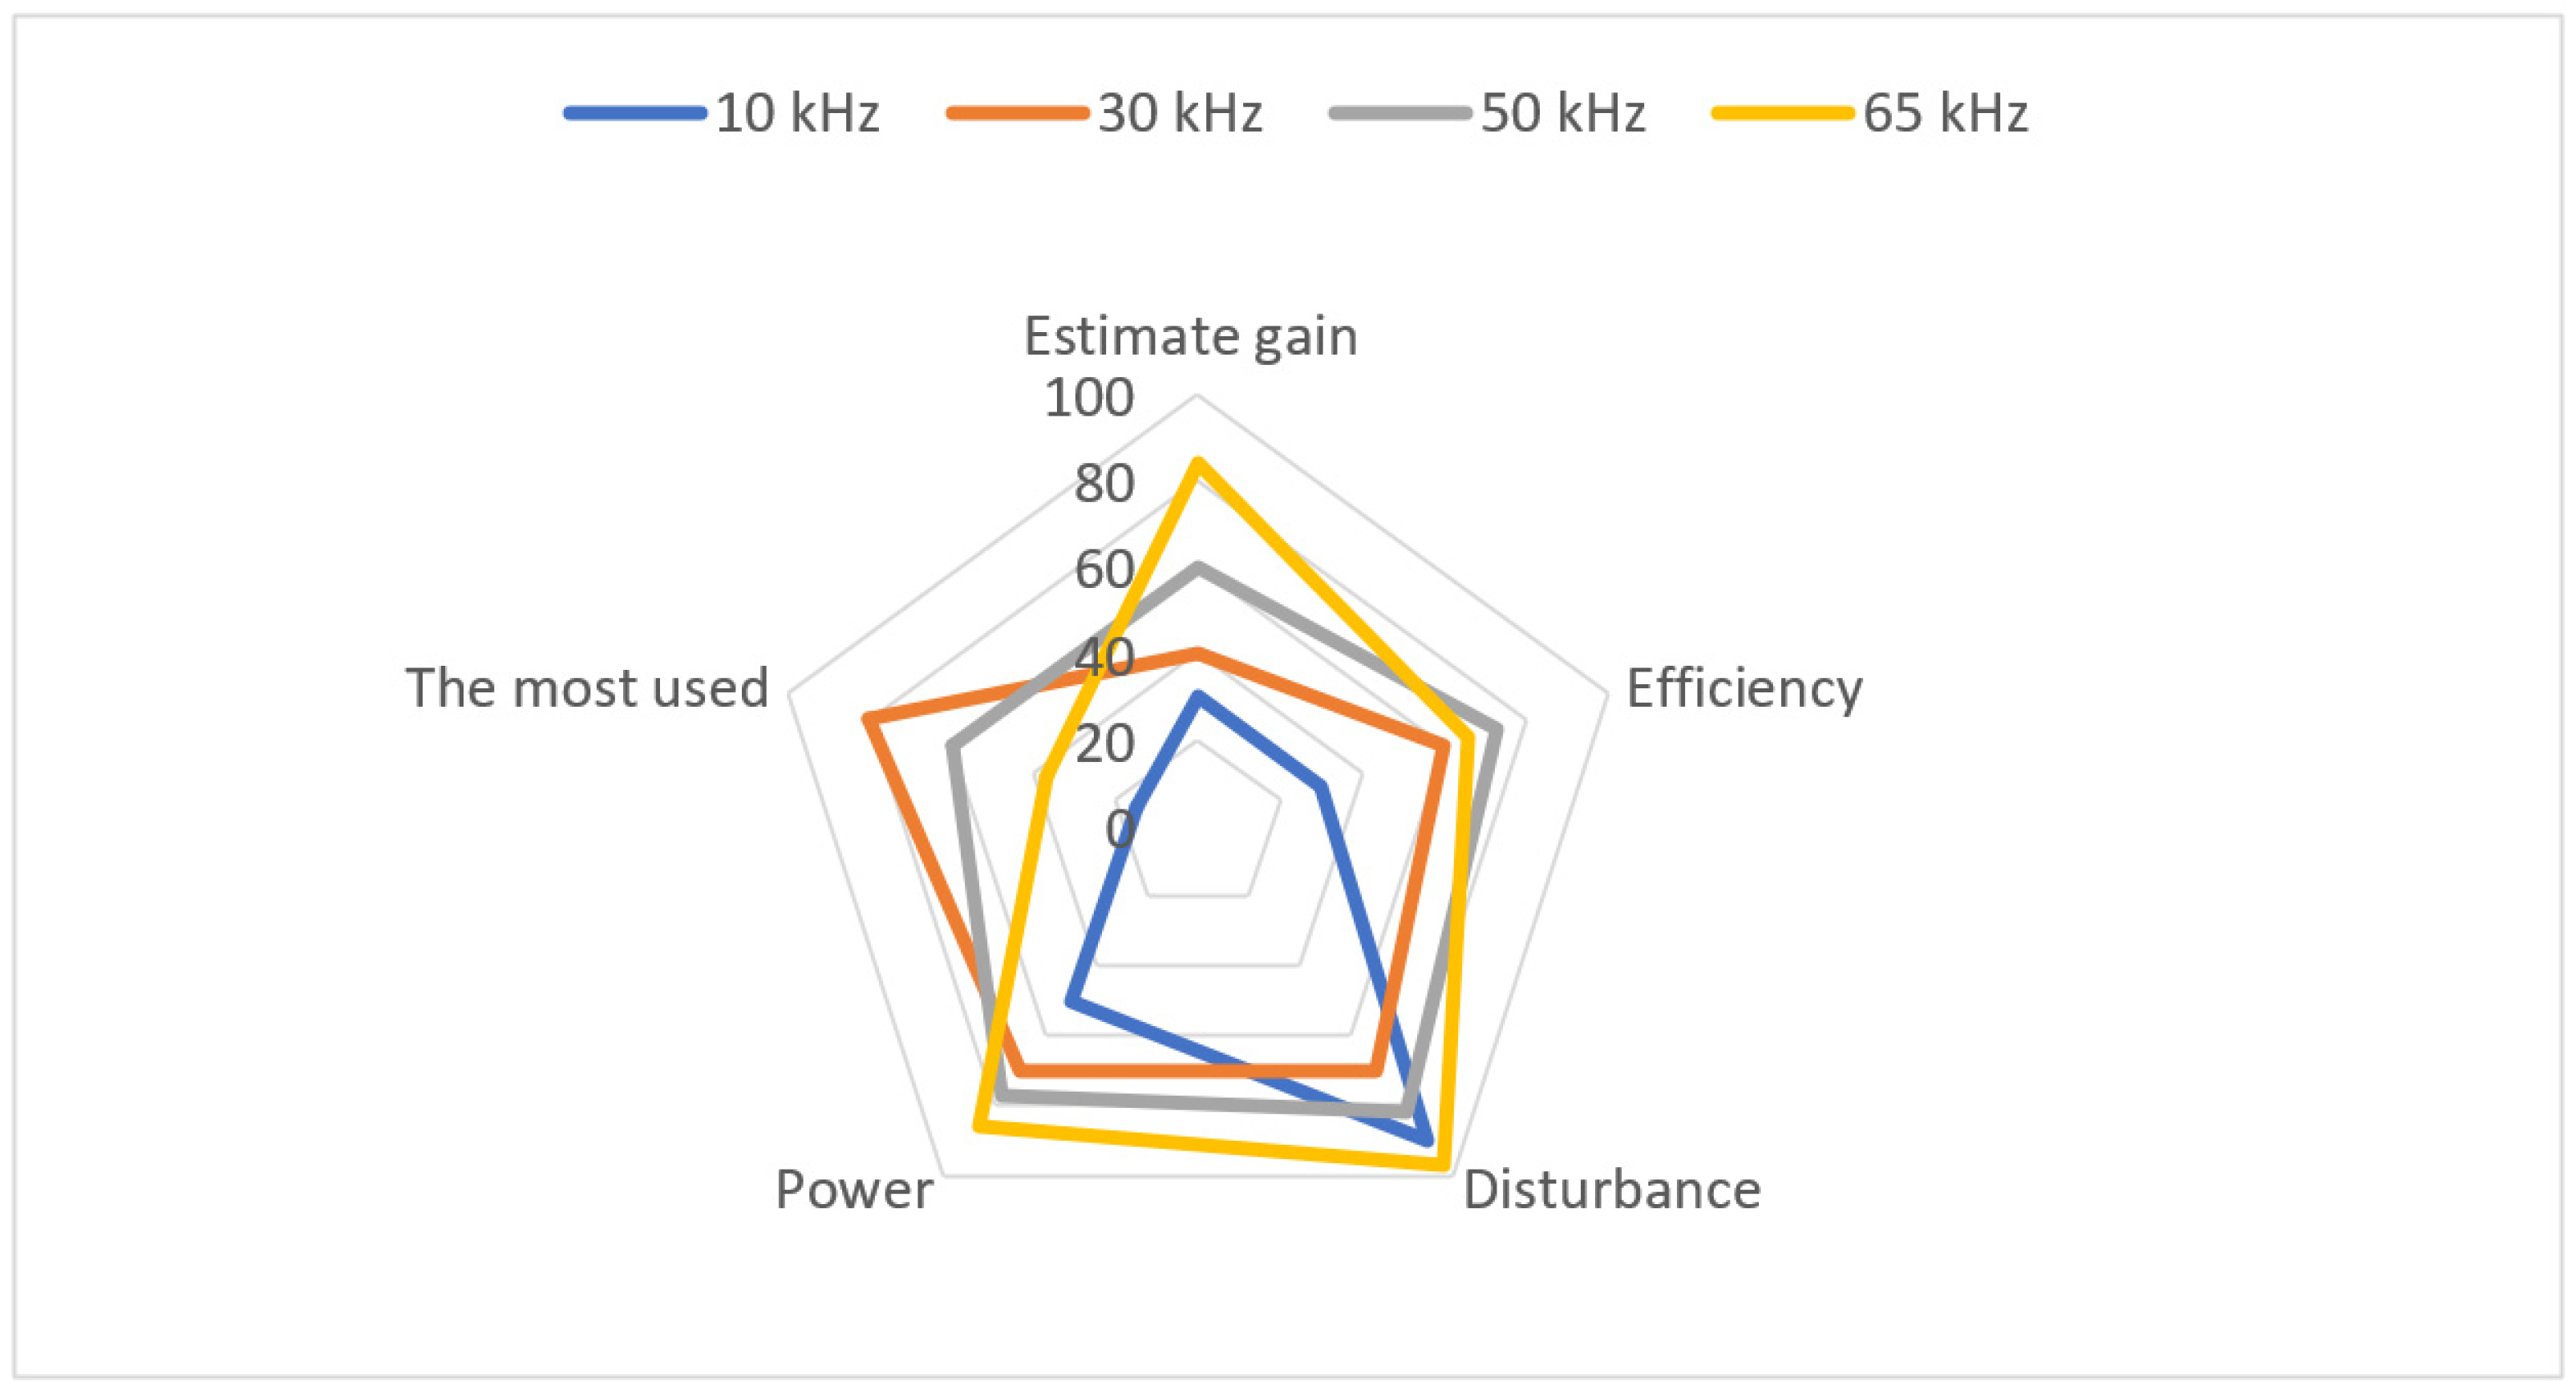
3. Results and Discussion
4. Conclusions
Author Contributions
Funding
Conflicts of Interest
Nomenclature
| M | Mutual inductance (H) |
| ω | Oscillation angular frequency (rad/s) |
| k | Magnetic coupling constant |
| L2 | Secondary inductance (H) |
| L1 | Primary inductance (H) |
| Z2 | Primary impedance (Ω) |
| Zs | Secondary impedance (Ω) |
| I1 | Primary current (A) |
| I2 | Secondary current (A) |
| V1 | Primary voltage (V) |
| V2 | Secondary voltage (V) |
| N | Number of turns |
| Magnetic constant | |
| L | Inductance (H) |
| P1 | Primary power |
| P2 | Secondary power |
References
- Salah, W.A.; Albreem, M.A.M.; Alsayid, B.; Zneid, B.A.; Alkhasawneh, M.; Al–Mofleh, A.; Sneineh, A.A.; Abu Al-Aish, A. Electric vehicle technology impacts on energy. Int. J. Power Electron. Drive Syst. 2019, 10, 1–9. [Google Scholar] [CrossRef]
- Ten Have, S.Y.; Gkiotsalitis, K.; Geurs, K.T. Investigating the future of ultrafast charging: A choice experiment in The Netherlands. World Electr. Veh. J. 2020, 11, 70. [Google Scholar] [CrossRef]
- Chakrabarty, M.; Sarkar, D.; Basak, R. A comprehensive literature review report on basic issues of power system restoration planning. J. Inst. Eng. Ser. B 2020, 101, 287–297. [Google Scholar] [CrossRef]
- Kumaresan, J.; Govindaraju, C. PV-tied three-port DC–DC converter-operated four-wheel-drive hybrid electric vehicle (HEV). Electr. Eng. 2020, 102, 2295–2313. [Google Scholar] [CrossRef]
- Fotouhi, A.; Auger, D.J.; Propp, K.; Longo, S.; Wild, M. A review on electric vehicle battery modelling: From Lithium-ion toward Lithium-Sulphur. Renew. Sustain. Energy Rev. 2016, 56, 1008–1021. [Google Scholar] [CrossRef] [Green Version]
- Bi, Z.; Kan, T.; Mi, C.C.; Zhang, Y.; Zhao, Z.; Keoleian, G.A. A review of wireless power transfer for electric vehicles: Prospects to enhance sustainable mobility. Appl. Energy 2016, 179, 413–425. [Google Scholar] [CrossRef] [Green Version]
- Naoui, M.; Flah, A.; Ben Hamed, M.; Sbita, L. Review on autonomous charger for EV and HEV. In Proceedings of the International Conference on Green Energy Conversion Systems (GECS), Hammamet, Tunisia, 23–25 March 2017; pp. 1–6. [Google Scholar]
- Kraiem, H.; Flah, A.; Mohamed, N.; Alowaidi, M.; Bajaj, M.; Mishra, S.; Sharma, N.K.; Sharma, S.K. Increasing electric vehicle autonomy using a photovoltaic system controlled by particle swarm optimization. IEEE Access 2021, 9, 72040–72054. [Google Scholar] [CrossRef]
- Madawala, U.K.; Neath, M.; Thrimawithana, D.J. A power-frequency controller for bidirectional inductive power transfer systems. IEEE Trans. Ind. Electron. 2013, 60, 310–317. [Google Scholar] [CrossRef]
- Zahid, Z.U.; Dalala, Z.M.; Zheng, C.; Chen, R.; Faraci, W.E.; Lai, J.S.J.; Lisi, G.; Anderson, D. Modeling and control of series-series compensated inductive power transfer system. IEEE J. Emerg. Sel. Top. Power Electron. 2015, 3, 111–123. [Google Scholar] [CrossRef]
- Berger, A.; Agostinelli, M.; Vesti, S.; Oliver, J.A.; Cobos, J.A.; Huemer, M. A Wireless charging system applying phase-shift and amplitude control to maximize efficiency and extractable power. IEEE Trans. Power Electron. 2015, 30, 6338–6348. [Google Scholar] [CrossRef]
- Wang, Z.H.; Li, Y.P.; Sun, Y.; Tang, C.S.; Lv, X. Load detection model of voltage-fed inductive power transfer system. IEEE Trans. Power Electron. 2013, 28, 5233–5243. [Google Scholar] [CrossRef]
- Miller, J.M.; Onar, O.C.; Chinthavali, M. Primary-side power flow control of wireless power transfer for electric vehicle charging. IEEE J. Emerg. Sel. Top. Power Electron. 2015, 3, 147–162. [Google Scholar] [CrossRef]
- Li, Y.; Vilathgamuwa, M.; Wikner, E.; Wei, Z.; Zhang, X.; Thiringer, T.; Wik, T.; Zou, C. Electrochemical model-based fast charging: Physical constraint-triggered PI control. IEEE Trans. Energy Convers. 2021, 8969, 3208–3220. [Google Scholar] [CrossRef]
- Namadmalan, A. Self-oscillating tuning loops for series resonant inductive power transfer systems. IEEE Trans. Power Electron. 2016, 31, 7320–7327. [Google Scholar] [CrossRef]
- Huang, M.; Li, X.; Lei, Y.; Gu, J. Structural damage identification based on modal frequency strain energy assurance criterion and flexibility using enhanced Moth-Flame optimization. Structures 2020, 28, 1119–1136. [Google Scholar] [CrossRef]
- Chopra, S. Contactless Power Transfer for Electric Vehicle Charging Application. Master’s Thesis, Delft University, Delft, The Netherlands, 2011. [Google Scholar]
- Mohamed, N.; Aymen, F.; Mouna, B.H. Inductive charger efficiency under internal and external parameters variation for an electric vehicle in motion. Int. J. Powertrains 2019, 8, 343–358. [Google Scholar] [CrossRef]
- Rosu, S.G. A dynamic wireless charging system for electric vehicles based on DC/AC converters with SiC MOSFET-IGBT switches and resonant gate-drive. In Proceedings of the 42nd Annual Conference of the IEEE Industrial Electronics Society, Florence, Italy, 23–26 October 2016; pp. 4465–4470. [Google Scholar]
- Khutwad, S.R.; Gaur, S. Wireless charging system for electric vehicle. In Proceedings of the 2016 International Conference on Signal Processing, Communication, Power and Embedded System (SCOPES), Paralakhemundi, India, 3–5 October 2016; pp. 441–445. [Google Scholar]
- Mohamed, N.; Aymen, F.; Alqarni, M.; Turky, R.A.; Alamri, B.; Ali, Z.M.; Abdel, S.H.E. A new wireless charging system for electric vehicles using two receiver coils. Ain Shams Eng. J. 2021. [Google Scholar] [CrossRef]
- Mohamed, N.; Aymen, F.; Ali, Z.M.; Zobaa, A.F.; Aleem, S.H.E.A. Efficient power management strategy of electric vehicles based hybrid renewable energy. Sustainability 2021, 13, 7351. [Google Scholar] [CrossRef]
- Dominic Savio, A.; Vimala Juliet, A. Development of multiple plug-in electric vehicle mobile charging station using bidirectional converter. Int. J. Power Electron. Drive Syst. 2020, 11, 785–791. [Google Scholar] [CrossRef]
- Mohamed, N.; Flah, A.; Ben Hamed, M. Wireless charging system for a mobile hybrid electric vehicle. In Proceedings of the 2018 International Symposium on Advanced Electrical and Communication Technologies (ISAECT), Rabat, Morocco, 21–23 November 2018; pp. 1–5. [Google Scholar]
- Allamehzadeh, H. Wireless power transfer (WPT) fundamentals with resonant frequency-dependent parameters, energy transfer efficiency, and green technology applications. In Proceedings of the 2021 IEEE 48th Photovoltaic Specialists Conference (PVSC), Fort Lauderdale, FL, USA, 20–25 June 2021; pp. 36–40. [Google Scholar]
- Ishida, H.; Furukawa, H.; Kyoden, T. Scheme for providing parity-time symmetry for low-frequency wireless power transfer below 20 kHz. Electr. Eng. 2021, 103, 35–42. [Google Scholar] [CrossRef]
- Lin, C.H.; Amir, M.; Tariq, M.; Shahvez, M.; Alamri, B.; Alahmadi, A.; Siddiqui, M.; Beig, A.R. Comprehensive analysis of ipt v/s CPT for wireless EV charging and effect of capacitor plate shape and foreign particle on CPT. Processes 2021, 9, 1619. [Google Scholar] [CrossRef]
- Mohamed, N.; Aymen, F.; Lassaad, S.; Mouna, B.H. Practical validation of the vehicle speed influence on the wireless recharge system efficiency. In Proceedings of the 6th IEEE International Energy Conference (ENERGYCon), Gammarth, Tunisia, 28 September–1 October 2020; pp. 372–376. [Google Scholar]


| Drive Battery | Lithium-ion |
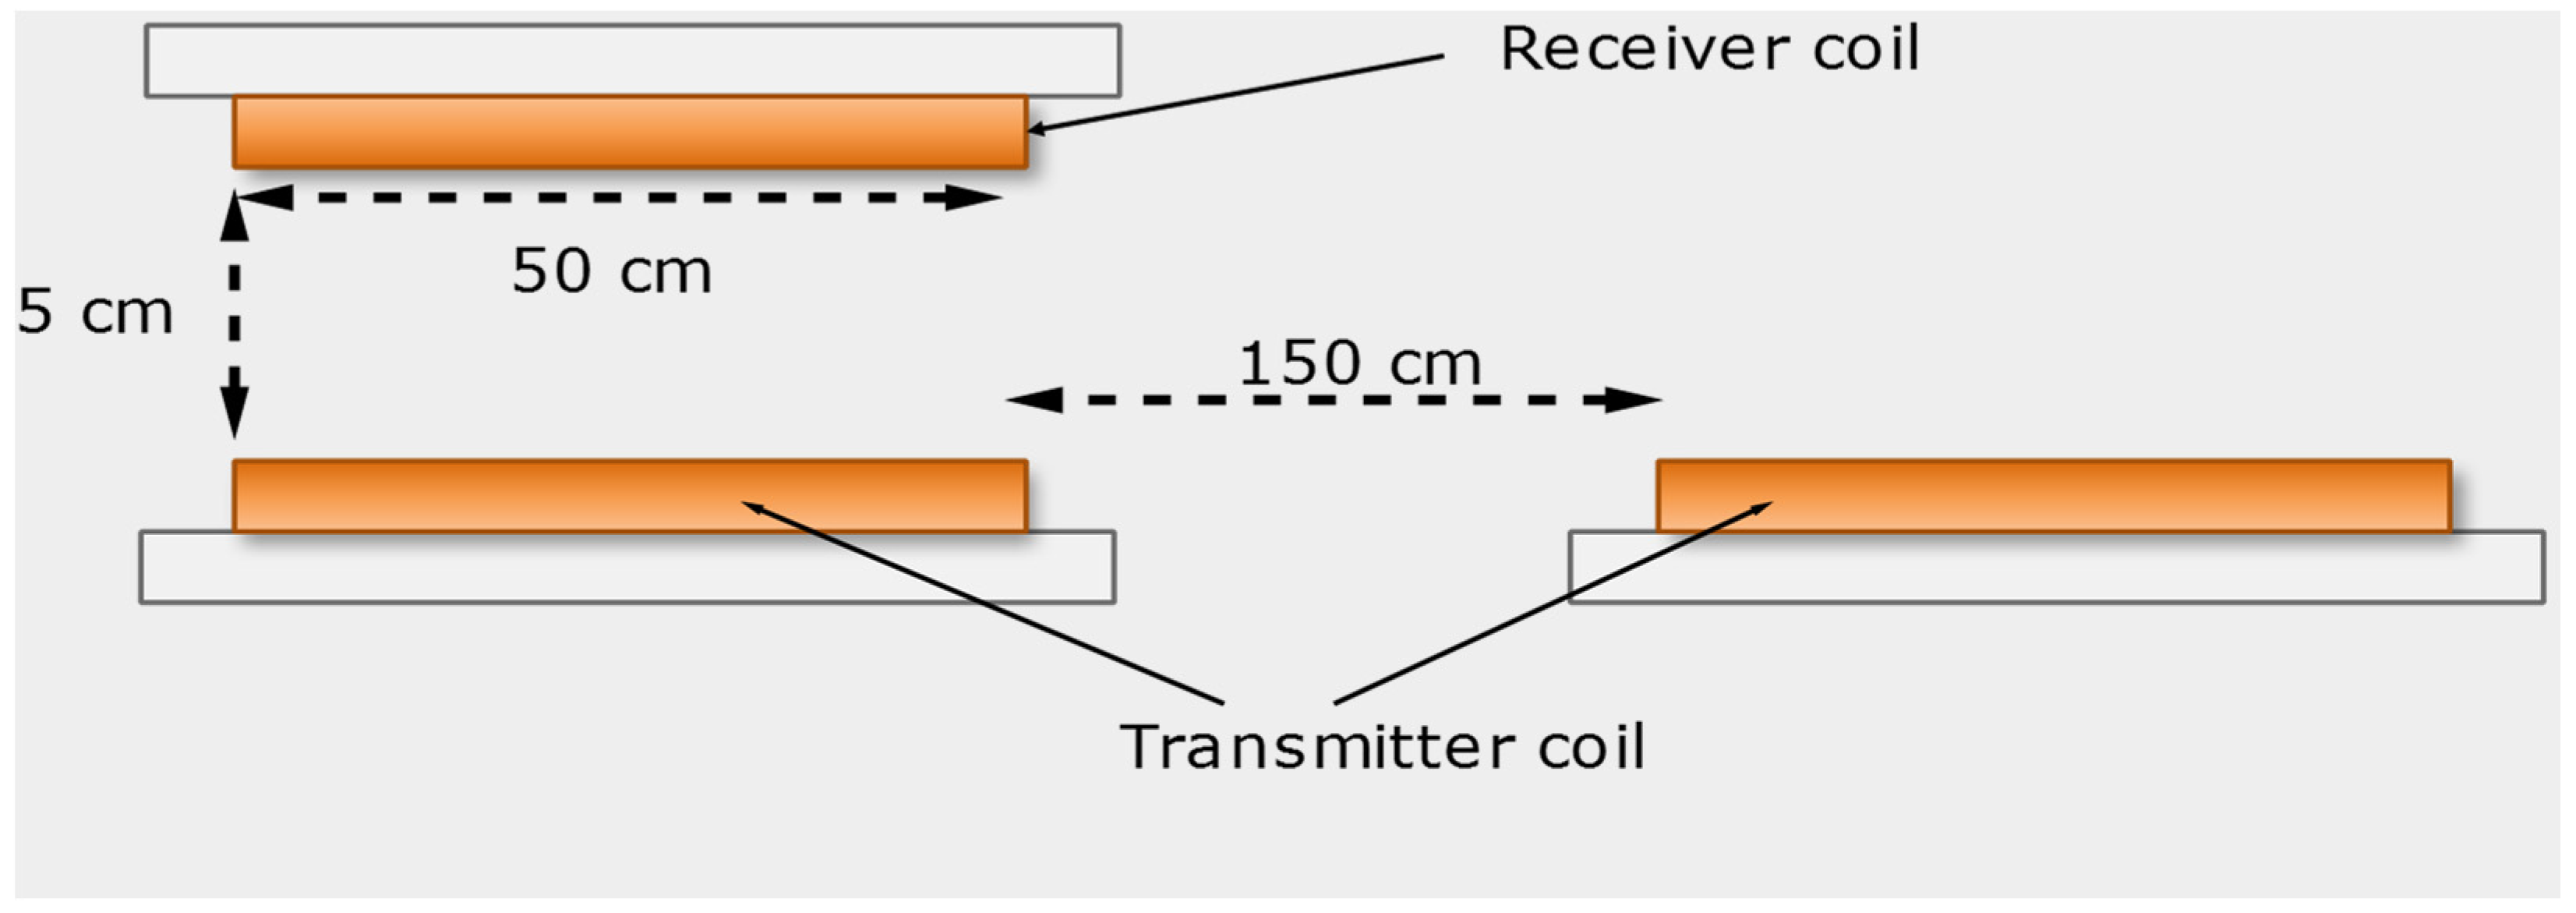
| Coil diameter (cm) | 50 |
| Distance between coil (cm) | 150 |
| Test frequency (kHz) | (10; 30; 50; 65) |
| Self-Inductance, Lp = Ls | (37 μH 140 μH) |
| SS compensation capacitance, Cp = Cs | [95 nF 0.37 μF] |
| Frequency | The Energy Gain for 3 s × 10−3 | The Energy Gain for 10 h |
|---|---|---|
| 10 kHz | 48.5% | 9.7% |
| 30 kHz | 86.5% | 17.3% |
| 50 Khz | 99.1% | 19.82% |
| 65 kHz | 100% | 20.01% |
Publisher’s Note: MDPI stays neutral with regard to jurisdictional claims in published maps and institutional affiliations. |
© 2021 by the authors. Licensee MDPI, Basel, Switzerland. This article is an open access article distributed under the terms and conditions of the Creative Commons Attribution (CC BY) license (https://creativecommons.org/licenses/by/4.0/).
Share and Cite
Mohamed, N.; Aymen, F.; Alqarni, M. Inductive Power Transmission System for Electric Car Charging Phase: Modeling plus Frequency Analysis. World Electr. Veh. J. 2021, 12, 267. https://doi.org/10.3390/wevj12040267
Mohamed N, Aymen F, Alqarni M. Inductive Power Transmission System for Electric Car Charging Phase: Modeling plus Frequency Analysis. World Electric Vehicle Journal. 2021; 12(4):267. https://doi.org/10.3390/wevj12040267
Chicago/Turabian StyleMohamed, Naoui, Flah Aymen, and Mohammed Alqarni. 2021. "Inductive Power Transmission System for Electric Car Charging Phase: Modeling plus Frequency Analysis" World Electric Vehicle Journal 12, no. 4: 267. https://doi.org/10.3390/wevj12040267
APA StyleMohamed, N., Aymen, F., & Alqarni, M. (2021). Inductive Power Transmission System for Electric Car Charging Phase: Modeling plus Frequency Analysis. World Electric Vehicle Journal, 12(4), 267. https://doi.org/10.3390/wevj12040267