Article

Machine-Learning-Based Optimization of Energy Management in a Novel Hybrid Powertrain of Concrete Truck Mixers

1
College of Engineering, China Agricultural University, Beijing 100083, China
2
Fengzhi Technology Co., Ltd., Beijing 100096, China
*
Author to whom correspondence should be addressed.
World Electr. Veh. J. 2021, 12(4), 175; https://doi.org/10.3390/wevj12040175
Submission received: 22 August 2021 / Revised: 15 September 2021 / Accepted: 27 September 2021 / Published: 30 September 2021

Abstract

:
The new energy of concrete truck mixers is of great significance to achieve energy conservation and emission reduction. Unlike general-purpose vehicles, in addition to driving conditions, upper-mixing system conditions, operation scenarios, and variable loads are the key factors to be considered during the new energy of concrete truck mixers. This study focuses on the machine-learning-based approximate optimal energy management design for a concrete truck mixer equipped with a novel extended-range powertrain from two aspects: trip information and energy management strategy. Firstly, an optimal control database is constructed, which benefits from a global optimization algorithm with dimension reduction for the constrained time-varying two-point boundary value problems with two control variables, and the driving data analysis through machine learning and data-driven methods. Then, different machine-learning-based driving condition identifiers are constructed and compared. Finally, a vehicle mass and power demand of an upper-part system based novel neural network energy management strategy is designed based on a constructed optimal control database. Simulation results show that the intelligent optimization algorithm based on the ML of trip information and energy management is an appropriate way to solve the online energy management problem of the concrete truck mixer equipped with the proposed novel powertrain.

1. Introduction

Currently, the drive for hybridization is still an effective solution to improve fuel economy [1,2], especially for medium or heavy commercial vehicles. Powertrain configuration, system modeling, and energy management strategies are the key factors for hybridization [3]. This research is committed to solving the problem of improving the fuel economy of concrete truck mixers (CTMs). At present, most of the CTMs on the road are traditional vehicles. There are a few hybrid or pure electric structures [4,5] which only aim at the upper mixing system or CTMs with small agitation capacity, respectively. Different from the general-purpose vehicles, the concrete truck mixer has the characteristics of significantly variable vehicle mass during a trip, multi-operation scenarios, a dual energy source and dual energy consumption source, and time-varying double driving conditions including a vehicle driving system and an upper mixing system, which means existing technology cannot be directly used for CTMs. Thus, it is necessary to explore the methods to improve fuel economy for such a multi-source high coupling system.
The performance of CTMs is inseparable from its energy management strategy that distributes the power demand of energy sources between the dual energy consumption source, vehicle driving system, and upper mixing system. To achieve better vehicle control, the development of a real-time energy management strategy has been a matter of great interest. The main real-time energy management strategies are comprised of a rule-based strategy [6,7], Pontryagin’s minimum principle (PMP) [8], model predictive control (MPC) [9], offline-algorithm derived strategies [10,11], and a neural network (NN) [12,13]. The ultimate goal of real-time energy management strategy design is to obtain the optimal control solution close to the global optimization method. Generally, this can be achieved by using two methods: a near-optimal rule-based control strategy based on dynamic programming (DP) [11,14], and a real-time control strategy that applies the NN to learn the results of DP [15,16]. Due to the characteristics of independence of the model, high efficiency, and strong self-learning ability, optimal results learning by the NN is more precise and accurate than artificial induction. The key to constructing a NN is to determine its structure [17], that is, input and output parameters, the number of hidden layers, and nodes. For the plug-in hybrid electric vehicle (PHEV), the three basic input parameters— power demand, energy of energy storage system, and vehicle speed—cannot fully learn the decision rules contained in an optimal engine output power sequence [15], and thus it is necessary to design new NN input variables according to the specific situation. Chen proposed a NN with 11 input parameters for the PHEV [16]. This paper emphasized the importance of trip information in learning the optimal engine output power sequence. Inspired by [16], Tian proposed a length ratio based neural network energy management strategy with five input parameters, which is suitable for limited micro-controller resource usage [18]. However, due to the characteristics of the CTM equipped with the proposed powertrain, the input and output parameters used in the above research are not completely suitable, so it is necessary to design a novel NN structure to improve the learning performance for the CTM.
The complexity and variability of real-world driving conditions will cause the established control strategy to fail to achieve optimal performance [19,20]. To realize the real-time application based on global optimization, it is a feasible solution to switch the corresponding offline model or calculation results through the driving condition identification methods based on machine learning (ML) [21,22]. Comparing the performance of different methods to choose the better identification algorithm has a great impact on improving the performance of an energy management strategy.
Based on the above research, the main purpose of this study is to explore the ML-based approximate optimal energy management for CTMs equipped with a novel hybrid powertrain from the two aspects, trip information, and energy management strategy. Firstly, a global optimization algorithm is proposed to solve the constrained time-varying two-point boundary value problems with two control variables for CTMs, which consist of two steps, dimensionality reduction of control variables and dynamic programming efficient application. Then, on that basis, an optimal control database of different driving condition types is constructed by using machine learning and a data-driven method. Different ML-based driving condition identifiers are constructed and compared. Finally, a novel neural network module based on the vehicle mass and power demand of the upper-part system is designed for predicting engine output power under different typical composite driving conditions.
This paper is organized as follows: Section 2 describes the proposed powertrain configuration and model. In Section 3, the global optimization method for the system is presented. Section 4 introduces the ML technologies in trip information and energy management strategy. Conclusions are presented in Section 5.

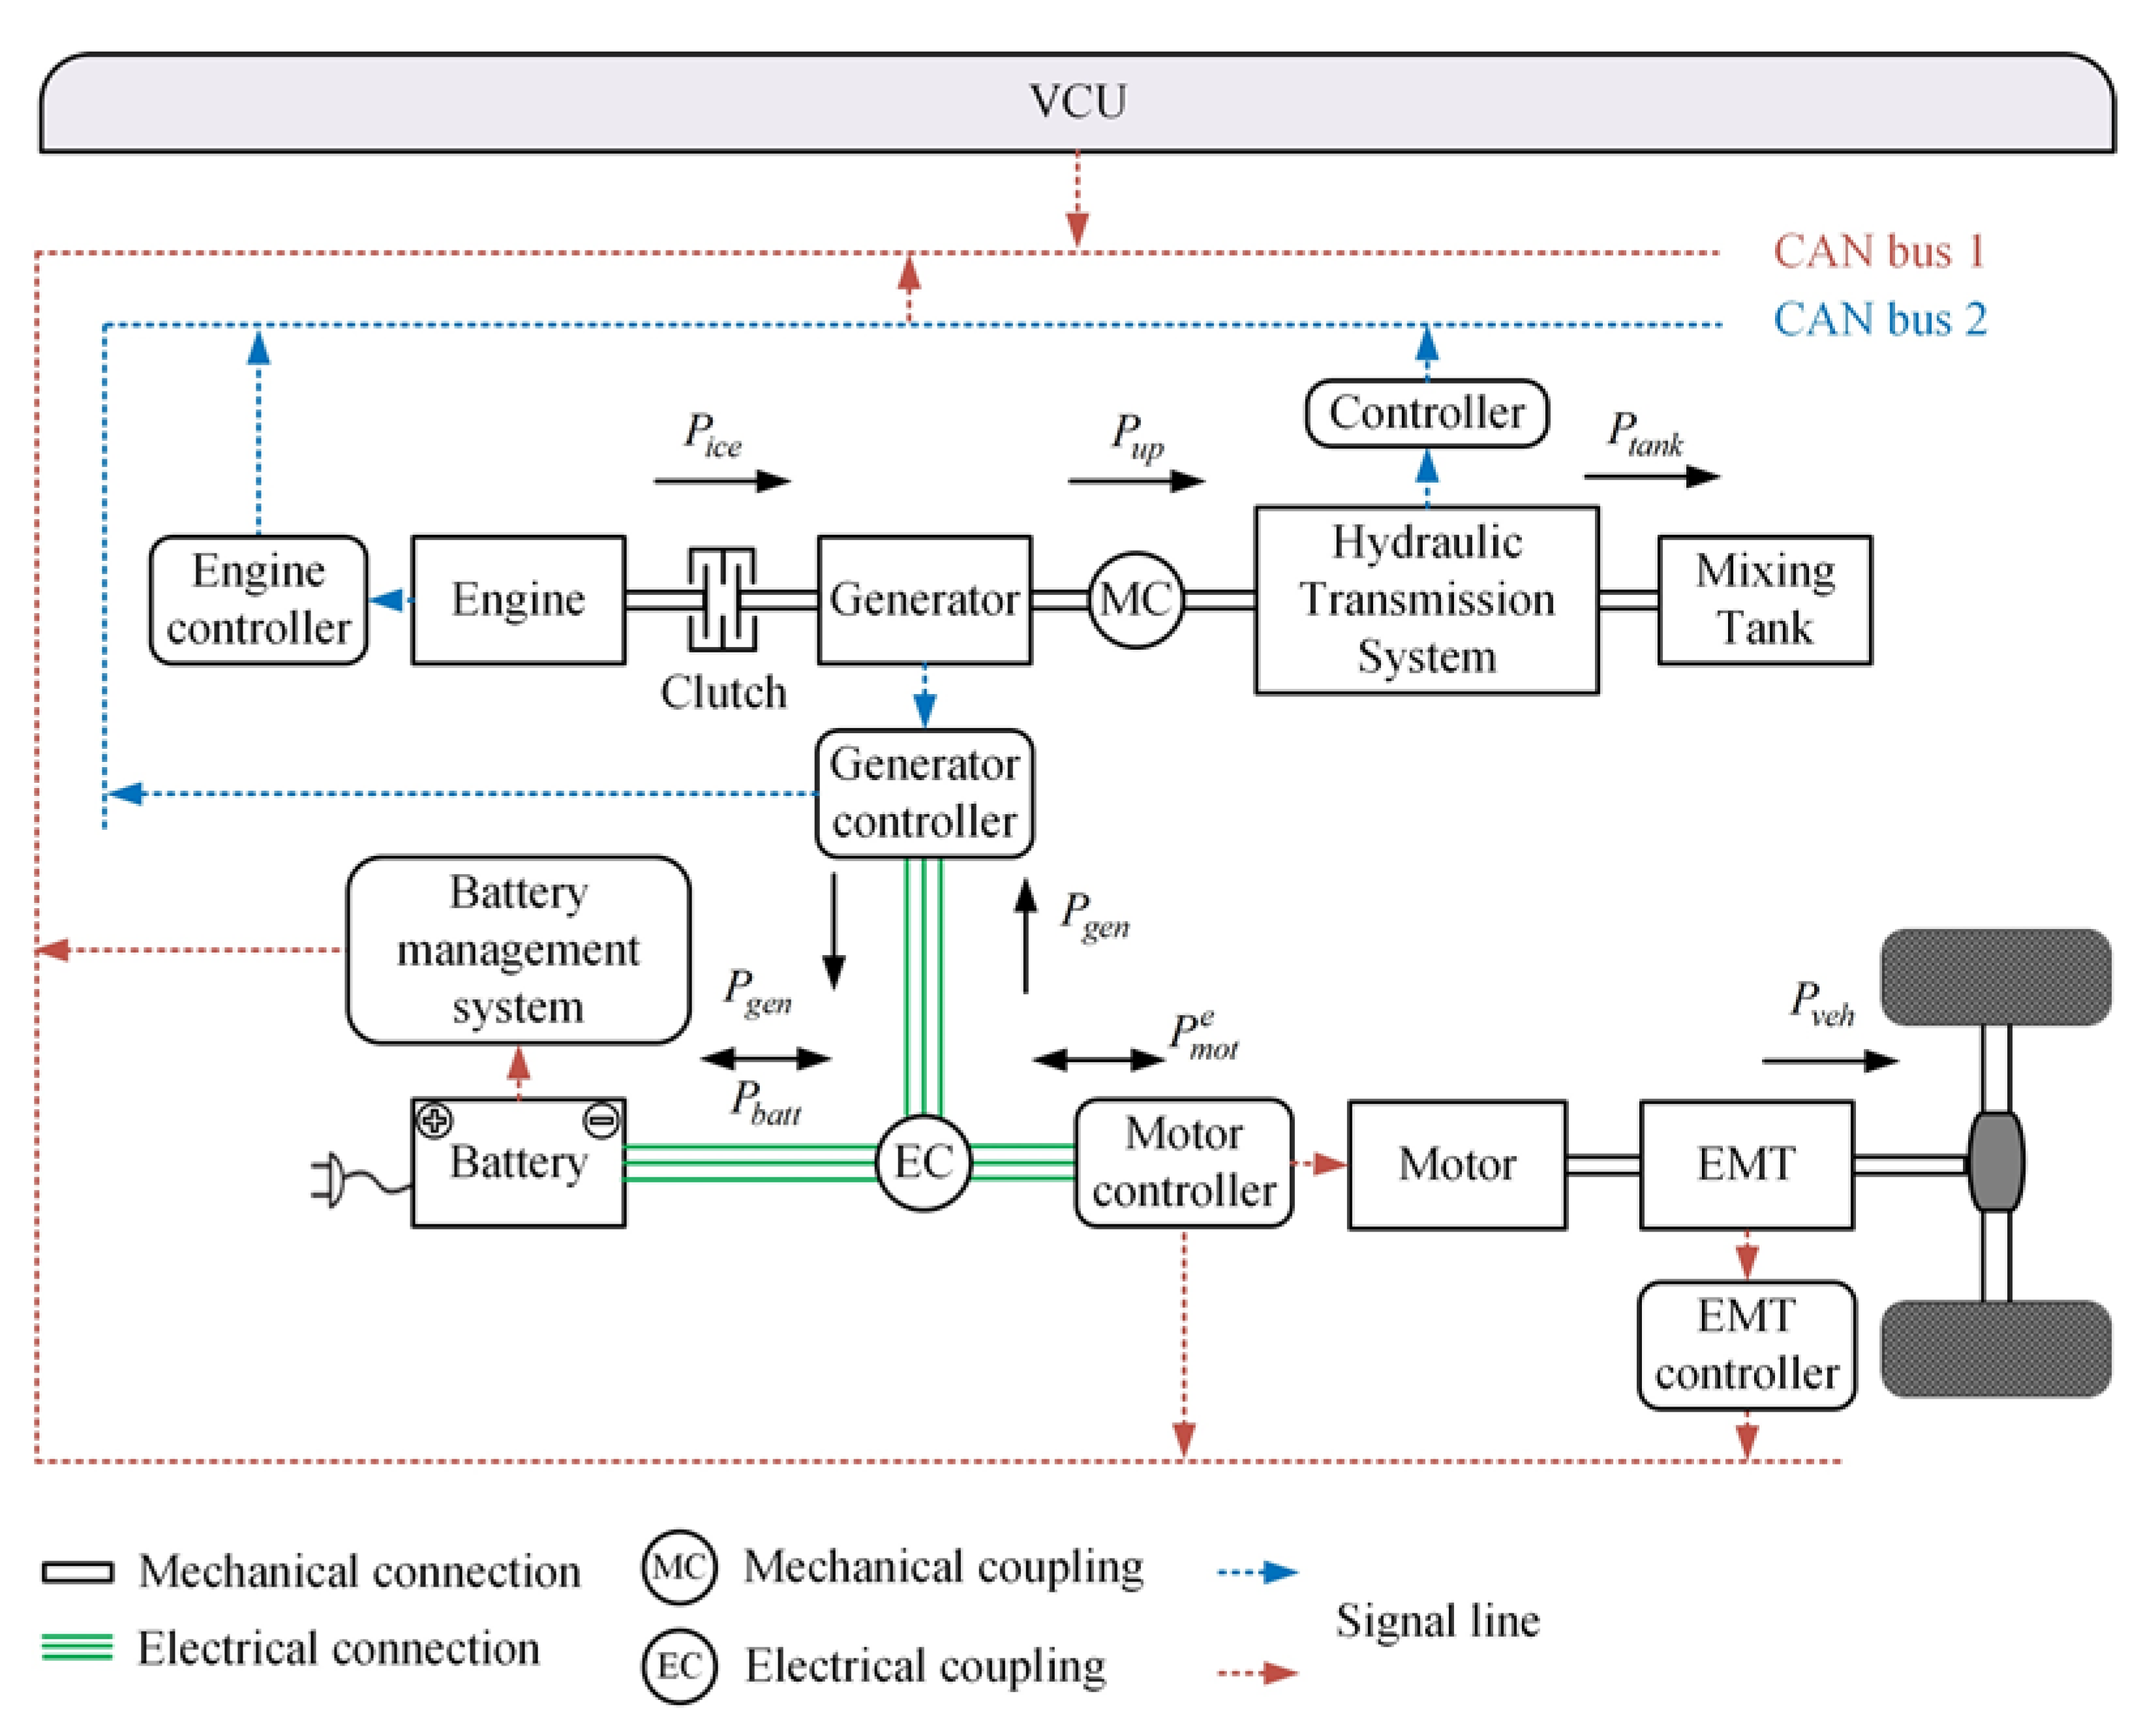
2. Powertrain Configuration and Model

In this work, a novel hybrid powertrain structure is proposed for the concrete truck mixers, and the characteristics of the structure and system models are presented in the following.

2.1. Powertrain Specification and System Modeling

As can be found in Figure 1, the novel hybrid powertrain consists of a dual energy source and dual energy consumption source, including engine and battery, an upper mixing system, and a vehicle driving system, respectively. The clutch between the engine and generator makes the powertrain mode diversified and reliability improved, which makes the powertrain an extended-range configuration for the vehicle driving system and a single-axle parallel configuration for the upper mixing system. The driving system can be propelled by one or both of the batteries and the auxiliary power unit (APU) composed of engine, clutch, and generator, and the power demand of the upper mixing system is provided by the engine or generator individually or jointly. Therefore, the CTM studied in the research is regarded as an extended-range electric concrete truck mixer (E-RE-CTM). Actually, the proposed powertrain configuration is also applicable to other vehicles with similar characteristics.
A CTM with 12 m3 agitator capacity carrying the proposed novel hybrid powertrain is taken as the research object, and the major parameters of the E-RE-CTM are listed in Table 1. To realize the E-RE-CTM control, the powertrain models, mainly including the engine, motor, generator, battery pack, and upper mixing system, are established, and previous studies are available for details [23].

2.2. Energy Optimal Problem Formulation

As for the E-RE-CTM, the core task of energy management control is to realize the dynamic distribution of dual energy source between dual energy consumption source within each trip. The energy management control enables the vehicle fuel economy to improve under the normal operations of the energy consumption sources. According to the powertrain analysis described in Section 2.1, the system needs to set two control variables. The output power of the engine and battery, which are given by P i c e and   P b a t t , respectively, are selected as control variables. The battery SOC is chosen as a state variable. Aiming at enhancing the battery recharging ability and improving the vehicle fuel economy, the energy optimization problem of the E-RE-CTM is formulated as Equations (1)–(3):
J = m i n ( k = 1 N L ( P i c e ( k ) , P g e n e ( k ) , P m o t e ( k ) , P u p ( k ) ,   S O C * ( k f ) ) )
where L ( · ) can be expressed as:
L ( P i c e ( k ) , P g e n e ( k ) , P m o t e ( k ) , P u p ( k ) ,   S O C ( k t a r ) )           = m ˙ f ( P i c e ( k ) , P g e n e ( k ) , P m o t e ( k ) , P u p ( k ) ) + γ ( S O C ( k f ) S O C * ( k f ) ) 2
Combined with the description of Section 2.1, the objective function can be further formulated as:
J = m i n ( k = 1 N m ˙ f ( P i c e ( k ) , ( P m o t e ( k ) P b a t t ( k ) ) , P u p ( k ) ) + γ ( S O C ( k f ) S O C * ( k f ) ) 2 )
where γ is a positive weighting factor, P g e n e ( k ) is the electric power of the generator at time k , P m o t e ( k ) means the known disturbance of the vehicle driving system at time k , P u p ( k ) is the power demand of the upper mixing system, P m o t e ( k ) , P u p ( k ) are system inputs, and S O C ( k f ) , S O C * ( k f ) are the target battery SOC and actual battery SOC in the end, respectively. N denotes the length of a trip.
N can be calculated by,
N = T t
where t is the time step, T means the driving cycle duration. Some other equality or inequality constraints should be satisfied during the process of calculation, as:
{ S O C ( k f ) S O C ( k ) S O C ( k 0 ) P b a t t M I N ( k ) P b a t t ( k ) P b a t t M A X ( k ) P i c e M I N ( k ) P i c e ( k ) P i c e M A X ( k ) P i c e ( k ) P u p ( k ) ( P m o t e ( k ) P b a t t ( k ) ) · η g e n ( k ) s i g n ( P g e n m ( k ) ) = 0
where S O C ( k 0 ) is the allowable upper limit of battery SOC, P g e n m ( k ) is the mechanical power of generator at time k , respectively, P b a t t M I N ( k ) , P i c e M I N ( k ) , P b a t t M A X , and P i c e M A X ( k ) denote the upper and lower limits of battery and engine output power at time k , respectively, which can be calculated by:
{ P b a t t M I N ( k ) = max ( f 2 ( SOC , C ch , Q batt , E OCV , k ) , P b a t t m i n ) P b a t t M A X ( k ) = max ( f 3 ( SOC , C dis , Q batt , E OCV , k ) , P b a t t m a x ) P i c e M I N ( k ) = max ( f 1 ( p ice , P up , P mot e , f 1 , η gen , P gen m ) , P i c e m i n ) P i c e M A X ( k ) = min ( f 1 ( p ice , P up , P mot e , f 2 , η gen , P gen m ) , ( P ice ( k ) + P ice max ) , P ice max )
where P b a t t m i n , P i c e m i n , P b a t t m a x and P i c e m a x mean the allowable power range of corresponding components, C c h and C d i s mean the maximum charge and discharge rate of the battery, and P i c e represents the maximum variable rate of the diesel engine out power in unit time and the value of it is chosen as 15 kW/s. Thus, the change rate of APU generating power is less than 15 kW/s.
By synthesizing Equations (1)–(6), it can be concluded that the energy optimization problem of E-RE-CTM belongs to the two-point boundary value problem in the finite time domain, which has the characteristics of constrained time-varying and double control variables.

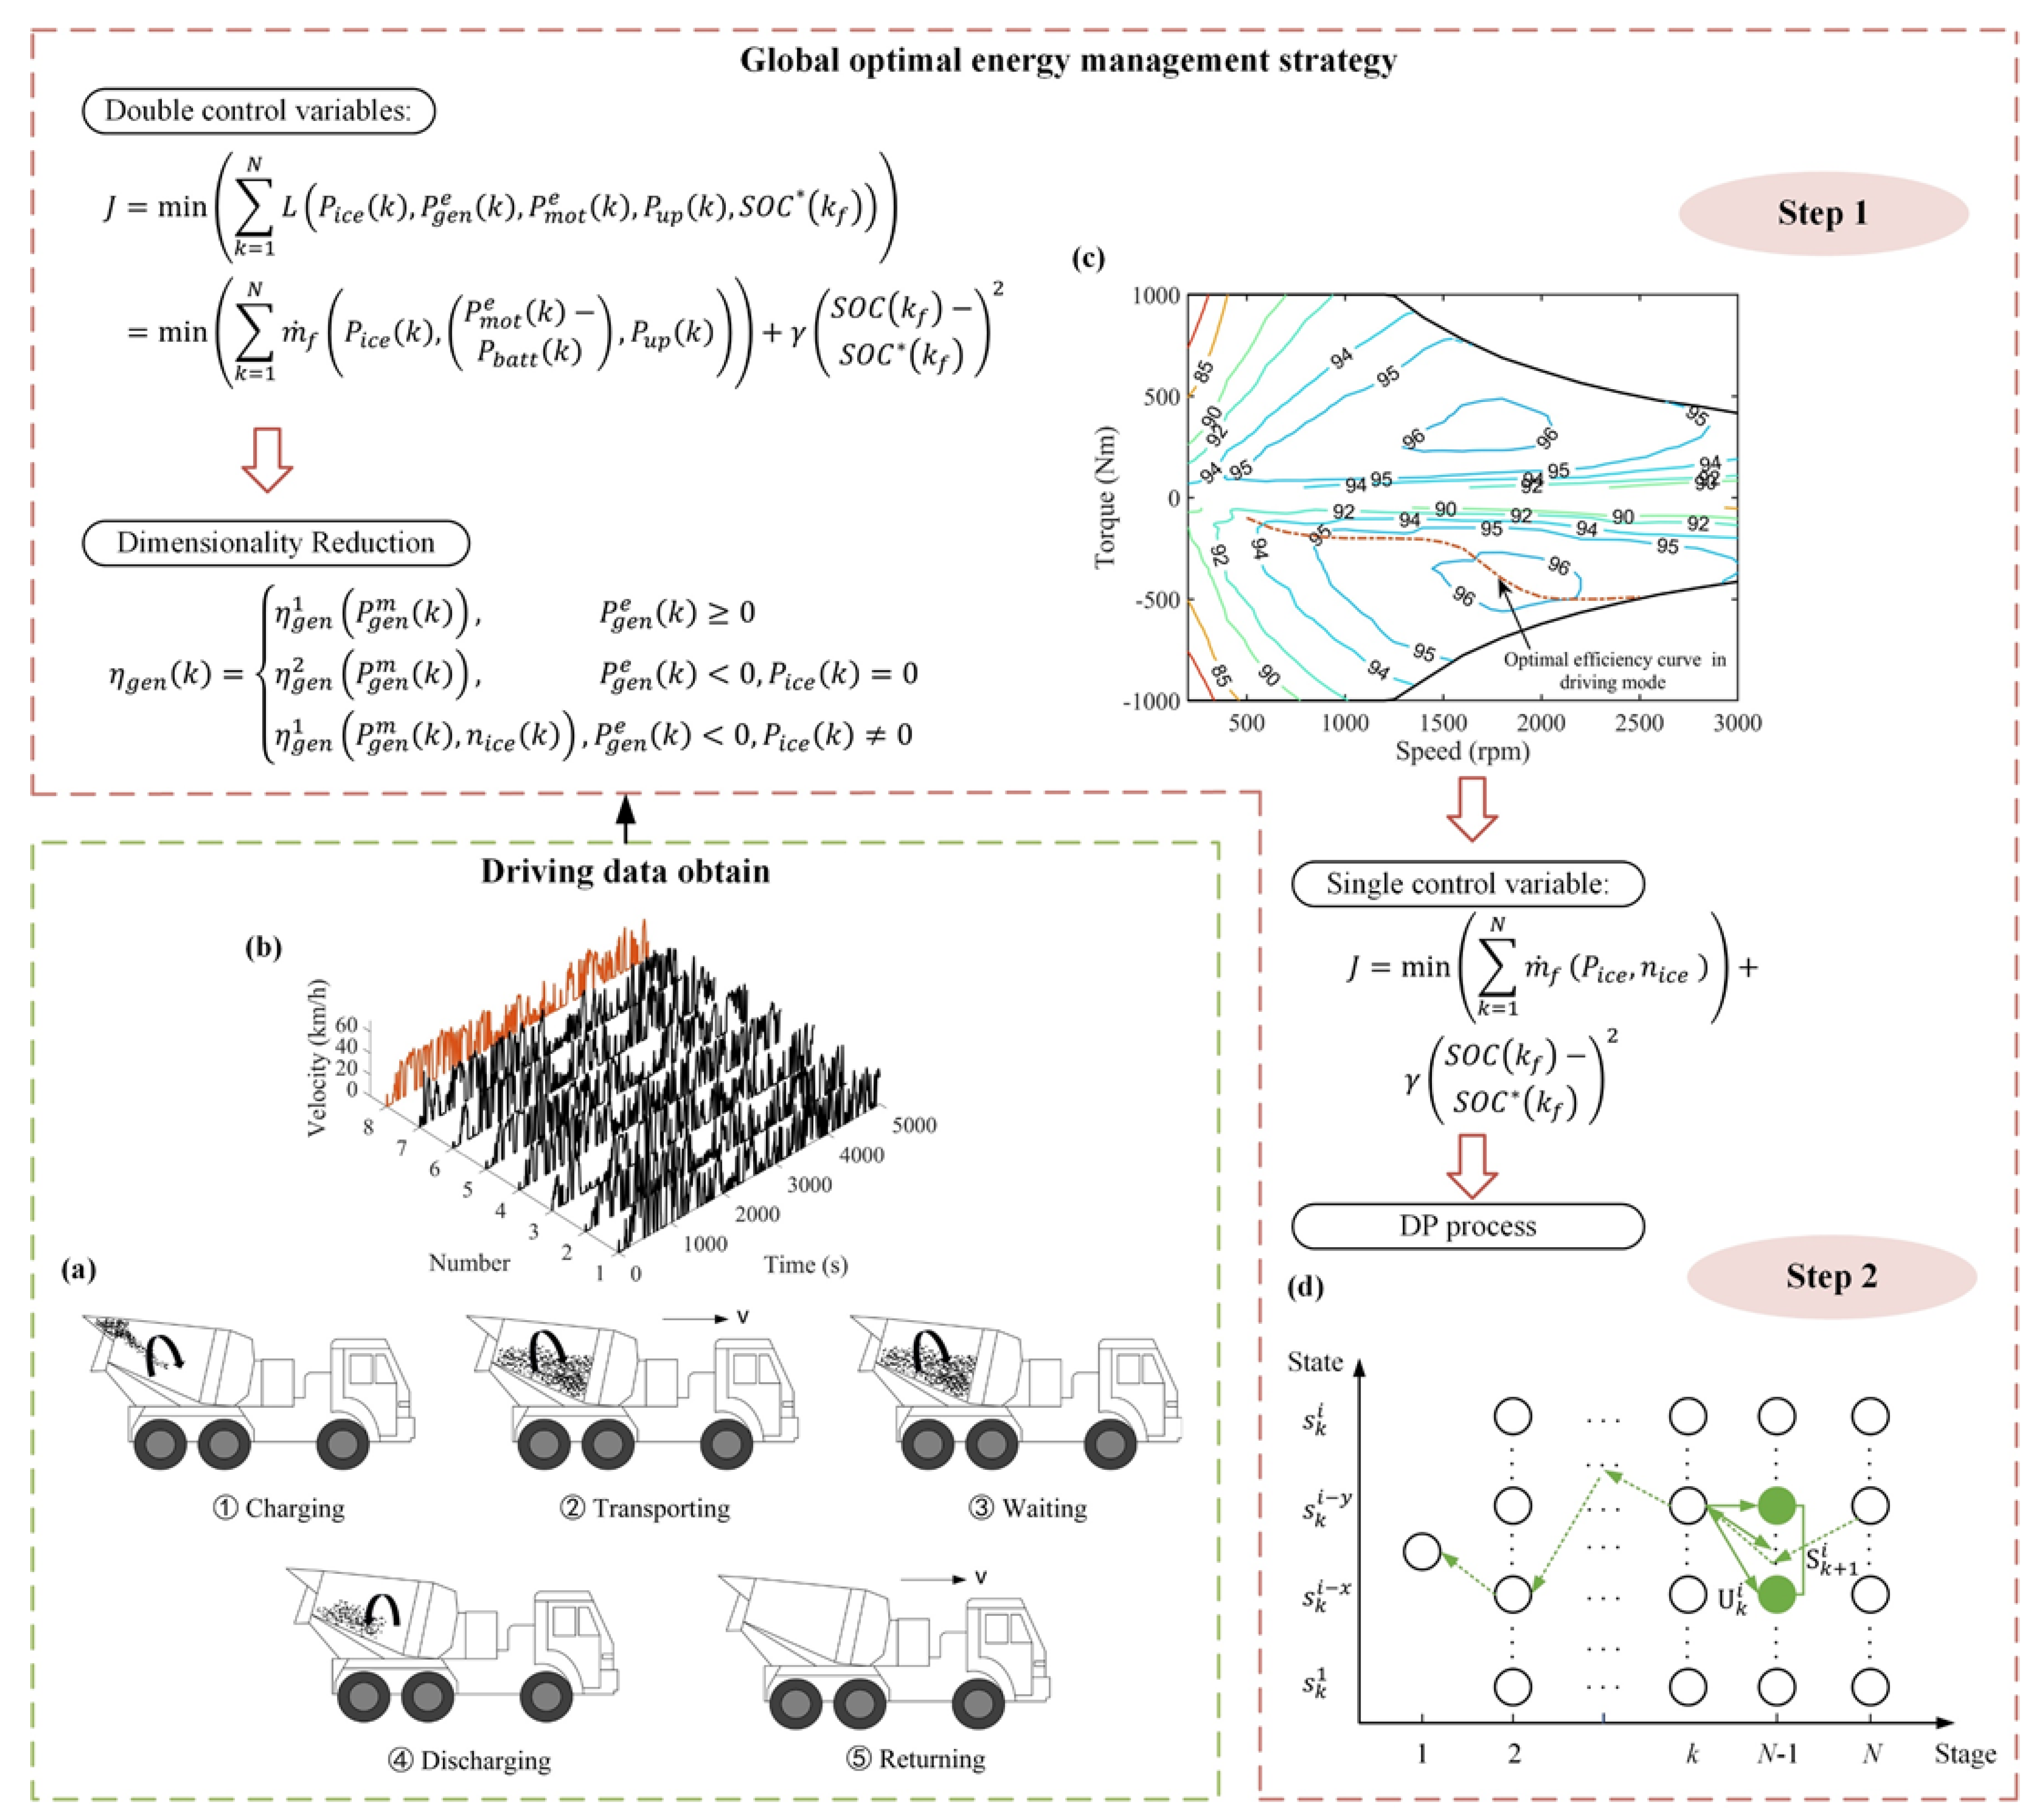
3. Global Optimal Energy Management Strategy

In this section, DP is applied to solve the energy optimization problem of E-RE-CTM. The total driving cycle known in advance is the premise of using DP [24]. Meanwhile, due to the iterative calculation of DP, the more complex the problem is, the greater the computational burden and the more memory utilization as the time increases [25,26]. For these reasons, as shown in Figure 2, the CTM real-world driving cycle data were collected, and the DP method with dimensionality reduction is presented, which is divided into two steps described as follows.

3.1. Driving Data Obtain

As shown in Figure 2a, a driving cycle of a CTM can be divided into five route segments, which are charging, transporting, waiting, discharging, and returning. Although the route segments of the CTM are the same each time daily, each driving cycle datum is different. The total driving mileage of the CTM is about 120 km per day according to the survey and real-world driving cycle data. Figure 2b shows the CTM real-world driving cycle data collected in eight days in Beijing by using a vehicle data recorder. The data of the first seven days are utilized as sample library construction and that of the last day is used for testing [27].

3.2. Dynamic Programming to Solve the Optimization Problem

Step 1: To achieve lower complexity and memory utilization in the solution process, it is necessary to reduce the dimension of control variables. In this work, by designing an optimal efficiency curve of the generator in driving mode, the two-point boundary value problem in the finite time domain with two control variables described in Section 2.2 is transformed into the single control variable problem. The optimal efficiency curve of the generator in driving mode is shown in Figure 2c, and the generator efficiency model of the powertrain is described as:
η g e n ( k ) = { η g e n 1 ( P g e n m ( k ) ) ,                                       P g e n e ( k ) 0 η g e n 2 ( P g e n m ( k ) ) ,                                       P g e n e ( k ) < 0 , P i c e ( k ) = 0   η g e n 3 ( P g e n m ( k ) , n i c e ( k ) )           P g e n e ( k ) < 0 , P i c e ( k ) 0
According to the equality constraint in Equation (5), once the generator efficiency η g e n is determined, the engine output power P i c e or the battery output power P b a t t can be selected as a single control variable to solve the problem. Since the engine and the generator are coaxially connected, the speed is the same. Therefore, the objective function can be formulated with the selected only control variable P i c e in this work, as:
  J = min ( k = 1 N m ˙ f ( P i c e , n i c e ) + γ ( S O C ( k f ) S O C * ( k f ) ) 2 )
Step 2: It is realized for the DP method to minimize the total fuel consumption of the E-RE-CTM and enhance the recharging ability of the battery over the given driving conditions in MATLAB. The schematic diagram of the DP process is shown in Figure 2d. Driving cycle time is divided into N stages. The control variable and state variable are P i c e and battery SOC, respectively. s k i means the i th state at stage k . The cost-to-go is the objective function J in Equation (8). For the detailed implementation of DP, refer to [24]. Significantly, to further improve the calculation efficiency, feasible control domain of stage k and feasible state domain of stage k + 1 , given by U k i and S k + 1 i , respectively have been determined before the backward solution in this work.
As a global optimization algorithm, DP is quite difficult to implement online due to the limitations of the known global information and high computational burden and memory utilization [25]. It can be the basis of designing other strategies according to the theoretically optimal control database.

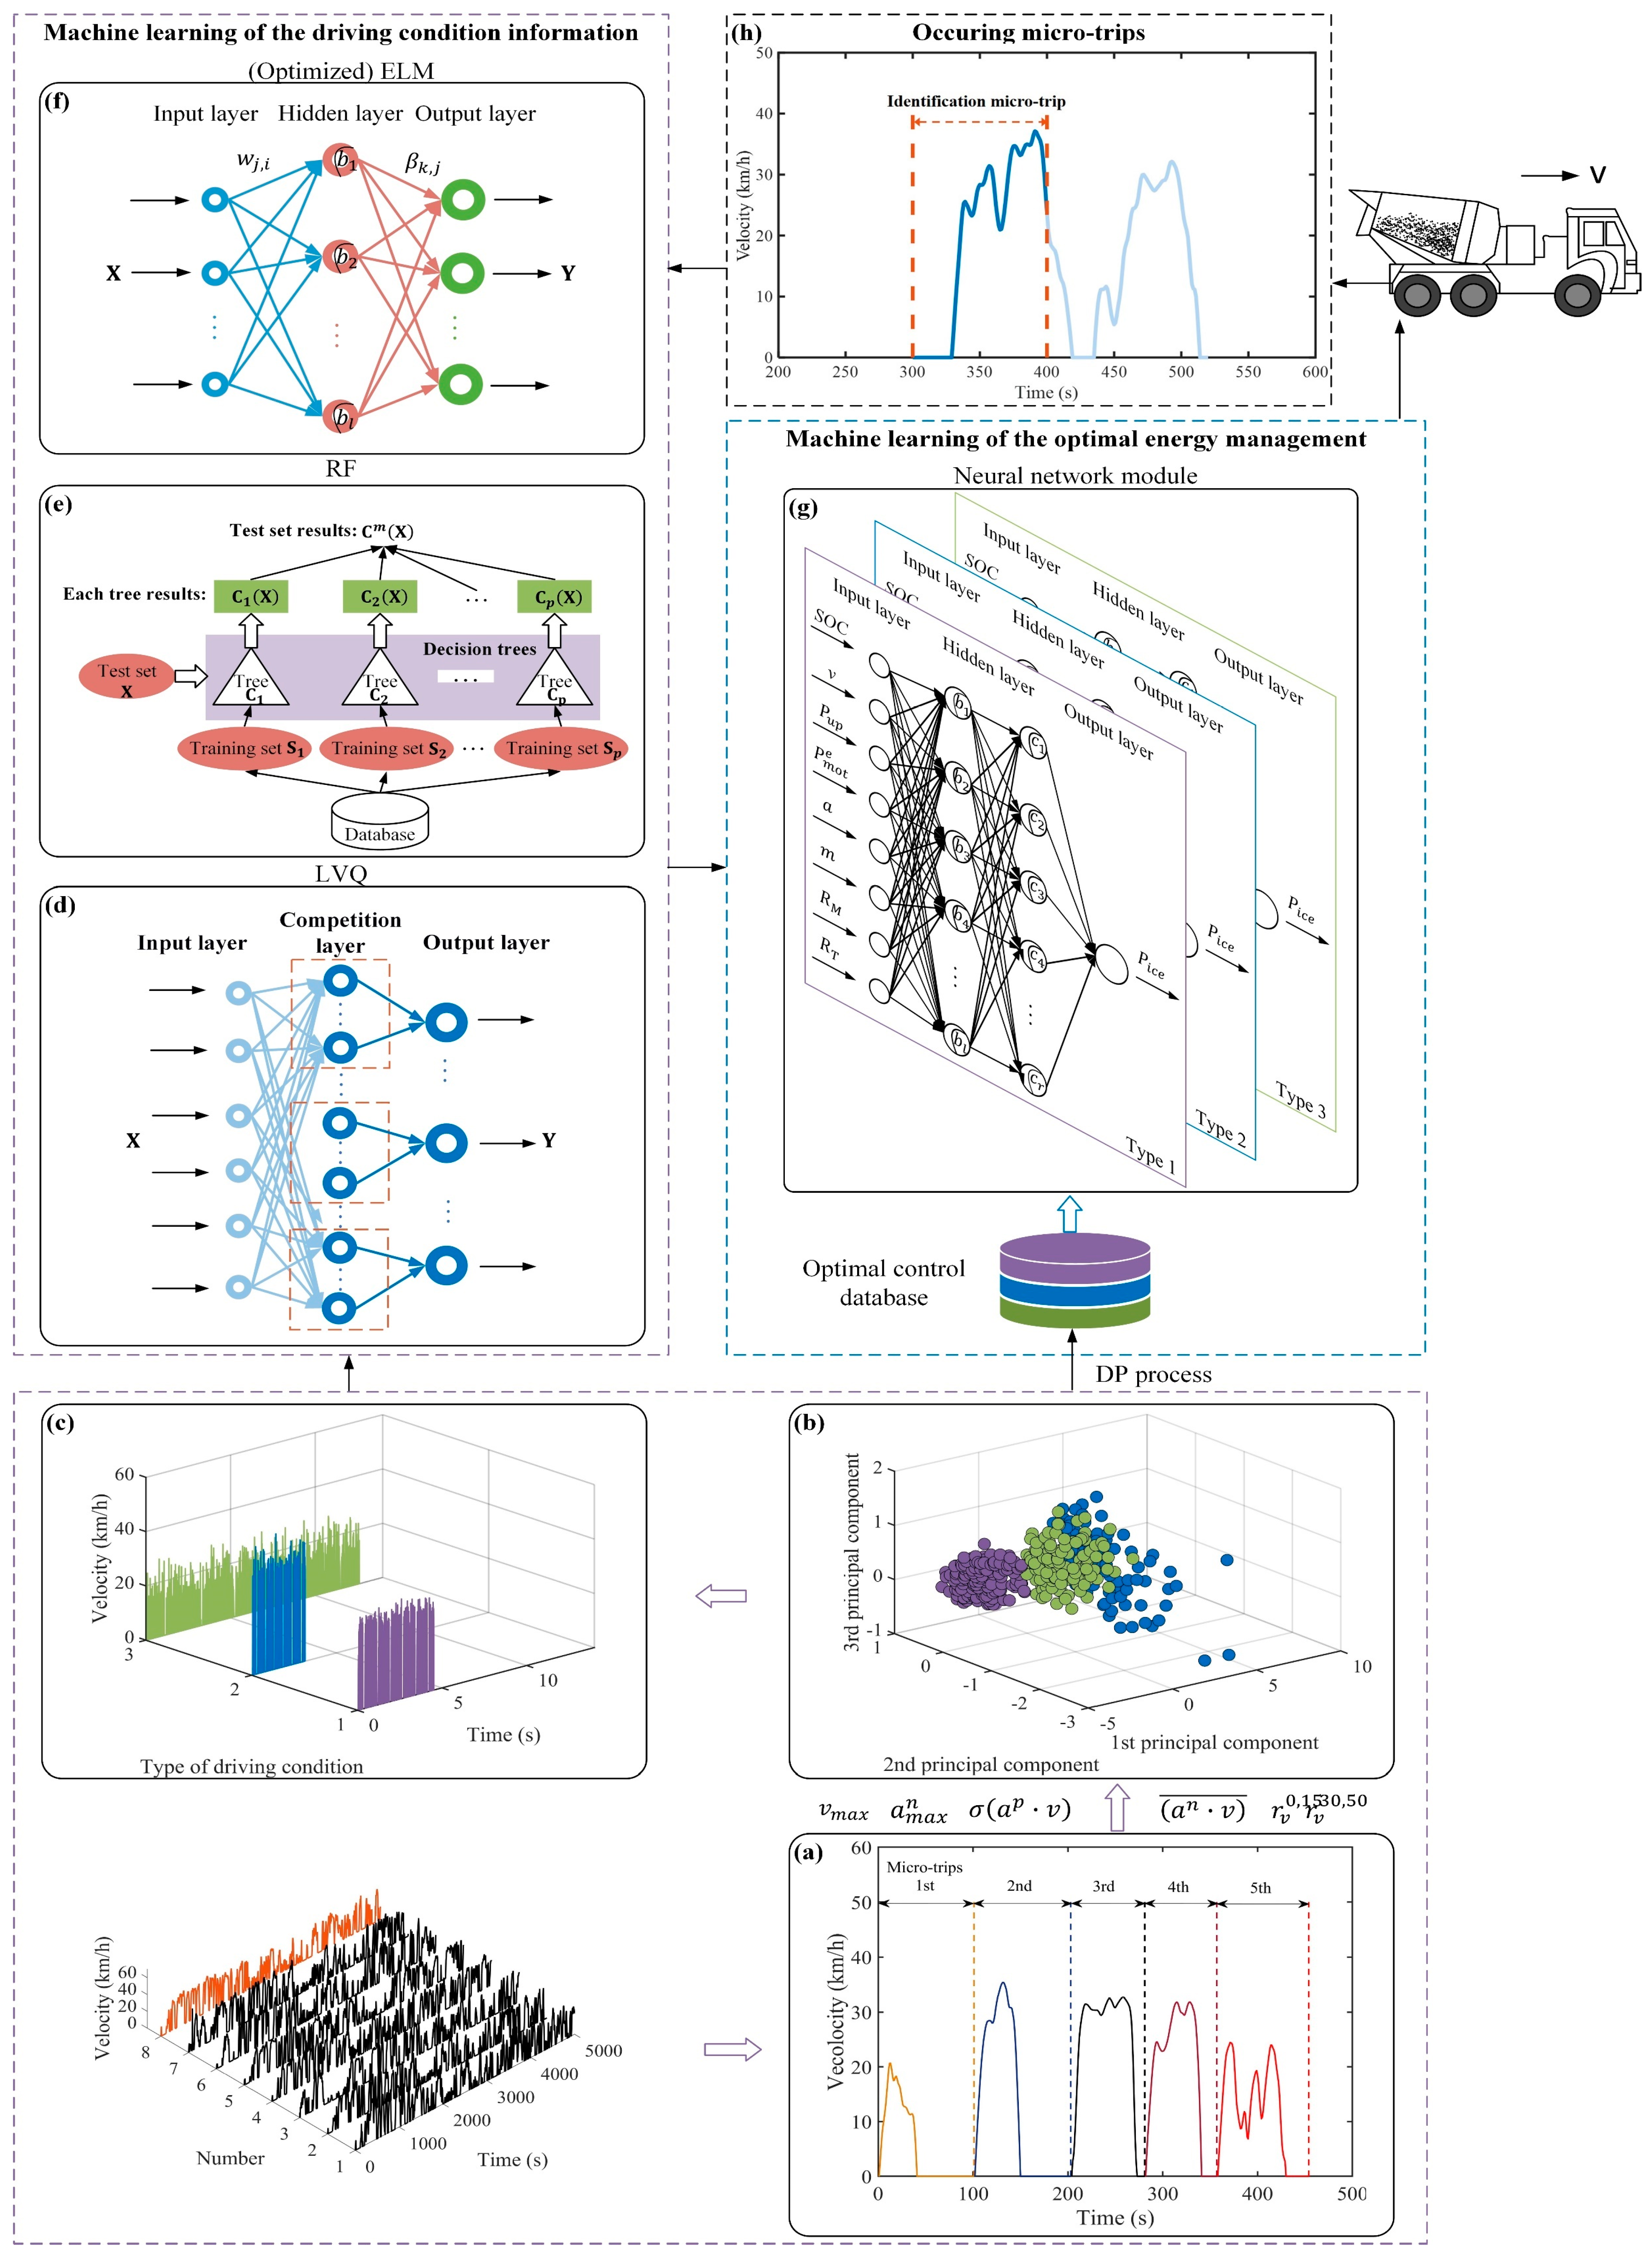
4. Approximate Optimal Energy Management Design Based on Machine Learning

To make the developed energy management strategy closer to the performance of DP, it is an effective solution to use a ML algorithm to learn the optimal decisions of DP. Meanwhile, it is necessary to combine with a ML algorithm to obtain driving condition information to further improve the performance of energy management strategy. The structure of ML-based optimal power control for the E-RE-CTM is described in Figure 3.

4.1. Machine Learning of the Trip Information

In this section, typical driving conditions construction based on unsupervised learning and driving condition identifier development based on supervised learning are introduced as follows.

4.1.1. Typical Driving Conditions Construction Based on Unsupervised Learning

To realize the driving condition construction, the following four steps are required.
Step 1: Features vector selection and dimension reduction.
To build the driving data sample library, the sample division method based on micro-trips is adopted, and the collected real-world driving data are subdivided into n   ( n = 1788 ) micro-trips (Figure 3a) after data supplement and elimination. The main method of data supplement is interpolation, and the limits of driving motor power and acceleration are mainly considered to eliminate the samples where the wrong data are located.
To describe the characteristics of obtained micro-trips, the remaining six characteristic parameters listed in Table 2 are selected through correlation analysis. The features matrix V F of the micro-trips can be expressed as:
V F = [ u 1 1   u 1 2           u 1 m u 2 1   u 2 2           u 2 m                         u n 1   u n 2           u n m ] = [ v 1 , v 2 , , v n ] T
where v = [ v m a x , a m a x n , σ ( a p · v ) , ( a n · v ) ¯ , r v 0 , 15 , r v 30 , 50 ] means the feature vector of a sample, and m and n denote the number of features and samples, respectively.
The above six features still have different degrees of correlation, and the more features, the higher the computational complexity. Principal component analysis (PCA) is a dimension reduction method that projects high-dimensional interrelated variables into low-dimensional orthogonal principal component space. The first several principal components with a large variance contribution rate are selected to describe the original variables. The principal components matrix M p can be expressed as:
M p = A p r × v T
where A p r means the load coefficient matrix of principal component, p   ( 1 p 3 ) and r   ( 1 r m ) represent the reference of principal components and features, respectively.
Figure 4a shows the variance contribution rate of each principal component. We can clearly see that the cumulative variance contribution rate of the first three principal components is 86.4305%, greater than 85%. Therefore, the number of principal components is three, which denotes that the six features of the micro-trips can be characterized by the three features.
The absolute value of the features load coefficient is related to the characteristic difference of the characteristic sample. Figure 4b describes the load coefficients of six features in the three principal components, respectively. The larger the absolute value of the load coefficient of the feature, the greater the influence of the feature on the sample difference. As we can see, the contribution level of the six features for the first principal component is the same, and the sixth and fifth features, the ratio between 0 and 15 and the ratio between 30 and 50 of vehicle speed, have the highest contribution to the second principal component.
Step 2: Samples clustering and performance verification.
K-means, a widely used unsupervised learning algorithm, needs to randomly select the cluster center, which makes classification results greatly affected by the selection of cluster center. Given this, k-means + +, proposed by Arthur and Vassilvitskii [28], is an iterative clustering algorithm based on the probability method to select the initial centroids, and it can generate better quality clusters [29]. K-means + + is utilized in this work. The elbow rule is employed to determine the optimal cluster number, and three types of driving conditions are obtained shown in Figure 3b.
Silhouette value, an evaluating indicator of clustering effect, is employed in this work, and the Silhouette values based on the k-means + + algorithm are presented in Figure 4c. The closer the value is to one, the better the clustering effect is. Except for a few samples belonging to type 2 whose Silhouette values are less than zero, the Silhouette values of others are relatively large, which denotes the k-means + + method is reasonable and feasible. Choose the first 100 micro-trips closest to the center of each type, which is presented in Figure 4d. It can be observed that the maximum speed of micro-trips under type 3 is the lowest, and the time when the speed is greater than zero is short, which belongs to congested urban driving conditions. The maximum speed of micro-trips under type 2 is greater than that under the others and the time when speed is greater than zero is the longest, which shows smoother urban driving conditions. The micro-trips under type 1 represent the relatively smoother urban working conditions with medium speed and a high idle ratio.
To test the sensitivity of the clustering method to the data sample library, a standard driving cycle called China bus driving cycle divided into 14 micro-trips is used in the section. The standard driving cycle and classification results are shown in Figure 4e. We can conclude that the results obtained and the characteristics of corresponding micro-trips are highly consistent with those described in Figure 4d, indicating that the method mentioned above has low sensitivity to driving data sample library.
Step 3: Typical driving conditions construction based on random sampling.
The various typical driving conditions are the basis for designing the energy management strategy of E-RE-CTMs based on machine learning. Considering the dynamic performance of the E-RE-CTM and the equal probability of each sample, a random sampling method without return is performed to construct the typical driving conditions. Significantly, once the target mileage of the typical driving condition is greater than the total that of all samples of a type, repeat the random sampling process without return. Figure 3c shows the obtained three typical driving conditions with 120 km mileage. The average working time is taken for charging, waiting, and discharging under each driving cycle, and the vehicle is from full load to no load.
Step 4: Results of optimal control.
The three types of driving conditions, including the power demand of the mixing drum system, the known disturbance of the vehicle driving system, and the whole vehicle mass in five route segments, are chosen as the simulation input. The power of dual energy-source and dual energy consumption source and battery SOC under the constructed three typical driving conditions are in Figure 5a–c, respectively, by using DP. As we can see, under different driving condition types, the engine output power is always greater than a fixed value, ranging from 21 to 23 kW when the engine is in a stable operation state, which indicates that DP makes the engine work in the highly efficient area to the greatest extent. The battery SOC can just reach the minimum allowable value at the end of the trip under the different types, which improves vehicle fuel economy and recharging capacity.

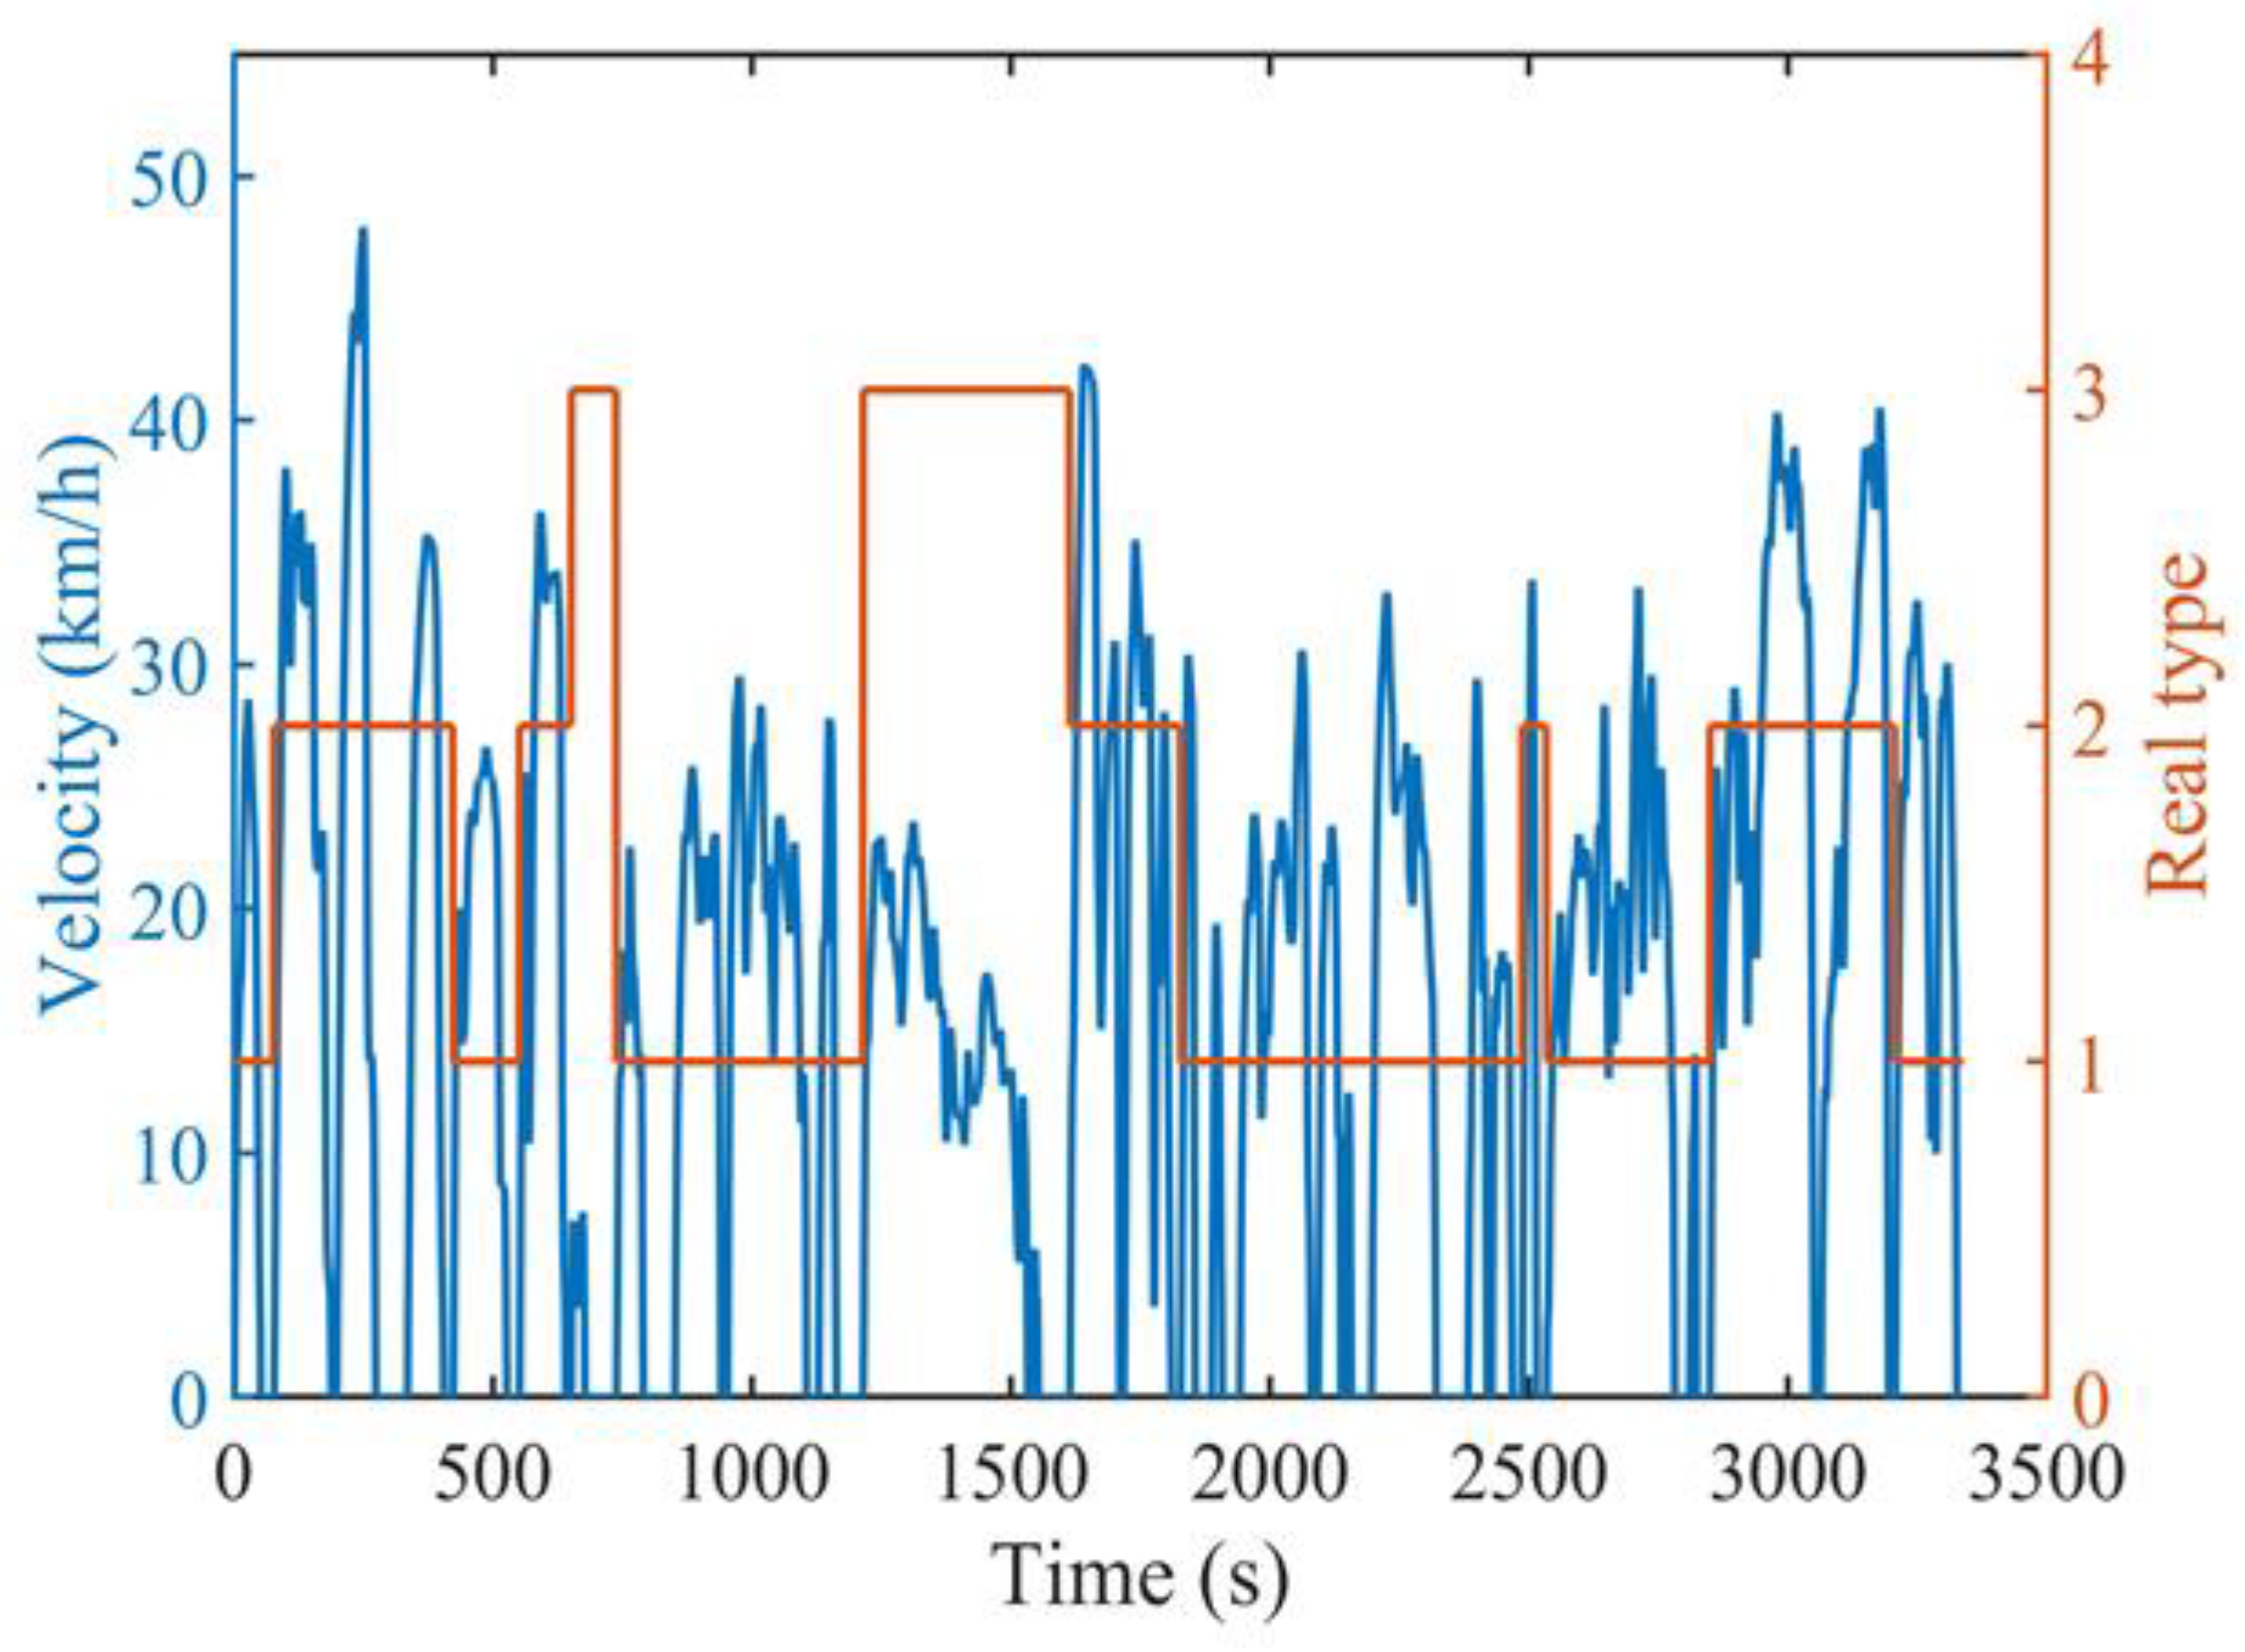
4.1.2. Development of Driving Condition Identifier Based on Supervised Learning

In this section, we establish three different identifiers and compare their performance.
Step 1: Based on the established sample library of the E-RE-CTM, three methods based on ML, including LVQ, Random Forest (RF), and Extreme Learning Machine (ELM), are designed to realize the online identification of driving condition types, which can be described as follows.
Learning Vector Quantization: An LVQ neural network is a supervised forward neural network, of which a global optimum can be obtained by directly calculating the distance between the input vector and the competitive layer without preprocessing input vectors [21,30]. As shown in Figure 3d, the LVQ neural network consists of three layers: an input layer, a competition layer, and linear output layer, and the connection modes between layers are full connection and partial connection, respectively. The input layer contains six neurons corresponding to the six features mentioned in Table 2. The number of competition layer neurons is set to be 30 by continuous experiments. Three neurons related to the three types of driving conditions mentioned in Section 4.1.1 are included in the linear output layer. The LVQ neural network selects the winning neuron by calculating the Euclidean distance of weights of the input vector and competitive neurons, as:
D i = j = 1 I ( x i ω i j ) 2 ,           i = 1 , 2 , .. , C
where ω i j means the connection weight of the i th competitive layer neurons and the j th input layer neurons, I and C represent the dimension of the input vector and number of the competitive neurons, respectively. Only the winning neuron and its corresponding output neuron are set to one [31]. On that basis, the actual type is obtained. Then the weight of the input vector and competitive neurons is updated by:
  ω i j ( k + 1 ) = { ω i j ( k ) + η ( x j ω i j ( k ) ) ,           f o r   c o n s i s t e n t   i d e n t i f i c a t i o n   r e s u l t s   ω i j ( k ) η ( x j ω i j ( k ) ) ,           f o r   i n c o n s i s t e n t   i d e n t i f i c a t i o n   r e s u l t s
where k is the number of iterations, and η represents the learning efficiency.
Random Forest: RF is an ensemble learning method, a branch of ML, based on a single decision tree [32]. The final decision results C m ( · ) of RF are generated by equal voting of all decision trees C p . Currently, RF has attracted extensive attention due to its excellent performance [33,34], however, there is still a lack of research on driving condition identification. The calculation process of RF is described in Figure 3e. The size of decision tree affects the performance of the random forest algorithm, and the value 450 with high mean accuracy and moderate scale is selected by continuous experiments.
Extreme Learning Machine: An ELM neural network is a single hidden layer neural network proposed by Huang [35], which is aimed at the shortcomings of a single hidden layer feedforward neural network algorithm. It has the advantages of good generalization performance, fast learning speed, and ease of use. We can obtain the unique optimal solution by selecting the number of hidden layer neurons. Figure 3f shows the structure of the ELM neural network. The threshold B of hidden neurons and the input weights W are randomly generated and remain unchanged in the training process. By solving Equation (13) can get corresponding output weights β without iteration [20], as:
  min β H β T β * = H + β
where H means the hidden layer output matrix, T is the expected output, and H + denotes the Moore–Penrose of H . The input vectors are equal to that of LVQ. The experimental method is still used to ensure the number of hidden layer neurons to realize the balance between computational efficiency and recognition accuracy.
Step 2: Performance Comparison.
To verify and compare the performance of the above identification methods, Figure 6 shows a combined driving cycle constructed from the testing driving data by the random sampling method and its real types.
As presented in Table 3, Kappa coefficient κ, total accuracy A m and identification time t a are chosen as indexes to evaluate and compare the identifiers performance. The total accuracy A m can directly reflect the correct proportion of classification or recognition; however, if the samples are unbalanced, the accuracy will fail. Kappa coefficient κ, ranging from −1 to 1, can penalize the bias of the model compared with total accuracy A m [36]. It is more suitable for the performance evaluation of classification problems with unbalanced category samples. Reference [37] proposed the model performance analysis criteria according to the Kappa value. The higher the κ or A m , the better the performance; on the contrary, a lower t a indicates better performance. The window size, W t , and identification time, I t , intervals are vital to the accuracy of the identification and real-time implementation. According to the identifiers performance comparison results under different combinations of the two key parameters, W t = 120   s and I t = 1   s are optimal for RF and ELM and W t = 80   s and I t = 1   s are optimal for LVQ. The Kappa coefficients of the three methods are all greater than 0.40, which means that the identification results have reached an ideal consistency with the real results [37]. If κ is greater than 0.61, it indicates that the identification is highly consistent with the real situation [37]. Thus, it can indicate the accuracy and feasibility of the three methods. Meanwhile, we can clearly see that the ELM method outperforms the others by comparing the three indexes under the parameter combination [ W t , I t ] = [ 120 , 1 ] . Although the kappa coefficient and total accuracy of LVQ is superior to these of RF and ELM under the parameter combination [ W t , I t ] = [ 80 , 1 ] , the identification time is the longest. Comparing the optimal results of ELM and LVQ mentioned above, it can be concluded that ELM has better recognition performance in this work. Hence, the driving condition identifier based on ELM would be chosen to be applied for the online energy management strategy.
Step 3: Optimization of identifier based on ELM.
The input weights and hidden layer thresholds of the basic ELM are generated randomly, and still have the potential to further improve performance. In this section, an ELM identifier based on genetic algorithm optimization is proposed. Meanwhile, to obtain better performance, k-fold ( k = 10 ) cross-validation method is used to determine the optimal number of hidden layer nodes. Taking the recognition accuracy as the fitness value, the flow chart of the optimized ELM method is presented in Figure 7. The identification results are listed in Table 3 under the same driving cycle in Step 2. We can clearly see that the Kappa coefficient κ of optimized ELM is 0.65, which is 0.02 higher than that of unoptimized ELM, and the total accuracy A m of optimized ELM is increased by 0.01 than that of unoptimized ELM. The identification time t a is also shortened to a certain extent.

4.2. Machine Learning of the Optimal Energy Management

4.2.1. Neural Network Structure Determination

Based on the optimal control results of different driving conditions obtained in Section 3.2, neural network models are designed to find the optimal power split associated with driving condition types.
The input and output variables of the neural network need to be determined in advance [15]. According to Equation (8), the control variable P i c e is selected as the NN module output variable. Considering the characteristics of the system, in addition to basic input variables, such as the power demand of the vehicle driving system, battery SOC, and the vehicle speed, the vehicle mass and power demand of the upper mixing system are also significant for the NN module construction. The vehicle mass that affects the power demand of the dual energy consumption source is chosen as the NN module input variable. The power demand of the upper mixing system affects whether the dual energy source will output power or how much power it will output. As an inertial system, the change rate of the diesel engine is limited in unit time [8], so the last power output of the engine is also taken as an input variable of the NN module. Vehicle acceleration, total and current mileage, and time are also treated as the input variable of the NN module. Therefore, the novel efficient NN module structure is preliminarily constructed with 11 input variables.
To further reduce the calculation time and the memory usage of the control strategy, the input variables are reduced to eight by calculating the Spearman correlation coefficient. Figure 3g describes the final NN module structure with eight input variables, two hidden layers, and one output variable. The number of NN module hidden layer nodes are different under different types of driving conditions in this study.

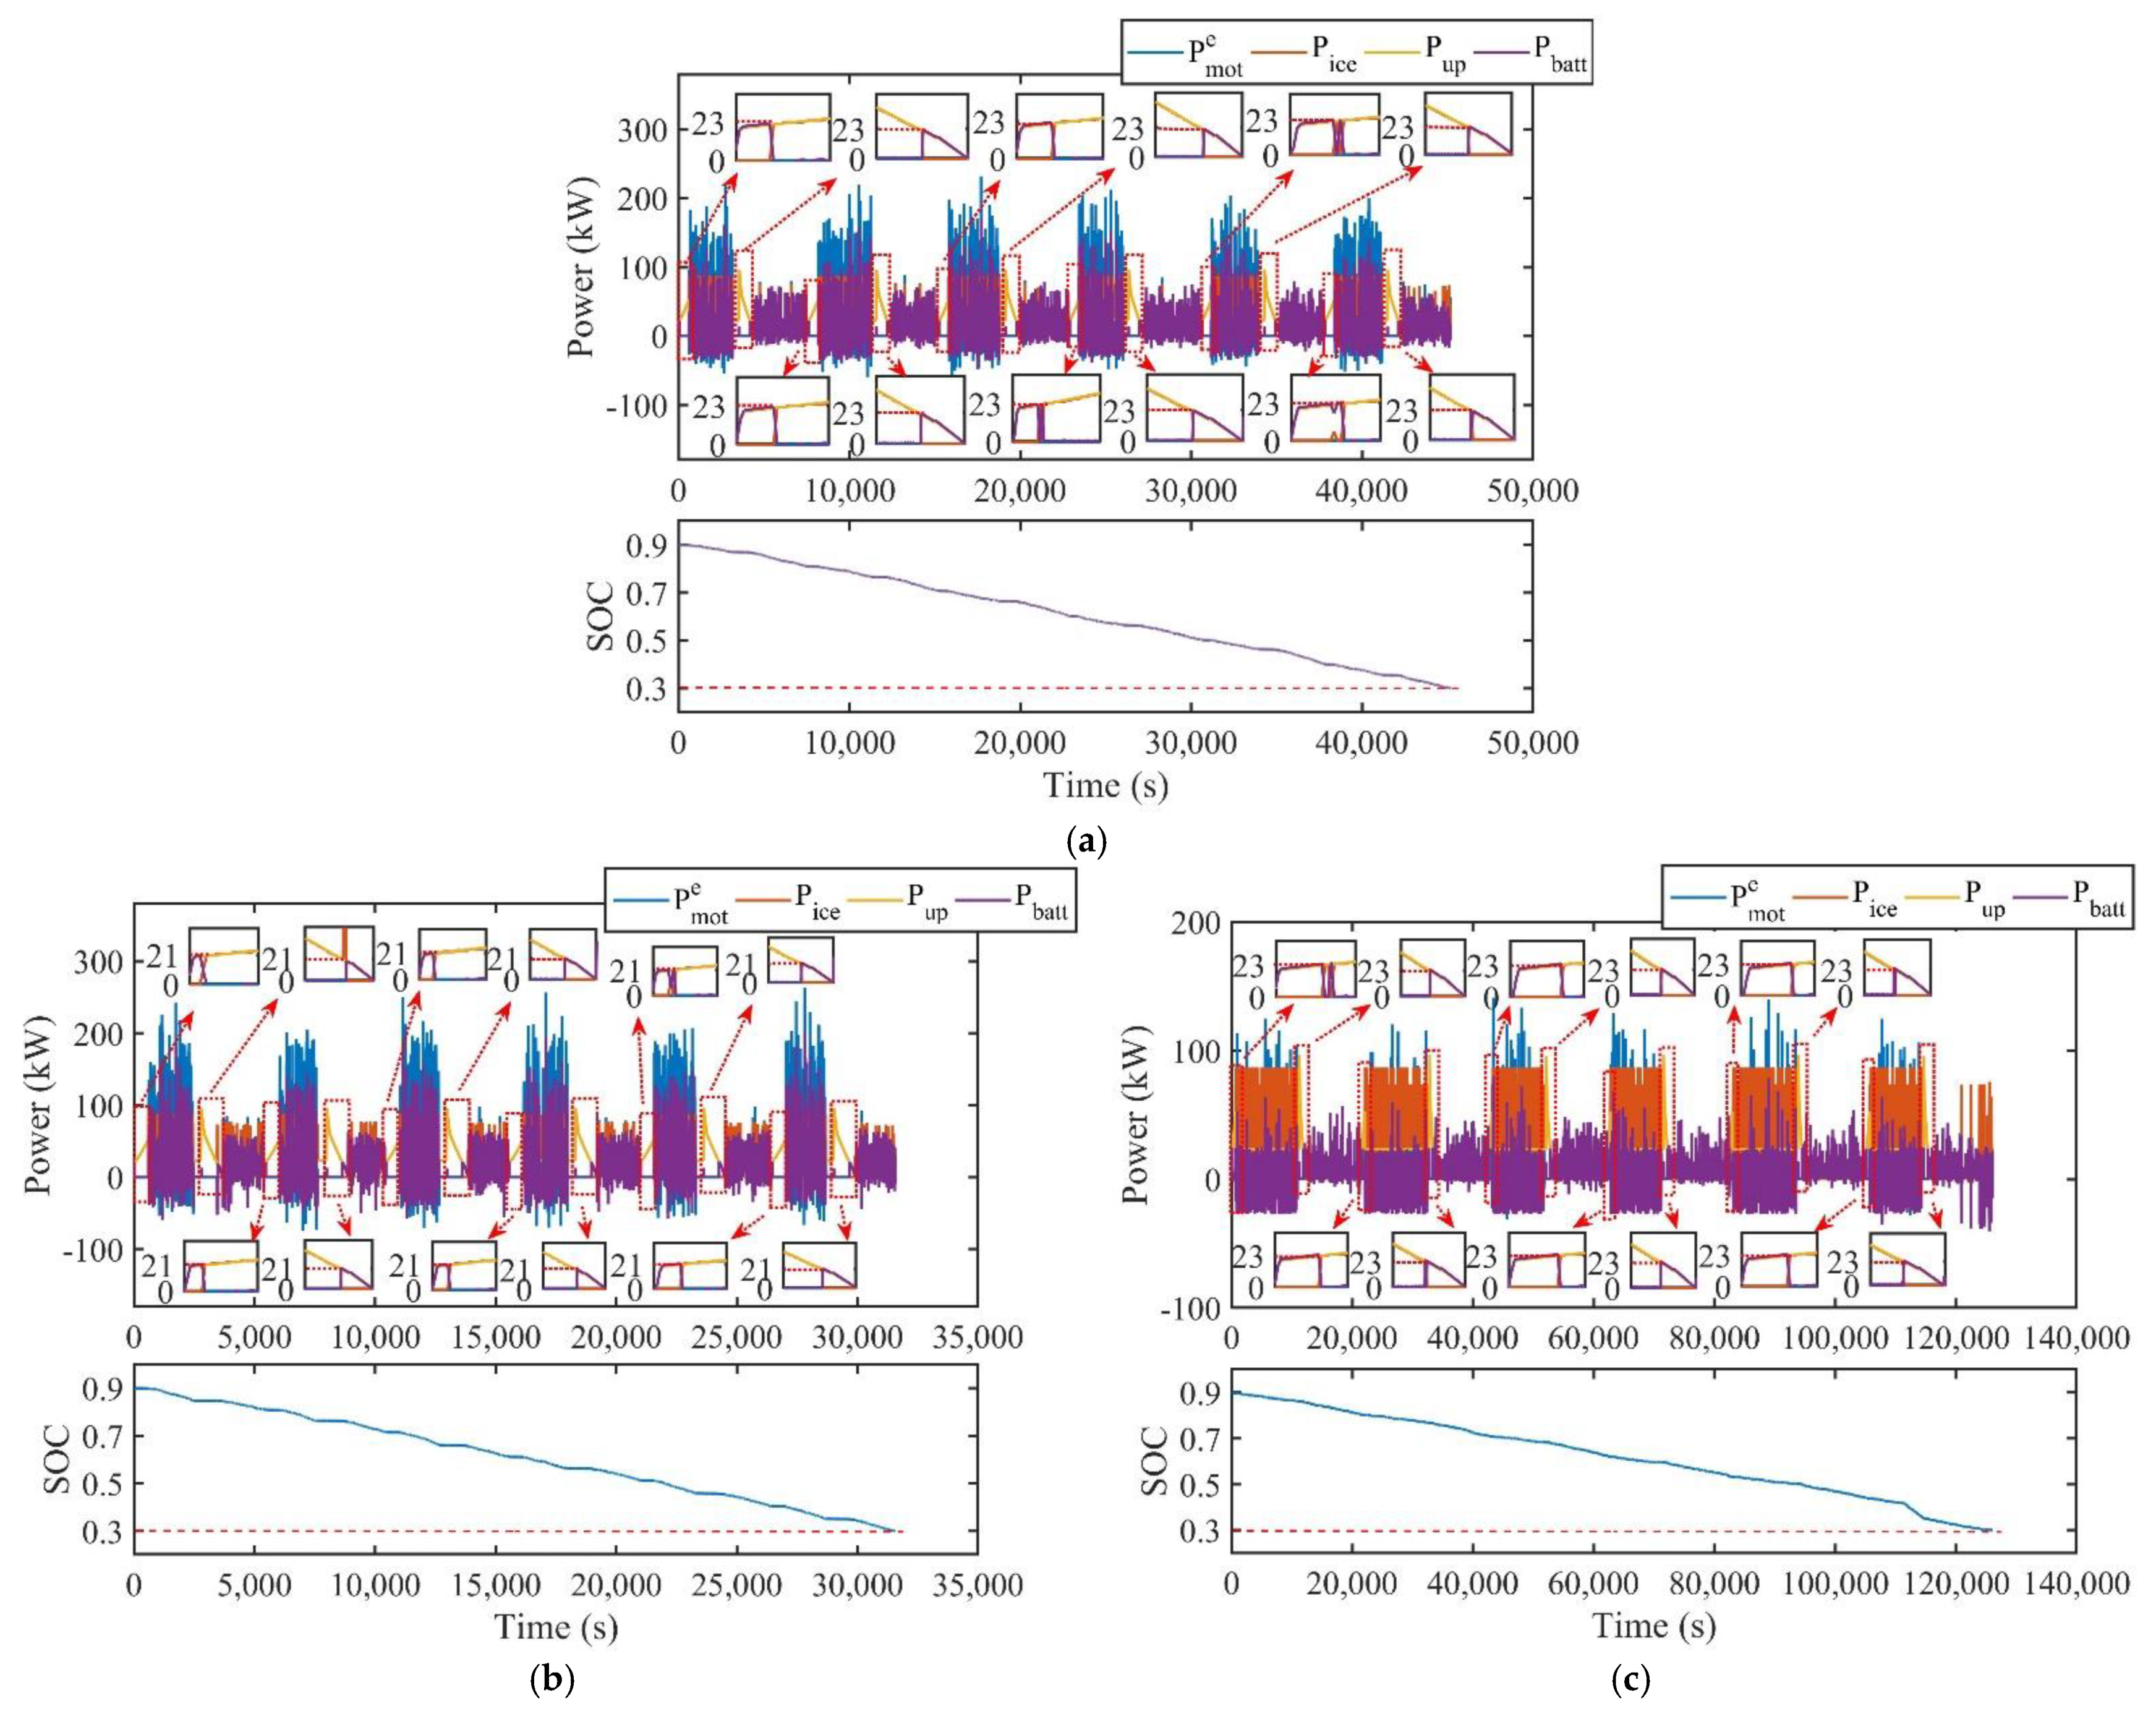
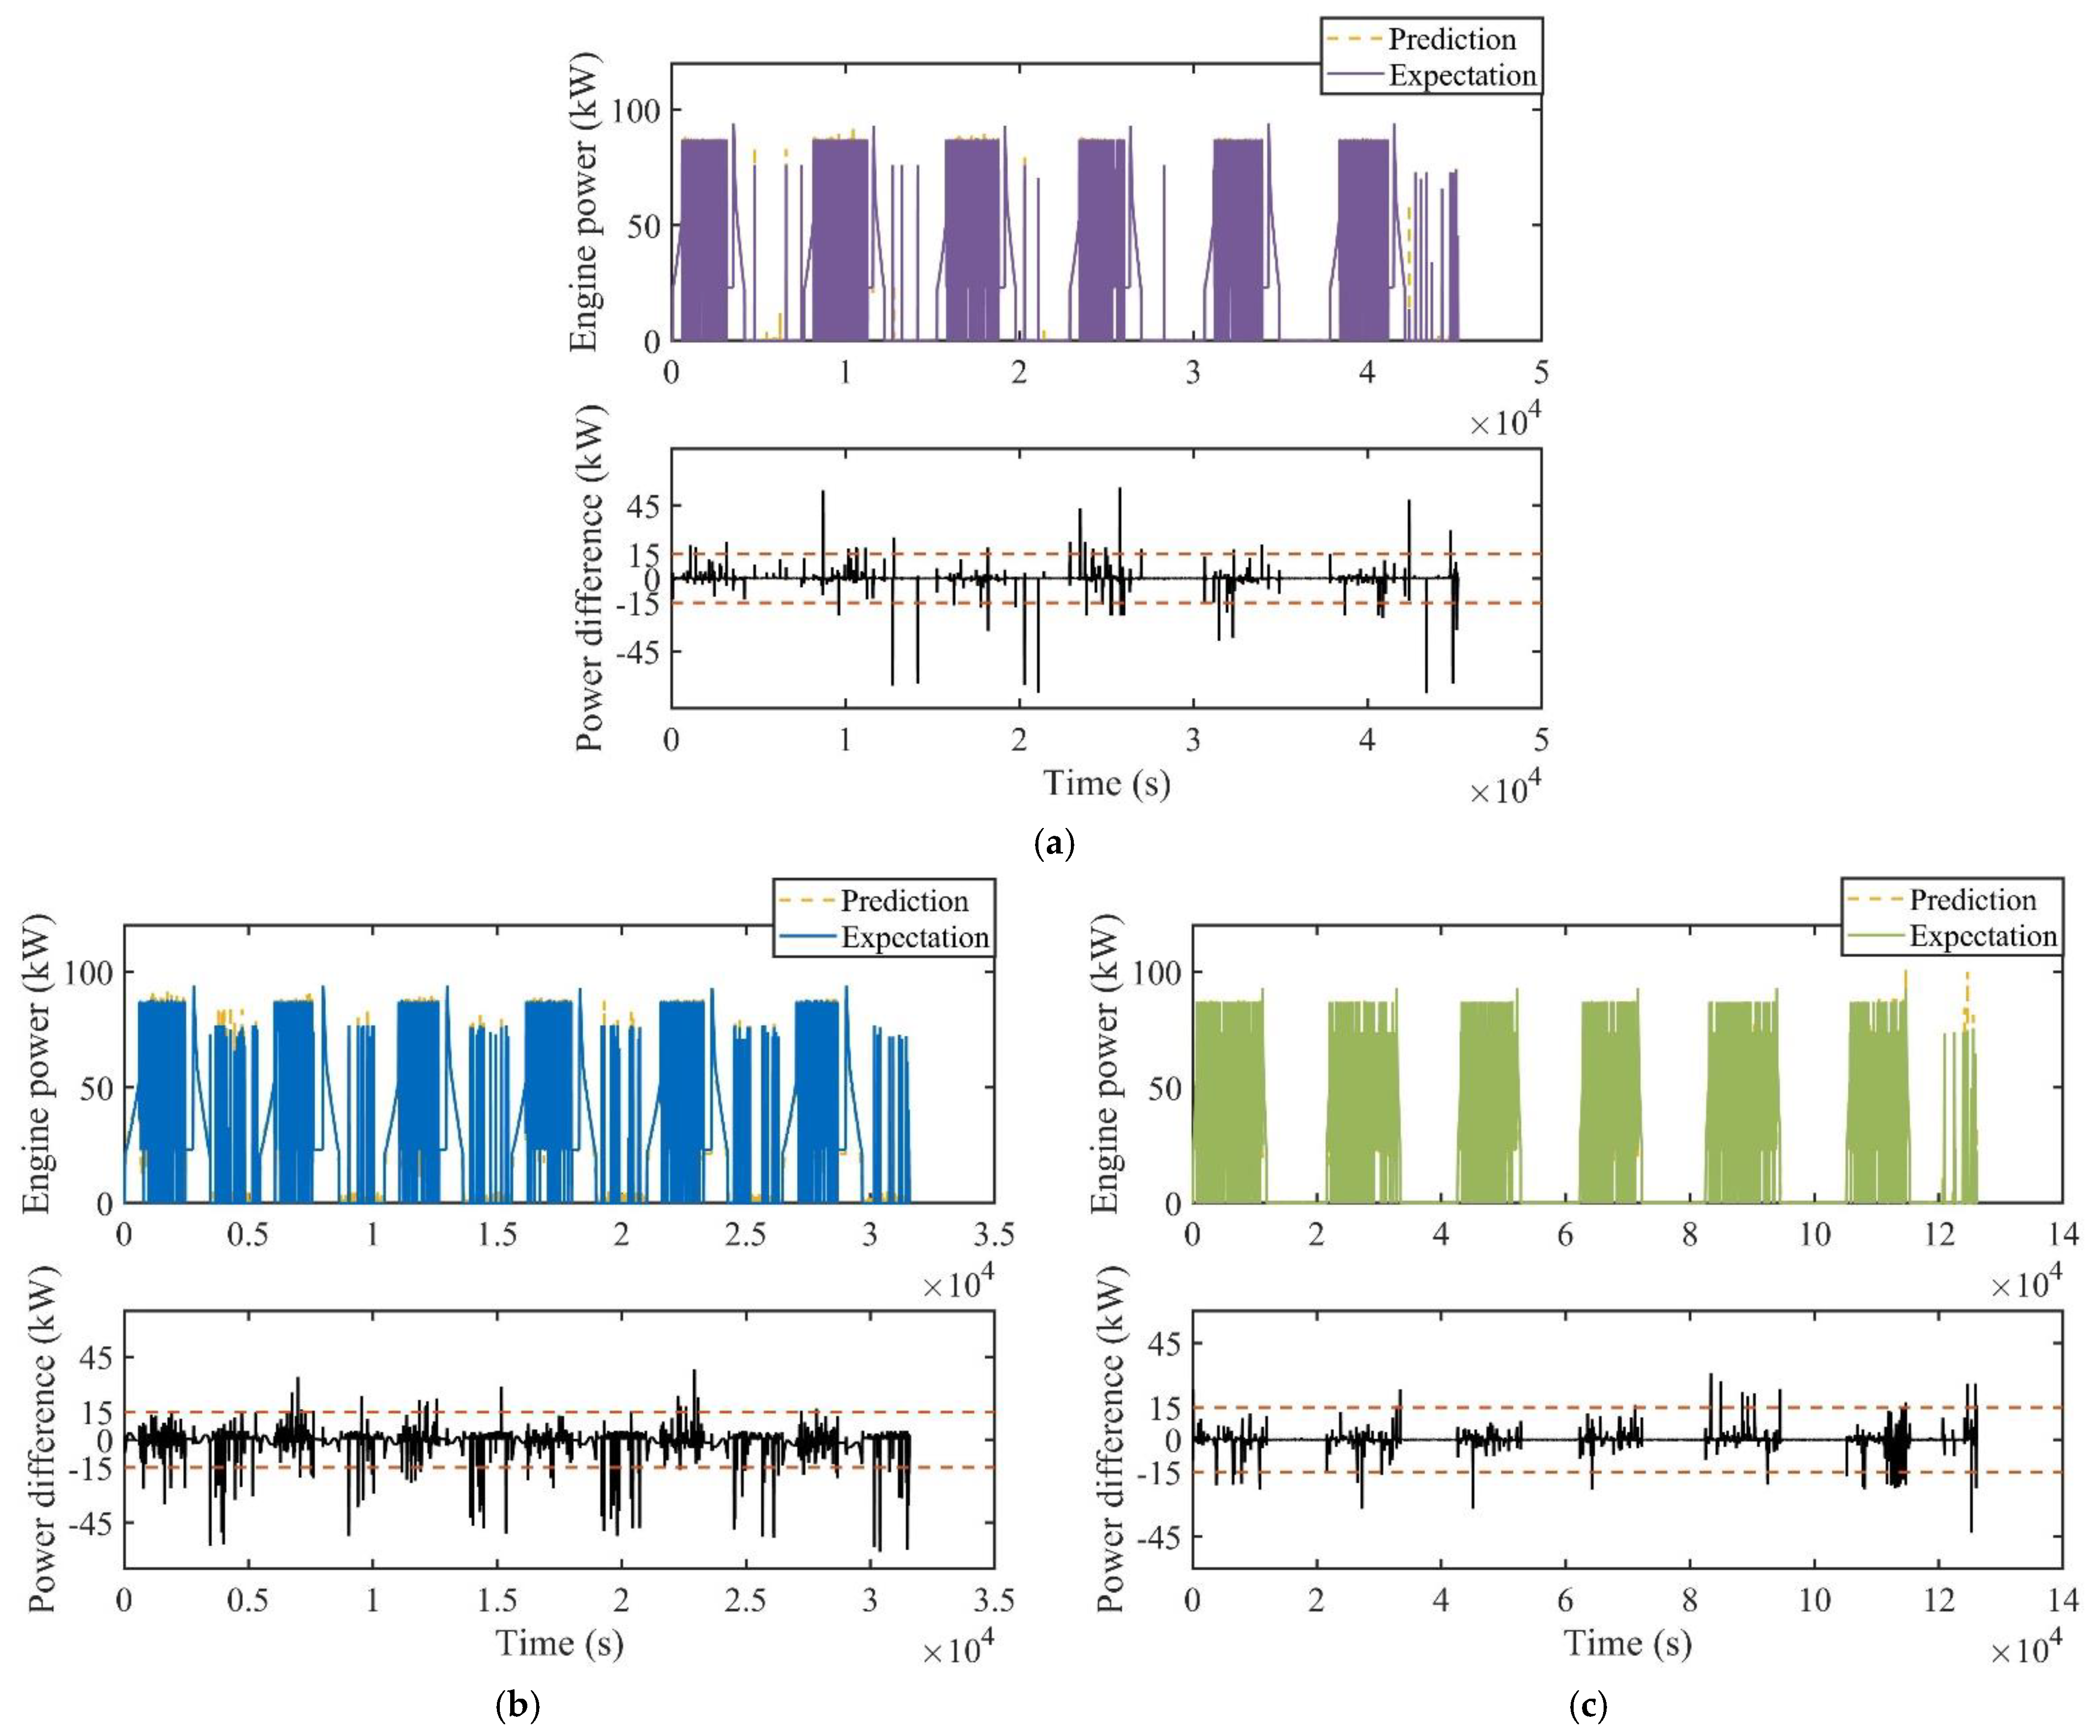
4.2.2. Neural Network Training and Verification

The training data of NN modules under different types are generated by data preprocessing. As the main evaluation index of the neural network training effect, the smaller the mean square errors (MSEs), the better the learning effect [38]. It can be calculated as:
  M S E = 1 N k = 1 N ( P i c e o u t ( k ) P i c e t a r ( k ) ) 2
where P i c e o u t is the NN module output, and P i c e t a r means the target output value. The MSE is 0.00032, 0.0020 and 0.00021, respectively, as presented in Table 4. From Figure 8a–c, the engine output power difference is concentrated within plus or minus 15 kW, which indicates that the engine output power generated by the NN modules are very close to that DP results under the three types and the neural network designed above is reasonable and feasible.
Therefore, the intelligent optimization algorithm based on the ML of trip information and energy management is an appropriate way to solve the online energy management problem of E-RE-CTMs. In the online application, it can automatically switch to the optimal NN modules under current micro-trips shown in Figure 3h according to recognition results.

5. Conclusions

In this paper, an ML-based approximate optimal energy management strategy for concrete truck mixers equipped with a novel hybrid powertrain was designed from two aspects: trip information and energy management strategy, which mainly included the following:
  • For the CTMs equipped with a proposed novel hybrid powertrain, a global optimization algorithm based on DP was proposed to solve the two-point boundary value problem in the finite time domain, which has the characteristics of constrained time-varying and double control variables. By designing an optimal efficiency curve of the generator in driving mode and establish the generator efficiency model, the complexity of solving the energy optimization problem can be reduced;
  • An optimal control database can be obtained based on the ML and data-driven method; different ML-based driving condition identifiers were constructed and compared. Simulation results showed that the total performance of ELM is superior to the RF and LVQ through the comparison of kappa coefficient, identification time, and identification accuracy. An optimized ELM identifier based on genetic algorithm was presented, which can further promote online identification performance;
  • For the E-RE-CTM, a vehicle mass and power demand of an upper-part system based novel neural network energy management strategy was designed based on a constructed optimal control database. Simulation results showed that the designed neural network is reasonable and feasible.
Our future work could potentially focus on the neural network input variables recognition or prediction based on the study of this study to developing an online energy optimization algorithm with stronger adaptability to more driving information.

Author Contributions

Conceptualization, Y.H., F.J. and H.X.; data curation, Y.H. and H.X.; formal analysis, Y.H.; investigation, H.X.; methodology, Y.H.; resources, Y.H.; software, Y.H. and H.X.; validation, Y.H., F.J. and H.X.; writing—original draft, Y.H.; writing—review and editing, F.J. All authors have read and agreed to the published version of the manuscript.

Funding

This research was funded by the Fengzhi Technology Co., Ltd. of Beijing, China.

Data Availability Statement

The datasets used and/or analyzed during the current study are available from the corresponding author on reasonable request.

Acknowledgments

The authors would like to thank the Fengzhi Technology Co., Ltd. of Beijing, China for the support during the research process.

Conflicts of Interest

Haiming Xie is an employee of Fengzhi Technology Co., Ltd. The paper reflects the views of the scientists, and not the company. This paper received support of the Fengzhi Technology Co., Ltd.

References

  1. Feng, Y.; Dong, Z. Optimal energy management with balanced fuel economy and battery life for large hybrid electric mining truck. J. Power Sources 2020, 454, 227948. [Google Scholar] [CrossRef]
  2. Kosowski, M.; Dunckley, J.; Bowermaster, D. Results of plug-in hybrid medium-duty truck demonstration and evaluation program. World Electr. Veh. J. 2016, 8, 57–68. [Google Scholar] [CrossRef] [Green Version]
  3. Zhuang, W.; Eben, S.L.; Zhang, X.; Kum, D.; Song, Z.; Yin, G.; Ju, F. A survey of powertrain configuration studies on hybrid electric vehicles. Appl. Energy 2020, 262, 114553. [Google Scholar] [CrossRef]
  4. Zhao, J.; Liu, X.; Xin, Z.; Han, Y. Research on the energy-saving technology of concrete mixer truck. In Proceedings of the 2009 4th IEEE Conference on Industrial Electronics and Applications, Xi’an, China, 25–27 May 2009. [Google Scholar]
  5. Gadner, S.; Pifko, A.; Brehmer, U.; Stockbauer-Muhr, D. Electric Truck Mixer for the Future Urban Construction Site. ATZheavy Duty Worldw. 2019, 12, 14–21. [Google Scholar] [CrossRef]
  6. Peng, J.; He, H.; Xiong, R. Rule based energy management strategy for a series–Parallel plug-in hybrid electric bus optimized by dynamic programming. Appl. Energy 2017, 185, 1633–1643. [Google Scholar] [CrossRef]
  7. Yu, Y.; Jiang, J.; Min, Z.; Wang, P.; Shen, W. Research on energy management strategies of extended-range electric vehicles based on driving characteristics. World Electr. Veh. J. 2020, 11, 54. [Google Scholar] [CrossRef]
  8. Xie, H. Energy Management Strategy for Extended-Range Electric City Buses Based on Driving Condition Adaptation. Ph.D. Thesis, Tsinghua University, Beijing, China, 2017. [Google Scholar]
  9. Zhang, F.; Hu, X.; Xu, K.; Tang, X.; Cui, Y. Current Status and Prospects for Model Predictive Energy Management in Hybrid Electric Vehicles. J. Mech. Eng. 2019, 55, 86–108. [Google Scholar] [CrossRef] [Green Version]
  10. Liu, T.; Tang, X.; Wang, H.; Yu, H.; Hu, X. Adaptive Hierarchical energy management design for a plug-in hybrid electric vehicle. IEEE Trans. Veh. Technol. 2019, 68, 11513–11522. [Google Scholar] [CrossRef]
  11. Tian, Y.; Liu, J.; Yao, Q.; Liu, K. Optimal control strategy for parallel plug-in hybrid electric vehicles based on dynamic pro-gramming. World Electr. Veh. J. 2021, 12, 85. [Google Scholar] [CrossRef]
  12. Murphey, Y.L.; Park, J.; Kiliaris, L.; Kuang, M.L.; Masrur, M.A.; Phillips, A.M.; Wang, Q. Intelligent hybrid vehicle power con-trol—Part II: Online intelligent energy management. IEEE Trans. Veh. Technol. 2013, 62, 69–79. [Google Scholar] [CrossRef]
  13. Tian, H.; Li, S.E.; Wang, X.; Huang, Y.; Tian, G. Data-driven hierarchical control for online energy management of plug-in hybrid electric city bus. Energy 2018, 142, 55–67. [Google Scholar] [CrossRef]
  14. Zhang, J.; Chu, L.; Wang, X.; Guo, C.; Fu, Z.; Zhao, D. Optimal energy management strategy for plug-in hybrid electric vehicles based on a combined clustering analysis. Appl. Math. Model. 2021, 94, 49–67. [Google Scholar] [CrossRef]
  15. Tsinghua, H.S. Self-Learning Online Energy Management Strategy for Plug-in Hybrid Electric Bus. Ph.D. Thesis, Tsinghua University, Beijing, China, 2018. [Google Scholar]
  16. Chen, Z.; Mi, C.; Xu, J.; Gong, X.; You, C. Energy Management for a Power-Split Plug-in Hybrid Electric Vehicle Based on Dynamic Programming and Neural Networks. IEEE Trans. Veh. Technol. 2014, 63, 1567–1580. [Google Scholar] [CrossRef]
  17. Xie, S.; Hu, X.; Qi, S.; Lang, K.; Tian, G. An artificial neural network-enhanced energy management strategy for plug-in hybrid electric vehicles. Energy 2018, 163, 837–848. [Google Scholar] [CrossRef] [Green Version]
  18. Tian, H.; Lu, Z.; Wang, X.; Zhang, X.; Huang, Y.; Tian, G. A length ratio based neural network energy management strategy for online control of plug-in hybrid electric city bus. Appl. Energy 2016, 177, 71–80. [Google Scholar] [CrossRef]
  19. Hu, J.; Liu, D.; Du, C.; Yan, F.; Lv, C. Intelligent energy management strategy of hybrid energy storage system for electric vehicle based on driving pattern recognition. Energy 2020, 198, 117298. [Google Scholar] [CrossRef]
  20. Zhang, J.; Xu, F.; Zhang, Y.; Shen, T. ELM-based driver torque demand prediction and real-time optimal energy management strategy for HEVs. Neural Comput. Appl. 2020, 32, 14411–14429. [Google Scholar] [CrossRef]
  21. Song, K.; Li, F.; Hu, X.; He, L.; Niu, W.; Lu, S.; Zhang, T. Multi-mode energy management strategy for fuel cell electric vehicles based on driving pattern identification using learning vector quantization neural network algorithm. J. Power Sources 2018, 389, 230–239. [Google Scholar] [CrossRef]
  22. Liu, T.; Tan, W.; Tang, X.; Zhang, J.; Xing, Y.; Cao, D. Driving conditions-driven energy management strategies for hybrid electric vehicles: A review. Renew. Sustain. Energy Rev. 2021, 151, 111521. [Google Scholar] [CrossRef]
  23. Huang, Y.; Jiang, F.; Xie, H. Adaptive hierarchical energy management design for a novel hybrid powertrain of concrete truck mixers. J. Power Sources 2021, 509, 230325. [Google Scholar] [CrossRef]
  24. Simona, O. Hybrid Electric Vehicles Energy Management Strategies; Springer: Berlin/Heidelberg, Germany, 2015. [Google Scholar]
  25. Liu, J.; Chen, Y.; Zhan, J.; Shang, F. Heuristic dynamic programming based online energy management strategy for plug-in hybrid electric vehicles. IEEE Trans. Veh. Technol. 2019, 68, 4479–4493. [Google Scholar] [CrossRef]
  26. Wang, X.; He, H.; Sun, F.; Zhang, J. Application study on the dynamic programming algorithm for energy management of plug-in hybrid electric vehicles. Energies 2015, 8, 3225–3244. [Google Scholar] [CrossRef] [Green Version]
  27. Xie, H.; Tian, G.; Chen, H.; Wang, J.; Huang, Y. A distribution density-based methodology for driving data cluster analysis: A case study for an extended-range electric city bus. Pattern Recognit. 2018, 73, 131–143. [Google Scholar] [CrossRef]
  28. Arthur, D.; Vassilvitskii, S. k-means++: The advantages of careful seeding. In Proceedings of the Eighteenth Annual ACM-SIAM Symposium on Discrete Algorithms SODA ’07, Society for Industrial and Applied Mathematics, Philadelphia, PA, USA, 7–9 January 2007; pp. 1027–1035. [Google Scholar]
  29. Zahra, S.; Ghazanfar, M.A.; Khalid, A.; Azam, M.A.; Naeem, U.; Prugel-Bennett, A. Novel centroid selection approaches for KMeans-clustering based recommender systems. Inf. Sci. 2015, 320, 156–189. [Google Scholar] [CrossRef]
  30. Pham, D.T.; Otri, S.; Ghanbarzadeh, A.; Koc, E. Application of the Bees Algorithm to the training of learning vector quanti-sation networks for control chart pattern recognition. In Proceedings of the International Conference on Information & Communication Technologies, Damascus, Syria, 24–28 April 2006. [Google Scholar]
  31. He, H.; Sun, C.; Zhang, X. A Method for Identification of Driving Patterns in Hybrid Electric Vehicles Based on a LVQ Neural Network. Energies 2012, 5, 3363–3380. [Google Scholar] [CrossRef]
  32. Breiman, L. Random Forests. Mach. Learn. 2001, 45, 5–32. [Google Scholar] [CrossRef] [Green Version]
  33. Lahouar, A.; Ben Hadj Slama, J. Hour-ahead wind power forecast based on random forests. Renew. Energy 2017, 109, 529–541. [Google Scholar] [CrossRef]
  34. Pritiesh, M.; Neagu, D.; Paul, R.T.; Jonathan, D.V. Using random forest and decision tree models for a new vehicle prediction approach in computational toxicology. Soft Comput. 2016, 20, 2967–2979. [Google Scholar]
  35. Huang, G.-B.; Zhu, Q.-Y.; Siew, C.-K. Extreme learning machine: Theory and applications. Neurocomputing 2006, 70, 489–501. [Google Scholar] [CrossRef]
  36. Cohen, J. A Coefficient of Agreement for Nominal Scales. Educ. Psychol. Meas. 1960, 20, 37–46. [Google Scholar] [CrossRef]
  37. Landis, J.R.; Koch, G.G. The Measurement of Observer Agreement for Categorical Data. Biometrics 1977, 33, 159–174. [Google Scholar] [CrossRef] [Green Version]
  38. Murphey, Y.L.; Park, J.; Chen, Z.; Kuang, M.L.; Masrur, M.A.; Phillips, A.M. Intelligent Hybrid Vehicle Power Control—Part I: Machine Learning of Optimal Vehicle Power. IEEE Trans. Veh. Technol. 2012, 61, 3519–3530. [Google Scholar] [CrossRef]
Figure 1. Powertrain configuration of a CTM.
Wevj 12 00175 g001
Figure 2. The flow chart of global energy management strategy for an E-RE-CTM. (a) Five route segments of a CTM; (b) driving data of a CTM; (c) optimal efficiency curve of the generator in driving mode; (d) the schematic diagram of DP process.
Wevj 12 00175 g002
Figure 3. The ML-based structure for an E-RE-CTM. (a) Description of micro-trips; (b) description of clustering results; (c) the three types of typical driving condition; (d) description of LVQ neural network; (e) the calculation process of RF; (f) the structure of ELM neural network; (g) the description of the neural network modules; (h) the occurring micro-trips in the real world.
Wevj 12 00175 g003
Figure 4. Driving data obtain and analysis. (a) The variance contribution rate of principal components; (b) features load coefficients in the principal components; (c) silhouette values based on the k-means + + algorithm; (d) some micro-trips of three types; (e) classification results of a standard driving cycle.
Wevj 12 00175 g004
Figure 5. The optimal efficiency curve and optimal control results. (a) Optimal control results under type 1; (b) optimal control results under type 2; (c) optimal control results under type 3.
Wevj 12 00175 g005
Figure 6. The constructed combination driving cycle and real types.
Wevj 12 00175 g006
Figure 7. The flow chart of optimized ELM.
Wevj 12 00175 g007
Figure 8. Training results of designed NN modules under different types. (a) NN module training results under type 1; (b) NN module training results under type 2; (c) NN module training results under type 3.
Wevj 12 00175 g008
Table 1. The parameters of the main components for the powertrain [23].
ItemValue
E-RE-CTM non-load mass (kg)15,000
E-RE-CTM full-load mass (kg)40,500
Li-ion battery pack capacity (Ah)300
Driving motor maximum power (kW)350
Hydraulic pump maximum displacement (cm3/r)90
Hydraulic pump/motor maximum pressure (bar)420
Generator maximum power (kW)130
Engine maximum power (kW)125
Table 2. The feature parameters for driving condition recognition.
SymbolDescriptionUnit
v m a x Maximum vehicle speedkm/h
a m a x n Maximum negative accelerationm/s2
σ ( a p · v ) The standard deviation of the product of positive acceleration and speedm2/s3
( a n · v ) ¯ Mean value of the product of negative acceleration and speedm2/s3
r v 0 , 15 The ratio between 0 and 15 of vehicle speed-
r v 30 , 50 The ratio between 30 and 50 of vehicle speed-
Table 3. The performance comparison under different methods.
Evaluation Index [ W t , I t ] = [ 120 ,   1 ]   1 [ W t , I t ] = [ 80 ,   1 ]   2
LVQRFELMOptimized ELMLVQRFELM
κ0.520.590.630.650.610.530.56
A m 0.730.760.780.790.780.710.73
t a 15.3011.940.520.4517.9112.320.47
1 The optimal window size and identification interval of RF and ELM; 2 the optimal window size and identification interval of LVQ.
Table 4. Description of MSEs under three types.
TypeMSE
10.00032
20.0020
30.00021
Publisher’s Note: MDPI stays neutral with regard to jurisdictional claims in published maps and institutional affiliations.

