Article

Electric Vehicle Uptake: Understanding the Print Media’s Role in Changing Attitudes and Perceptions

by
Gail Helen Broadbent
1,*,
Thomas Oliver Wiedmann
2 and
Graciela Isabel Metternicht
1
1
Earth and Sustainability Science Research Centre, UNSW, Sydney, NSW 2052, Australia
2
Sustainability Assessment Program, School of Civil and Environmental Engineering, UNSW, Sydney, NSW 2052, Australia
*
Author to whom correspondence should be addressed.
World Electr. Veh. J. 2021, 12(4), 174; https://doi.org/10.3390/wevj12040174
Submission received: 13 August 2021 / Revised: 21 September 2021 / Accepted: 22 September 2021 / Published: 30 September 2021

Abstract

:
Passenger motor vehicle transport is a significant and growing emissions source contributing to climate change. Switching from internal combustion engines to electric vehicles (EV) would significantly reduce most countries’ emissions, but for many consumers perceived barriers deter EV adoption. Consequently, government policies designed to incentivise a transition to EVs could benefit from consideration of the utility of communication channels such as print media for influencing consumer behaviour. This research explores the role that media and other communication channels writing about EVs play in consumer perceptions and awareness of government-initiated programs and policies to incentivise EV market transition. Using mixed methods of a media review and New Zealand car buyer surveys (questionnaires, interviews) (n = 893), we identified car buyers’ media use to update knowledge about cars, perceptions about EVs, and likelihood to buy, and tested awareness and popularity of incentives. We derive recommendations for policy improvements to accelerate EV uptake, including a significant role for the print media to disseminate relevant information, increase awareness of policies, and shift perceptions about EVs. We argue that social marketing programs should be enhanced to overcome lack of knowledge and misinformation, focusing on the market segment next most likely to buy EVs.

1. Introduction

Global transport emissions are approximately 23% and growing [1]. To rapidly transition away from fossil-fuelled transport by 2050 requires 97% decarbonisation of the car fleet, assuming a business-as-usual growth in transport activity, and a substantial decrease in electricity emissions [2]. Any Internal Combustion Engine Vehicle (ICEV) sold continues to emit the same level of CO2 per kilometre for its lifetime, whereas electric vehicle (EV) emissions decrease in tandem with electricity supply improvements [3]. Therefore, many governments have aspirational goals to ban future sales of new fossil-fuelled cars [4], with many implementing policies designed to encourage electric vehicle (EV) adoption, with varying degrees of success [5].
To appeal to consumers more widely than EV early adopters, who are prepared to act on climate change, the value proposition for a disruptive innovative technology, which requires behaviour change, needs ongoing improvement using a whole product approach [6]. The value proposition includes that EVs are affordable, and are perceived as such [7], rather than representing an unaffordable wish alien to many buyers’ economic reality. Using a social simulation model, it was found that to effectively transition to EVs, policy measures ought to be enduring and encompass three facets: monetary, structural, and informational [8].
This paper seeks to explore the links between policies, information, and communications to improve the implementation of government policies and awareness of them, leading to increased EV adoption (see Section 3). In free market economies consumers have unrestricted choice on which vehicles they buy in the available pool, and inadequate consumer knowledge about EVs may be a key barrier to adoption, retarding transition to a more sustainable future [9,10]. Insufficient or incorrect information results in information asymmetry that can be considered as market failures, leading to negative externalities affecting the whole society and not just individual consumers [11]. Importantly, the Information Integration Theory [12] was used in experimental work on car buying by Mairesse et al. (2012, p. 549) [13] who indicated ‘thought and action are determined by the joint effect of multiple determinants’ and they proposed that consumers’ car purchase decisions resulted from the averaging of various attributes, which were of differing importance to them. Additionally, Krause et al. (2013, p. 439) [14] found that ‘most consumers are either uninformed or misinformed’ about EVs. Lack of knowledge and misperceptions potentially contribute to a rejection of alternative fuel vehicles [15].
Additional to a lack of accurate knowledge, consumers’ perceptions may be more important than positive vehicle attributes [16]. Furthermore, disrupting the established motor vehicle regime would be difficult, as there is a web of limitations, and recorded successes have been largely underpinned by government support [17]. Therefore, changing consumers’ awareness and perceptions of innovations, such that EVs are included in their car shopping research, enabling informed choices well before they get to a showroom, could be a critical factor in fostering EV uptake.
In this regard, the mass media play a significant role in closing the knowledge gap, but they do not inform all readers equally [18]. For example, by limiting the information that readers receive, the media can construct uncertainty around issues, which may serve to thwart adoption of behaviours and work against a change in attitude [19]. In addition, focusing on stories that are geographically proximate is more likely to engage readers [20]. In short, the media could help establish and usefully promote a positive image for EVs, increase ‘visibility’ and acceptability to targeted communities, and help change attitudes about these vehicles.
However, media outlets do not strictly just report the facts, instead likely inserting bias, whether intentional or unintentional, into their reporting [21,22]. News stories can be framed positively or negatively, influencing readers’ opinions and perceptions of issues [23], and involve complex interactions of human psychological traits, such as loss aversion [24]. For instance, it is known that selective framing can result in climate change denial [25], perhaps by emphasising contrarian voices, as occurs in the UK and US [26]. Further, readers tend to seek out news outlets with culturally congruent world views [27], and such preferences are economically significant [28].
We can draw parallels and links to our current understanding of the media’s role influencing people’s attitudes and perceptions of climate change, and extend that question to EVs, where there is a gap in that understanding. Thus, to complement government policies activating dynamic social processes [29], news outlets may contribute to a social tipping point by facilitating information sharing, affecting consumer behaviour.
Many studies have focused attention on the attitudes and perceptions of car buyers towards EVs, affecting their willingness to buy, e.g., [14,15,16]. However, there is a gap in understanding how different segments of the car market utilise the media and potential links to their car buying preferences.
Hence, the purpose of this paper is to explore the role that the written media and other communication channels play in consumer perceptions about EVs and awareness of government-initiated programs to incentivise market transition. Thus, by acting as sources of reliable up-to-date factual information about available policies and vehicle attributes, the media could help change people’s views, mobilising the market to adopt EVs. In this research, the mass media and print media are taken to include written communications that are produced mechanically or electronically.
To this end, New Zealand (NZ) affords a suitable case for study, as it is a country largely employing renewable electricity, high levels of newspaper readership [30] (Section 3.2.1), high vehicle ownership (Section 2.3), and multiple policies introduced in 2016 to boost EV volumes (Table S1). However, despite rapid adoption of EVs [31] by the innovators and early adopters since that time, EVs have not yet appealed to mainstream consumers and there is potential for the EV market to plateau rather than accelerate. It is posited that the media could be used in social marketing campaigns to ameliorate knowledge gaps among car buyers, especially the next most EV-ready segment, providing further opportunities for access to information.
The paper is structured as follows: Section 2 provides background material about the impact of the media on people’s opinions and the importance of information in aiding consumer choice, including New Zealand’s car market and media consumption (Section 2.3). Section 3 explains the methodology and conceptual framework. Thereafter, Section 4 provides the results, discussed in Section 5. Section 6 provides recommendations for action, and final considerations and conclusions are presented in Section 7. Following the references, the Supplementary Material contains supplementary data, to assist those wishing to have further details.

2. Background

2.1. Opinion-Based versus Fact-Based: The Media’s Role in Shaping Perceptions

Coverage of climate change has been polarised by traditional media [32], thus shaping people’s understanding in different ways [33]. An analysis of climate change reporting noted that rather than presenting a balanced view of the news, reporters moved into an opinion-based interpretative pattern of journalism, thus shaping media debates [26]. Researchers found the US’ partisan media strengthened the views of like-minded audiences about climate change and that Republicans used the media to reject messages about it [34]. Aligning with that view [35] it was further argued that understanding these biases enhances comprehension of how news media use bias as a tool to distribute power. Further, it has been found the news media played a role in influencing peoples’ views on climate change, but only by acting as a conduit for political mobilisation by elites and advocacy groups, whereas accurate scientific knowledge played no role in shaping people’s actions [36].
More positively, it was noted US mass media had a positive influence on hybrid vehicles sales in areas where the media reported climate change, with preliminary evidence suggesting the media can play a role in advocating for climate-friendly action and furthermore affecting consumer purchases [37]. Media bias about EVs has received some coverage [38]; for example, two projects [39,40] both reported there was a positive link between advertising spend and editorial content in newspapers, including those with online platforms, which may be relevant in the promotion of car models reviewed by motoring journalists reporting in the media.

2.2. Information as a Driver of Consumer Choices

Another influence on the development of a positive attitude towards EVs, thereby increasing acceptability, is the role of informational conformity (where people accept the information of others as factual) and social conformity (yielding to group pressure), which are well known phenomena [41]. Both mechanisms were highly significant for EV acceptance [42]. Information helps people change their opinions, and research demonstrated that social delivery strongly impacts its effect [43].
For a market to reach a tipping point requires powerful positive feedback loops [44] with small changes triggering non-linear change potentially facilitating a transition towards all new passenger vehicle sales being EVs rather than ICEVs [29]. Modelling [45] ascertained 5% of the total fleet (installed base) could engender such a transition. However, the percentage could be market dependent and inevitability cannot be guaranteed as government action impacts on each market [46] and, importantly, consumer knowledge of such action is imperative. Evidence of the latter is NZ’s earlier attempts to introduce compressed natural gas vehicles to the fleet, any interventions were not sustained, the market did not reach a tipping point, and eventually numbers fizzled out [47]. Such a result offers a salutary lesson in the value of prolonged government action until the market can take over, as has been demonstrated by Norwegian EV sales successes [5] where government support has been sustained [48], and complemented by comprehensive media coverage, which research has evidenced was a factor in encouraging 84% of Norwegian EV owners to make a decision to buy an EV before reaching a showroom [49].

2.3. New Zealand Car Market and Media Readership

New Zealand has very high rates of car ownership, with a fleet of about four million four-wheeled, light vehicles, making up about 93% of the total fleet, of which over 90% are petrol fuelled and less than 1% plug-in electric [31], serving a population of some five million people (https://www.stats.govt.nz/indicators/population-of-nz; accessed on 9 September 2021). New Zealand does not have a vehicle manufacturing industry and imports all of its vehicles, many of them second-hand from other right-hand-drive markets such as the UK and Japan [31]. Electric vehicles are permitted to be imported new, and used (from UK or Japan), and the government publishes detailed monthly EV statistical data [31].
Many New Zealanders read the media [30] across platforms, however, modern media tend to deliver their news across multiple platforms and many people utilise different platforms across time and people’s consumption of news is complex [50]. The level of engagement of readers with news platforms, in particular the main newspaper mastheads regardless of delivery platform, is not dissimilar to other countries such as Australia [51].

3. Conceptual Framework and Method

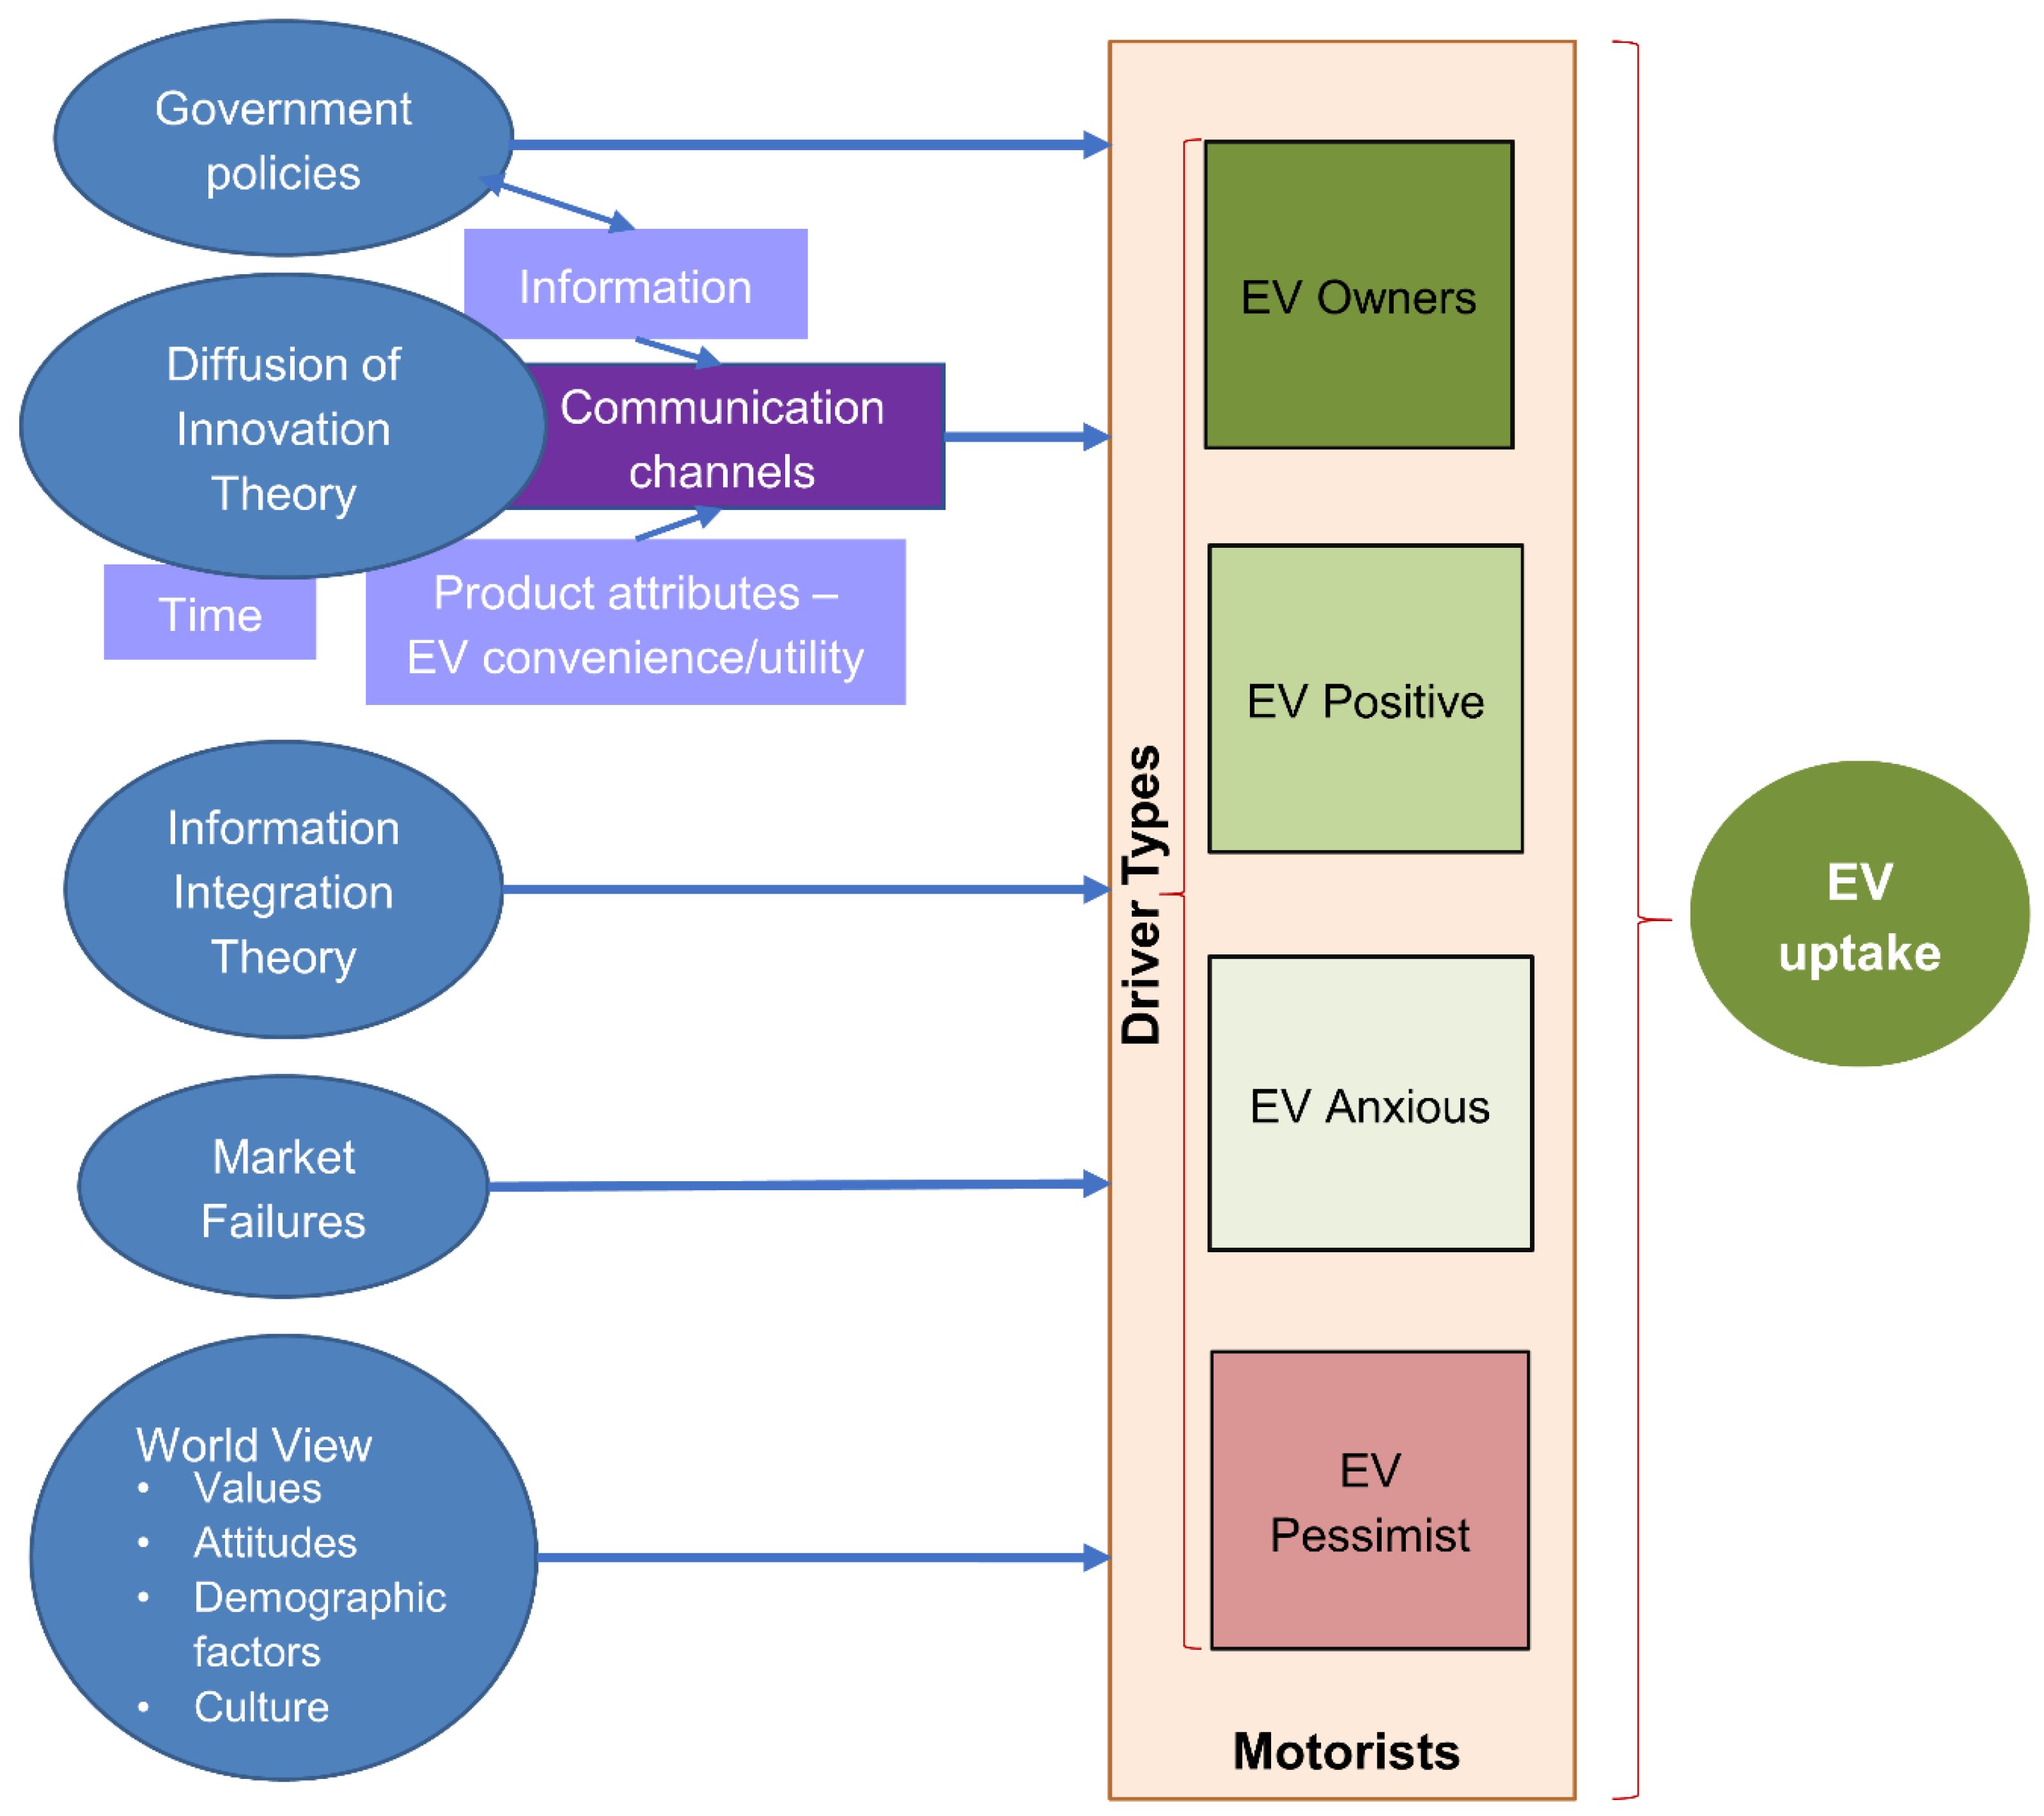
3.1. Conceptual Framework

Not only do governments need to employ policies evidenced to increase EV purchase rates, they also ought to employ methods that could improve policy implementation leading to increased consumer action. Here, we apply systems thinking to better understand the connections between policy, research, and practice, and how policy outcomes could be improved through the application of evidence, including that acquired from car buyers in different stages of acceptance of EVs as an innovative technology. With a focus on the informational/communications aspect we utilise Knowledge to Action thinking [52] including factors important for adoption: characteristics of the innovation, readiness for the innovation, and processes used to foster change.
Shifting car buying behaviour towards favouring ‘environmental’ vehicles, such as EVs, needs greater problem awareness to develop social norms and affect consumers’ attitudes [10], and which are all linked to willingness to buy EVs [53,54,55]. We take these ideas further and contend that to increase success rates, the segment next most likely to buy an EV should be the focus of attention for updating policies regarding communications, in line with social marketing techniques [56]. This is especially important if, over time, incentives to encourage EV purchase are becoming more important, not less [57]. Developing an understanding of factors affecting different consumer segments, including knowledge, values, and attitudes, acquired from disparate sources, such as advertising, the media, implementation of government policy and other people, can make a positive contribution to changing people’s behaviour next time they buy a car.
Hence, the conceptual framework of this research (Figure 1) contends that multiple factors affect consumers’ purchasing decisions about whether to go electric or not. We use Diffusion of Innovation Theory [58] (Table S2), Information Integration Theory [12], differences in government policies [59], market failures [60], and the importance of a consumer’s world view [61] to help explain influences that potentially change individual’s behaviours and the choices they make.

3.2. Methodological Approach

To gain a deeper understanding of the role of the media in the perceptions and attitudes of car buyers towards EVs, New Zealand (NZ) was used as a case study (Section 1). The research employed mixed methods to measure the same variables in different ways, triangulating results to increase trustworthiness and credibility [62].
Firstly, a desktop survey of New Zealand’s leading print media (across platforms) that publish articles on cars was undertaken to investigate how EVs were presented 2011–2019 (Section 3.2.1). The written media were selected for investigation as it forms part of most people’s media consumption and is an important source that is perceived as relatively reliable [50]. Secondly, a survey of car buyers (Section 3.2.2) was conducted in two parts to gather quantitative and qualitative data: firstly, by questionnaire, and secondly through interviews, to gain deeper and more nuanced views and to help reduce error and bias [21]. The interviews also provided evidence of questionnaire response stability [63].

3.2.1. Identification, Collation, and Analysis of New Zealand’s Print Media Treatment of EVs: Newspapers and Car Magazines

New Zealand’s population of about 5 million people supports many newspapers delivered across print and online platforms, which have a wide readership, and ‘77.6%, of New Zealanders aged 14+ now read or access newspapers in an average 7-day period via print or online (website or app) platforms’ [30]. An analysis was undertaken of NZ’s top ten written sources (by readership) that publish articles about cars. The online title TradeMe (https://www.trademe.co.nz/a/motors/cars accessed on 9 September 2021), although popular, was excluded from the search as it largely functions as classified advertising for cars on sale, with minimal news items about cars, although it does publish some reviews. The Factiva database was searched from 1 January 2011 to 31 December 2019 for stories about “electric vehicle*”, “Tesla”, “Elon Musk”, and “Dieselgate”, with those not relevant to EVs eliminated from analysis. The online title Driven NZ published thousands of articles about EVs in that period, therefore 501 stories were analysed. Each article was read in full noting: date, author (or source), title, topic, subjects, and framing, by observing the tone of words used to describe EVs. Percentages of positive, neutral, and negative framed articles were calculated for each masthead.

3.2.2. Survey of Car Buyers

We compared car consumers in two samples, EV owners, and ICEV buyers by conducting two online questionnaires, followed by interviews with some respondents randomly selected from a panel of volunteers from each group.

Sampling Frame and Survey Data Collection

The units of analysis were New Zealand car drivers, aged 18 or over, who intended to buy a car at some future time, and thus were potential consumers of EV technology. Two online questionnaires, each with the same questions, were implemented in March–April 2020 to compare car drivers who own EVs with car drivers of ICEVs who could potentially buy an EV in the future. In the requests for participation, anonymity was guaranteed and it was explained that participation gave tacit approval for retaining and using their data.
To sample consumers who drive ICEVs, the polling company YouGov was engaged as its methodology, used in extensive election polling, has been relatively accurate [64]. YouGov randomly sampled ICEV consumers (n = 588) from its large national panel with quotas for gender, region, and age, and those not intending to buy a car in the future were exited from the survey. Prior to the main study a pilot study (n = 61) tested question validity and enabled adjustment of question order. Interviews (n = 31) were conducted with participants randomly selected from the half of all ICEV participants (n = 588) who volunteered contact details.
To sample EV owners a separate questionnaire, delivered via the online platform Qualtrics, was conducted (n = 305) using the same questions as the YouGov survey. To obtain a sufficiently large sample of EV owners, requests for participation were posted on the EV Owners Facebook page and the Better NZ Trust webpage. Although volunteers, many of these people could be considered to be strongly opinionated because fewer than 2% of New Zealand motorists own EVs [31] and therefore, as Innovators and Early Adopters [58] most could be considered to be EV enthusiasts; thus, these participants were likely to represent the majority view for current EV owners. More than half the sample (n = 305) voluntarily provided contact details, from whom interviewees (n = 31) were randomly selected.

Questionnaires

Four main themes were investigated: demographics; purchasing practices and vehicle ownership; communication channels and knowledge acquisition; and EV and environmental perceptions, attitudes, and values. Table 1 lists the questions presented to participants relevant to this study. Most questions were closed response and were either Likert Scaled (1–5) or multiple choice with randomized row order to eliminate positional advantage; “Don’t know” and “Other” were fixed at the end. Two questions were short open response.

Interviews

Semi-structured interviews were conducted between May–June 2020 by Zoom or telephone during New Zealand’s first lockdown period of the COVID19 pandemic. Interviewees were specifically asked to describe their usual pre-lockdown behaviours. Questions focused on questionnaire themes. Interviews, with permission, were recorded and transcribed using the online platform Otter.

Market Segmentation

To segment the market by attitude for the first analysis, participants of the two online questionnaires were asked to choose a statement (see Table 1—A16) most closely reflecting their attitude to EVs. Table S4a,b show these statements, derived from [65]. From the first questionnaire presented to ICEV consumers (n = 588), those choosing: Statements 1 and 2 were allocated to the EV Positives (n = 154), Statements 3 and 4 to the EV Anxious (n = 201), while Statements 6 and 7 were named EV Pessimists (n = 89). Participants of the second questionnaire were EV Owners (n = 305), who mainly selected Statement 1, and were compared to the other three segments. Segment labels encapsulate Driver Type attitudes to EVs (Figure 1).

3.2.3. Statistical Data Analysis

Responses to the questionnaires were analysed in two ways. Firstly, the questionnaires segmented car buyers according to their attitudes to EVs (Section 3.2.2 Market Segmentation), assigning participants to one of four segments hereafter referred to as ‘Driver Type’, although some respondents did not fit and were excluded from this analysis. Secondly, further analysis of all car buyers sampled by the two questionnaires (n = 893) was carried out according to their likelihood to purchase a BEV (Table 1—A15-1).

Tests of Association by Driver Type

The metric of Driver Type was used to carry out tests of association and results of different questions of interest for each driver. For categorical questions, Pearson’s chi-squared test [66] was used as a test of association between two categorical variables. For Likert-scale questions, an analysis of variance was used to test if there is a difference in the mean Likert scores among the four Driver Types.
To evaluate their perceptions of EVs, participants were asked to ‘Write down three words (or short phrases) that pop into your head that you would use to describe EVs’. As many words/phrases are synonyms for one meaning, responses to open short-answer questions used latent content analysis as it was more appropriate than manifest content analysis [67]. Data analysis was conducted for the number of participants using synonyms of words or short phrases with certain meanings of interest to describe EVs. Additionally, respondents who used at least one negative word were tallied. Participants’ use of these synonyms, or at least one negative word, was then compared to Driver Type using Pearson’s chi-squared tests.
ICEV consumers were asked to complete this statement: ‘I would be more likely to buy an EV if…..’ (Question A24), to facilitate an understanding of their perceptions of barriers to EV adoption, or potential incentives. Similarly, EV Owners were asked to complete this statement: ‘The main reason I bought a plug-in electric car is…’. Open text responses were analysed and coded for specific themes [67] using an iterative process, thus applying an inductive approach to search for meaning. Responses were read to generate initial codes then reviewed, re-categorised if required, and after several passes, frequencies for each of the final themes were recorded.
All p-values were adjusted to account for multiple hypothesis testing using a ‘Holm’ adjustment [68]. If there was evidence of an association between a question and Driver Type after adjusting for multiple comparisons, this relationship was examined through Mosaic plots, frequency histograms, or boxplots. All analysis and plotting used ‘R v4.0.2′. In Mosaic plots, column width signifies sample size of that Driver Type, while the height of individual “tiles” within the mosaic represents the proportion of each option.

Likelihood to Buy Ratio Tests

For the second analysis, a test was conducted to take into account that consumer decisions are likely to integrate information they have relating to multiple attributes for the vehicle they are considering for purchase and their personal circumstances (see Section 1 and Figure 1 Conceptual Framework). Thus, information consumers have gleaned from multiple sources would likely contribute to that decision, which we have encapsulated by asking respondents about their likelihood to buy an EV.
In this likelihood to buy ratio test all participants (n = 893), regardless of attitude to EVs, were categorized into five groups; ‘not likely, ‘less likely, ‘neutral’, ‘likely’, and ‘very likely’, based upon their likelihood to buy battery electric vehicles (BEV) and their response to question 15-1; this metric will be referred to as ‘likelihood to purchase BEV’. Subsequently, ordinal logistic regression models were used to test the effect of participants’ information sources on their likelihood to purchase a BEV. This method appropriately models the ordinal scale of the ‘likelihood to buy a BEV’ question and was undertaken using the CLM function from the ordinal package in R (R-Package version 28) [69].
Separate models were fit for each further question of interest with appropriate filtering applied, and likelihood ratio tests were used to test the strength of association between the variables. All p-values were adjusted to account for multiple hypothesis testing using a Holm adjustment [68]. Evidence of association between a question and the likelihood to purchase a BEV after adjusting for multiple comparisons were further investigated using Mosaic plots or boxplots. All analysis and plotting were done in ‘R v 4.0.2′.

3.3. Limitations

Fewer than 1% of New Zealand cars are EVs [31], and hence there are relatively few EV owners compared to ICEV owners/drivers among the entire population of motorists. Thus, compared to the sampling method employed for the ICEV drivers, the low numbers of EV owners required an alternative method to source panel members for the EV owner questionnaire (as described in Section 3.2.2). However, given that EVs comprise such a small percentage of the fleet, EV owners who responded to the survey were assumed to be representative of EV owners in general, as innovators and early adopters; this assumption aligns with Diffusion of Innovation theory [58] that postulates early adopters are enthusiastic about the technology. Another limitation of this study was that it took place during the early days of the COVID 19 pandemic, which may have affected people’s views of life in general. To overcome this potential limitation, during the interviews respondents were asked to specifically recall behaviours prior to any lockdown and the results tallied well with the questionnaire results.

4. Results

Results of the two parts of the research, the media survey and consumer survey, are presented in Section 4.1 and Section 4.2.

4.1. Media Survey

Table 2 synthesises the results of analysing articles published in New Zealand’s principal written media publishing articles about cars from 2011 to 2019 inclusive.

4.2. Car Buyer Survey

4.2.1. Results of Driver Type Analysis

Participants of the two questionnaires (n = 893) generated responses that were analysed to enable NZ car buyers to be allocated to Driver Type dependent on their attitudes to EVs, based on Question A16 (see Table 1 and Table S4a,b). Some respondents (n = 144) were unable to be allocated to one of the four selected Driver Types and were omitted from further analysis regarding Driver Type comparisons, but they were included in the likelihood to buy ratio tests (Section 4.2.2).
Table 3 displays the results of the statistical data analysis, and it provides evidence of significant differences among Driver Types, with strong evidence of association between Driver Type and most factors (p < 0.05); factors showing no correlations were: whether or not a consumer purchased cars new or used (A3); use of magazines (A14) or newspapers (A14) for research about cars; and household income (P4).
Figure 2 shows that written sources were the most consulted of all Primary Sources for all Driver Types. Of all Driver Types, EV Owners utilized written sources more than other Driver Types, and this was significantly different. Further to that, Figure 3 shows that online sources were more important to EV Owners than other Driver Types for finding out about cars.
Table 4 shows the mean response for each Driver Type for their likelihood to buy a BEV, a PHEV, and to the question on how they perceived media coverage of EVs, using a Likert scale. Table 4 also shows the percentages of each Driver Type who said they had not noticed any stories about EVs in the media.
Asking respondents to select as many Government initiatives they had heard of was used as a measure of awareness, and percentages for each initiative are shown in Table 5 ‘Aware’ column. A box plot (Figure S13) illustrates ‘initiative awareness’ (mean number of initiatives for each Driver Type).
Respondents were also asked for their top three preferred incentives that could encourage or contributed to EV uptake. The ‘Desirable’ column in Table 5 shows the percentage of respondents who selected individual initiatives as one of their three most preferred.

4.2.2. Results of Likelihood to Buy Ratio Tests

Table 6 and Figure 4, Figure 5 and Figure 6 synthesise the results of applying the tests described in Section 3.2.3 Likelihood to Buy Ratio Tests. Figure 4 shows that drivers ‘very likely’ and ‘likely’ to purchase a BEV used written sources more frequently and relied on word of mouth less than those ‘not likely’ to buy a BEV. Figure 5 shows that use of online sources is higher for those ‘likely’ or ‘very likely’ to purchase a BEV. The count of ‘initiative awareness’ was subject to a further test to determine if there was any correlation with likelihood to purchase an EV (p < 0.0001, Table 6—A 22_count) and the results are shown as a box plot (Figure 6).

5. Discussion

5.1. Introduction

More nuanced insights into consumer behaviour than might otherwise be ascertained can be gained by segmenting the market according to car owners’ attitudes to EVs, rather than simply comparing EV owners to drivers of ICEVs. Such insights could better inform policy makers who could take more effective actions to: raise awareness of government initiatives to promote EVs, educate motorists about technology advances, and influence consumer preferences and potentially future purchases of EVs, for example by using written media, including social media.
Firstly, this research tested the concept that car buyers are not homogeneous [57,70], although this was not the primary purpose of the research, and questionnaire results provide strong evidence to suggest there are differences of attitude among car buyers (Table S4a,b). Furthermore, grouping respondents by Driver Type based on attitude correlates with the variability of EV readiness shown among respondents (i.e., likelihood to buy a BEV or PHEV in the future), with significant differences shown among Driver Types (p < 0.0001, Table 3: A15_1, A15_2; Figure S11). Further analysis also shows a correlation between the likelihood of buying a BEV and Driver Type (p < 0.0001, Table 6). EV Owners, as innovators and early adopters, were most likely to buy a BEV in the future (Figure S11), and least likely to buy a PHEV (Figure S12). The likelihood of buying a PHEV was strongest for the EV Anxious, the late majority of mainstream consumers (Figure S12).
Previous research suggests attitudes to EVs are an important determinant of willingness to adopt (Section 3.1). Based on attitudes to EVs, the segmentation of survey respondents into four Driver Types (Section 3.2.2), where commonality of attributes enables mapping against Diffusion of Innovation [58] niches (Table S2): EV Owners correspond with Innovators and Early Adopters; EV Positives with Early Majority; EV Anxious align with the Late Majority; and EV Pessimists with the Laggards.

5.2. Sources of Information

Our results suggest that car buyers, grouped according to attitudes to EVs, source information about cars heterogeneously (p < 0.0001, Table 3—A13; Figure 2). Although written sources were the most widely consulted by all car buyers, EV Owners significantly used them more often than other Driver Types. Further evidence from Figure 4 and Table 6—A13 (p < 0.0001) suggests that increasing use of written sources correlated with increasing likelihood to buy a BEV. Further to that, those ‘least likely’ to buy an EV, while using written sources more than other sources, had the highest ratio of being ‘not interested’ in updating their knowledge about cars (Figure 4).

5.3. Media Portrayal and Influence on Attitudes to EVs

New Zealanders have high levels of newspaper readership, with almost 80% reading a newspaper (across platforms) at least once a week [30]. Our results demonstrate that when updating knowledge about cars there were no significant differences among Driver Types for consultation of newspapers or car magazines (Table 3—A14_Newspapers, A14_ Car Magazines). Additionally, further testing demonstrated a lack of correlation between the likelihood of BEV purchase and use of newspapers or car magazines to update a consumer’s knowledge of cars (p = 1, Table 6, Figures S16 and S17). While it may seem counter intuitive given the importance of written sources in updating knowledge of cars, an analysis of articles about cars may provide clues to a lack of influence of newspapers and car magazines on attitudes to EVs and on likelihood to buy an EV, especially for those who did read articles about cars.
Our analysis of NZ’s mainstream print media (across platforms) publishing articles on cars revealed that all mastheads investigated portrayed EVs in a positive frame more often than not, between 58% and 91% of the time, with very low percentages of negative articles (Table 2). All Driver Types perceived that EVs were treated in a positive manner by the media (p < 0.0001, Table 3—A18; Table 4), but there were significant differences among Driver Types about the degree of positivity in the media’s coverage of EVs (Figure S14). Further testing suggests significant differences for how likely a respondent is to buy a BEV and how they perceive the media to portray EVs (p < 0.0001, Table 6; Figure S18). Interestingly, those most likely to buy a BEV next time they buy a car had a less rosy view of how the media portrayed EVs (Figure S18).
An explanation for the lack of influence of car magazines and newspaper motoring sections may lie in the content of those articles. Many respondents read articles about EVs and, while they appreciated most articles were positive (Table 4, Figure S18), there may be asymmetric impacts on their perceptions and attitudes (Section 1). Prior research revealed that articles with a human-interest frame, by dramatizing the information, increase perceived risk of an issue, strengthen negative emotions, and highlight potential problems; although learning about the topic is simultaneously improved, it leaves an unbalanced view [71]. Some car reviews analysed in the media survey (Section 3.2.1) were written by motoring journalists and based on practical experience rather than press releases. While many NZ journalists were positive, some potentially heightened negative perceptions of EV attributes, such as battery life issues and high purchase price (e.g., an article in ‘The Press’ (https://www.pressreader.com/new-zealand/the-press/20180512/281990378163003 (accessed on 9 February 2021)). By sowing seeds of doubt, such media articles are likely to impact attitudes more than those that are totally positive in forming perceptions about electric vehicles, as most research indicates negative messaging outweighs positivity [72], including in journalism [73]. In addition, many car buyers appeared to be aware of ‘fluff’ pieces in the media, potentially discounting their content, as expressed by one interviewee (ICEV#21) ‘a lot of the times I think that the journalist writes in a way that’s going to seek approval from his audience. Yes, rather than rather than writing something that’s factual and accurate’.
Our results also suggest limited influence of motoring articles in newspapers and magazines as avenues to promote EVs. An analysis of respondent’s use of online sources, including social media (Figure 5) illustrates that those most likely to buy a BEV next time, used online resources significantly more than those who were least likely to buy a BEV (p < 0.0001, Table 6—A14_online). Therefore, we contend that those developing social marketing campaigns could investigate more fully on how the group next most likely to buy an EV, the EV Positives, use online resources and social media. As Interviewee ICEV#12 explained: ‘I was more looking at [online] forums where people sharing their personal experiences’ [to get information on cars]. Furthermore, newspapers and car magazines could write stories on the existence of online forums, or set up their own online forums to attract readers.
That EV Owners perceived EV media articles less positively than other Driver Types may derive from EV Owners’ greater use of social media (Figure 3) and the types of articles posted there. While they were positive about EVs, they may be more attuned to journalists’ treatment of EVs. The following extracts illustrate the basis of this rationale.
Interviewee EV #2: ‘No, this is normally a very large bias [in the media] and there’s often not enough actual research taking place’. ‘I have friends who are totally confused now’ [by claims in the press about petrol-hybrids being self-charging due to regenerative braking]. ‘My Facebook feed often has stuff on there. The guys in a lot of the Facebook groups, which is where I saw your article [request for participation in survey], they often post up information on there as well’.

5.4. Perceptions of EVs as Expensive

Despite the Positives, Anxious, and Pessimists being more likely to perceive the media portrayed EVs positively, it did not eliminate ‘expensive’ as a significant perception about EVs (Table S9; Figures S2–S4).
Additional results (Table S10: Questions A17 and Table S8a) suggest a major hurdle impeding EV purchase in NZ was the perceived lack of affordability, especially the higher purchase price for new EVs and concerns about battery longevity, which affects total costs. A typical opinion about affordability was from Interviewee ICEV#29: ‘They are starting to take off in the country, but I just can’t justify it yet because they are too expensive.’
This perception could be expected, as in reality new EVs sold in NZ are more expensive than similar model ICEVs and the media frequently reported about luxury imported EVs, such as Jaguar and Tesla [74]. Furthermore, most EV Positives (80.5%) wrote they would be more likely to buy an EV if they were cheaper to buy (Table S8a), providing evidence of their perceptions of expense. As more than half the car buyers bought second-hand cars (Table S3) and ICEV buyers had low awareness of the availability of second-hand EVs (Table 5), which are cost effective options [75], the media could play a wider role in writing more about budget conscious options helping foster a change in ICEV owners’ perceptions.
ICEV drivers had quite different perceptions of EV affordability than EV Owners, who did not perceive EVs as ‘expensive’ as did other Driver Types (Table S9, Figure S1). Such a difference could stem from EV Owners’ practical experience and greater overall level of research about cars (Figure S5) and use of written sources (Figure 2), and they had a significantly different higher primary use of international online sources and social media (Table 3; Figure 2, Figure S8). EV Owners more often bought EVs used rather than new (Table S3), had higher regard for cheaper ongoing Total Ownership Costs than other Driver Types (Table S10—A17_3), and were more aware of the availability of second-hand EVs (Table 5).

5.5. Engagement with the Media and Awareness of Initiatives and Incentives

Analysis of responses related to research and awareness of initiatives and incentives evidence a strong correlation between quantity of research undertaken when buying a car and Driver Types (p < 0.0001, Table 3—A8; Table S5; Figure S10). Most EV Owners (95.7%) stated they did ‘a lot’ of research compared to other groups, and the level of research of different Drivers Types decreased with their inclination to buy an EV (Figure S5); EV Pessimists were the least likely to do ‘a lot’ of research. Moreover, additional analysis strongly suggests that EV readiness (likelihood of buying a BEV next time) was correlated with the proportion choosing the option ‘I rarely if ever, read about cars’ (p < 0.0001, Table 6—A14-14); those who were ‘likely’ or ‘very likely’ to buy a BEV next time chose that option less often (Figure S15). Therefore, with such rates of rarely reading specifically about cars, we contend that material about available incentives and the benefits that EVs could bring individual consumers and society could be better exploited by coverage elsewhere in newspapers, such as lifestyle articles or general news rather than the motoring sections. As evidence of this assertion, interviewee ICEV#3 said ‘I read the news daily online, Stuff and the New Zealand Herald, but I don’t read much about cars unless I am buying. Then I check Google and Facebook cheaper living site; although I don’t get news from Facebook as it is not credible’; whereas interviewee ICEV#4 said [apart from news on the pandemic] ‘the only other thing I really read is financial stuff’.
Very few respondents chose the statement ‘I have not noticed any stories in the media about electric cars’ (with EV Positives 7.1.%; EV Anxious 6%; EV Pessimists 5.6%, and even fewer EV Owners 1.3% as shown in Table 4). Such low proportions suggest most respondents were aware of stories about EVs, even if they rarely made a point to read about cars as a method of updating their knowledge about them. Given that articles on EVs have appeared in all the newspapers and motoring magazines surveyed (Table 2), and that there is high newspaper readership, we argue that inattentional blindness [76] may account for some of those who claim not to have seen any articles.
In contrast to the aforementioned relatively high newspaper readership among New Zealanders, and that most respondents read about cars to varying degrees, our results suggest that ICEV owners were relatively unaware of government incentives listed compared to EV Owners. Significant differences were observed among the Driver Types, and awareness of incentives increased, as their attitude to EVs became more positive (p < 0.0001, Table 3—A22Count; Figure S13). Furthermore, additional analysis provides strong evidence to suggest that there is correlation with likelihood to buy an EV and degree of respondents’ awareness of initiatives (p < 0.0001, Table 6—A22_count, Figure 6).
The proportion of Driver Types admitting they had not heard of any initiatives (Table 5) increased in line with those who chose ‘I would never buy an EV’ (Table 5); most notably 41.6% of EV Pessimists were unaware of any initiatives, and 30.3% of Pessimists said they would never buy an EV. As a further example, that fewer than 35.7% of EV Positives (Table 5) were aware of a nationwide network of rechargers suggests that lack of information by the majority of car buyers about this essential market co-condition is a potential barrier to EV uptake.
In addition, an analysis of those claiming they were ‘unaware of any initiatives’ (p < 0.0001, Table 6; Figure S19) evidences a correlation with the likelihood of BEV purchase; those ‘very likely’ to buy a BEV were least ‘unaware of EV initiatives’. Hence, the media could play a role in increasing the visibility of infrastructure, potentially helping normalise EVs among the community [77].
Understanding which incentives are most popular can provide pointers for more targeted media coverage to overcome lack of knowledge, thus promoting EVs. When asked for three incentives that respondents found most appealing for inspiring an EV purchase, the Clean Car Discount and Fast Charger installation were the most popular, especially for the EV Positives (Table 5). Despite their relatively low awareness of these initiatives (Table 5), as compared to EV Owners, their appeal indicates the incentives could be persuasive, influencing a more positive perception of EVs.
The Clean Car Discount, which was the most popular incentive with the EV Positives (51.3%) (Table 5), had not yet been implemented in NZ at the time of the survey, despite advice that fiscal assistance would aid EV uptake [78]. However, recently announcements about the deployment date for both the Clean Car Discount and Clean Car Standard have been made [79]. Due to the scheme’s popularity, implementation could mobilise EV sales, at no cost to government, as a bonus/malus (feebate) scheme to reduce first time registration costs for low emissions vehicles. Such a scheme rewards positive environmental action and discourages the purchase of ICEVs through higher costs. However, more effort to promote the scheme’s introduction, for example through general local news stories, would be advantageous to increase awareness.
While most Positives and Anxious would consider buying an EV, with only 1.9% and 1.5% respectively claiming they would never buy an EV (Table 5), it seems that EVs need to be sufficiently attractive by providing a positive value proposition, including that they are affordable and that there is adequate recharging infrastructure (Table 5), a necessary co-condition [80] for such mainstream consumers to actually buy an EV. Increasing knowledge of available incentives (e.g., the existence of a fast charger network), and using the media to promote stories every time a new recharger was installed could increase awareness and the likelihood consumers would buy an EV.

5.6. EV Messaging

The most important channels of communication car buyers used for finding out about cars were written sources (Figure 2), and we found that likelihood of buying an EV increased as use of written sources increased (p < 0.0001, Table 6; and Figure 4). Thus, we argue on the importance of presenting readers with up-to-date information before they reach the point of sale, preferably information that is local, in a manner that focuses on their perceptions and attitudes about EVs. To promote EV sales, understanding language that may usefully counter negative perceptions could help. Congruent with social marketing advice (Section 3.1), the focus should be on the next ‘most ready’ segment, in this case the EV Positives. As discussed in Section 5.3 having a more complete understanding of how the EV Positives use written sources could be an area of further investigation to evidence better ways of reaching them to promote EVs. Testing the impact of the treatment by the media of individual vehicle attributes could also be an avenue for future research, although this may be difficult as many media articles cover more than one concept.
Our research found EV Positives agree with EV Owners that EVs are ‘ecofriendly’ and ‘economical’ (Table S9; Figures S1 and S2), however, consideration should be given to how best to modify their perceptions that EVs are ‘expensive’. One unexpected result from the analysis of perceptions about EVs was that one third of EV Owners used ‘fun’ as one of their three descriptors (Table S9, Figure S1). These quotes from EV Owners exemplify their feelings:
EV Owner #1 ‘I do admire the technology. It’s fun having that enormous acceleration, [going] from a standstill if I’m feeling exuberant.’; and EV Owner#25 ‘[my EV is] really fun to drive.’
Presenting more positive stories in the media conveying how much fun EVs are to drive could further spur EV interest. Using EV Owners perception of EVs as ‘fun’ combined with evidence they are ‘economical’, EVs could represent the ‘good life’ [81], including that there is more money to spend on other things rather than petrol. The triangulation of our results shows that the generally positive treatment of EVs by traditional media in NZ, aligns with consumer’s perceptions. Therefore, we argue that newspapers and car magazines could increase awareness of EVs rapidly changing attributes through promoting such concepts in general news stories, rather than advertorial on expensive EVs in the motoring sections. By increasing EV’s appeal, such stories could help change perceptions and attitudes, increasing EV readiness.
To maximise impact, it has been posited that public communication messages should be presented using a gain frame, with a focus on promotion rather than prevention, referencing it as a loss to self rather than loss to the environment [82]. The latter is congruent with EVs portrayal as representing the “good life”, as evidenced from interviewee EV#5 ‘the cost savings associated with it are amazing’, and interviewee, EV#3 ‘probably one of the thrills in my life now is driving past a petrol station’.
Inattentional blindness (Section 5.5) may also apply to people’s awareness of EVs in the community. By way of example, it was apparent that non-EV owners in California saw no or few signs of EVs in their environment in comparison to EV drivers [83]. Most EV models are not especially distinctive in appearance and in NZ are relatively rare [31], and most recharging takes place off-street at home, thus there is potential for further measures to enhance the visibility of EVs to increase social awareness and acceptability. Deployment of street signs for wayfinding recharger locations is one technique that could increase local visibility, as could specific road markings designating recharger parking spaces. Other measures such as allocating special EV numberplates, as used in Norway [84], could also play a role in amplifying signals that increase awareness, helping foster EVs as a social norm. Publicising these measures, if implemented, in the local press could further promote EVs.
As the costs of EVs decline, to correct misinformation and misperceptions it will be essential for current costs and benefits to be disseminated as widely as possible. While Ride and Drive events were not well known or popular as a ‘top three’ incentive among ICEV Driver Types (Table 5), they do create opportunities to increase communications about EVs, in the media and by word of mouth.

6. Policy Recommendations

Our results show that most New Zealanders were positive in their attitudes to EVs, however their perceptions of EVs need to change well before they decide to next buy a car to ensure that EVs are part of their research efforts. Thus, finding alternative communications channels rather than articles in the motoring sections of newspapers could be advantageous. Prior research [20] argues that using local examples in news articles is more engaging than those of less geographically proximate areas. For instances stories about increasing government procurement of EVs, or the Prime Minister driving an EV [85] could have a wider reach and provide symbolism that EVs are an environmentally sound choice [86] further cementing many motorists’ perception that EVs are ‘ecofriendly’ (Table S9). Similarly, local news stories about business purchase decisions could stimulate social and informational conformity (Section 2.2) by indicating that EVs are increasingly acceptable, particularly from a financial perspective, and through the correction of misperceptions act as mechanisms to shift social norms, which, as society’s unwritten rules, are linked to attitudes, beliefs, and self-efficacy [87].
To engender greater policy success in the long-term, incentive structures and policy decisions ought to consider customers’ complex motivations [88]. Multiple policies were found to be more successful than one, and that messaging ought to reflect the preferences of the target market [89]. Introducing additional new policies such as the Clean Car Discount and Clean Car Standard, expanding existing programs such as the national fast recharging infrastructure network, and wider promotion of apps to locate rechargers, which were popular incentives for the EV Positives (Table 5), would act as positive messages for car buyers, increasing self-efficacy, reducing the cost of low-emission motoring, and expanding EV model availability. Such measures would increase opportunities for various communication channels, including the media to diffuse information about EVs. Norway has sustained its program to foster EV sales for decades [90] enabling sustained awareness building. This factor indicates that, with programs in place since 2016, NZ will require more time and more extensive social marketing including communication programs to reach a wider audience.
Based on this evidence, we postulate that EV Owners may have been prepared to accept a less than perfect market and were willing to pay more to enact their pro-environmental values (Table S8b). However, we suggest that mainstream customers are more pragmatic in relation to the purchase price, are concerned about the battery (Table S10: A17–7), and would also expect a complete market before adopting, which would include an adequate nationwide fast charging infrastructure network (Table 5) as an essential co-condition [80], enabling the innovation to be an easy to use [58] positive value proposition [6].
The implementation of policies will need careful consideration, in particular appealing to consumers’ cost consciousness by reducing the price differential between EVs and ICEVs, and not discouraging EV sales, unintentionally advantaging ICEVs, thus setting back the essential task of emissions reductions. Policy updates could be disseminated by the press more usefully in general news stories rather than the motoring sections.
Following from our results, the following recommendations for enhancing EV uptake are made:
  • Increasing dissemination of information about EVs and their lifestyle benefits through targeted and sustained campaigns, including via the media in general news stories. Focus should be on the EV Positives, the early mainstream market, the next most likely segment to buy an EV. Governments and other stakeholders, for example, motoring organisations and manufacturers could work with the media to spread factual news to correct lack of knowledge and misinformation, provide timely updates and helping change perceptions.
  • Reducing the cost differential between EVs and ICEVs. Implementation of the policies Clean Car Discount to reduce upfront EV cost, and the Clean Car Standard, to increase EV importation, and consequently model availability, at no cost to government, could achieve this goal and help counter the perception of ‘expensive’.
  • Increasing funding, by all tiers of government, for expanding deployment of fast-chargers nation-wide, providing signage and special numberplates, and increasing communications about smart phone apps to locate chargers could increase EV visibility in the community helping allay anxiety about running out of charge,
  • Reframing EVs’ image, indicating EVs represent the ‘good life’ by presenting value for money and they are fun, thus providing lifestyle gains for individuals, for example, there is more money to spend otherwise.
  • Increasing procurement of EVs, for example, by government departments and large companies, could increase sales certainty for car dealers, increase communication via the media and employees, and increase volumes of the second-hand EV fleet through short-term turnover.

7. Final Considerations and Conclusions

Combating climate change requires public participation, i.e., taking action rather than just accepting government policy. Encouraging uptake of plug-in electric vehicles (EVs) to reduce emissions and a raft of negative externalities associated with the use of fossil fuels to energise light motor vehicles requires more than the introduction of policy measures, it requires consumers to know about them and the benefits that flow from them, potentially improving people’s perceptions of EVs and their likelihood of buying an EV. The perceptions and attitudes of motorists play an important role in electric vehicle adoption and changes in attitudes and beliefs may be required for some people to take action.
This paper aimed to investigate the role of the media in increasing consumer knowledge about EVs, and its impact on consumers’ awareness of government measures. These measures were deployed to encourage EV purchase and in turn help change perceptions and attitudes about EVs to increase their acceptability, and likelihood a consumer would buy an EV next time they bought a car. Our results showed that New Zealander car buyers can be segmented by their attitudes to EVs, and understanding nuanced differences among consumer groups could assist with improving policies to promote policies to promote EV uptake.
Our investigations demonstrated that from a variety of sources, written media were the most widely consulted means for consumers, regardless of attitude to EVs, to research about cars. Not only did EV owners claim they did a lot more research when buying cars, we found there was a significant difference in awareness of policies to promote EV uptake, with EV owners much more informed compared to the driver types who drove ICEVs. Further, our results evidence no correlation with reading newspapers and magazines to update knowledge about cars and consumers’ attitudes to EVs, suggesting different consumer groups are affected similarly by the articles they do read. Furthermore, the research also revealed that some consumers rarely if ever read about cars, especially those least likely to buy an EV. As further evidence, additional tests revealed an increased likelihood of buying a BEV was correlated with an increase in consumer awareness of available programs. These factors suggest that the amount of research a consumer does is correlated with their levels of policy awareness and likelihood of buying a BEV. Furthermore, our additional test asking if a consumer would never buy an EV, we found that a greater aversion to EVs correlated with a reduced awareness of available EV incentives.
Many New Zealand consumers have positive attitudes to EVs and regard traditional print media as treating EVs positively. However, our survey showed many consumers perceived EVs as expensive and unaffordable, and lacked up-to-date knowledge about EVs and supporting policies/initiatives to make informed decisions when buying a car. Therefore, we suggest the media and other communication channels could play an important role in keeping people abreast of the car industry’s fast-moving changes, correcting misinformation and helping change perceptions.
Although the research was based in New Zealand, the results provide lessons for other countries that have low rates of EV uptake. Communicating information about EVs and related attributes is critical to success, either about existing programs, as is the case for New Zealand, or to promote new or upgraded policies.
If the aim is to promote EV vehicles as a substitute for ICEVs as a means to reduce negative externalities from the use of oil as a fuel source for road transport, including GHG emissions, then the media have a role to play in disseminating factual and up-to-date information, and that could help change people’s perceptions and behaviour next time they buy a car. Our results and discussions demonstrate the potential of the media for providing opportunities to promote EVs, particularly in the general news sections, such as stories about additional procurement of EVs by government and organisations. We suggest that not only could such procurement increase the supply of second-hand EVs over time, but it could also increase sales certainty for auto dealers leading to increased model availability. Media coverage, and employees, could amplify social and informational conformity.
Not everyone reads the motoring sections of traditional media and greater efforts to disseminate information via broader communications channels, including the general news sections of newspapers (across platforms) and social media, will be required. Thus, a prolonged campaign using multiple communication channels could contribute to changing social norms through informational and social conformity. Social marketing recommends that campaigns focus on the segment next most likely to act, in this case the EV Positives, who can be regarded as the early mainstream market.
In conclusion, we suggest that social marketing campaigns, including employing the media especially general news rather than specifically in the motoring sections, could be utilized to deliver more information about existing programs, e.g., the availability of smart phone apps to locate recharger stations especially with a focus on targeting the group next most likely to buy an EV. However, increasing the deployment of rechargers, especially fast chargers, and programs aiming to reduce the cost differential between ICEVs and EVs, such as a feebate scheme, and increasing communications about them, including in the media, could allay consumer concerns and perceptions of expense and worries about recharging away from home. Additionally, media coverage could increase the visibility of EVs in the community, such as promoting street signage for public rechargers and EV numberplates, thus contributing to social conformity mechanisms.

Supplementary Materials

The following are available online at https://www.mdpi.com/article/10.3390/wevj12040174/s1, Figure S1: Word cloud (https://tagcrowd.com) generated from words used by EV Owners to describe EVs, Figure S2: Word cloud https://tagcrowd.com) generated from words used by EV Positives, Figure S3: Word cloud (https://tagcrowd.com/) generated from words used by EV Anxious, Figure S4: Word cloud (https://tagcrowd.com/) generated from words used by EV Pessimists, Figure S5: Level of research for next vehicle versus driver type (A8), Figure S6: Frequently use newspapers to update knowledge about cars (A14 -Newspapers) by Driver Type, Figure S7: Frequently use car magazines to update knowledge about cars (A14- Magazines) by Driver Type, Figure S8: Frequently use online resources (international websites and social media) to update knowledge about cars (A14-online) by Driver Type, Figure S9: Rarely, if ever, read about cars by driver type (A14- rarely read), Figure S10: Car consumer unaware of EV initiatives by driver type (A22-11), Figure S11: Likelihood of purchasing a fully electric vehicle (BEV) by driver type (A15-1), Figure S12: Likelihood of purchasing a PHEV by driver type (A15-2), Figure S13: Box plot—Number of initiatives aware of, for each driver type (A22-count). Each box represents the interquartile range (from the 25th to 75th percentiles), the dots represent outliers and the bold line in the box represents the median score, Figure S14: Car consumer perception of how the media portray EVs by Driver Type (A18), Figure S15: Likelihood of purchasing a BEV as a ratio of rarely reading about cars, Figure S16: Likelihood of purchasing a BEV as a ratio of using newspapers to update knowledge about cars, Figure S17: Likelihood of purchasing a BEV as a ratio of using car magazines to update knowledge about cars, Figure S18: Likelihood of purchasing a BEV as a ratio of perception of how the media portray EVs, Figure S19: Likelihood of purchasing a BEV as a ratio of being ‘unaware of EV initiatives’, Figure S20: Likelihood of purchasing a BEV as a ratio of whether a car buyer does a lot of research prior to vehicle purchase or not, Table S1: Electric Vehicle Programme key policies, Table S2: Diffusion of Innovation societal niches and characteristics, Table S3: Socio -demographic profiles of ICEV and EV drivers, Table S4a: Attitudes to EVs from YouGov survey question A16 (n = 588), Table S4b: Attitudes to EVs for EV Owners (n = 305), Table S5: Amount of research undertaken when updating knowledge about cars (A8) expressed as a percentage, Table S6: From which single source do you get MOST of your information about new car models coming onto the market? Choose the source you use most often. (A13), Table S7. Use of written media to update knowledge of cars: Percentages of car buyers more often accessing each form of media: respondents list their top 3 when reading about cars (A14), Table S8a: ICEV buyers: Open response to A24 “I’d be more likely to buy an EV if……” showing percentage of respondents who mentioned any particular category, some car buyers nominated more than one factor, Table S8b: EV Owners: Percentage of EV Owners who nominated factors (in an open response question “The main reason I bought a plug-in electric car is…”) that motivated them to buy an EV, some owners nominated more than one factor, Table S9: Numbers of car buyers mentioning a concept, and percentages of words/concepts used by each Driver Type, Table S10: Survey questions with relevant data.

Author Contributions

Conceptualization: G.H.B., G.I.M.; Methodology: G.H.B., Formal analysis: G.H.B., investigation: G.H.B., Writing—original draft: G.H.B.; Investigation: G.H.B.; Data curation: G.H.B.; Supervision: G.I.M., T.O.W.; Writing-review and editing: G.I.M., T.O.W.; Project Administration: G.H.B. All authors have read and agreed to the published version of the manuscript.

Funding

This research did not receive any specific grant from funding agencies in the public, commercial or not-for-profit sector, apart from support through an Australian Government Research Training Program Scholarship.

Institutional Review Board Statement

Ethics approval number HC 191041 UNSW applies to this research.

Informed Consent Statement

All subjects gave their informed consent for inclusion before they participated in the study.

Data Availability Statement

Raw data can be obtained from the corresponding author upon request.

Acknowledgments

We thank Ben Maslen and Garston Liang for their advice on statistical analysis.

Conflicts of Interest

The authors declare no conflict of interest.

References

  1. IPCC. Climate Change 2014: Mitigation of Climate Change. Contribution of Working Group III to the Fifth Assessment Report of the Intergovernmental Panel on Climate Change: Chapter 8 Transport. Available online: https://www.ipcc.ch/report/ar5/wg3/ (accessed on 2 February 2021).
  2. Höltl, A.; Macharis, C.; De Brucker, K. Pathways to decarbonise the European car fleet: A scenario analysis using the backcasting approach. Energies 2018, 11, 20. [Google Scholar] [CrossRef] [Green Version]
  3. Broadbent, G.H. Comment on “Consumer purchase intentions for electric vehicles: Is green more important than price and range? K. Degirmenci, MH Breitner Transportation Research Part D 51 (2017) 250–260”. Transp. Res. Part D Transp. Environ. 2018, 65, 849–852. [Google Scholar] [CrossRef]
  4. Plötz, P.; Axsen, J.; Funke, S.A.; Gnann, T. Designing car bans for sustainable transportation. Nat. Sustain. 2019, 2, 534–536. [Google Scholar] [CrossRef]
  5. European Commission. European Alternative Fuels Observatory: Countries. Available online: https://www.eafo.eu/ (accessed on 2 February 2021).
  6. Moore, G.A. Crossing the Chasm: Marketing and Selling Disruptive Products to Mainstream Customers, 3rd ed.; Harper Business New York: New York, NY, USA, 2014. [Google Scholar]
  7. Ford, R.; Stephenson, J.; Scott, M.; Williams, J.; Rees, D.; Wooliscroft, B. Keen on EVs: Kiwi Perspectives on Electric Vehicles, and Opportunities to Stimulate Uptake 2015, (Working Paper). Centre for Sustainability, University of Otago. Available online: http://hdl.handle.net/10523/5730 (accessed on 22 February 2021).
  8. Kangur, A.; Jager, W.; Verbrugge, R.; Bockarjova, M. An agent-based model for diffusion of electric vehicles. J. Environ. Psychol. 2017, 52, 166–182. [Google Scholar] [CrossRef] [Green Version]
  9. Broadbent, G.H.; Metternicht, G.; Drozdzewski, D. An Analysis of Consumer Incentives in Support of Electric Vehicle Uptake: An Australian Case Study. World Electr. Veh. J. 2019, 10, 11. [Google Scholar] [CrossRef] [Green Version]
  10. Peters, A.; de Haan, P.; Scholz, R.W. Understanding Car-Buying Behavior: Psychological Determinants of Energy Efficiency and Practical Implications. Int. J. Sustain. Transp. 2015, 9, 59–72. [Google Scholar] [CrossRef]
  11. Greenwald, B.C.; Stiglitz, J.E. Externalities in Economies with Imperfect Information and Incomplete Markets. Q. J. Econ. 1986, 101, 229–264. [Google Scholar] [CrossRef] [Green Version]
  12. Anderson, N.H. Integration theory and attitude change. Psychol. Rev. 1971, 78, 171–206. [Google Scholar] [CrossRef]
  13. Mairesse, O.; Macharis, C.; Lebeau, K.; Turcksin, L. Understanding the attitude-action gap: Functional integration of environmental aspects in car purchase intentions. Psicologica 2012, 33, 547–574. [Google Scholar]
  14. Krause, R.M.; Carley, S.R.; Lane, B.W.; Graham, J.D. Perception and reality: Public knowledge of plug-in electric vehicles in 21 U.S. cities. Energy Policy 2013, 63, 433–440. [Google Scholar] [CrossRef]
  15. Fry, A.; Ryley, T.; Thring, R. The influence of knowledge and persuasion on the decision to adopt or reject alternative fuel vehicles. Sustainability 2018, 10, 2997. [Google Scholar] [CrossRef] [Green Version]
  16. White, L.V.; Sintov, N.D. You are what you drive: Environmentalist and social innovator symbolism drives electric vehicle adoption intentions. Transp. Res. Part A Policy Pract. 2017, 99, 94–113. [Google Scholar] [CrossRef] [Green Version]
  17. Dijk, M.; Wells, P.; Kemp, R. Will the momentum of the electric car last? Testing an hypothesis on disruptive innovation. Technol. Forecast. Soc. Chang. 2016, 105, 77–88. [Google Scholar] [CrossRef] [Green Version]
  18. Jeffres, L.W.; Neuendorf, K.; Atkin, D.J. Acquiring Knowledge from the Media in the Internet Age. Commun. Q. 2012, 60, 59–79. [Google Scholar] [CrossRef]
  19. Happer, C.; Philo, G. The role of the media in the construction of public belief and social change. J. Soc. Polit. Psychol. 2013, 1, 321–336. [Google Scholar] [CrossRef]
  20. Oppegaard, B.; Rabby, M.K. Proximity: Revealing new mobile meanings of a traditional news concept. Digit. J. 2016, 4, 621–638. [Google Scholar] [CrossRef]
  21. Yin, R.K. Case Study Research and Applications, 6th ed.; Sage Publications, Inc.: Los Angeles, CA, USA, 2018. [Google Scholar]
  22. Hamborg, F.; Donnay, K.; Gipp, B. Automated identification of media bias in news articles: An interdisciplinary literature review. Int. J. Digit. Libr. 2018, 20, 391–415. [Google Scholar] [CrossRef] [Green Version]
  23. Levin, I.P.; Schneider, S.L.; Gaeth, G.J. All Frames Are Not Created Equal: A Typology and Critical Analysis of Framing Effects. Organ. Behav. Hum. Decis. Process. 1998, 76, 149–188. [Google Scholar] [CrossRef] [Green Version]
  24. Kahneman, D.; Tversky, A. Prospect Theory: An Analysis of Decision under Risk. Econometrica 1979, 47, 263–292. [Google Scholar] [CrossRef] [Green Version]
  25. Pan, Y.; Opgenhaffen, M.; Van Gorp, B. Negotiating climate change: A frame analysis of COP21 in British, American, and Chinese news media. Public Underst. Sci. 2019, 28, 519–533. [Google Scholar] [CrossRef]
  26. Brüggemann, M.; Engesser, S. Beyond false balance: How interpretive journalism shapes media coverage of climate change. Glob. Environ. Chang. 2017, 42, 58–67. [Google Scholar] [CrossRef]
  27. Newman, T.P.; Nisbet, E.C.; Nisbet, M.C. Climate change, cultural cognition, and media effects: Worldviews drive news selectivity, biased processing, and polarized attitudes. Public Underst. Sci. 2018, 27, 985–1002. [Google Scholar] [CrossRef] [PubMed]
  28. Gentzkow, M.; Shapiro, J.M. What Drives Media Slant? Evidence from U.S. Daily Newspapers. Econometrica 2010, 78, 35–71. [Google Scholar] [CrossRef]
  29. Otto, I.M.; Donges, J.F.; Cremades, R.; Bhowmik, A.; Hewitt, R.J.; Lucht, W.; Rockström, J.; Allerberger, F.; McCaffrey, M.; Doe, S.S.P.; et al. Social tipping dynamics for stabilizing Earth’s climate by 2050. Proc. Natl. Acad. Sci. USA 2020, 117, 2354–2365. [Google Scholar] [CrossRef] [PubMed] [Green Version]
  30. Roy Morgan Research. Over 3.1 Million New Zealanders Read Newspapers. Report. 2019. Available online: http://www.roymorgan.com/findings/7862-over-3point1-million-new-zealanders-read-newspapers-201902010504 (accessed on 8 August 2021).
  31. Ministry of Transport NZ Vehicle Fleet Statistics. Available online: https://www.transport.govt.nz/mot-resources/vehicle-fleet-statistics/ (accessed on 9 September 2021).
  32. Feldman, L.; Hart, P.S.; Milosevic, T. Polarizing news? Representations of threat and efficacy in leading US newspapers’ coverage of climate change. Public Underst. Sci. 2017, 26, 481–497. [Google Scholar] [CrossRef] [Green Version]
  33. Bolsen, T.; Shapiro, M.A. The US News Media, Polarization on Climate Change, and Pathways to Effective Communication. Environ. Commun. 2018, 12, 149–163. [Google Scholar] [CrossRef]
  34. Carmichael, J.T.; Brulle, R.J. Elite cues, media coverage, and public concern: An integrated path analysis of public opinion on climate change, 2001–2013. Envrion. Politics 2017, 26, 232–252. [Google Scholar] [CrossRef]
  35. Entman, R.M. Framing bias: Media in the distribution of power. J. Commun. 2007, 57, 163–173. [Google Scholar] [CrossRef]
  36. Carmichael, J.T.; Brulle, R.J.; Huxster, J.K. The great divide: Understanding the role of media and other drivers of the partisan divide in public concern over climate change in the USA, 2001–2014. Clim. Chang. 2017, 141, 599–612. [Google Scholar] [CrossRef]
  37. Chen, Y.; Ghosh, M.; Liu, Y.; Zhao, L. Media Coverage of Climate Change and Sustainable Product Consumption: Evidence from the Hybrid Vehicle Market. J. Mark. Res. 2019, 56, 995–1011. [Google Scholar] [CrossRef] [Green Version]
  38. MacDonald, T. WSJ and Right-Wing Outlets Hype Dubious Study Criticizing Electric Vehicles. Media Matters for America. Available online: https://www.mediamatters.org/wall-street-journal/wsj-and-right-wing-outlets-hype-dubious-study-criticizing-electric-vehicles (accessed on 22 February 2021).
  39. Rinallo, D.; Basuroy, S. Does advertising spending influence media coverage of the advertiser? J. Mark. 2009, 73, 33–46. [Google Scholar] [CrossRef] [Green Version]
  40. Beattie, G.; Durante, R.; Knight, B.G.; Sen, A. Advertising Spending and Media Bias: Evidence from News Coverage of Car Safety Recalls. SSRN Electron. J. 2017. [Google Scholar] [CrossRef] [Green Version]
  41. Germar, M.; Albrecht, T.; Voss, A.; Mojzisch, A. Social conformity is due to biased stimulus processing: Electrophysiological and diffusion analyses. Soc. Cogn. Affect. Neurosci. 2016, 11, 1449–1459. [Google Scholar] [CrossRef] [PubMed] [Green Version]
  42. Cherchi, E. A stated choice experiment to measure the effect of informational and normative conformity in the preference for electric vehicles. Transp. Res. Part A Policy Pract. 2017, 100, 88–104. [Google Scholar] [CrossRef] [Green Version]
  43. Mallinson, D.J.; Hatemi, P.K. The effects of information and social conformity on opinion change. PLoS ONE 2018, 13, e0196600. [Google Scholar] [CrossRef] [PubMed]
  44. Morecroft, J.D.W. Strategic Modelling and Business Dynamics a Feedback Systems Approach, 2nd ed.; Wiley: Hoboken, NJ, USA, 2015. [Google Scholar] [CrossRef]
  45. Struben, J.; Sterman, J.D. Transition challenges for alternative fuel vehicle and transportation systems. Environ. Plan B Plan Des. 2008, 35, 1070–1097. [Google Scholar] [CrossRef]
  46. Hertzke, P.; Müller, N.; Schenk, S.; Wu, T. The Global Electric-Vehicle Market Is Amped Up and on the Rise, Report for McKinsey & Company-Center for Future Mobility. 2018. Available online: https://www.mckinsey.com/industries/automotive-and-assembly/our-insights/the-global-electric-vehicle-market-is-amped-up-and-on-the-rise (accessed on 5 May 2021).
  47. Struben, J. The Diffusion of Complex Market Technologies: Multifaceted Dynamics for Alternative Fuel Vehicles. In Proceedings of the 2008 Industry Studies Conference Paper, Boston, MA, USA, 1–2 May 2008; Available online: https://papers.ssrn.com/sol3/papers.cfm?abstract_id=1135732 (accessed on 22 February 2021).
  48. Kristensen, F.S.; Thomassen, M.L.; Jakobsen, L.H. The Norwegian EV Initiative. Report for European Commission, Brussels. Available online: https://jiip.eu/mop/wp/wp-content/uploads/2018/09/NO_Electric-Vehicles-Initiative_SkovKristensenLaugeThomassenJakobsen.pdf (accessed on 22 February 2021).
  49. Figenbaum, E.; Kolbenstvedt, M.; Elvebakk, B. Electric Vehicles—Environmental, Economic and Practical Aspects—As Seen by Current and Potential Users TØI Report 1329/2014. Oslo. 2014. Available online: https://www.toi.no/getfile.php/Publikasjoner/TØIrapporter/2014/1329-2014/1329-2014-el.pdf (accessed on 22 February 2021).
  50. Ofcom, U.K. News Consumption in the UK, 2020. Report by Jigsaw Research for UK Office of Communication. Available online: https://www.ofcom.org.uk/home (accessed on 14 September 2021).
  51. Roy Morgan Research. Cross Platform Audiences. 2021. Available online: http://www.roymorgan.com/findings/8707-roy-morgan-cross-platform-audiences-march-2021-202105240628 (accessed on 9 September 2021).
  52. Best, A.; Holmes, B. Systems thinking, knowledge and action: Towards better models and methods. Evid. Policy A J. Res. Debate Pract. 2010, 6, 145–159. [Google Scholar] [CrossRef] [Green Version]
  53. Gardner, J.; Quezada, G.; Paevere, P. Social Study on Attitudes, Drivers and Barriers to the Uptake of Electric Vehicles, (An Electric Driveway Project Report); Commonwealth Scientific and Industrial Research Organisation (CSIRO): Canberra, Australia, 2011; Report Number: EP113815; Available online: Chrome-extension://efaidnbmnnnibpcajpcglclefindmkaj/viewer.html?pdfurl=https%3A%2F%2Fpublications.csiro.au%2Frpr%2Fdownload%3Fpid%3Dcsiro%3AEP113815%26dsid%3DDS3&clen=528259 (accessed on 22 August 2021).
  54. Larson, P.D.; Viáfara, J.; Parsons, R.V.; Elias, A. Consumer attitudes about electric cars: Pricing analysis and policy implications. Transp. Res. Part A Policy Pract. 2014, 69, 299–314. [Google Scholar] [CrossRef]
  55. Morton, C.; Anable, J.; Nelson, J.D. Consumer structure in the emerging market for electric vehicles: Identifying market segments using cluster analysis. Int. J. Sustain. Transp. 2017, 11, 443–459. [Google Scholar] [CrossRef]
  56. Kotler, P.; Zaltman, G. Social Marketing: An approach to planned social change. J. Mark. 1971, 35, 3–12. [Google Scholar] [CrossRef]
  57. Jenn, A.; Lee, J.H.; Hardman, S.; Tal, G. An in-depth examination of electric vehicle incentives: Consumer heterogeneity and changing response over time. Transp. Res. Part A Policy Pract. 2020, 132, 97–109. [Google Scholar] [CrossRef]
  58. Rogers, E.M. Diffusion of Innovations, 5th ed.; Simon and Schuster: New York, NY, USA, 2003. [Google Scholar]
  59. Zarazua de Rubens, G. Who will buy electric vehicles after early adopters? Using machine learning to identify the electric vehicle mainstream market. Energy 2019, 172, 243–254. [Google Scholar] [CrossRef]
  60. Bator, F.M. The Anatomy of Market Failures. Q. J. Econ. 1958, 72, 351–379. [Google Scholar] [CrossRef]
  61. Harding, R.; Hendriks, C.M.; Faruqi, M. Environmental Decision-Making: Exploring Complexity and Context; Federation Press: Sydney, Australia, 2009. [Google Scholar]
  62. Cresswell, J.W.; Poth, C.N. Qualitative Inquiry and Research Design, 4th ed.; Sage Publications, Inc.: Thousand Oaks, CA, USA, 2018. [Google Scholar]
  63. Bryman, A. Social Research Methods, 4th ed.; Oxford University Press: Oxford, UK, 2012. [Google Scholar]
  64. Twyman, J. Getting It Right: YouGov and Online Survey Research in Britain. J. Elect. Public Opin. Parties 2008, 18, 343–354. [Google Scholar] [CrossRef]
  65. Brand, C.; Cluzel, C.; Anable, J. Modeling the uptake of plug-in vehicles in a heterogeneous car market using a consumer segmentation approach. Transp. Res. Part A Policy Pract. 2017, 97, 121–136. [Google Scholar] [CrossRef]
  66. Pearson, K.X. On the criterion that a given system of deviations from the probable in the case of a correlated system of variables is such that it can be reasonably supposed to have arisen from random sampling. London, Edinburgh. Dublin Philos. Mag. J. Sci. 1900, 50, 157–175. [Google Scholar] [CrossRef] [Green Version]
  67. Hay, I. (Ed.) Qualitative Research Methods in Human Geography, 2nd ed.; Oxford University Press: Melbourne, Australia, 2005. [Google Scholar]
  68. Holm, S. Board of the Foundation of the Scandinavian Journal of Statistics a Simple Sequentially Rejective Multiple Test Procedure Author(s): Sture Holm Published by: Wiley on behalf of Board of the Foundation of the Scandinavian. J. Stat. Stable U. Scand. J. Stat. 1979, 6, 65–70. [Google Scholar]
  69. Christensen, R.H.B. Analysis of Ordinal Data with Cumulative Link Models-Estimation with the R Package Ordinal. 2015. Available online: chrome-extension://efaidnbmnnnibpcajpcglclefindmkaj/viewer.html?pdfurl=https%3A%2F%2Fcran.r-project.org%2Fweb%2Fpackages%2Fordinal%2Fvignettes%2Fclm_article.pdf&clen=351531&chunk=true (accessed on 25 May 2021).
  70. Liao, F.; Molin, E.; van Wee, B. Consumer preferences for electric vehicles: A literature review. Transp. Rev. 2017, 37, 252–275. [Google Scholar] [CrossRef] [Green Version]
  71. Otieno, C.; Spada, H.; Renkl, A. Effects of news frames on perceived risk, emotions, and learning. PLoS ONE 2013, 8, e79696. [Google Scholar] [CrossRef] [Green Version]
  72. Liebrecht, C.; Hustinx, L.; van Mulken, M. The Relative Power of Negativity: The Influence of Language Intensity on Perceived Strength. J. Lang. Soc. Psychol. 2019, 38, 170–193. [Google Scholar] [CrossRef] [Green Version]
  73. Soroka, S.N. Good news and bad news: Asymmetric responses to economic information. J. Politics 2006, 68, 372–385. [Google Scholar] [CrossRef]
  74. Drive Electric. EV Models and Where to Buy. Available online: https://driveelectric.org.nz/individuals/ev-models-and-where-to-buy/ (accessed on 22 February 2021).
  75. Hasan, M.A.; Frame, D.J.; Chapman, R.; Archie, K.M. Costs and emissions: Comparing electric and petrol-powered cars in New Zealand. Transp. Res. Part D Transp. Environ. 2021, 90, 102671. [Google Scholar] [CrossRef]
  76. Mack, A. Inattentional Blindness: Looking Without Seeing. Curr. Dir. Psychol. Sci. 2003, 12, 180–184. [Google Scholar] [CrossRef]
  77. Westin, K.; Jansson, J.; Nordlund, A. The importance of socio-demographic characteristics, geographic setting, and attitudes for adoption of electric vehicles in Sweden. Travel Behav. Soc. 2018, 13, 118–127. [Google Scholar] [CrossRef]
  78. Barton, B. Electric vehicles policy announcement. N. Z. Law J. 2016, 1, 268–270. Available online: https://hdl.handle.net/10289/11146 (accessed on 25 May 2021).
  79. NZ Transport Agency. Clean Car Discount. Available online: https://www.nzta.govt.nz/vehicles/clean-car-programme/clean-car-discount (accessed on 8 August 2021).
  80. Lieven, T. Policy measures to promote electric mobility-A global perspective. Transp. Res. Part A Policy Pract. 2015, 82, 78–93. [Google Scholar] [CrossRef] [Green Version]
  81. Friis, F. An alternative explanation of the persistent low EV-uptake: The need for interventions in current norms of mobility demand. J. Transp. Geogr. 2020, 83, 102635. [Google Scholar] [CrossRef]
  82. Nab, M.; Jansma, S.; Gosselt, J. Tell me what is on the line and make it personal: Energizing Dutch homeowners through message framing. Energy Res. Soc. Sci. 2020, 70, 101760. [Google Scholar] [CrossRef]
  83. Kurani, K.S.; Caperello, N.; Tyree-Hageman, J.; Davies, J. Symbolism, signs, and accounts of electric vehicles in California. Energy Res. Soc. Sci. 2018, 46, 345–355. [Google Scholar] [CrossRef]
  84. European Commission, 2021. Norway Incentives Eur. Altern. Fuels Obs. Available online: https://www.eafo.eu/countries/norway/1747/incentives (accessed on 22 February 2021).
  85. Schmidt, B. Jacinda Ardern to Get All-Electric Audi e-Tron to Replace Diesel Fleet Car, the Driven. Available online: https://thedriven.io/2020/10/26/jacinda-ardern-to-get-all-electric-audi-e-tron-to-replace-diesel-fleet-car/ (accessed on 22 February 2021).
  86. Ingeborgrud, L.; Ryghaug, M. The role of practical, cognitive and symbolic factors in the successful implementation of battery electric vehicles in Norway. Transp. Res. Part A Policy Pract. 2019, 130, 507–516. [Google Scholar] [CrossRef]
  87. Legros, S.; Cislaghi, B. Mapping the Social-Norms Literature: An Overview of Reviews. Perspect. Psychol. Sci. 2020, 15, 62–80. [Google Scholar] [CrossRef] [PubMed] [Green Version]
  88. Nayum, A.; Klockner, C.A. A comprehensive socio-psychological approach to car type choice. J. Environ. Psychol. 2014, 40, 401–411. [Google Scholar] [CrossRef]
  89. Bennett, R.; Kottasz, R.; Shaw, S. Factors potentially affecting the successful promotion of electric vehicles. J. Soc. Mark. 2016, 6, 62–82. [Google Scholar] [CrossRef]
  90. Figenbaum, E. Perspectives on Norway’s supercharged electric vehicle policy. Environ. Innov. Soc. Transit. 2017, 25, 14–34. [Google Scholar] [CrossRef] [Green Version]
Figure 1. Conceptual framework of the theories and paradigms influencing car buying action: Rates of EV uptake differ among car buying motorists and are influenced by socio-technical inertia that incorporates multiple factors including: Government policies [59], Diffusion of Innovation processes [58], Information Integration Theory [12], market failures [60], and consumers’ world views [61]. Each Driver Type represents a sub-set of car buyers, each with different attitudes and perceptions towards EVs, as part of the whole population of Motorists, and the label for each subset reflects these different attitudes to EVs.
Wevj 12 00174 g001
Figure 2. Mosaic plot showing primary information source when researching cars versus Driver Type (A13); the width of each column reflects sample size of each Driver Type and the height of each tile within the mosaic reflects proportion of each option.
Wevj 12 00174 g002
Figure 3. Use of online resources (international websites and social media) as a principal means to update knowledge about cars (A14-online) grouped according to Driver Type.
Wevj 12 00174 g003
Figure 4. Mosaic plot showing ratio of primary information source to likelihood of purchasing a BEV.
Wevj 12 00174 g004
Figure 5. Mosaic plot showing the ratio of use of online sources, including social media, to likelihood of purchasing a BEV.
Wevj 12 00174 g005
Figure 6. Box plot showing the number of initiatives consumers were aware of for each available score of likelihood of BEV purchase. Each box represents the interquartile range (from the 25th to 75th percentiles), the dots represent outliers and the bold line in the box represents the median score.
Wevj 12 00174 g006
Table 1. Wording used in the questionnaires for questions discussed in this paper. Further explained in Section 3.2.2.
Question NumberQuestion Text
A8When you are considering what to buy for your next car, how much research do you do to familiarise yourself with changes in market offerings? Choose the most appropriate response.
1: Very little, I just buy something similar to last time
2: I rely on the car sales staff at the dealership
3: I do a lot of research
4: I rely on discussions with family and friends
5: I rely on someone else to choose and buy the car
6: Other—please specify
A13From which single source do you get MOST of your information about new car models coming onto the market? Choose the source you use most often.
1: friends and family, that is by word of mouth
2: written sources: newspapers/magazines (print or online), including manufacturers websites
3: Social media (e.g., Facebook)
4: AANZ
5: Television
6: radio
7: Car sales staff
8: Other- please specify
9: I am not really interested in finding out about cars
A14Thinking of the written media (print or online) including newspapers and magazines, please indicate the sources you READ most often to update your knowledge about cars. Please select up to 3 options
1: AANZ; 2: New Zealand Herald; 3: Dominion Post; 4: The Press; 5: Otago Daily Times; 6: Waikato Times; 7: NZ Autocar; 8: Autotrader; 9: Driven NZ; 10: Stuff Motoring News; 11: International online sources; 12: Social media; 13: Other—please specify; 14: I rarely, if ever, read about cars
A21Please write down three words (or short phrases) that pop into your head that you would use to describe electric vehicles. EVs are…..[open]
InitiativesThe following list shows the initiatives that New Zealand has taken to increase the popularity of electric cars (EVs)
1: EV Ride and Drive events where you can see and drive EVS
2: Importation of good quality second-hand EVs from Japan and UK permitted
3: First registration tax exemption for EVs (until 2021)
4: Allowed EVs to use lanes normally reserved for buses or vehicles with multiple occupants
5: Provision of a website with lots of information about EVs, including a list of car dealers who sell EVs
6: Support for the installation of a network of fast chargers about NZ
7: Smart phone app called EV Roam to enable motorists to find EV recharger locations
8: contestable fund that offers grants to help organisations, including charities, to buy EVs or install rechargers, or other initiative to increase EV uptake
9: From 2021, the proposed clean car discount would subsidise the purchase price of cars with low emissions whereas the first registration fee of cars with high emissions would pay an additional registration fee
10: From 2021, the proposed clean car standard would require vehicle importers to reduce the average emissions of their imports by increasing the number of cleaner cars they import
A22Please choose as many of the initiatives [from 1–10 listed above] that you have heard or read about, [or],
11: I have not heard or read about any of these initiatives
A23Please choose the three most appealing to you [from 1–10 listed above] as a consumer that might help persuade you to buy an EV, [or],
11: don’t know
12: I would never buy an EV
A15-1On a scale of 1–5 where 1 represents not likely, 3 represents neutral and 5 represents very likely, how likely are you to buy a …?
Fully electric car (BEV)
A15-2Plug in Hybrid (PHEV)
A17When thinking about car purchase, please consider the following qualities and indicate on a scale from 1–5 how important each factor is to you when thinking whether to go electric or not
A17-2Vehicle purchase price
A17-3Total ownership cost savings of EVs over time compared to conventional cars e.g., due to fuel cost savings
A17-7The expected life of the battery
A18How do you think, overall, are EVs portrayed in the media: 1 = very negative; 2 = negative; 3 = middle, there is a mix of positive and negative; 4 = positive; 5 = very positive; 6 = I haven’t noticed any stories in the media about electric cars
A24ICEV: Complete this statement: I would be more likely to buy an EV if…(open)
EV: The main reason I bought a plug-in electric car is… (short answer)
A16When thinking about electric cars, which of the following statements most closely matches your thoughts about buying an EV?
1: It’s about time, why wouldn’t you
2: Yes please, it would save how much fuel?
3: Yes please, but make it a plug-in hybrid for now
4: Great idea but where would I charge it?
5 If everyone else is, then maybe….
6: Will they save the planet? Don’t think so.
7: I would never be seen in one of those
8: I do a lot of driving, convince me
9: Don’t know
Table 2. New Zealand’s written media—newspapers and magazines, with stories about cars, showing percentage of positive, neutral and negative framed articles for each media outlet.
Media OutletReadership Numbers/WeekNo. EV Articles AnalysedFraming %
+0
Automobile Association of NZ416,000 a6379210
NZ Herald1,844,000 a44665278
Driven NZ (classifieds + news)111,000 b50170255
Otago Daily Times253,000 a10185133
The Press314,000 a3877122.56.5
Waikato Times214,000 a24658384
Dominion Post432,000 a42461345
NZ Autocar magazine14,000 a33284115
NZ Autotrader (classifieds + news)N/A569190
Stuff Motoring c208,750 c43582616
Notes: a Print is net readership in an average 7 days. Digital is average website visitation and app usage (if available) in an average 7 days. The above are cross-platform readership figures [30]. b Weekly readership http://www.voxy.co.nz/business/5/352922 (accessed on 22 February 2021). c a paywall restricts access to Stuff articles. Monthly readership of Stuff Motoring at November 2019, (Nielsen CMI Fused audiencefinder.stuff.co.nz/index.html)—averages to 208,750 reads per week.
Table 3. Results from Pearson’s Chi-squared tests and ANOVAs for the questions of interest against ‘Driver Type’ (Question A16). n is the number of samples left after filtering; method is the method used with test statistics being chi-squared test statistics for chi-squared tests and likelihood ratio test statistics for ANOVAs. df is the degrees of freedom and ‘p-value’ are the p-values that have been adjusted to account for multiple hypothesis testing using a Holm adjustment [68]. Table S10 provides the full wording for each question.
Question NumberIssuenMethodTest Statisticdfp-Value
GenderGender748Chisq54.73<0.0001
Age group 1Age749Chisq66.518<0.0001
D6Education level (School/vocation/university)741Chisq29.760.0003
D10Cars in household (1 or 2+)749Chisq39.63<0.0001
A3Purchase new or used623Chisq3.230.3576
A5Frequency of trips > 150 km749Chisq32.5120.0059
A6Amount willing to spend on car728Chisq50.73<0.0001
A8Amount of research when buying car749Chisq98.63<0.0001
A13Primary information source695Chisq189.418<0.0001
A14_MagazinesResearches in car magazines749Chisq5.030.3433
A14_NewspaperResearches in newspapers749Chisq10.230.0676
A14_OnlineResearches international online or social media749Chisq142.83<0.0001
A14_14Rarely reads about cars749Chisq42.63<0.0001
A18Perception of media portrayal about cars717Chisq162.212<0.0001
A22_11Have not heard of EV initiatives749Chisq143.93<0.0001
P12017 Election Party vote583Chisq123.96<0.0001
A23_12 aI would never buy an EV749Chisq84.92<0.0001
P4Household income676Chisq35.3210.0786
Word useNegative word association with EVs749Chisq294.03<0.0001
Word useExpensive749Chisq76.73<0.0001
Word useEconomical749Chisq79.23<0.0001
Word useLow-range749Chisq54.13<0.0001
Word useEcofriendly749Chisq22.93<0.0001
Word useFun749Chisq11.73<0.0001
A15_1Likelihood of buying BEV731ANOVA22.93<0.0001
A15_2Likelihood of buying PHEV730ANOVA33.33<0.0001
A17_1Importance of vehicle range743ANOVA66.73<0.0001
A17_2Importance of purchase price749ANOVA267.23<0.0001
A17_3Importance of total ownership costs740ANOVA266.43<0.0001
A17_4Importance of suitable EV model746ANOVA156.33<0.0001
A17_5Importance of cheaper servicing costs709ANOVA34.93<0.0001
A17_6Importance of fast charger network737ANOVA41.33<0.0001
A17_7Importance of battery life740ANOVA48.23<0.0001
A22_countHow many initiatives heard of749ANOVA160.53<0.0001
Note: a QuestionA23_12 was only presented to ICEV drivers (Positive, Anxious and Pessimist Driver Types).
Table 4. Differences among Driver Types for: Likelihood of BEV and PHEV purchase (A15_1,2: mean Likert Score 1–5, 1 is the most negative and 5 the most positive); Perception of how the media portray EVs (A18: mean Likert Score 1–5); those choosing A18_ 6 ‘I have not noticed any stories in the media about EVs’ as a percentage; those choosing Option A14_14 ‘I rarely, if ever read about cars’ expressed as a percentage for each Driver Type.
FactorEV Owners
n = 305
EV Positives
n = 154
EV Anxious
n = 201
EV Pessimists
n = 89
Likelihood of buying BEV (A15_1)
Mean Likert Scores 1–5
4.823.332.51.9
Likelihood of buying PHEV (A15_2)
Mean Likert Scores 1–5
1.973.143.492.19
Perception of how the media portray EVs (A18) Mean Likert Scores 1–53.053.993.783.38
“I have not noticed any stories in the media about EVs” (A18_6) Percentage1.3%7.1%6%5.6%
“I rarely if ever read about cars” (A14_14) Percentage11.1%26%31.8%36%
Table 5. Awareness and desirability of NZ Government incentives to foster EV uptake by each Driver Type as a percentage (See Table S10: A22; A23).
InitiativeEV OwnersEV PositivesEV AnxiousEV Pessimists
AwareDesirableAwareDesirableAwareDesirableAwareDesirable
EV Ride and Drive Events84.318.49.111.09.511.96.712.4
Importation 2nd hand EVs85.640.718.836.418.436.812.424.7
First registration tax exemption till 202145.214.418.829.211.924.716.915.7
EV use of HOV lanes61.010.213.625.311.421.412.420.2
Information website43.04.914.317.511.417.46.715.7
Nation-wide fast charge network87.553.435.748.138.356.236.022.5
Smart phone app for recharger locations27.93.620.833.117.936.812.418.0
Contestable fund for EV grants59.713.47.811.56.57.56.74.5
Proposed Clean Car Discount73.829.230.551.330.342.823.631.5
Proposed Clean Car Standard49.512.524.720.821.414.913.56.7
I am not aware of any initiatives0.7 35.1 38.3 41.6
Don’t know 5.9 3.2 8.5 12.4
I would never buy an EV 1.9 1.5 30.3
I would have bought an EV anyway 52.1
Table 6. Results from Likelihood Ratio Tests undertaken using ordinal logistic regression models with ‘Likelihood of BEV purchase’ as the response variable. n is the number of samples left after filtering, df is the degrees of freedom and ‘p-value’ are the p-values that have been adjusted to account for multiple hypothesis testing using a ‘holm’ adjustment [68].
QuestionnTest Statisticdfp-Value
A16_Driver Type, attitude to EVs731409.24<0.0001
A8_Car buyer does a lot of research or not86178.61<0.0001
A13_ Info source799132.37<0.0001
A14_Car Magazine8610.211
A14_Newspaper8610.111
A14_Online861107.01<0.0001
A14_14 rarely read car articles86142.81<0.0001
A18 Media portrayal perception81454.75<0.0001
A22_11 Not heard of initiatives861170.81<0.0001
A22_count number initiatives aware of861313.21<0.0001
Publisher’s Note: MDPI stays neutral with regard to jurisdictional claims in published maps and institutional affiliations.

