Article

Research on Cooperative Braking Control Algorithm Based on Nonlinear Model Prediction

College of Automotive Engineering, Jilin University, Changchun 130012, China
*
Author to whom correspondence should be addressed.
World Electr. Veh. J. 2021, 12(4), 173; https://doi.org/10.3390/wevj12040173
Submission received: 7 August 2021 / Revised: 6 September 2021 / Accepted: 27 September 2021 / Published: 30 September 2021

Abstract

:
To address the coordinated distribution of motor braking and friction braking for the regenerative braking system, a cooperative braking algorithm based on nonlinear model predictive control (NMPC) is proposed, with braking energy recovery power, tire slip rate, and motor torque variation as the optimization objectives, and online optimization of the coordinated distribution of motor braking and friction braking. Using the offline model built in Matlab/Simulink, the cooperative braking algorithm is tested for energy efficiency and braking safety. The results show that when based on World Light Vehicle Test Cycle (WLTC), the energy recovery rate can reach 30.4%, and with a single high braking intensity, the braking safety can still be ensured.

1. Introduction

As the automotive industry gradually enters the era of electrification and intelligentization, the fully decoupled braking system has become a key research object for major OEMs and parts manufacturers [1]. The increase in the degree of decoupling of the braking system has laid the hardware foundation for the implementation of advanced braking control algorithms [2,3]. Among them, the cooperative braking control algorithm has been a hot topic of research in the industry, which is mainly used to solve the problem of coordinated distribution of motor braking and friction braking for the regenerative braking system and has an important impact on braking safety and braking energy recovery effect [4,5,6].
The cooperative braking control strategy mainly includes two types of parallel and series, and the schematic diagram is shown in Figure 1. For the parallel control strategy, motor braking and friction braking are independent of each other [7,8,9]. Motor braking is additionally superimposed on the drive shaft while keeping the conventional front and rear axle friction braking ratio unchanged. It can be easily achieved in the conventional undecoupled hardware system [10,11,12]. The additional motor braking power should not be too large; otherwise, it will affect the braking feeling and safety, so the regenerative braking system with a parallel control strategy will only recover less braking energy. For the series control strategy, friction braking and motor braking can be coordinatively controlled so that the motor braking capacity can be fully utilized while ensuring braking feeling and safety [13,14]. The regenerative braking system with a series control strategy can recover more braking energy, but its algorithm is more complex and must be implemented in the decoupled hardware system [15].
In recent years, many advanced cooperative braking algorithms have been derived based on these two basic types. The paper [16] takes the Economic Commission of Europe (ECE) braking safety regulation as the constraint condition and develops a new regenerative braking torque distribution strategy. To improve energy recovery efficiency, an optimization algorithm of energy recovery efficiency is proposed for parallel hydraulic hybrid systems (PHHS) using dynamic programming (DP) [17]. The paper [18] designs an energy-recovery control strategy based on the Kalman Filter, which can optimize the model accuracy and improve the robustness of the system. Based on logic threshold control algorithm with the input of z and I, a distribution relationship between electric and mechanical braking is determined, which is proved to be effective on road conditions with different slopes [19]. Based on the ECE regulation curve and ideal braking force distribution (I curve), a braking force distribution strategy of the front and rear axles is designed to improve the recovered braking energy [20].
In summary, despite the fact that various advanced braking control algorithms have been proposed, it is mostly true that they only optimize a single control objective, while control of other objectives is rather vague and thus cannot systematically address the problem of multiple objectives and constraints in regenerative braking systems. In addition, the control objectives cannot be optimized in real time according to the change of vehicle state, which means the regenerative braking system may not be able to be fully exploited. Therefore, based on the above analysis, a cooperative braking algorithm based on NMPC is proposed for the fully decoupled braking system of front-drive vehicles in this paper, with braking energy recovery power, tire slip rate, and motor torque variation as the optimization objectives, and online optimization of the coordinated distribution of motor braking and friction braking to achieve good energy efficiency while ensuring braking safety [19,21,22].
The remainder of this paper is organized as follows. Section 2 describes the cooperative braking control algorithm based on NMPC. Simulation verification and results analysis are discussed in Section 3. Lastly, conclusions are drawn in Section 4.

2. Cooperative Braking Control Algorithm Based on NMPC

2.1. Overview of NMPC

The control process that is based on the system dynamic model to find the optimal solution of the optimization problem in a finite prediction time domain and utilizes the rolling optimization to complete the optimization of the whole control process, which is defined as model predictive control (MPC) [23,24].
Classical MPC usually uses linear models for prediction, which works better for linear systems. But for nonlinear systems, linear models cannot accurately describe their dynamic characteristics, making it difficult to apply them directly to nonlinear systems.
MPC is also a closed-loop optimization method that can correct the error caused by model mismatch through the closed-loop process. In practice, MPC can be applied in nonlinear processes by linearizing the nonlinear model. This control process is known as NMPC [25,26].
As a branch of MPC, NMPC can achieve predictive control based on the nonlinear model and perform closed-loop optimization. The nonlinear model can provide a more accurate description of the nonlinear process, solving the problem of insufficient accuracy of the linear model [27,28].
NMPC can only find the optimal solution in each finite time domain but not the global optimal solution of the whole operation process. In engineering practice, the target state of the vehicle in the future cannot be predicted in advance, so the global optimum cannot be found. Therefore, solving the local optimal results can already satisfy the optimization requirements of the regenerative braking process [29].

2.2. The Implementation Method of NMPC

Different NMPC algorithms differ in terms of prediction models and control performance, but all have the same implementation. In each control cycle, with the current state as the starting point, the control algorithm can solve the optimization problem in the finite time domain by a prediction model to obtain the optimal control sequence, the first element of which is used as the control input of the current state. The implementation of the algorithm consists of three parts: solving the prediction model, solving the optimization problem in the finite time domain, and feedback correction.
The first step in implementing the NMPC algorithm is to build a discrete prediction model. The predictive model can respond to system dynamic characteristics and be used to predict system future states and outputs. By solving the prediction model, each set of system states and outputs in the prediction time domain can be obtained.
To solve the optimization problem in the finite time domain, it is first necessary to design the optimization objective function. The optimization objective function contains the outputs and state variables to be optimized and contains the weights for each of these optimization objectives. Solving an optimization problem in the finite time domain is actually to find the input matrix that minimizes the value of the optimization objective function in the prediction time domain. The time range of the input matrix is called the control time domain, and usually, the control time domain is less than or equal to the prediction time domain. To ensure that the states and inputs can be solved for each moment in the prediction time domain, the last set of inputs of the input matrix can be taken as the inputs outside the control time domain.
In the actual control process, there is a common problem of model mismatch. Using closed-loop feedback, the NMPC algorithm can correct control errors caused by the model mismatch. The NMPC algorithm can correct control errors caused by model mismatch through closed-loop feedback.
The feedback correction consists of two parts: first, when solving the optimization problem at each moment, the prediction model starts predicting based on the actual feedback of the system at the previous moment, which can reduce the global cumulative error caused by the accumulation of model mismatch over time; second, the control algorithm can compare the prediction data before the current moment with the actual measurement results to obtain the prediction error caused by model mismatch, and use the prediction error to correct the output of the future prediction model at each moment, which can further reduce the local prediction error caused by the model mismatch.
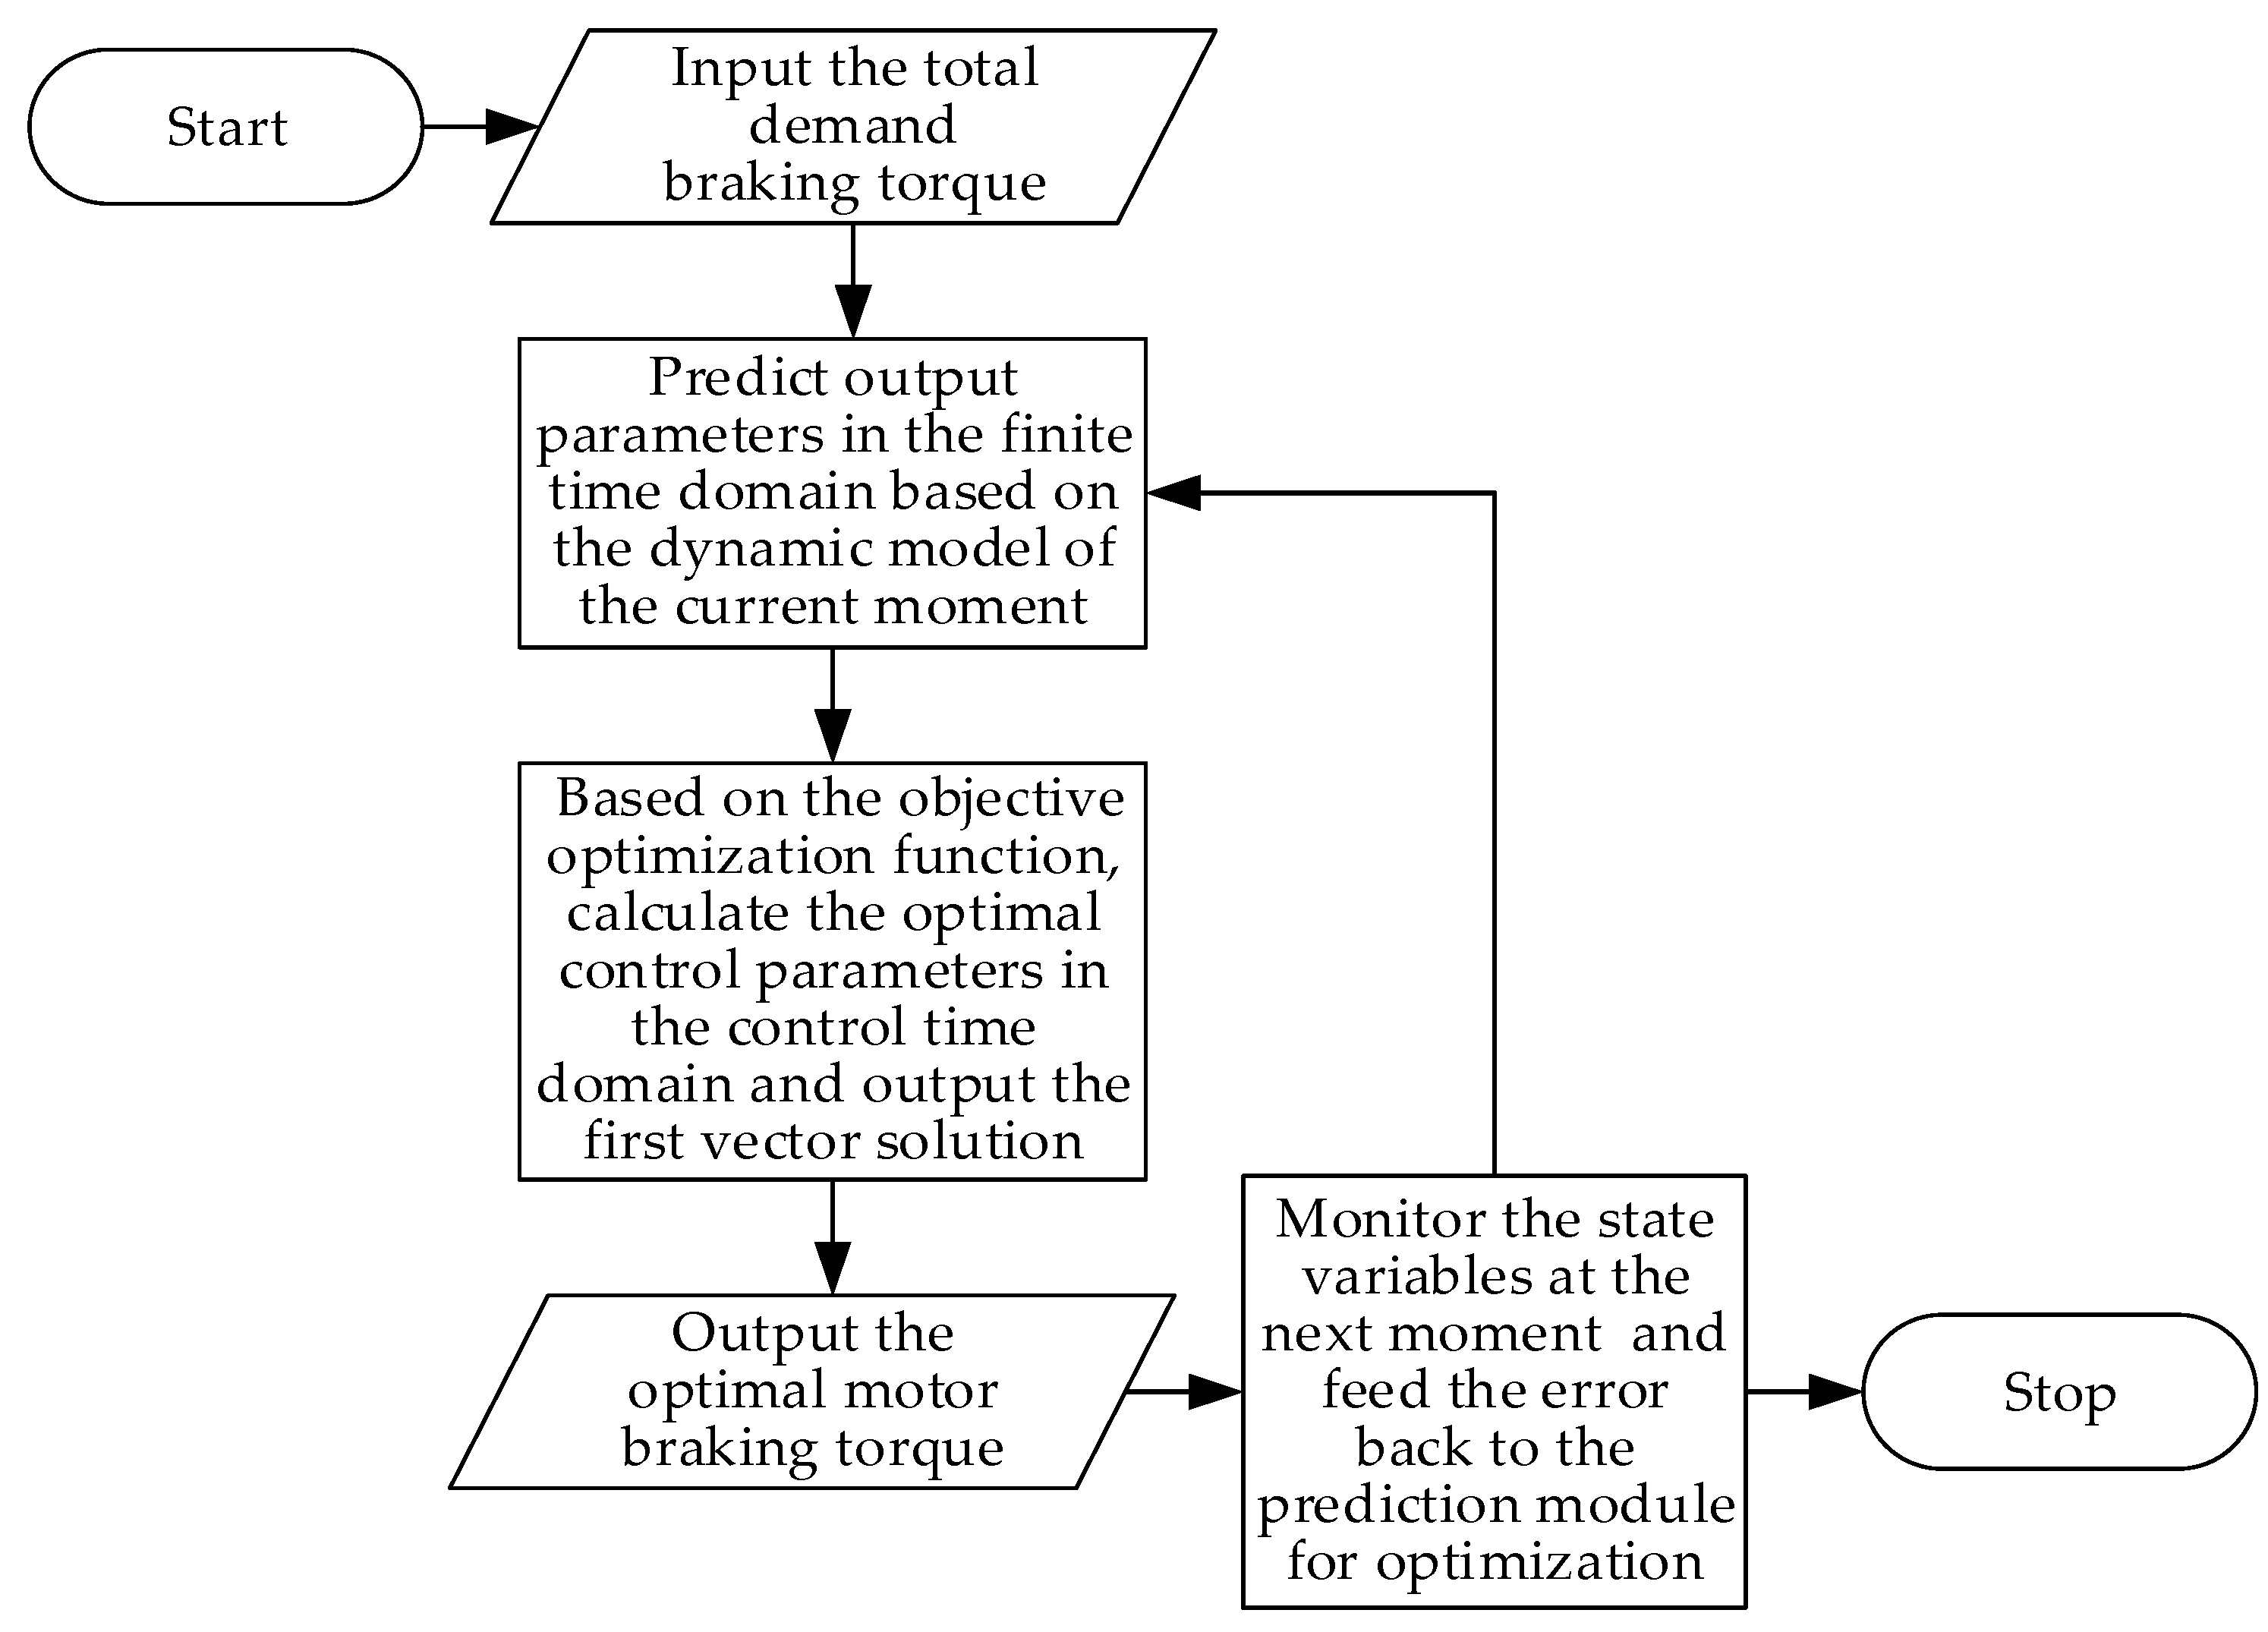
When in the regenerative braking state, the algorithm control flow chart is shown in Figure 2.

2.3. Build Predictive Model

The braking energy recovery process is influenced by the wheels, the hydraulic braking system, the motor, and the battery; to accurately calculate the motion of the wheels, the load transfer of the sprung mass also needs to be predicted. Therefore, the desired predictive model should include models for the sprung mass, tires, hydraulic braking system, motor, and battery. To ensure the timeliness of online rolling optimization, the predictive model should be simplified as much as possible.
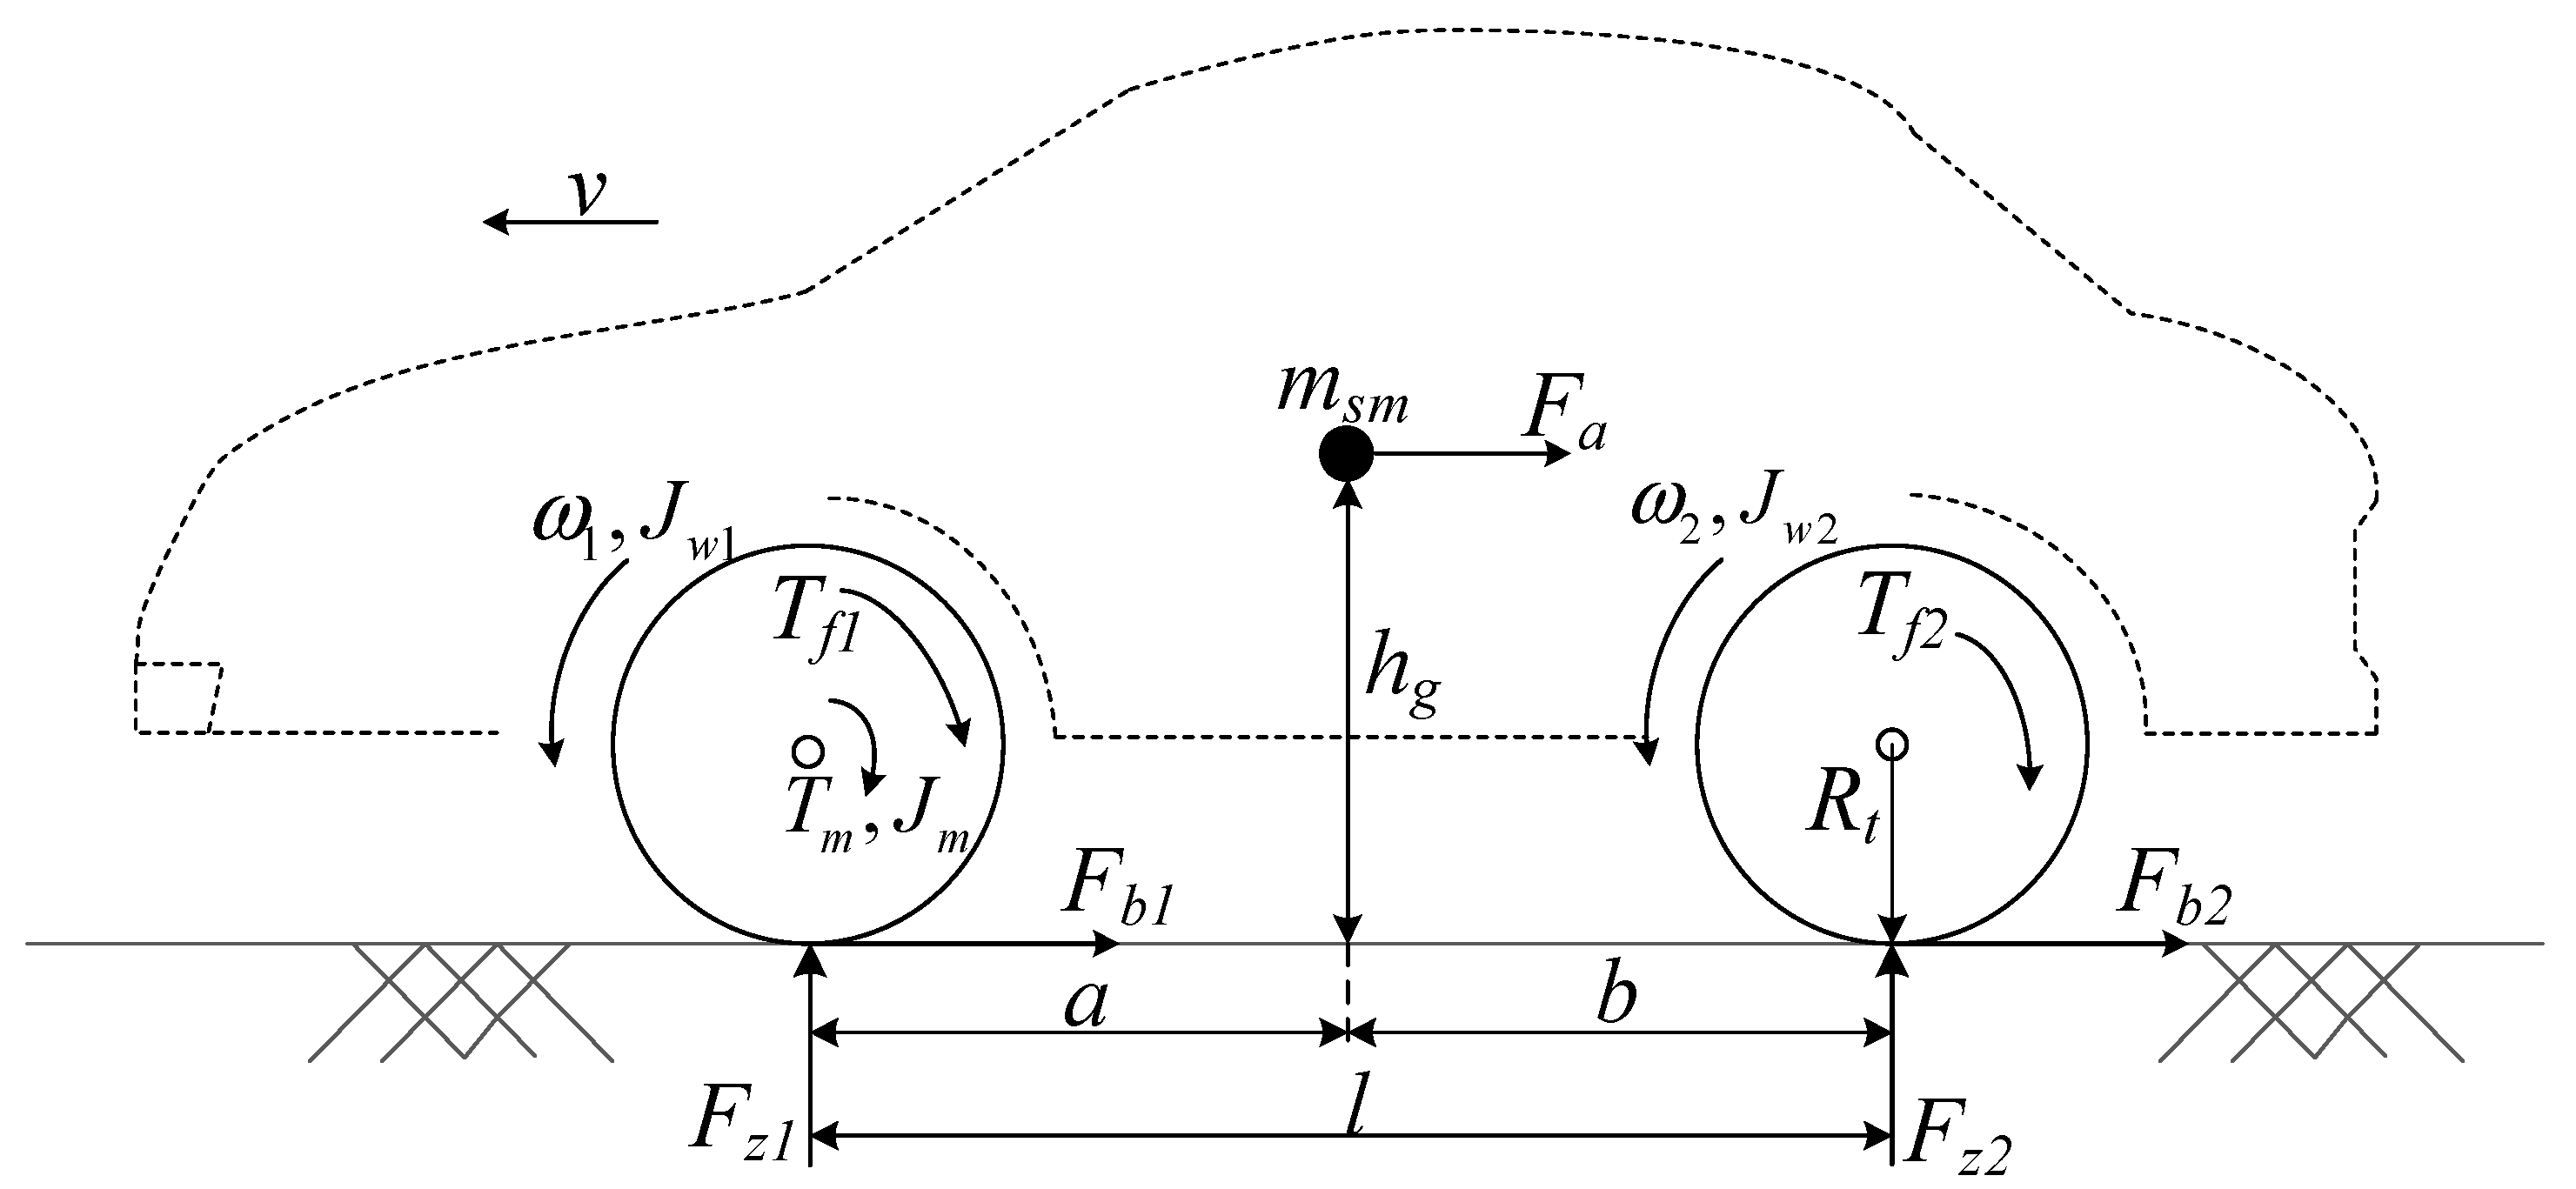
The reference vehicle force analysis curve is shown in Figure 3, and the basic parameters of the vehicle are shown in Table 1.
Where m s m is the sprung mass, F b 1 is the front wheel ground braking force, F b 2 is the rear wheel ground braking force, F a is the air resistance, l is the wheelbase, a is the horizontal distance from the center of the sprung mass to the front axle,   b is the horizontal distance from the center of the sprung mass to the rear axle,   h g is the height of the centroid, ω 1 is the front wheel rotational speed, J w 1 is the front wheel rotational inertia, J m is the motor rotational inertia, i t is the total rotation ratio,   T m is the motor torque, R t is the tire rolling radius, T f 1 is the front wheel friction braking torque, ω 2 is the rear wheel rotational speed, J w 2 is the rear wheel rotational inertia, and T f 2 is the rear wheel friction braking torque.
The sprung mass is modeled as a planar single degree of freedom model. The sprung mass moves along a straight line with velocity v. Its motion equation is:
m s m v ˙ = F b 1 + F b 2 F a
The equation of air resistance is:
F a = 1 2 C d A F ρ a v 2
where C d is the air resistance coefficient, A F is the windward area, and ρ a is air density.
F z 1 = m s m g l ( b v ˙ g h g )
F z 2 = m s m g l ( a + v ˙ g h g )
where g is gravity.
Changes in vertical load and slip rate affect the longitudinal force of the tire, and to more accurately reflect this one, the Pacejka model is used to model the tire. So, regarding the relationship between the tire longitudinal force and the slip rate, the vertical load can be expressed as:
F b i = K D s i n ( K C t a n 1 { K B s i K E [ K B s i tan 1 ( K B s i ) ] } ) F z i
where K B , K C , K D , and K E , the coefficients of the Pacejka model, are constants, F z i is the vertical load of each wheel, and s i is the slip rate.
s i = ω i R t v 1
The slip rate is related to the rotational speed and longitudinal speed of the wheel. Assuming that the wheel is rigidly connected to the sprung mass, its longitudinal speed is the same as the sprung mass and the rotational speed can be calculated from the torque acting on the wheel and its rotational inertia. The front wheel is the driving wheel and is subjected to the torque formed by the motor torque, friction braking torque, and ground-braking force acting on the wheel, so the motion equation of the front wheel can be expressed as follows:
( J w 1 + J m 2 i t 2 ) ω 1 ˙ = 1 2 ( i t T m + R t F b 1 T f 1 )
The rear wheel is the driven wheel, so the applied torque does not include the motor torque. Assuming that the front and rear wheels have the same rolling radius, the motion equation of the rear wheel can be expressed as:
J w 2 ω 2 ˙ = 1 2 ( R t F b 2 T f 2 )
Because the friction braking torque ratio of the front and rear wheel brakes is constant, the driven wheel motion equation can also be expressed as:
J w 2 ω 2 ˙ = 1 2 [ R t F b 2 ( 1 β ) T f 1 β ]
The total braking demand torque T t o t a l is equal to the sum of the total friction braking torque and the motor braking torque; the formula is:
T m + T f 1 + ( 1 β ) T f 1 β = T t o t a l
The total braking demand torque is obtained through the braking intent recognition module, and it is a constant while solving for the optimization results. Therefore, the front wheel friction braking torque can also be expressed by T m ; the relationship equation is:
T f 1 = ( T t o t a l T m ) β
By establishing the relationship between the friction braking torque and the motor braking torque, the input dimension of the model can be reduced and the optimization problem can be simplified.
The front wheel is rigidly connected to the drive motor through the transmission system, so the motor speed is known from the front wheel speed; the relationship equation is:
ω m = i t ω 1
When the speed and torque are given, the motor output current is:
I m = T m ω m L o s s ( T m , ω m ) V a c c
where L o s s ( T m , ω m ) is the power loss of the motor, which can be obtained by bench testing the motor at different speeds and torques; V a c c is the voltage of the power battery, which is related to the battery current and state of charge (SOC), but for each control process, the battery voltage does not change much, so V a c c is considered as a constant.
To apply the above model to the NMPC algorithm, it needs to be discretized. With the sampling period of Δt, the discretized model is:
v ( k + 1 ) = Δ t m [ F b 1 ( k ) + F b 2 ( k ) F a ( k ) ] + v ( k )
ω 1 ( k + 1 ) = Δ t J w 1 + J m 2 i t 2 [ i t T m ( k ) + R t F b 1 ( k ) T f 1 ( k ) ] + ω 1 ( k )
ω 2 ( k + 1 ) = Δ t J w 2 [ R t F b 2 ( k ) T f 2 ( k ) ] + ω 2 ( k )
The air resistance after discretization is:
F a ( k ) = 1 2 C d A F ρ a v ( k ) 2
The front axle load and rear axle load after discretization are:
F z 1 ( k ) = m s m g l ( b v ( k ) v ( k 1 ) Δ t g h g )
F z 2 ( k ) = m s m g l ( a + v ( k ) v ( k 1 ) Δ t g h g )
The tire longitudinal force after discretization is:
F b i ( k ) = K D s i n ( K C t a n 1 { K B s i ( v ) K E [ K B s i ( v ) t a n 1 ( K B s i ( v ) ) ] } ) F z i ( v )
The slip rate after discretization is:
s i ( k ) = ω i ( k ) R t v ( k ) 1
The motor output current after discretization is:
I m ( k ) = T m ( k ) ω m ( k ) L o s s ( T m ( k ) , ω m ( k ) ) V a c c
The input in the above model is:
u ( k ) = T m ( k )
At the moment k, the input will be optimized online by the NMPC algorithm and the first element of the optimal control sequence will be used as the input to the system at the current moment. The above model involves the state variable at moment k-1, but when k = 0, it does not exist. In practical engineering, the controller can always monitor the state variable online, so when the braking starts, the controller can input the state variable measured at the previous moment as the state variable at moment k-1 into the model, so that the model can work normally.

2.4. Design Optimization Objective Function

The optimization objective function reflects the objective variables and weights that need to be optimized for the optimization problem. The optimization objectives of the control strategy proposed in this paper are the braking energy recovery power, tire slip rate, and motor torque variation. To recover as much braking energy as possible, the braking energy recovery power should be increased as much as possible while ensuring that the tire slip rate is within the safe range. Throughout the braking process, the braking torque is provided by both the motor and the friction braking system. The motor braking torque can be changed quickly by adjusting the current, but the change rate of the friction braking torque is smaller. Therefore, the change of the motor torque should be as small as possible to ensure smooth deceleration during the braking process.
According to the above optimization objectives, the optimization objective function can be expressed as:
J ( k ) = w u i = 0 h c 1 | Δ u k | + w s i = 1 h c s 1 ( k + i | k ) w P i = 0 h c 1 P m ( k + i | k )
where Δ u k is the motor torque variation at moment k , s 1 ( k + i | k ) is the slip rate at moment k + i that is predicted at moment k , and P m ( k + i | k ) is the braking energy recovery power at moment k + i that is predicted at moment k .
Since the motor braking torque is superimposed on the front wheels, which corresponds to a reduced slope of the β line, the front wheels are more likely to hold and the rear wheels are less likely to hold, so only the slip rate of the front wheels is optimized. w u , w s , and w P , the weights of each, are constants. P m is the braking energy recovery power that can be expressed as:
P m = T m ω m L o s s ( T m , ω m )
In the model prediction process, the prediction time domain h p is usually longer than the control time domain h c , and inputs beyond the control time domain h c are still using the last input element of h c . Since the vehicle dynamics system is very sensitive to changes in inputs, inputs beyond h c are not helpful to the optimization of the system, so the prediction time domain in this paper is the same as the control time domain to ensure that there is an independent control input at each moment.

2.5. Design Constraints

During the braking process, the motor torque is also influenced by the motor external characteristics and the charging current limit of the power battery. In engineering, motor drives usually limit the motor torque based on the motor external characteristic curve but do not consider the effect of battery charging current limit. Therefore, when the control strategy is designed, if the above limitation is still not considered, it will cause damage to the power battery or cause a serious mismatch in the model. To avoid the above situation, the above limitation should be considered when designing the regenerative braking control strategy. So, the constraints on the state variables and inputs of the system can be expressed as:
T m _ m i n ( ω m ) T m 0
s 1 s m a x
I m I m a x
where T m m i n ( ω m ) is the maximum braking force of the motor on the external characteristic curve of the fourth quadrant; s m a x , the limit of the wheel slip rate, is a constant; and I m a x is the charge current limit of the battery, which varies with SOC and temperature. Since there is an order of magnitude difference between the time duration of a control moment and the time duration of the various time of I m a x , it can be considered as a constant when solving the optimization problem.

3. Simulation Verification Based on Matlab/Simulink

3.1. Build Simulation Model

The whole vehicle simulation model is established based on the Simscape toolbox in Matlab/Simulink to test the effectiveness of the above NMPC-based cooperative braking algorithm. The simulation model includes the driving cycle, longitudinal driver, environment, controllers, passenger car, and visualization modules.
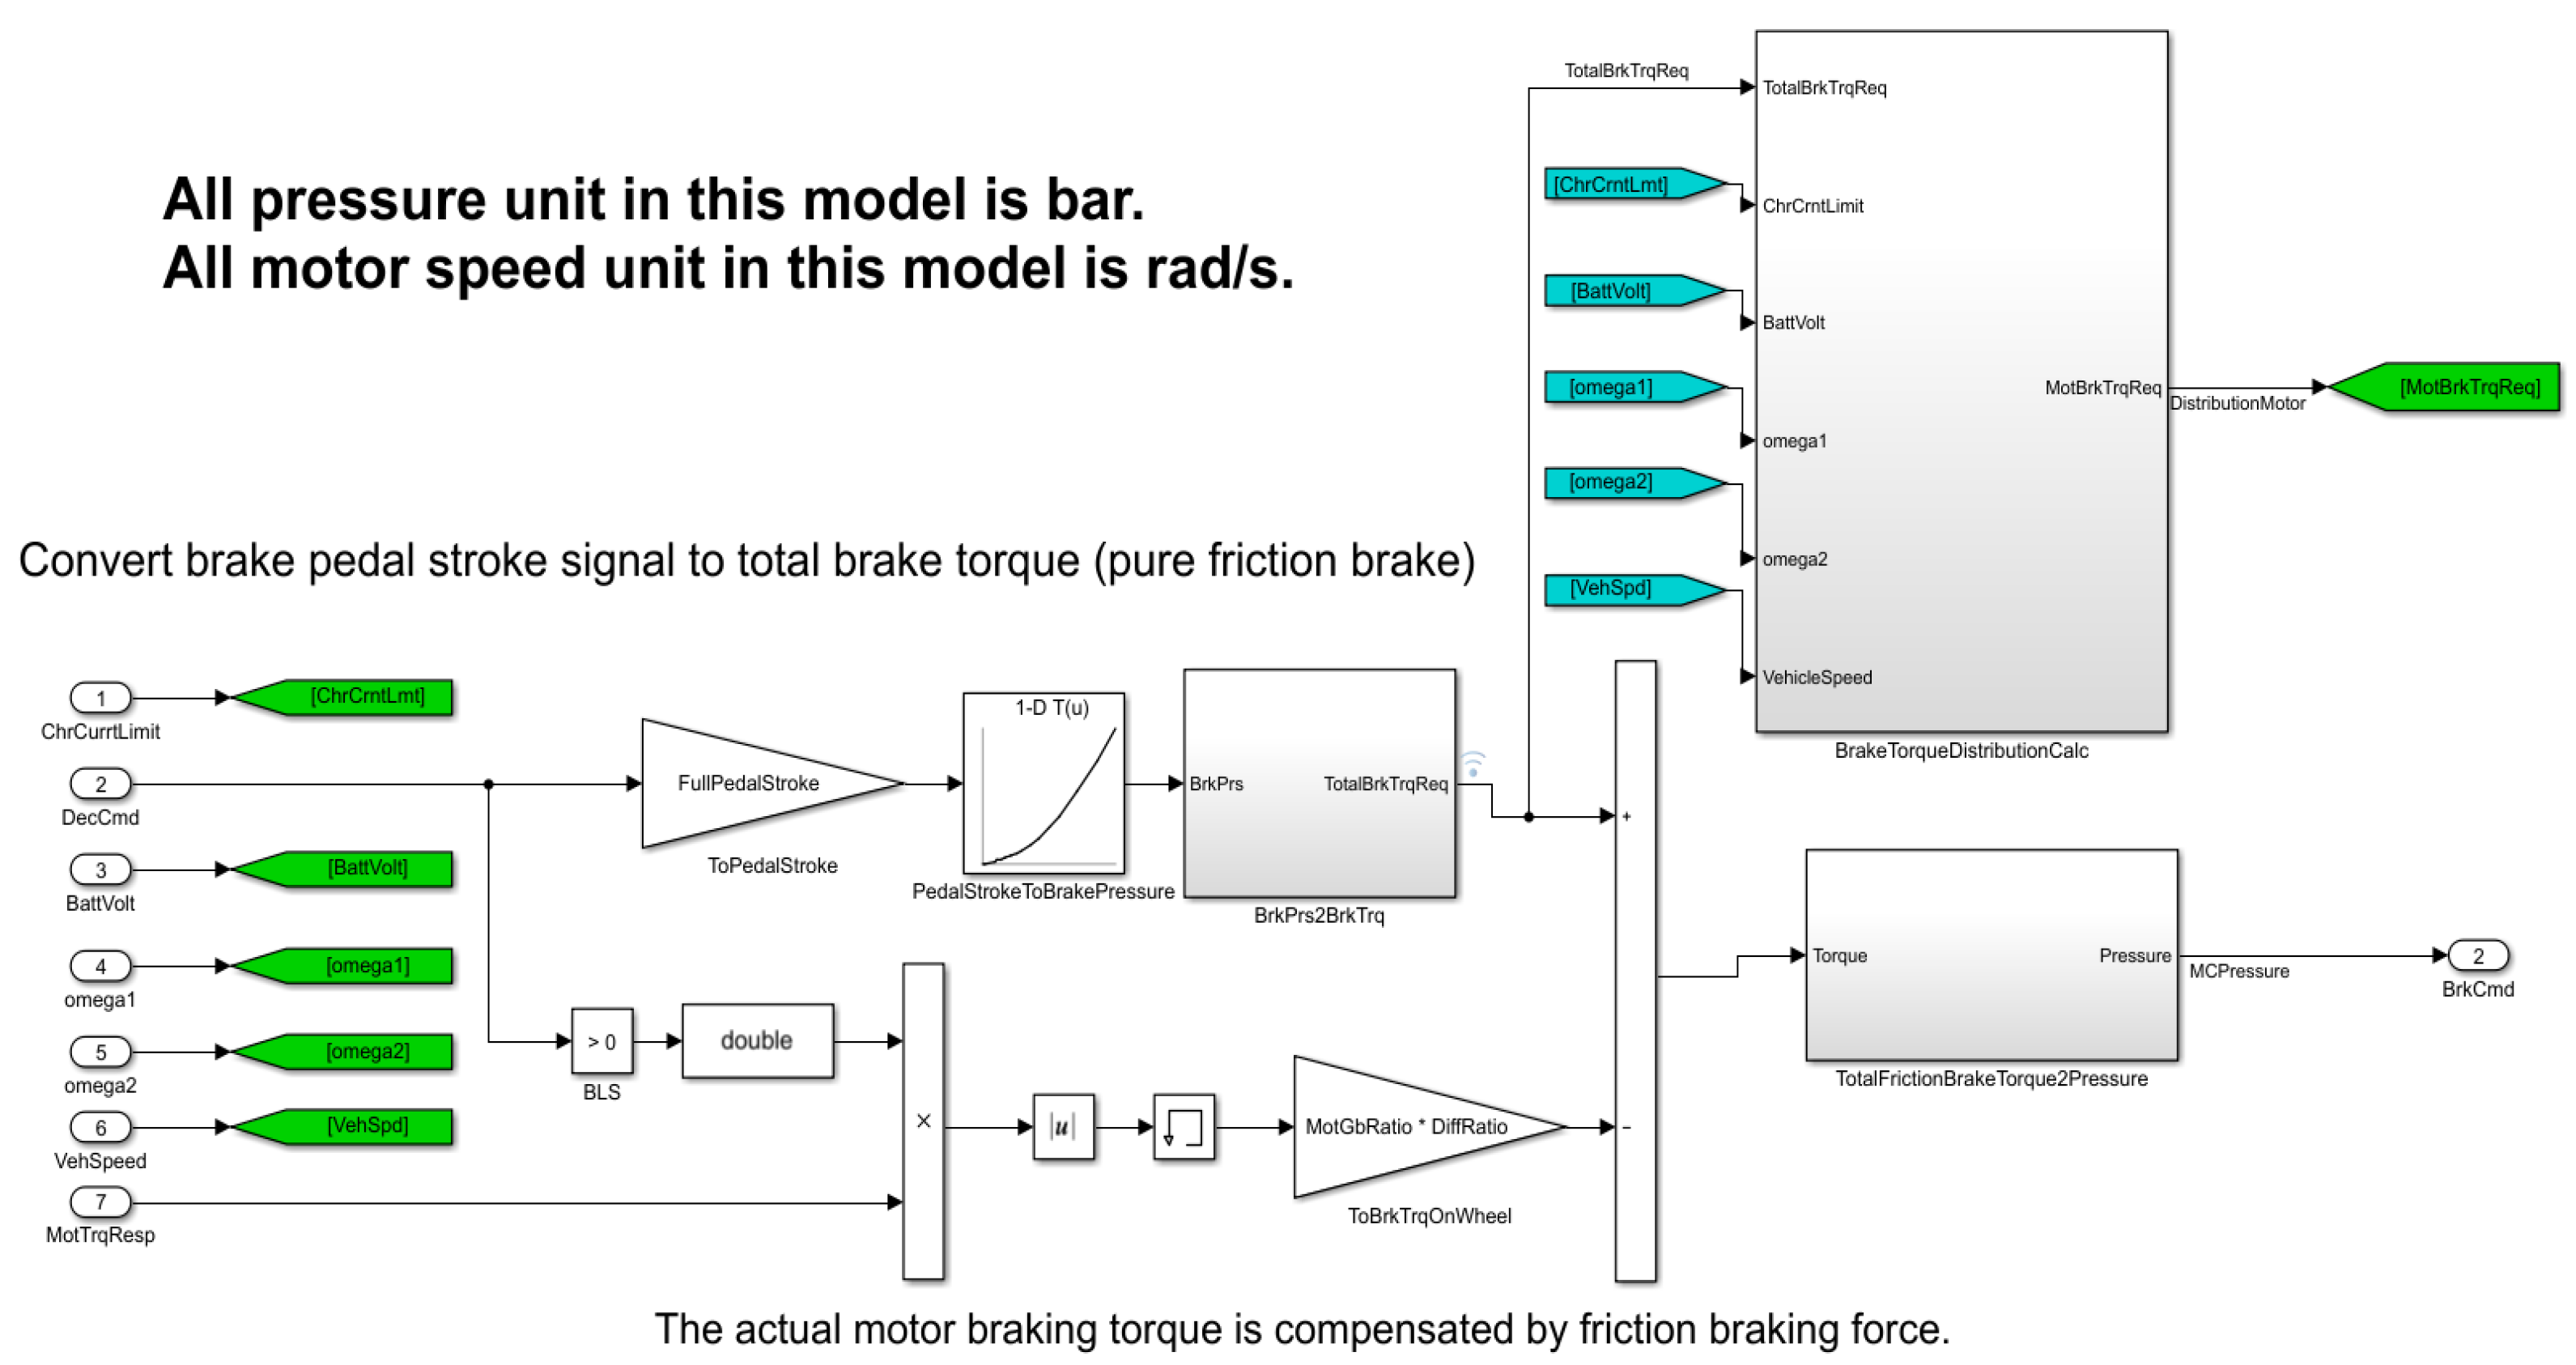
The original controller module included only the powertrain controller. To verify the above NMPC-based cooperative braking algorithm, a brake controller with brake energy recovery was built independently, as shown in Figure 4.
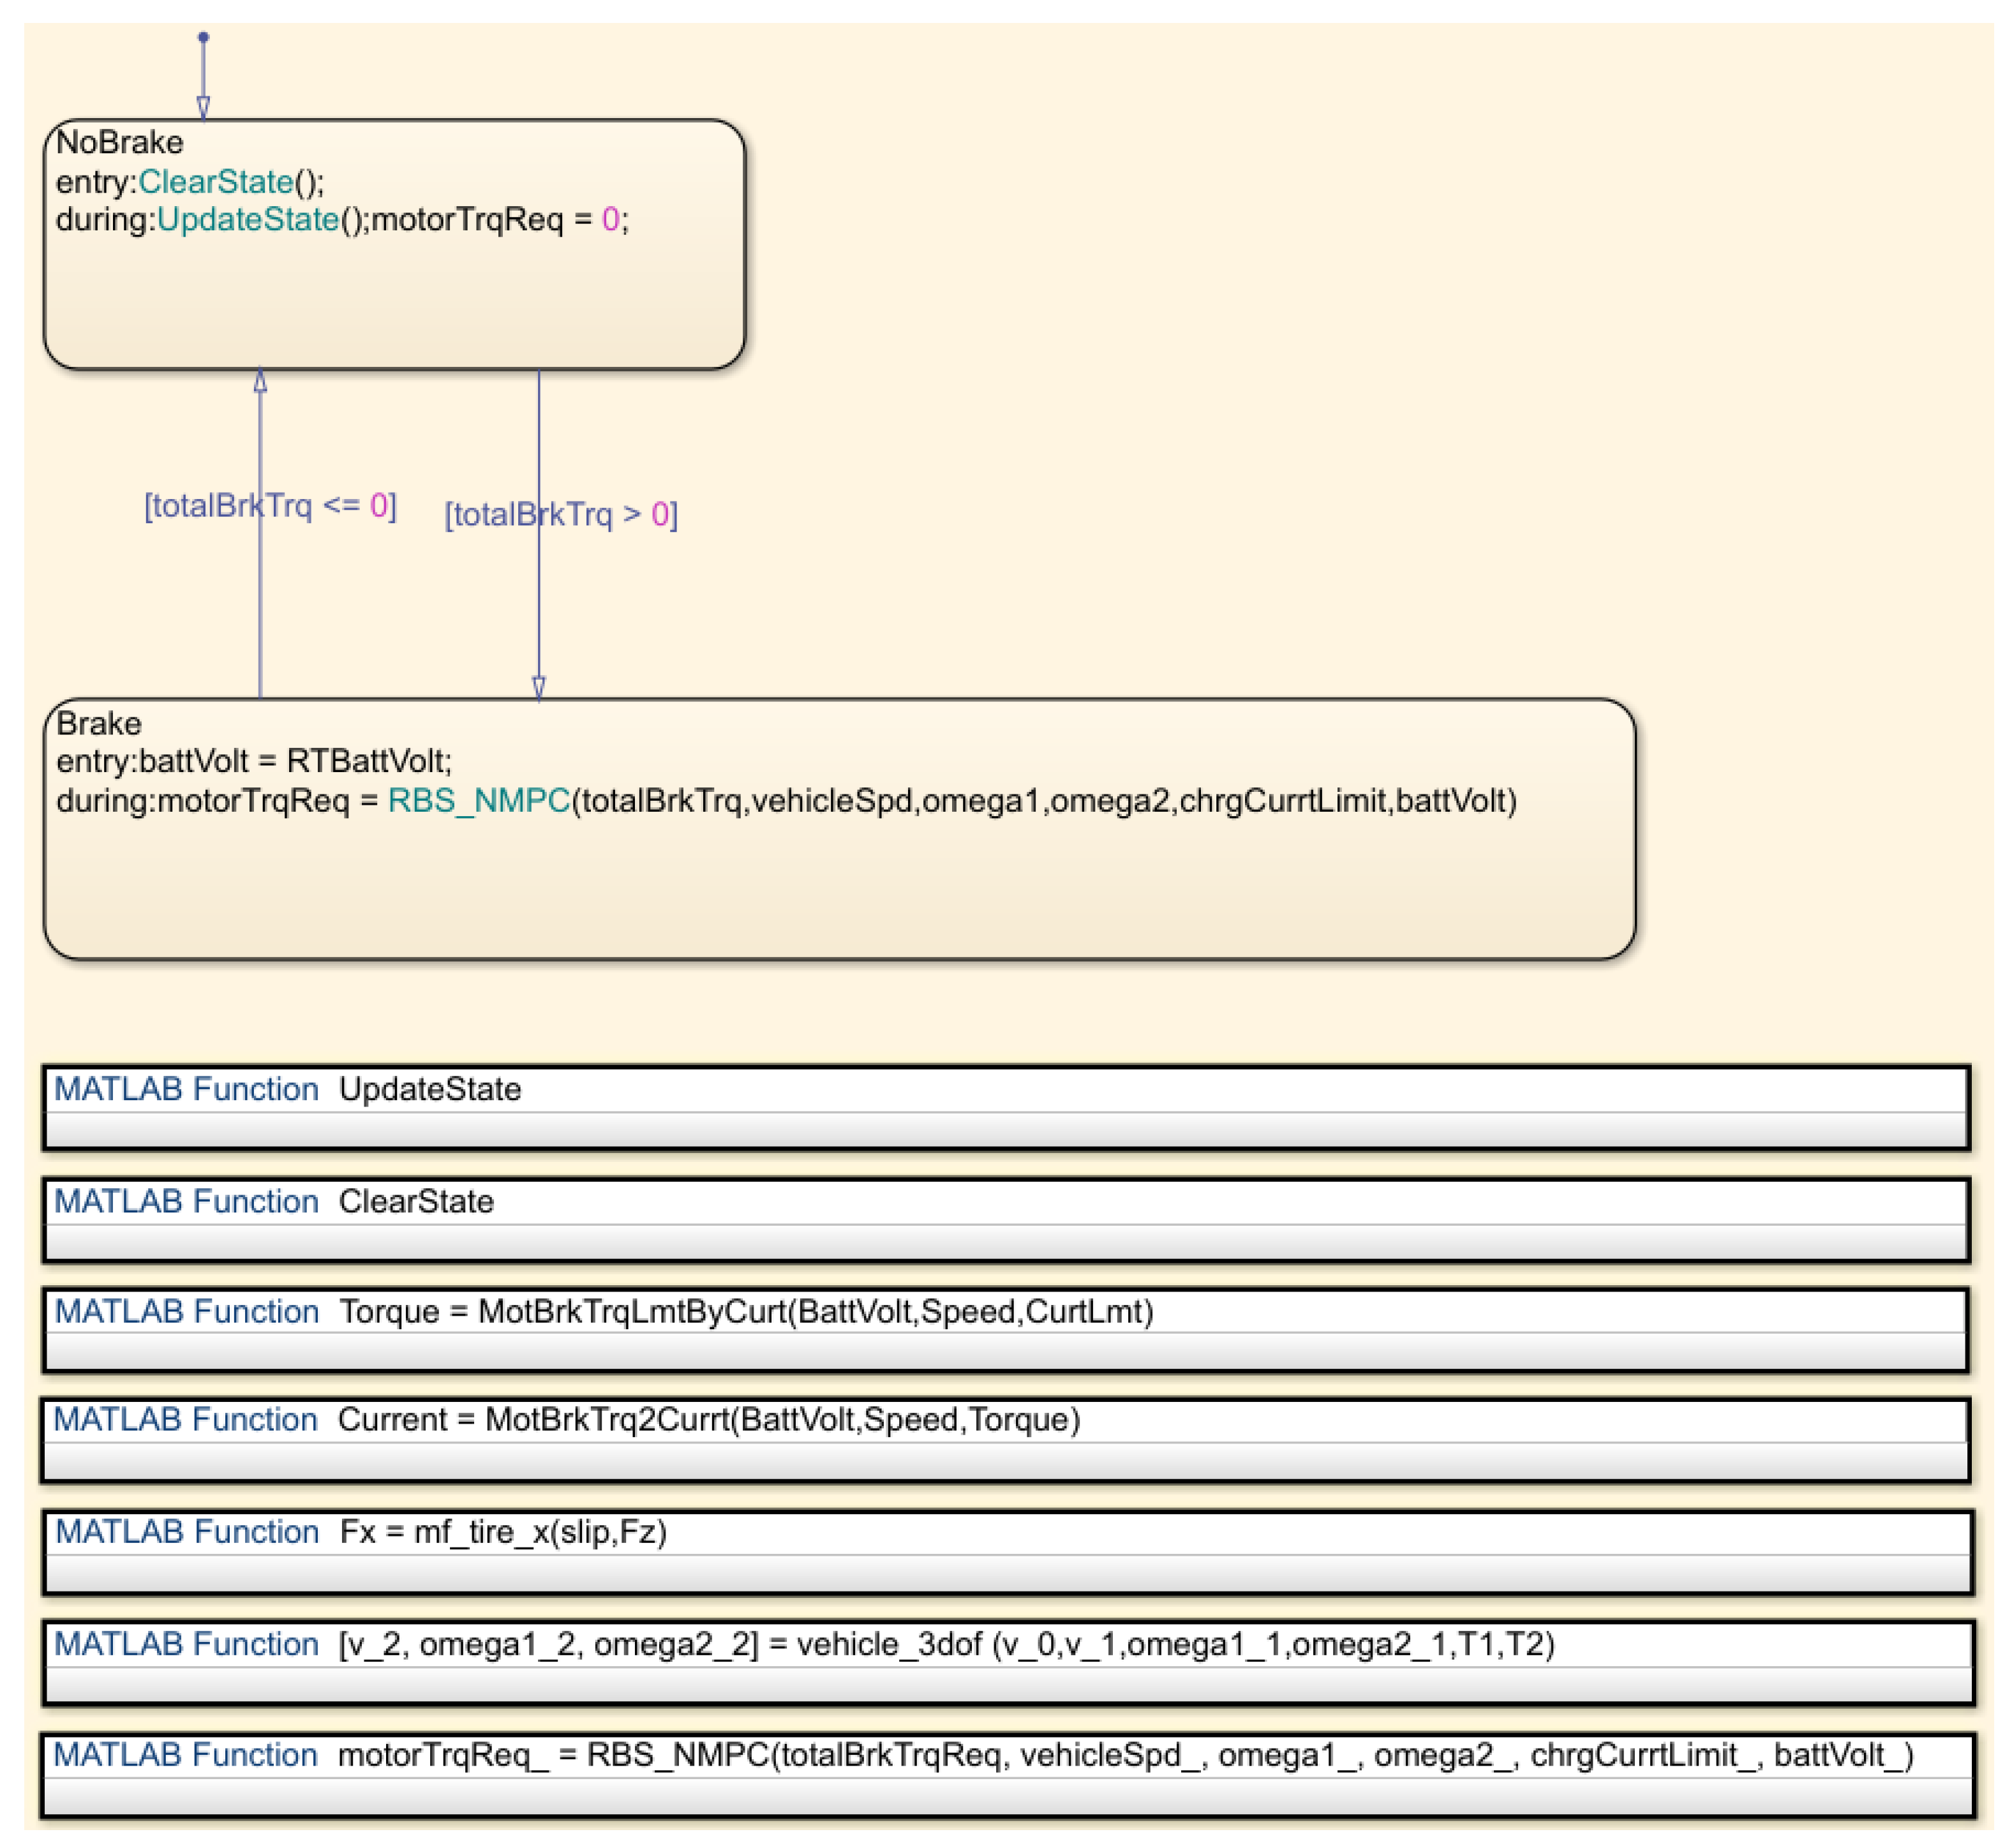
The brake controller model includes a sub-model based on the NMPC cooperative braking algorithm, as shown in Figure 5. The input signal is the total braking demand torque, and the optimal motor braking torque is output through the model prediction and optimal solution procedure of NMPC algorithm, which can achieve a good energy recovery effect while ensuring braking safety, and at the same time, the vehicle speed and front and rear wheel speeds are fed back to NMPC algorithm for rolling optimization of the prediction model. The optimization objectives are the braking energy recovery power, tire slip rate, and motor torque variation, and the constraints are the motor torque limited by the motor external characteristic curve, power battery charging current, and wheel slip rate limits.

3.2. Simulation and Result Analysis Based on WLTC

The energy recovery effect of the proposed control algorithm will be tested based on WLTC, and the energy recovery effect will be evaluated using the braking energy recovery rate.

3.2.1. Select Driving Cycle

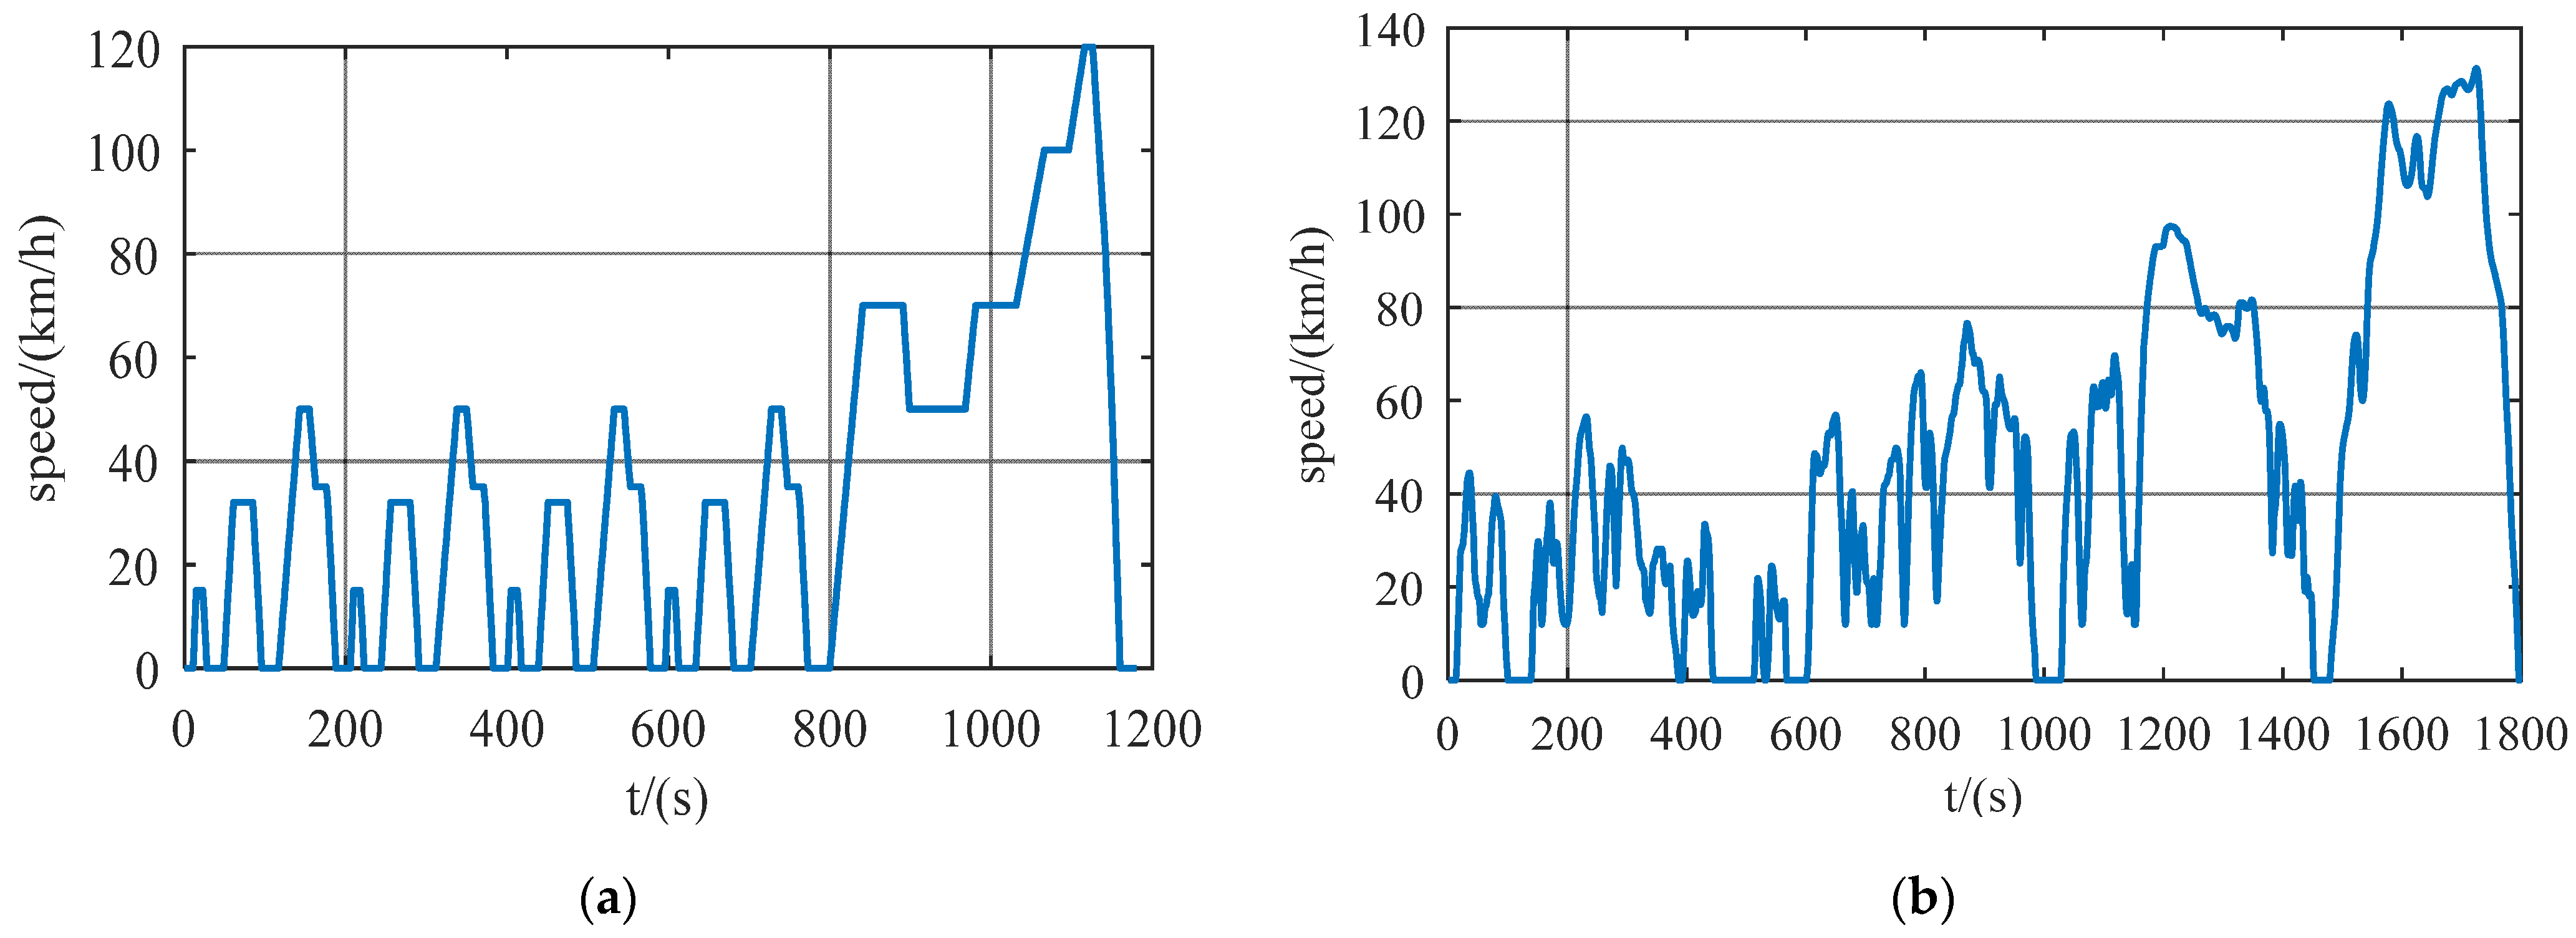
Currently, there are a variety of driving cycles used for vehicle energy efficiency testing in various countries around the world, including NEDC, FTP75, UDDS, and JC08. For China, the evaluation of the regenerative braking system started late and did not develop its test cycle conditions, usually using NEDC as the standard. NEDC is divided into two parts: urban conditions and suburban conditions. Urban conditions consist of four UDC conditions, suburban conditions for one EUDC condition. The target speed curve for NEDC is shown in Figure 6a.
The overall NEDC is relatively stable, and most of the time the vehicle is in a constant speed state. However, NEDC does not take into account the frequent stopping of vehicles in urban traffic jams, there is a large deviation from the actual road traffic in China. Therefore, in recent years, the conditions-testing standard in China is transitioning from NEDC to WLTC. WLTC is a standard jointly developed by Japan, the United States, and the European Union, which is obtained by processing the real driving conditions data collected worldwide. Compared with NEDC, it fully takes into account factors such as vehicle rolling resistance, gearing, and vehicle weight, and its speed fluctuates greatly, with fewer idling conditions and covering a wider speed range, without cyclical acceleration and deceleration, better reflecting the frequent changes in speed under different road congestion states. Therefore, the energy-saving evaluation effect obtained by using WLTC is more practical.
WLTC is divided into four parts: low speed, medium speed, high speed, and super-high speed. Compared with NEDC, its test cycle increases from the 1180 s to 1800 s; the duration of each part is 589 s, 433 s, 455 s, and 323 s, respectively, and the average speed increases from 34 km/h to 46 km/h. WLTC has a longer test period and higher average speed, which is more in line with the actual driving conditions. The broader speed range for the overall performance of the vehicle also puts forward higher requirements. The target speed curve for WLTC is shown in Figure 6b.
Based on the above analysis, WLTC was selected for the simulation test in this paper.

3.2.2. Simulation and Result Analysis

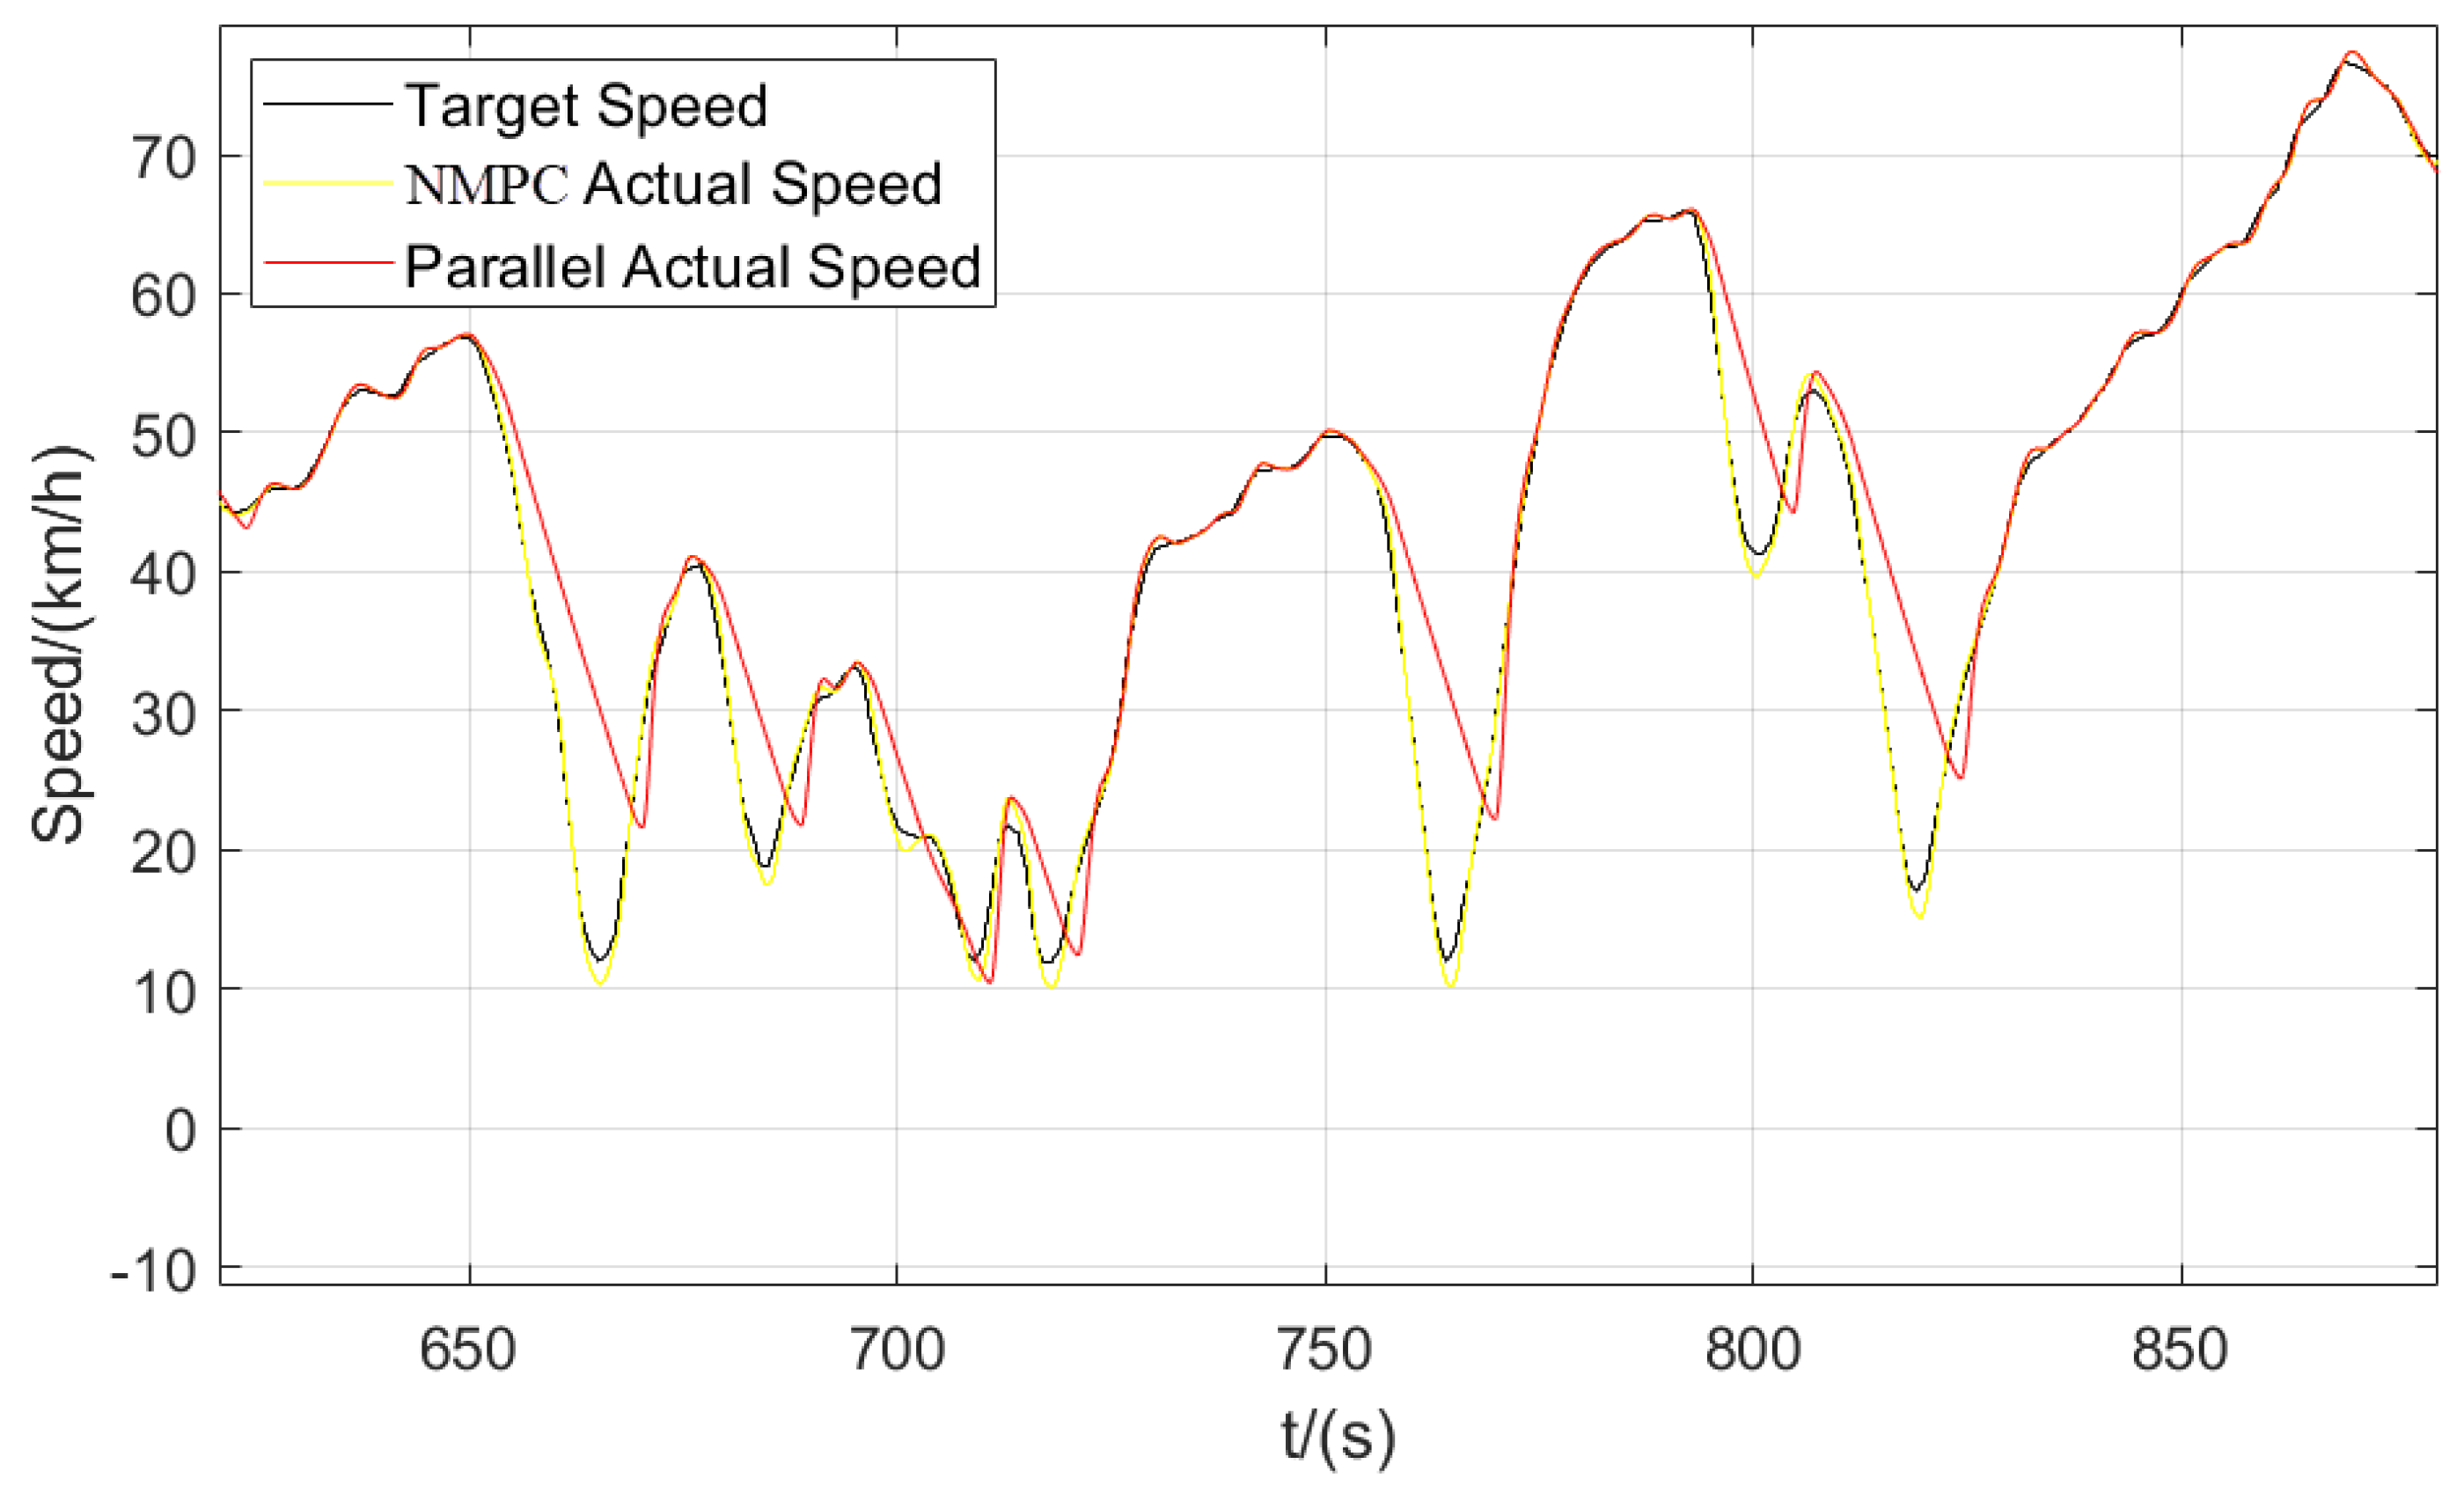
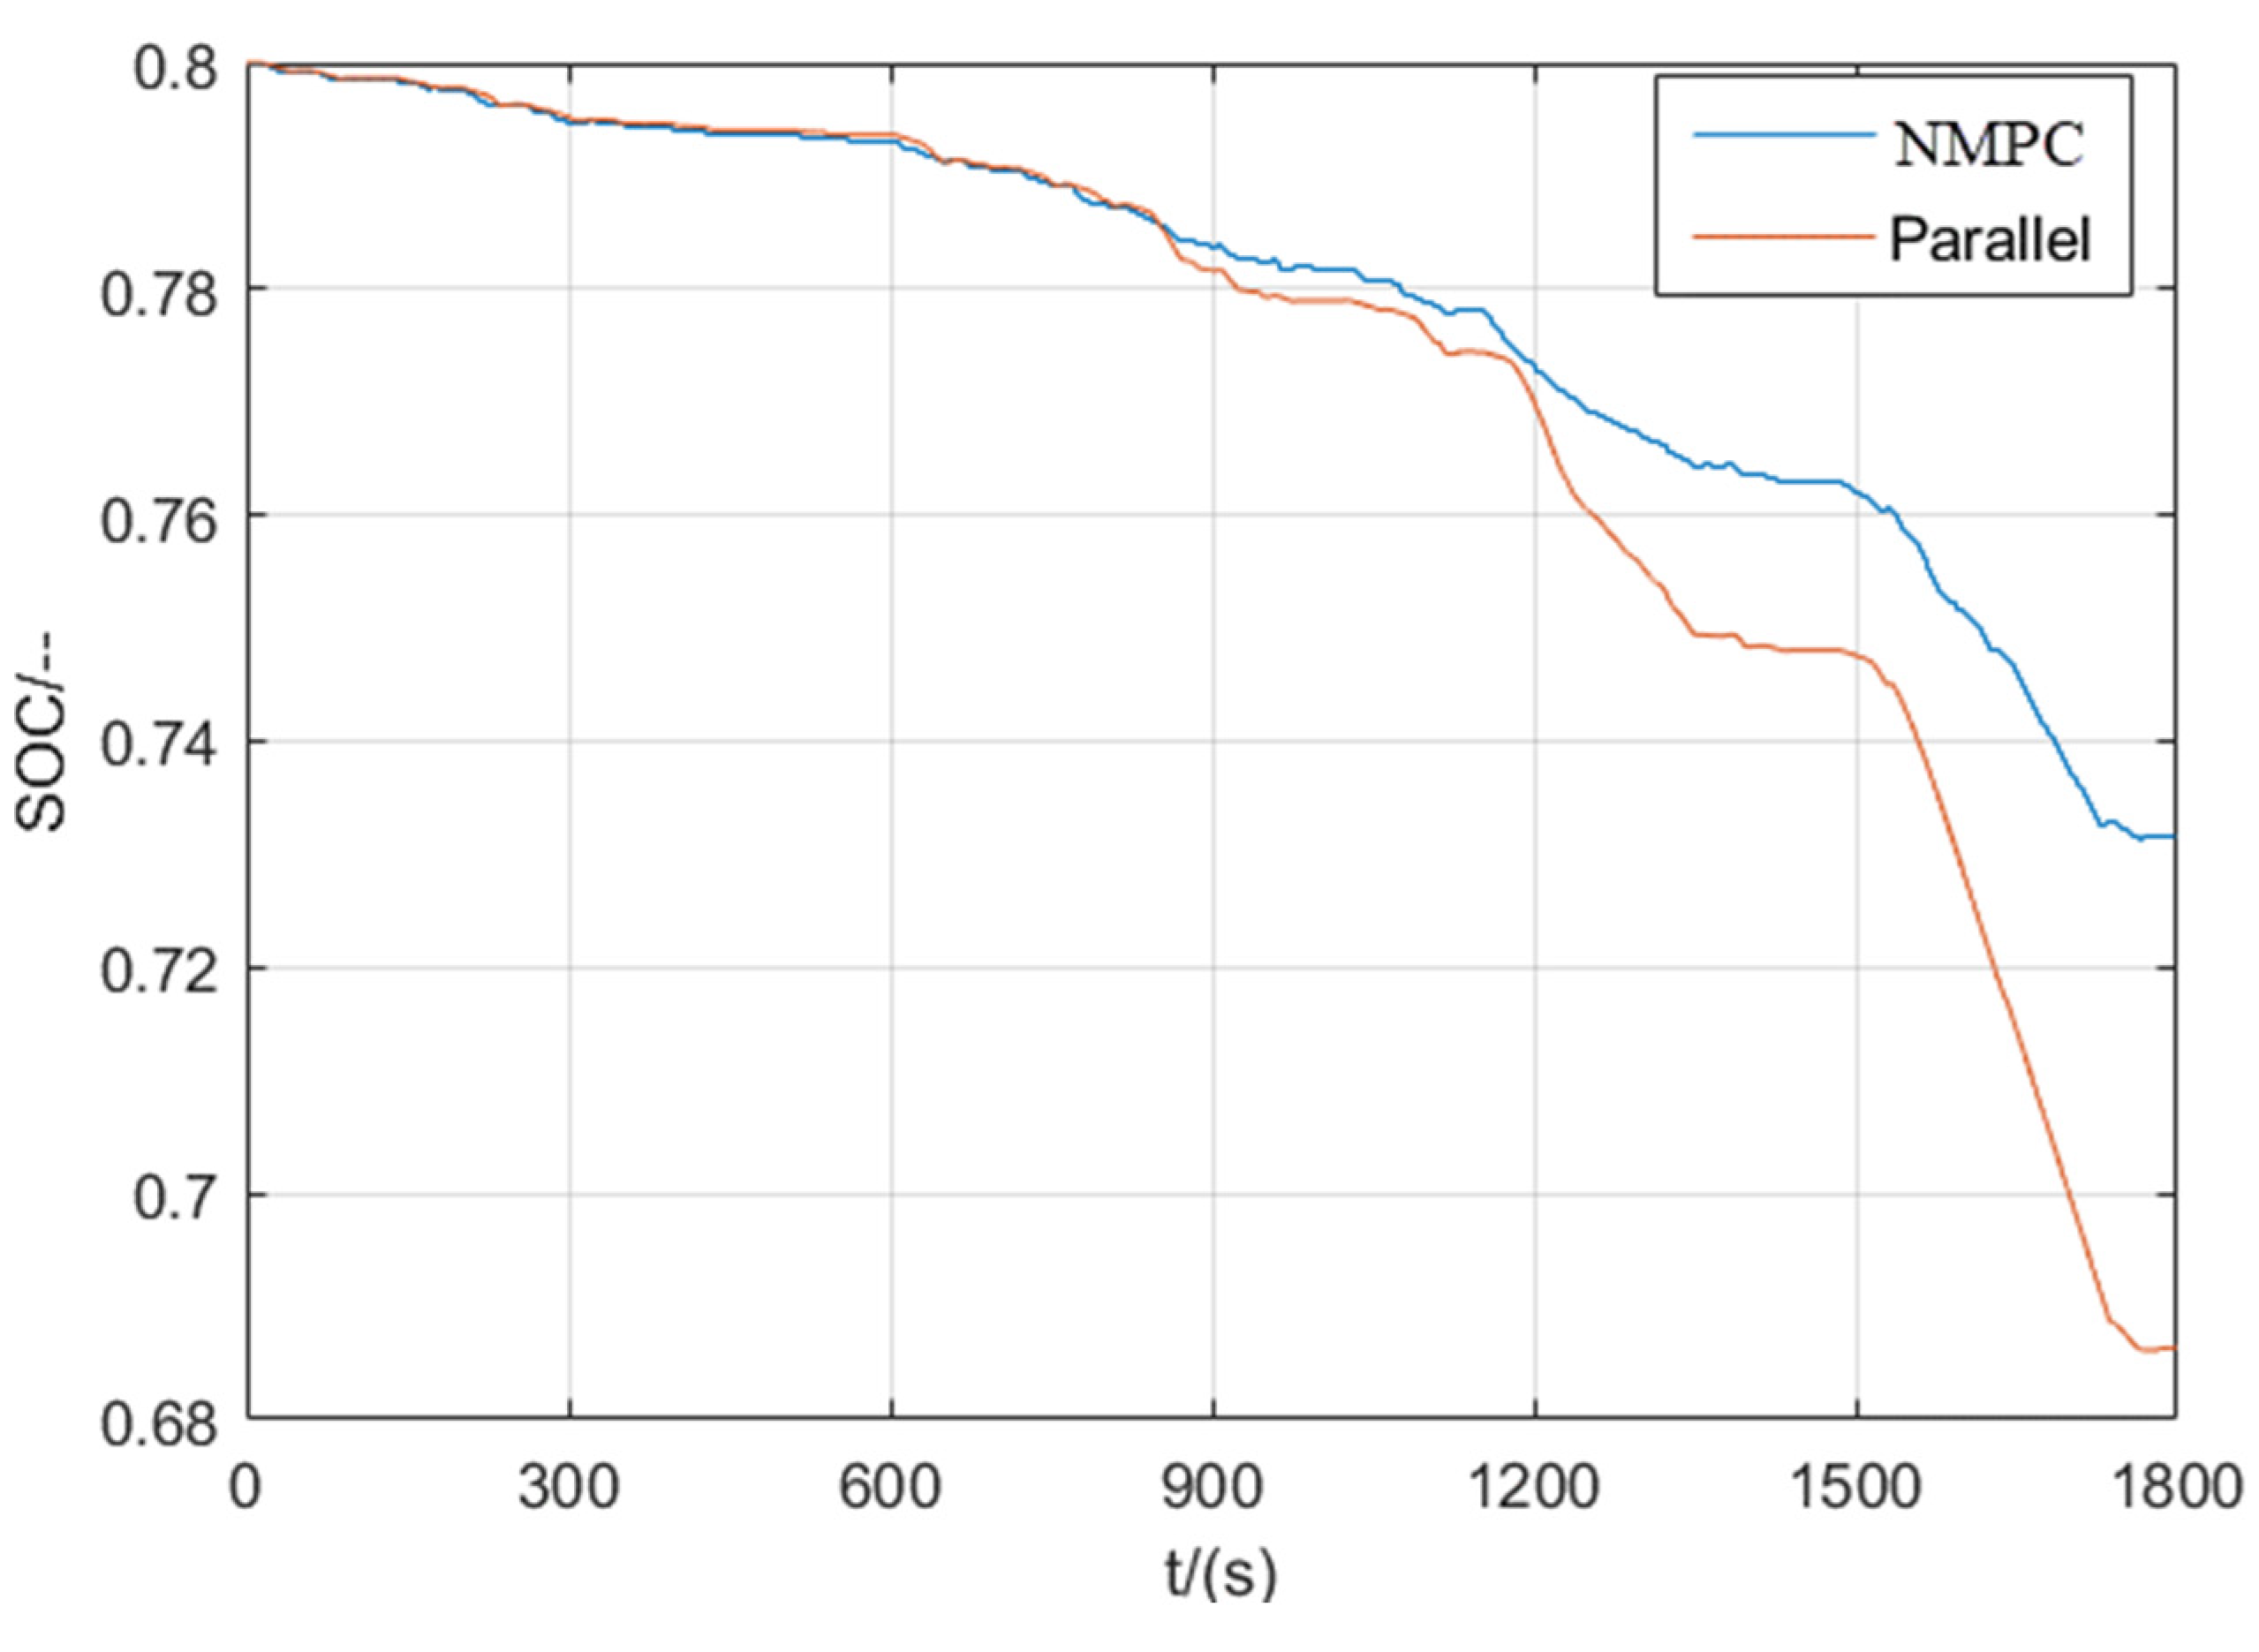
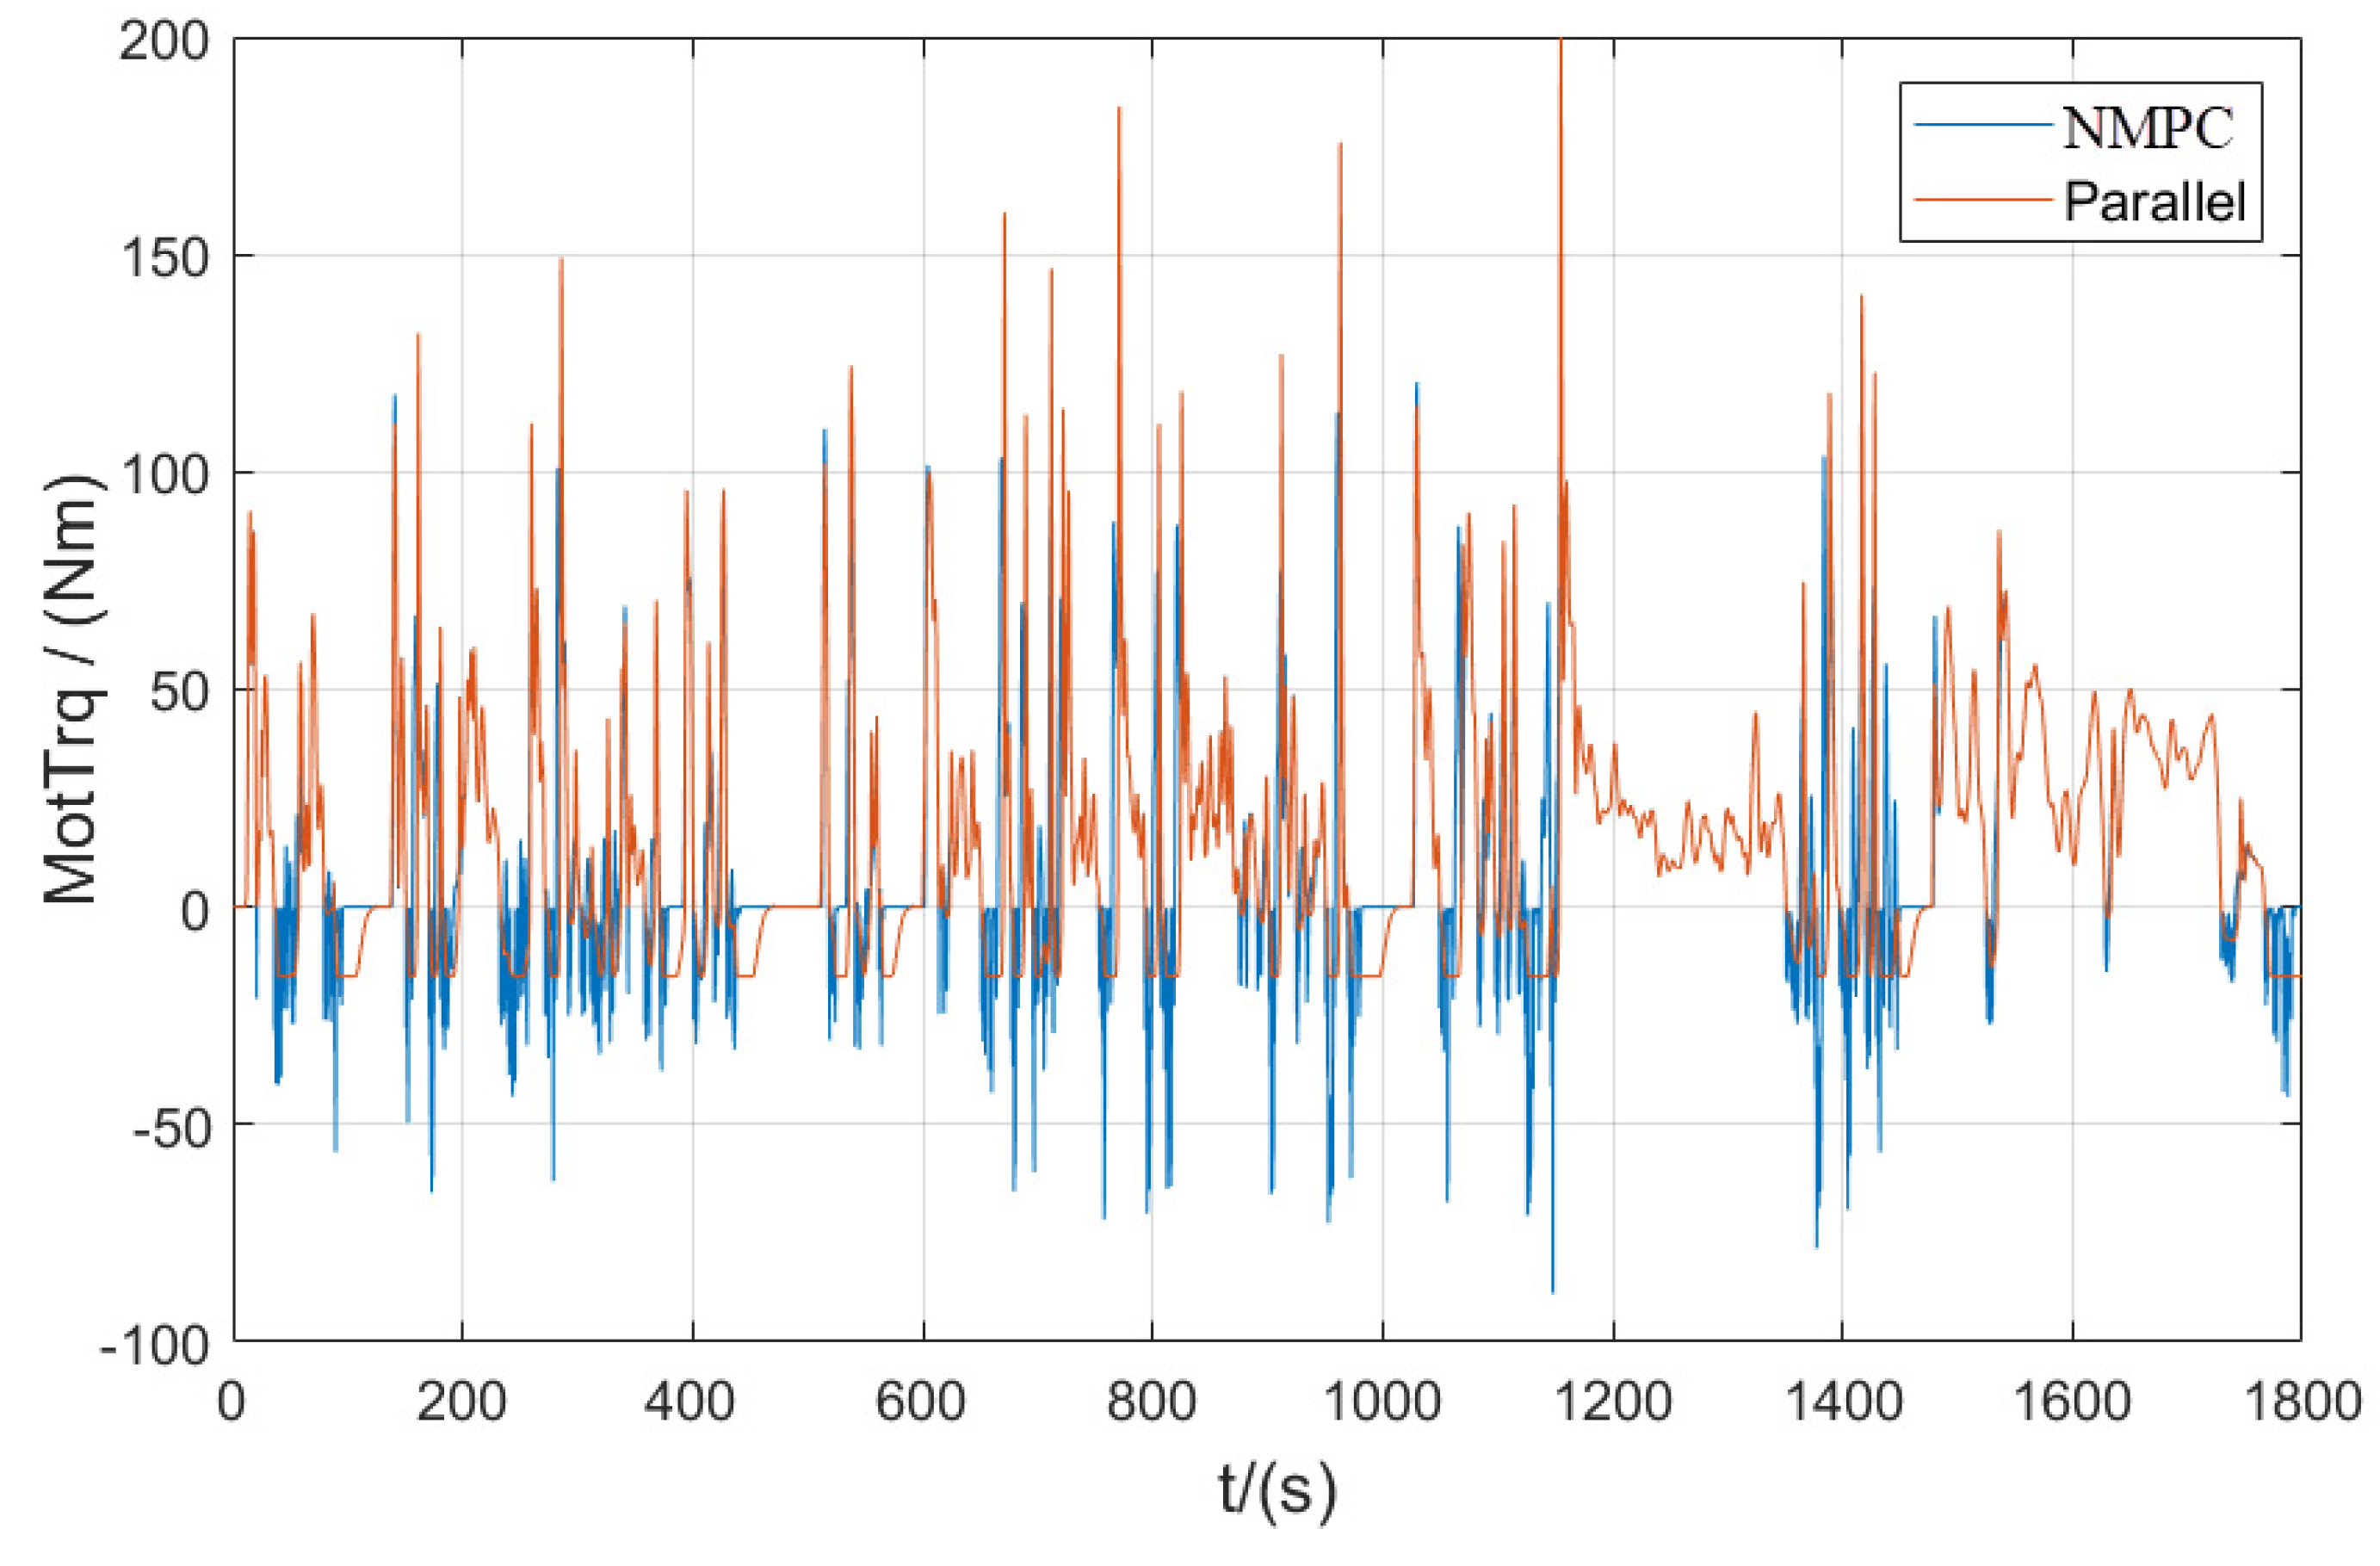
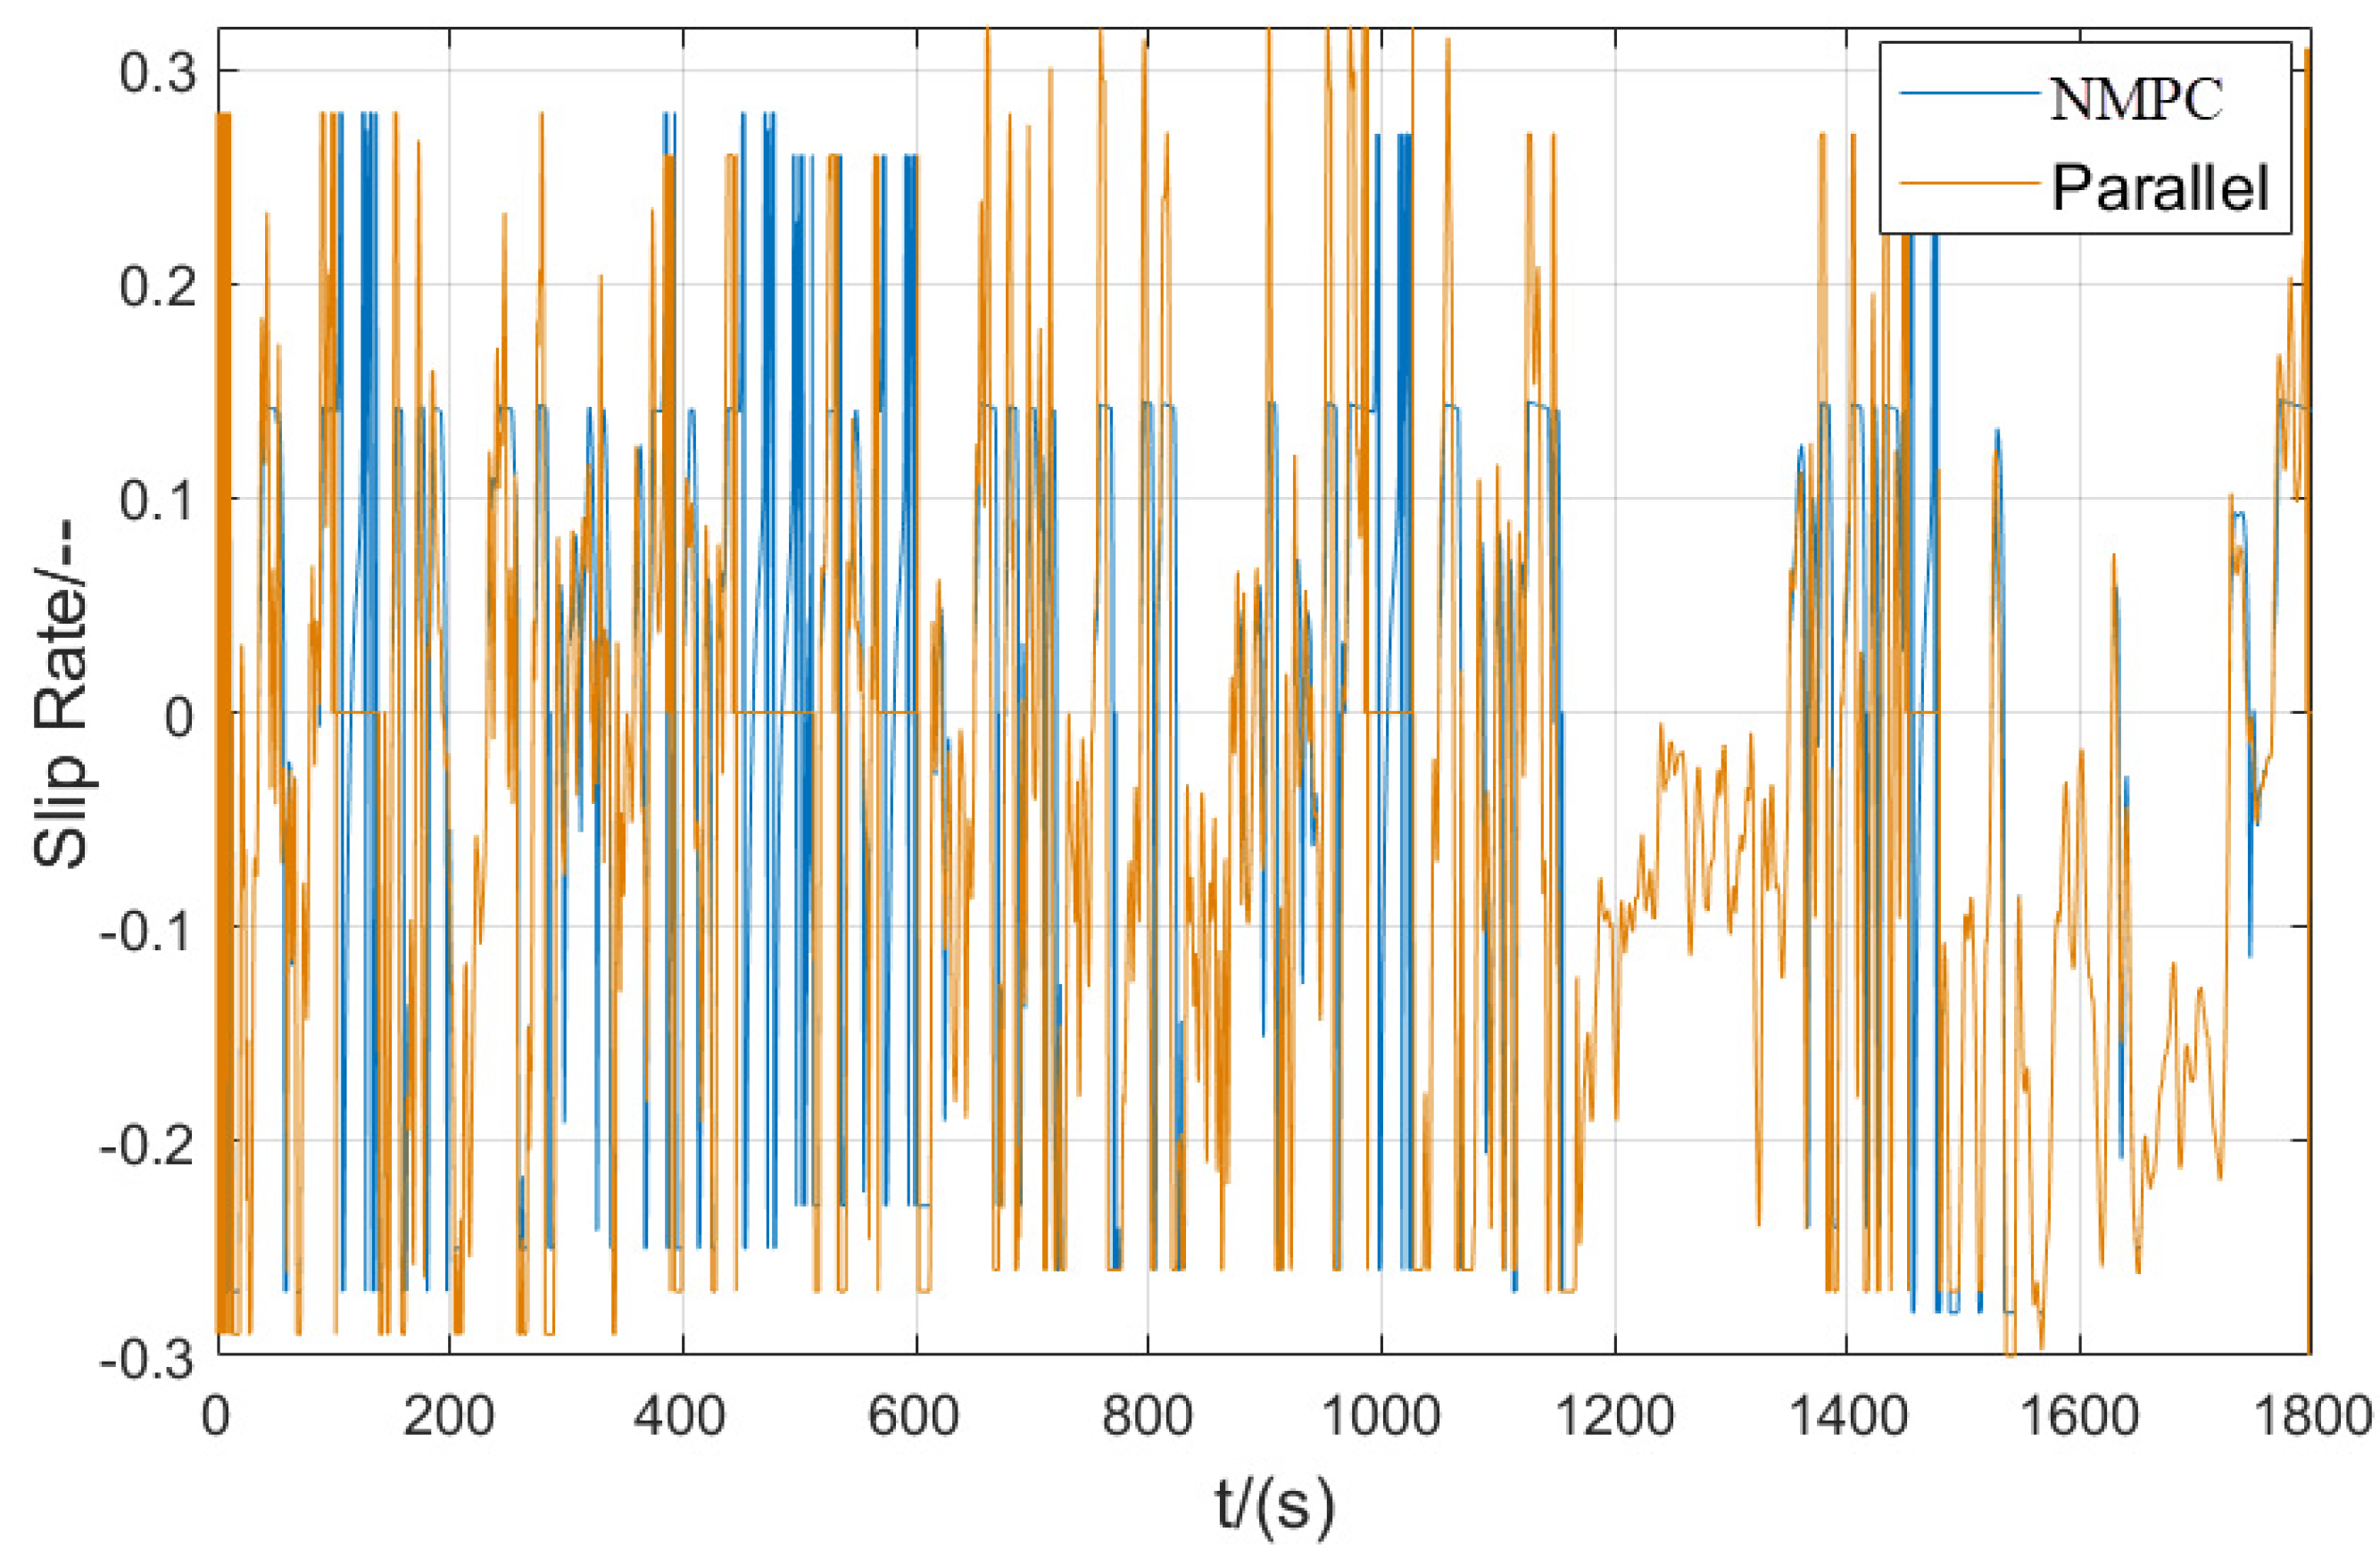
The data from WLTC were input into the simulation model of regenerative braking system with NMPC-based cooperative braking algorithm for testing. To better verify the effectiveness of the proposed algorithm, the comparison test with the parallel control strategy was also performed. The comparison curve of target speed and actual speed is shown in Figure 7 and Figure 8. Setting the initial SOC to 0.8, the battery SOC curve can be obtained, as shown in Figure 9. The motor braking torque curve and slip rate curve are shown in Figure 10 and Figure 11, respectively.
Then, the above-mentioned sets of comparison graphs are analyzed as follows. According to the speed curve, the NMPC algorithm can follow the target velocity better, so its control accuracy and response effect is higher than that of the parallel algorithm. The variation of SOC curve indicated that after finishing an WLTC cycle, the SOC dropped from 80% to 73.2% under the proposed NMPC algorithm. When compared to 68.5% under the parallel algorithm, the difference was 4.7%, so the NMPC algorithm consumes less power. The motor torque curve shows that compared to the parallel strategy, the NMPC-based motor braking torque is higher, up to 90 Nm, and the drive torque spikes are smaller, contributing to smoother motor operation and better comfort. Furthermore, according to the slip rate curve, the NMPC algorithm can better keep the slip rate within the safety interval.
The energy efficiency of the algorithm is also evaluated using the energy recovery rate η r e g , with the following equation:
η r e g   = E r e g   E b r k   × 100 %
where E r e g   is the recovered motor braking energy during the whole cycle, which can be obtained by integrating the charging power P c , and E b r k   is the total energy consumption during the whole cycle, which is the sum of the front wheels braking energy consumption E μ f   , the rear wheels braking energy consumption E μ r   , and the motor braking energy consumption E μ m   . The expressions are as follows:
E r e g   = P c d t = U c I c d t
E b r k   = E μ f   + E μ r   + E μ m   = F μ f u a d t + F μ r u a d t + F μ m u a d t
where U c is the charge voltage, I c is the charge current, F μ f is the front wheels braking force,   F μ r is the rear wheels braking force, F μ m is the motor braking force, and u a is the vehicle speed.
Based on Equations (29)–(31), the calculation module is inserted in Simulink and the results are presented in Table 2.
According to these simulation results, the proposed cooperative braking algorithm can more effectively recover the braking energy than the conventional parallel control strategy, and under the whole WLTC, the energy recovery rate reaches 30.4%, which is higher than 21.1% of the parallel algorithm.
Based on the above analysis, the NMPC algorithm is higher than the parallel algorithm in terms of control accuracy, comfort, safety, and energy saving, which proves the effectiveness of the proposed algorithm.

3.3. Simulation and Result Analysis Based on Single Braking Condition

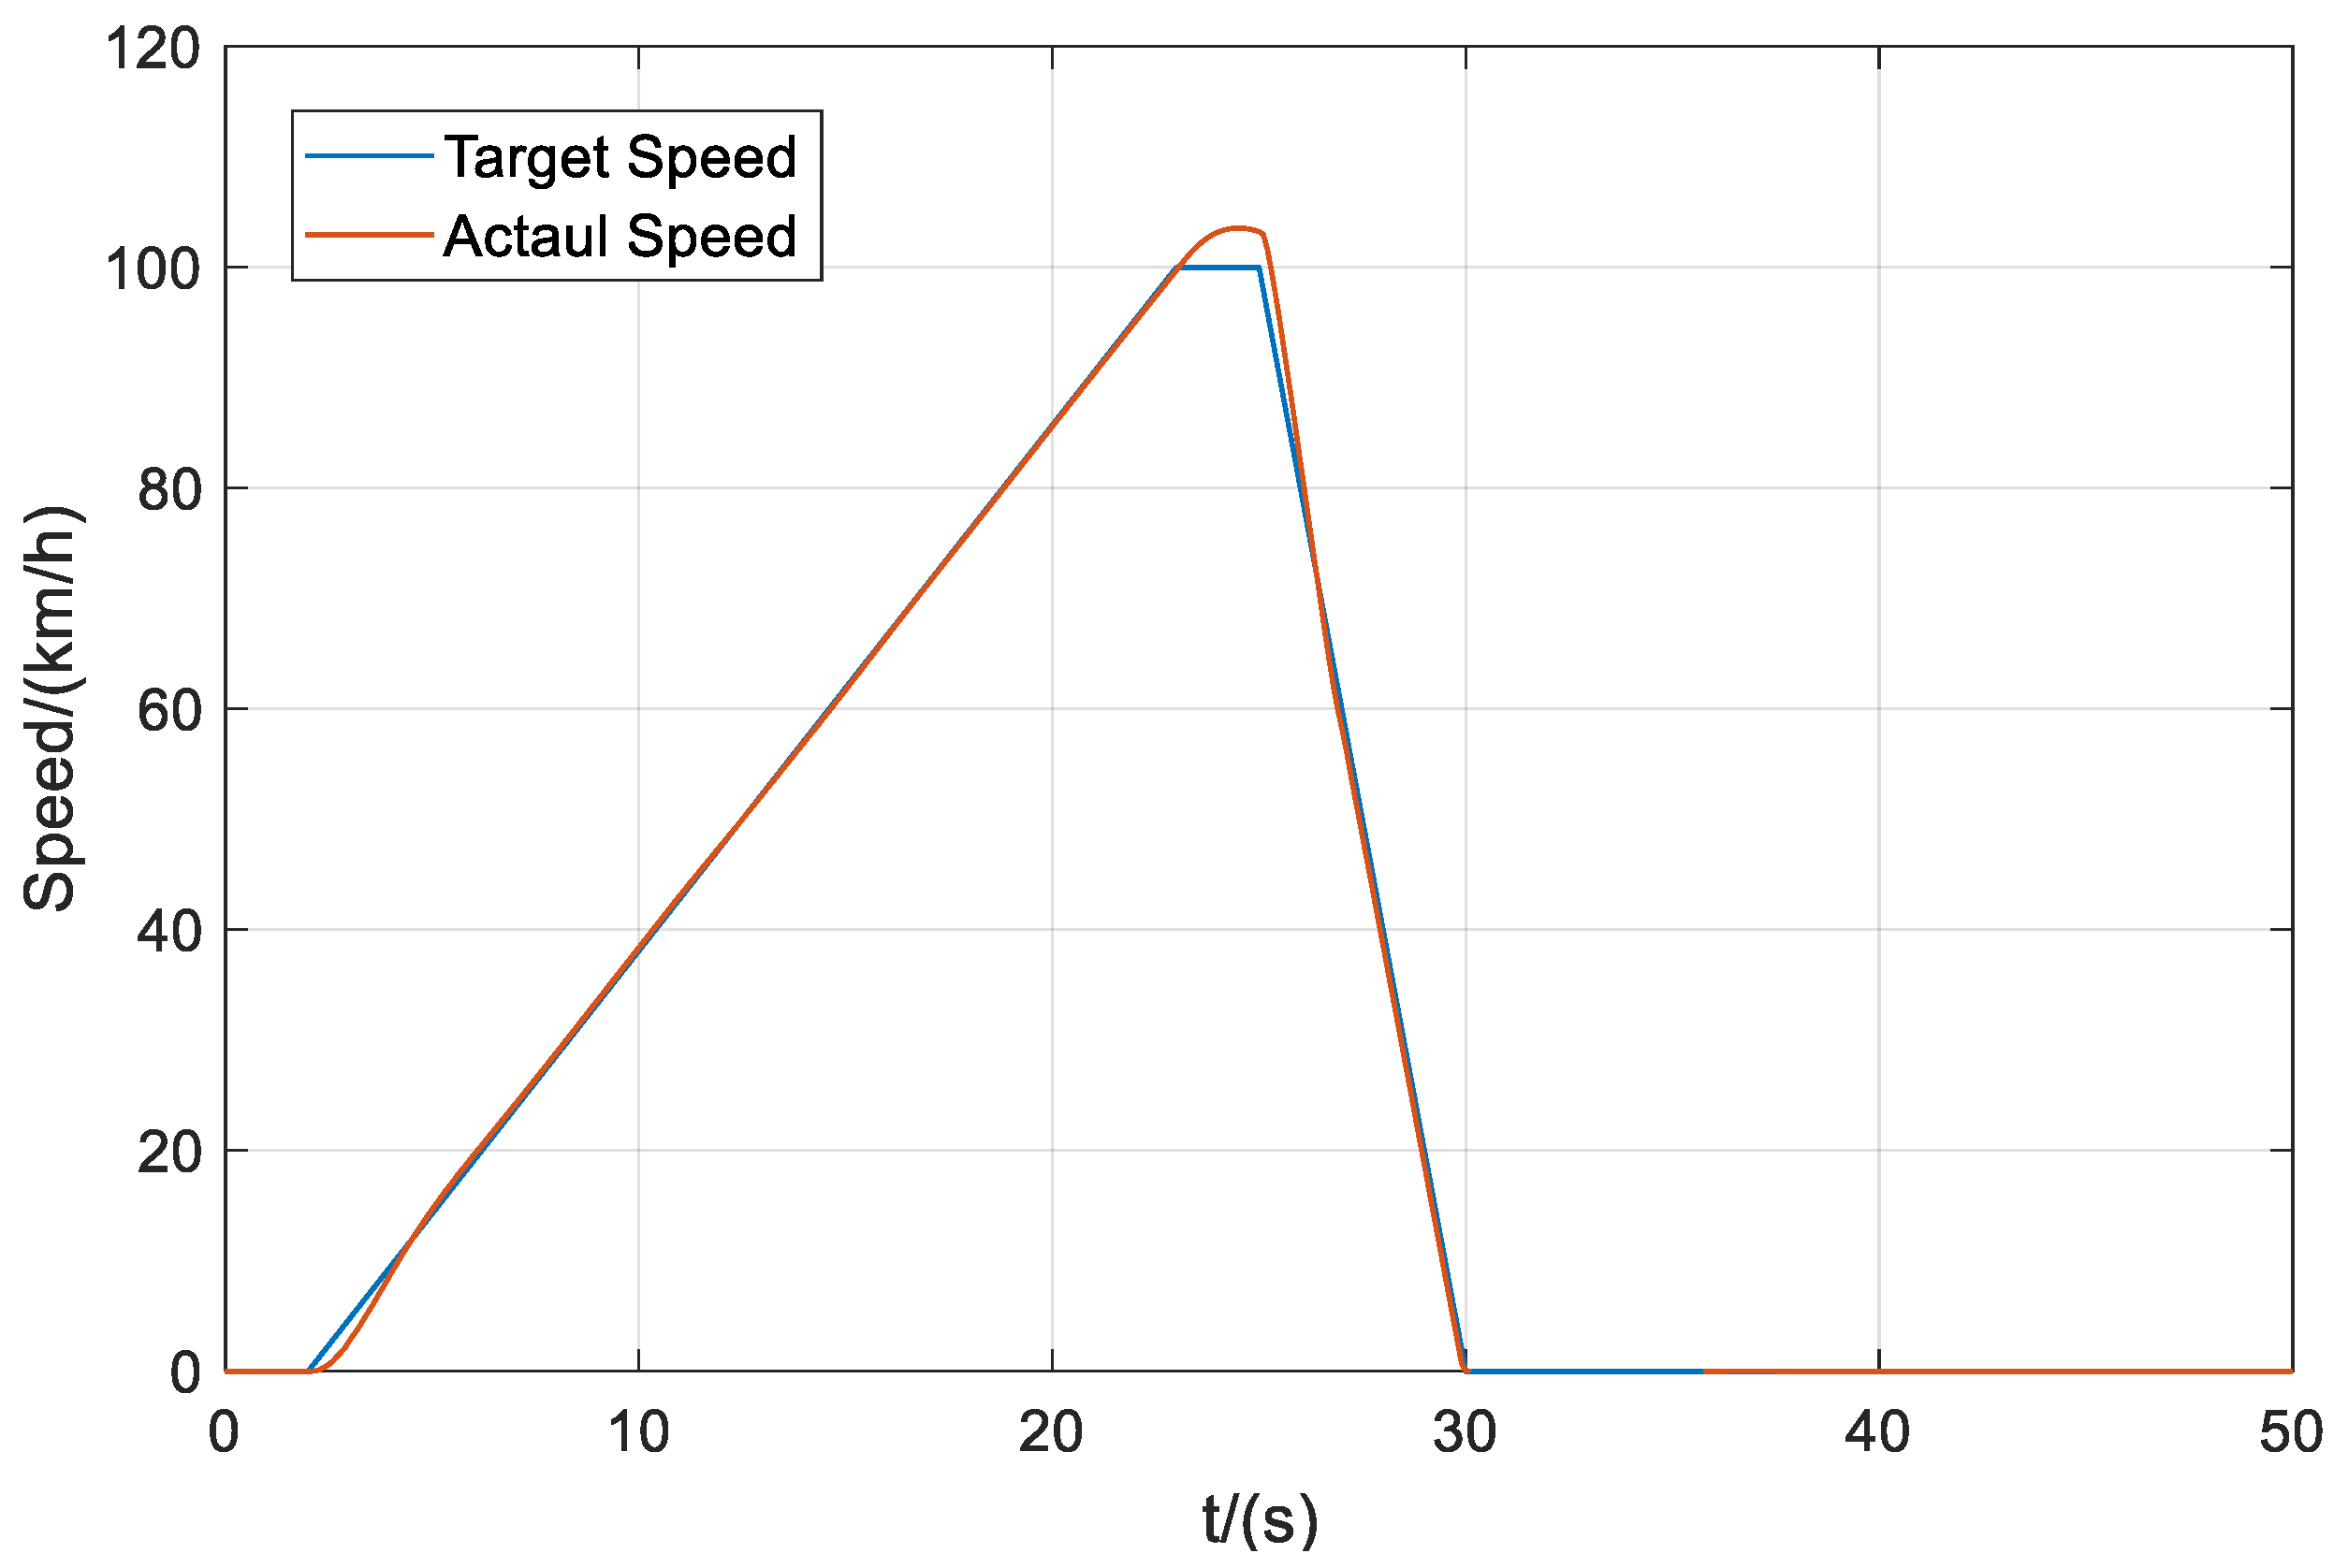
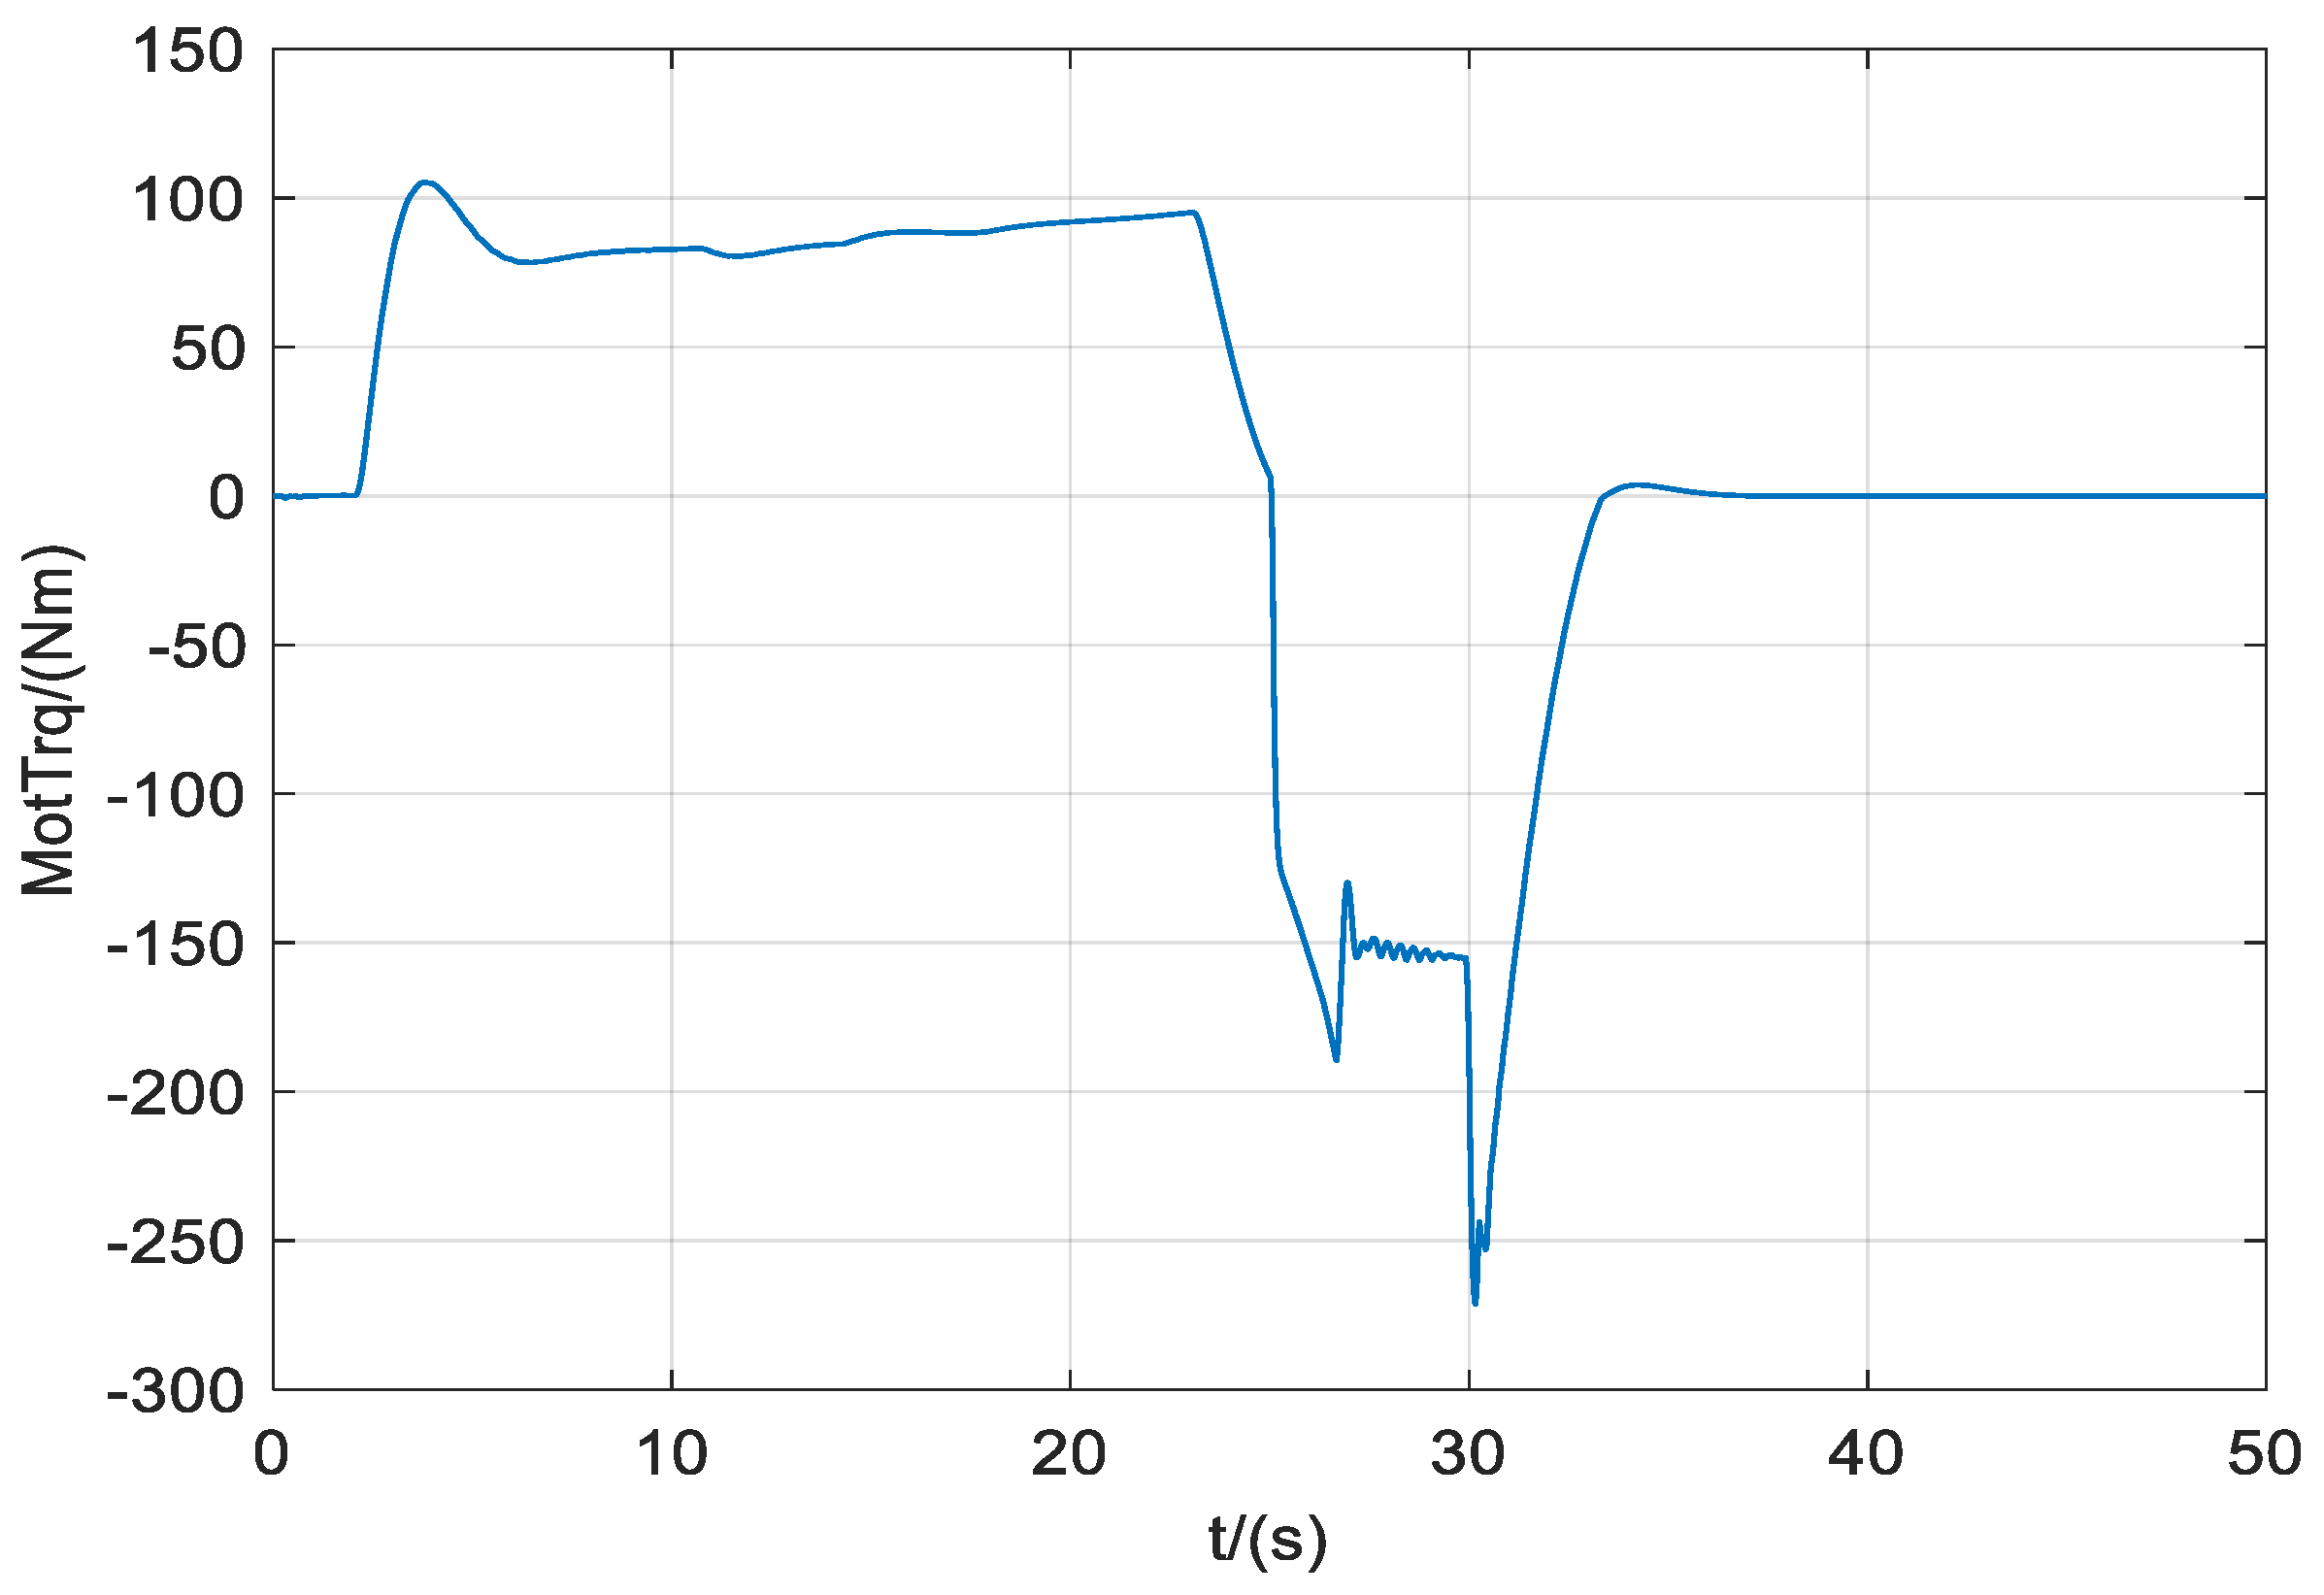
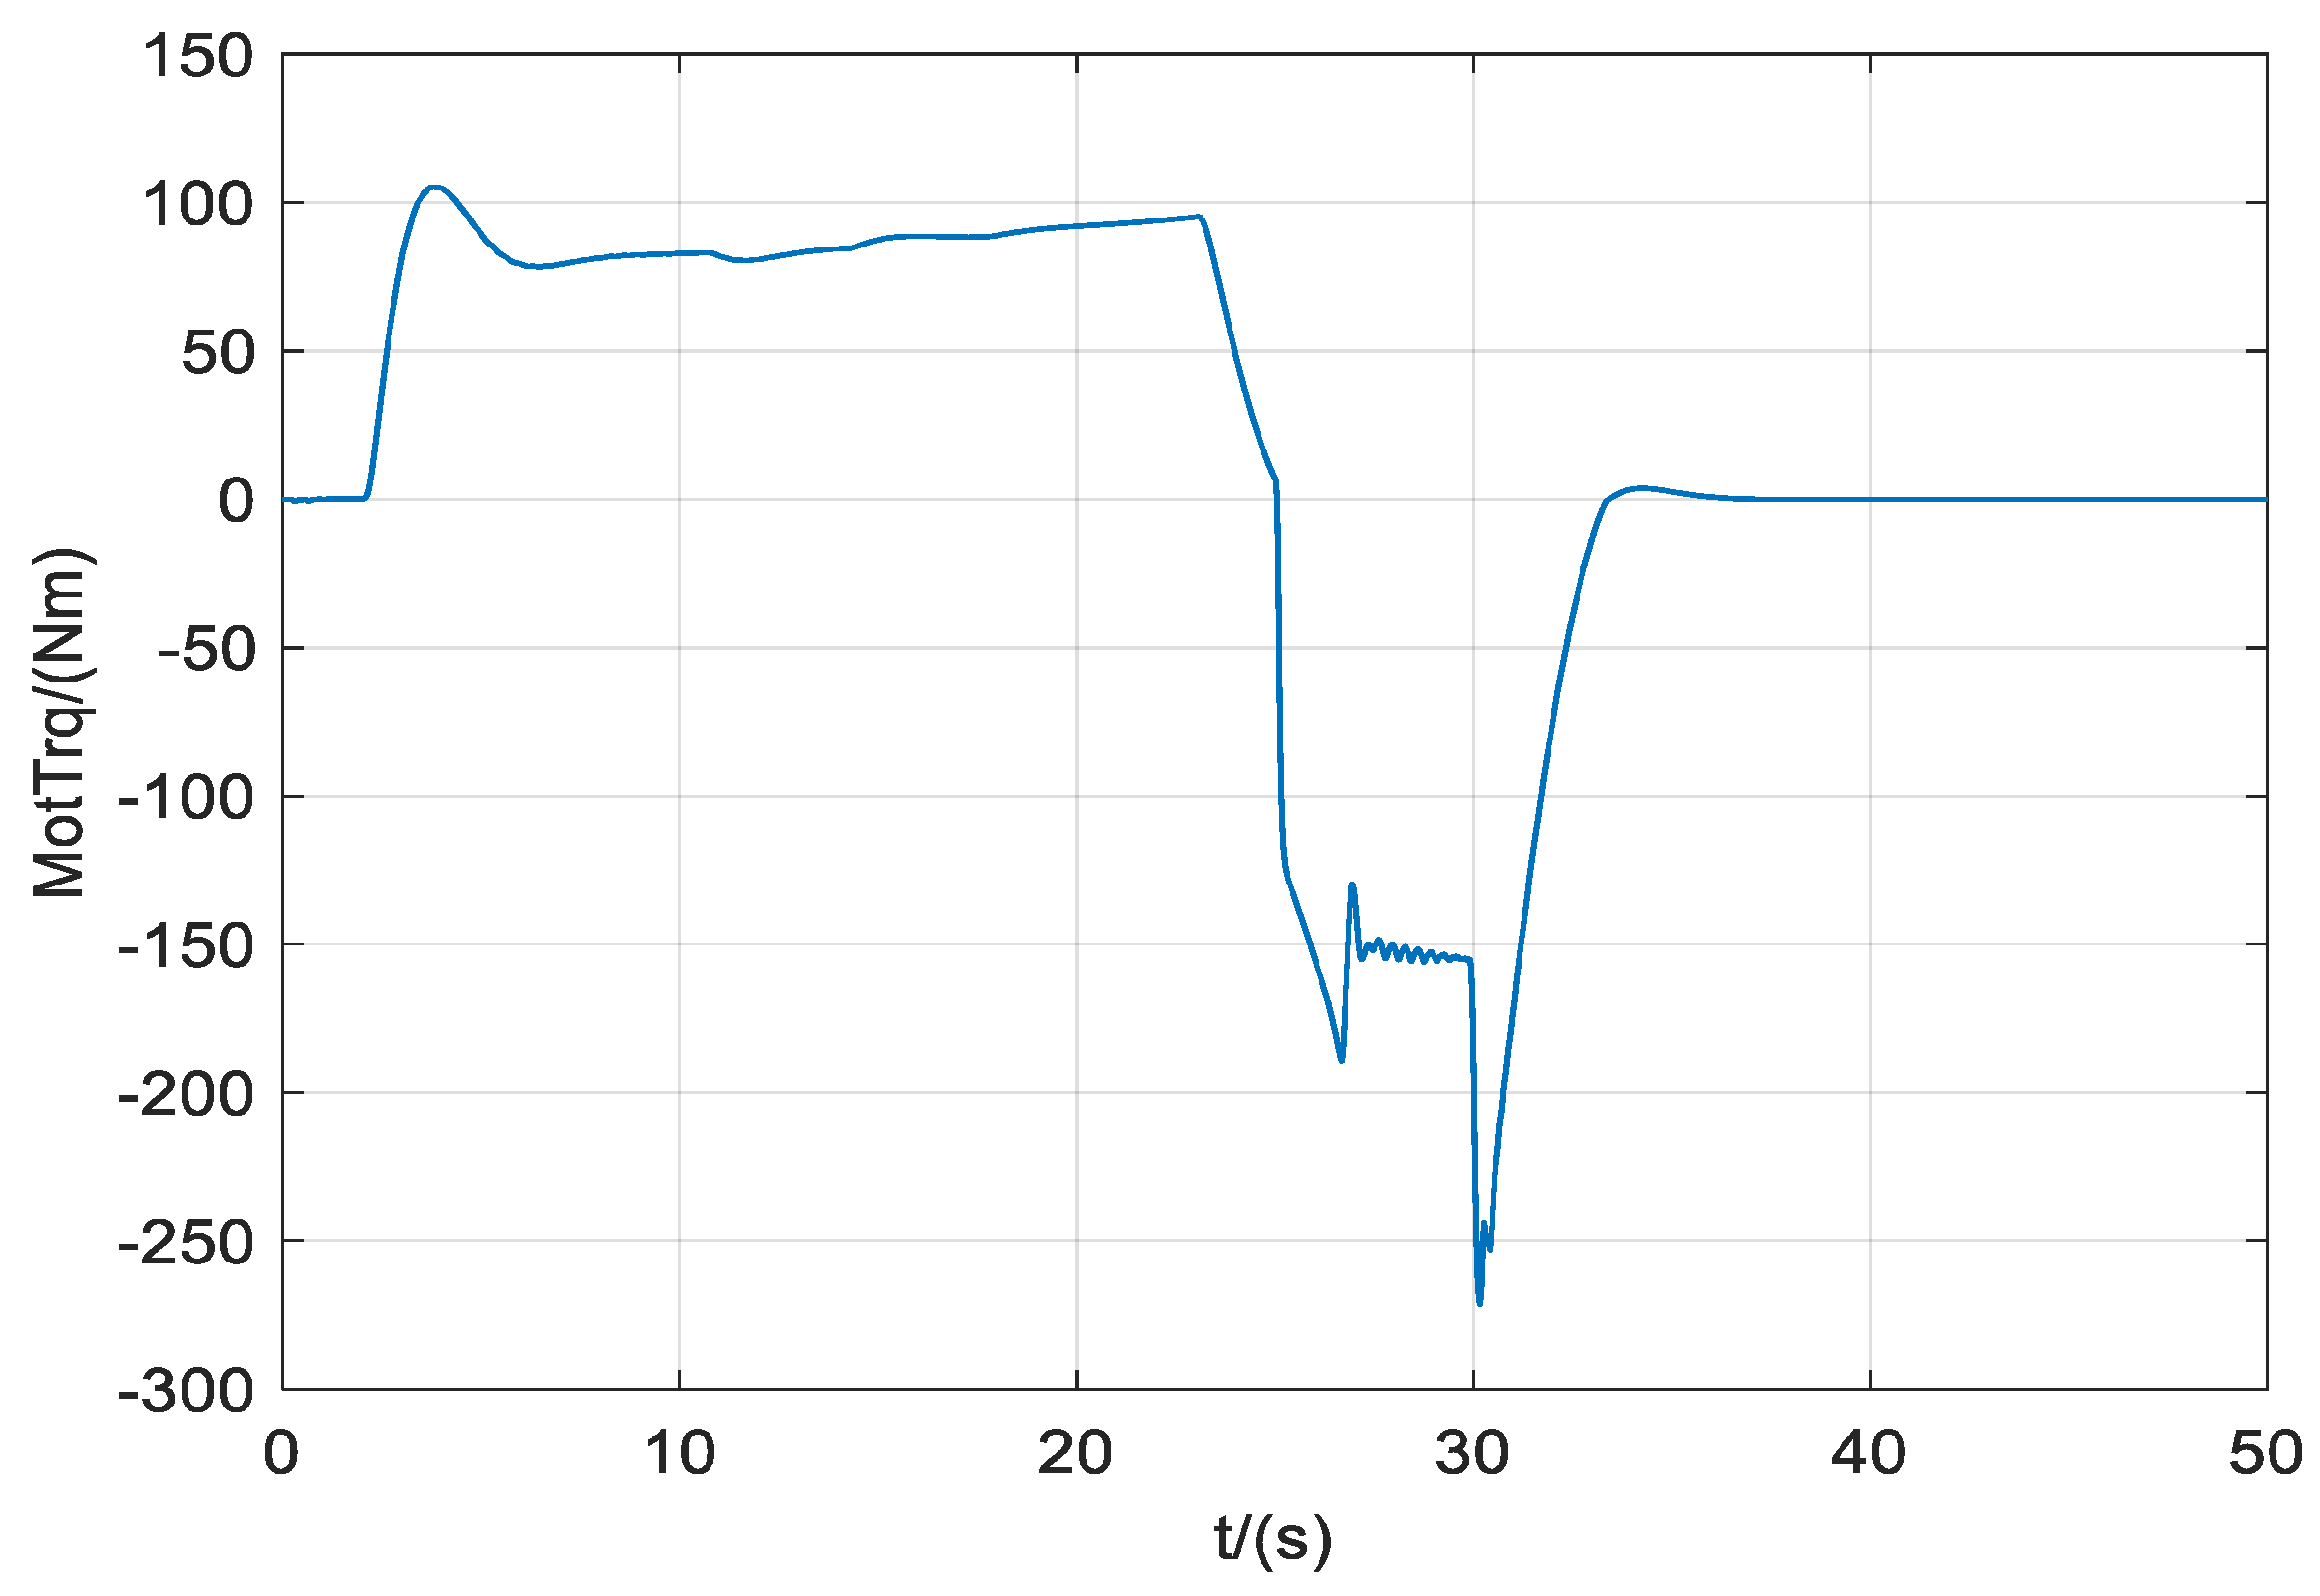
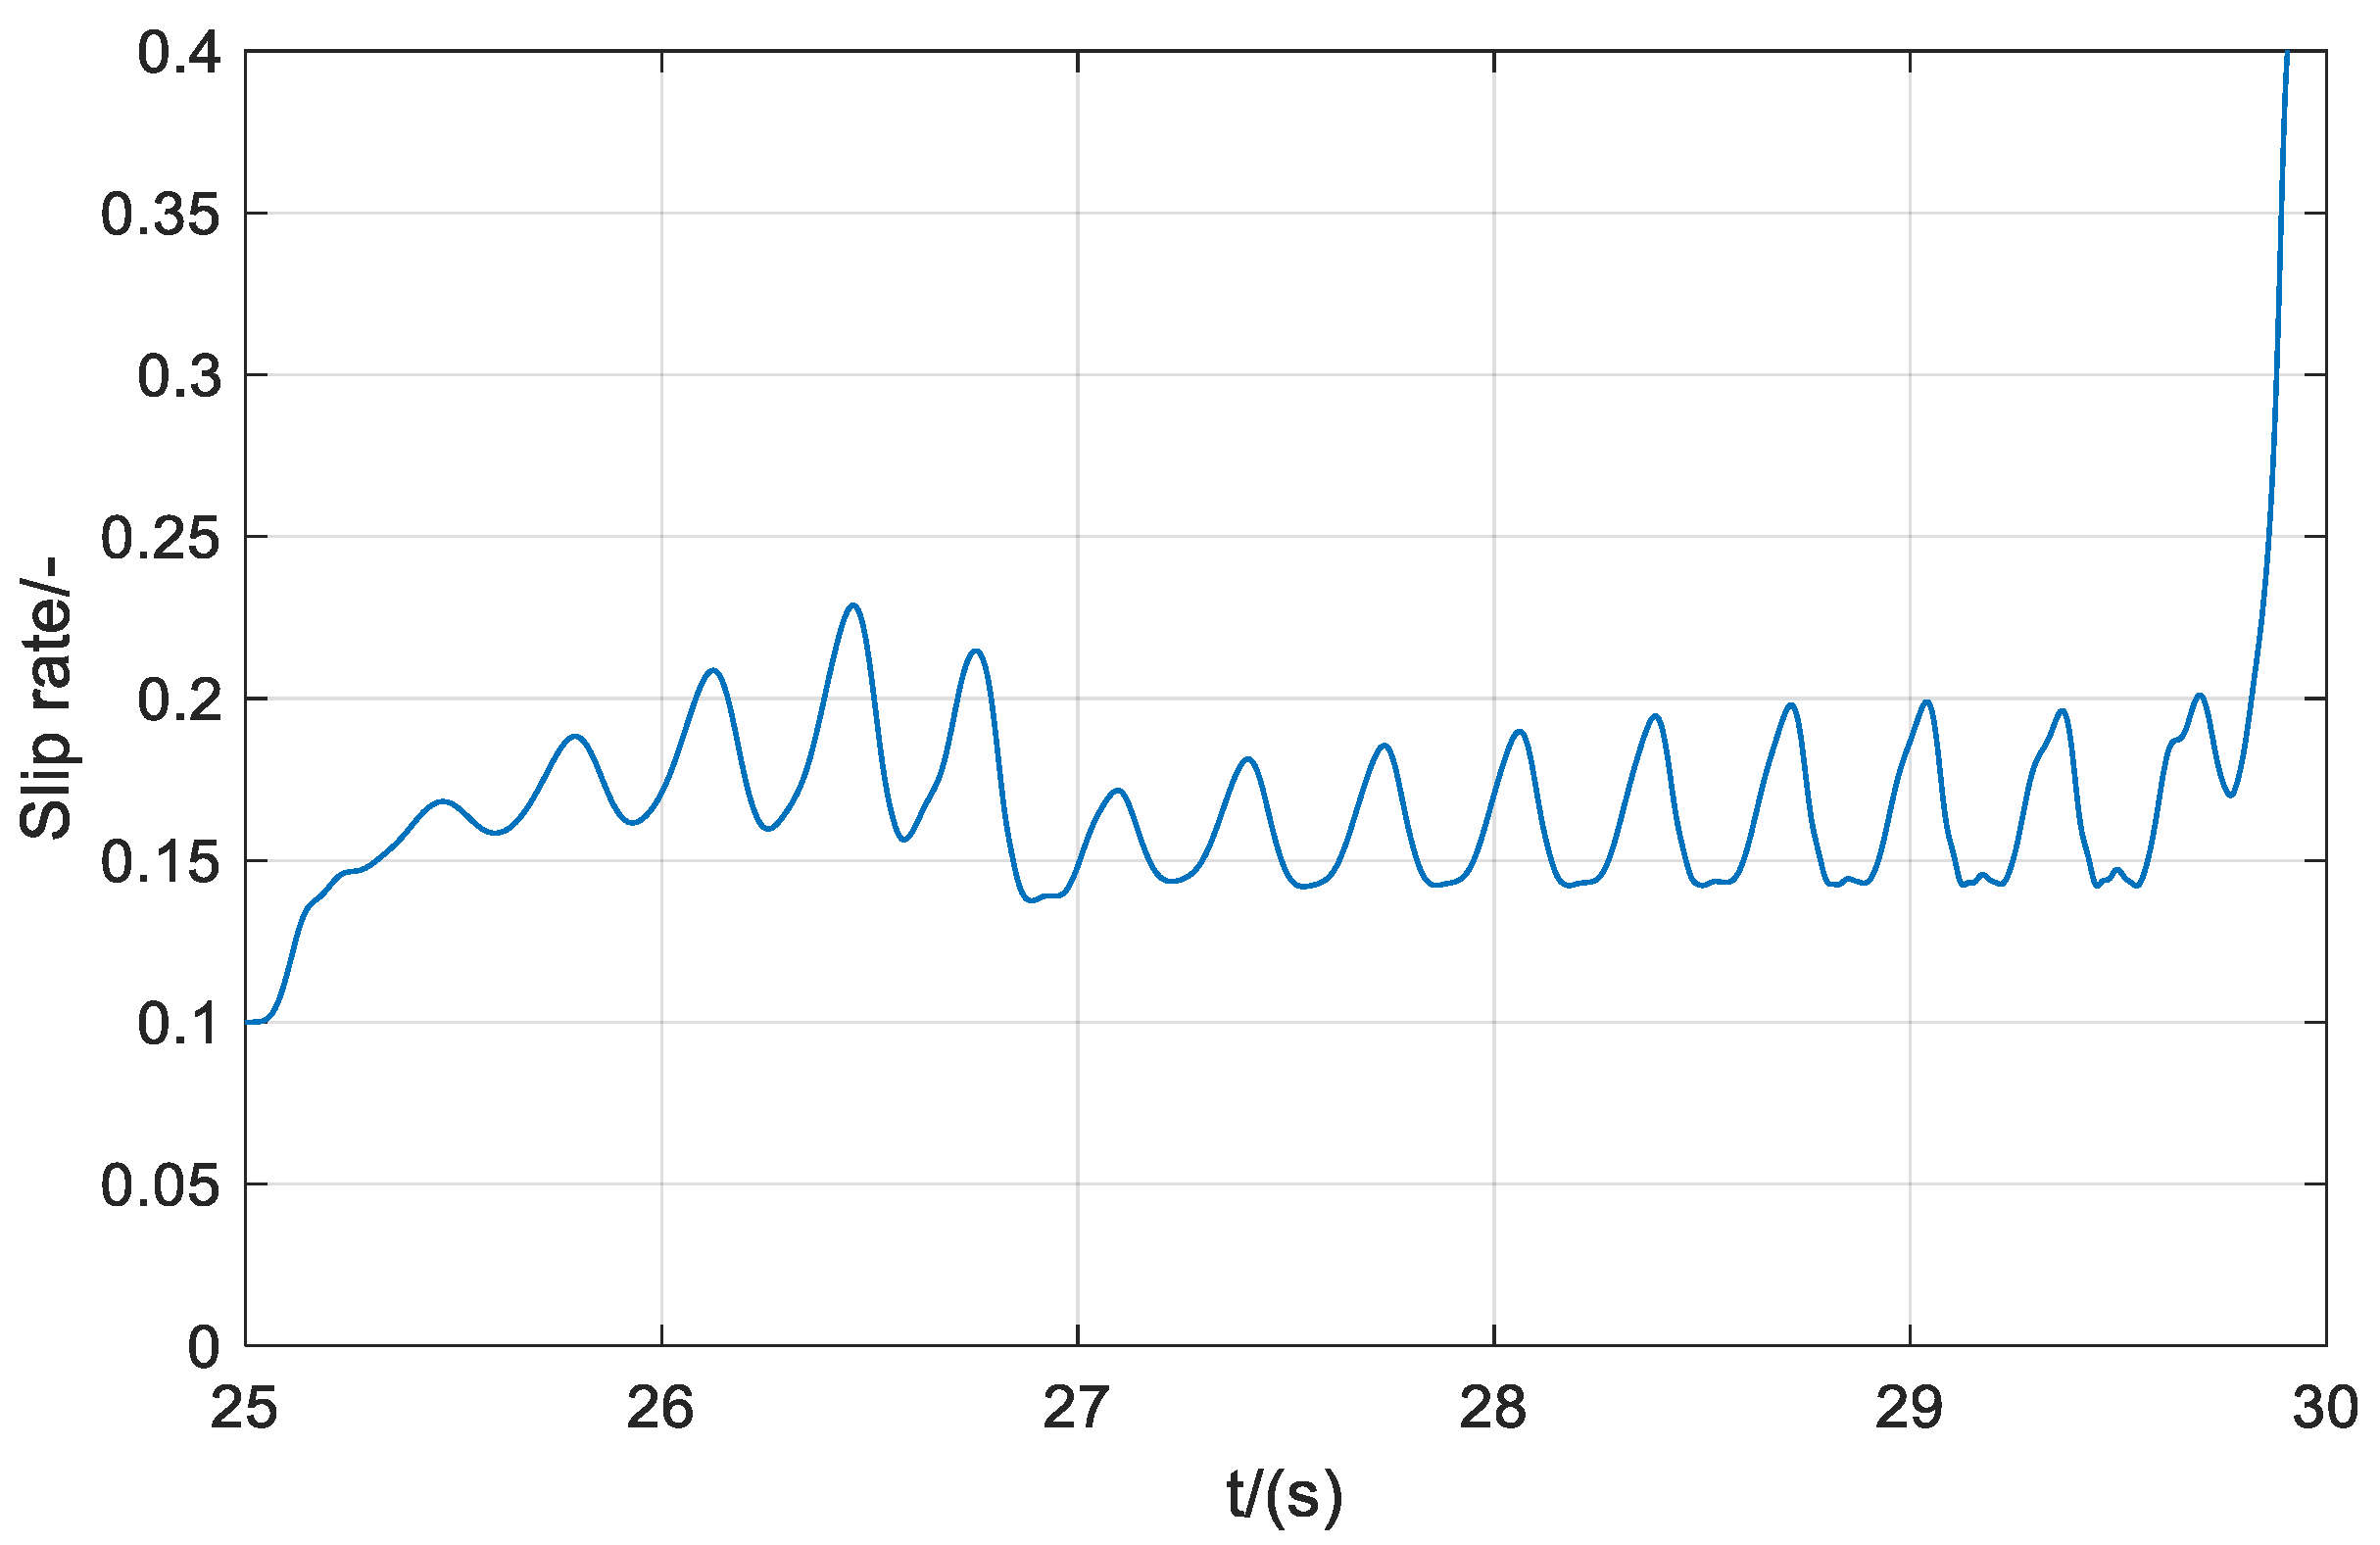
To further verify the safety of the algorithm, a single high-intensity braking test was conducted, in which the vehicle was gradually accelerated to 100 km/h, followed by braking with a maximum braking intensity of 0.8, and the simulation result curves Figure 12, Figure 13, Figure 14 and Figure 15 were as follows:
According to the above curves, the slip rate is always kept within 15–25% during braking. When the braking intensity and the slip rate are high, the motor braking torque will be reduced rapidly, which can prepare for the possible wheel locking. Therefore, it can still ensure good braking safety with high braking intensity.

4. Conclusions

The NMPC-based cooperative braking control algorithm is proposed in this paper, with braking energy recovery power, tire slip rate, and motor torque variation as the optimization objectives, and online optimization of the coordinated distribution of motor braking and friction braking to achieve good energy efficiency while ensuring braking safety.
Using the whole-vehicle dynamics model and the braking energy recovery system model, which were built in Matlab/Simulink, when based on WLTC, the NMPC algorithm proved to be better than the conventional parallel algorithm in terms of control accuracy, comfort, safety, and energy saving. Meanwhile, the energy recovery rate was 30.4%, and the maximum motor braking torque was 90 Nm. Under single high-intensity braking, the slip rate was always within 15~25% and the motor quickly exited the braking process to prepare for the possible wheel locking, which further proves that the algorithm can achieve good braking safety.
Considering that the discrete model in the paper was obtained on the basis of the Eulerian method, which is the first-order integrator characterized by low accuracy, and that its stability can only be ensured by sufficiently small step-sizes, a comparative analysis with other higher-order numerical integration methods will be performed in future studies [30]. In addition, the study has only progressed to the model and simulation stage, but in a real application, there is also a need to consider the sensors and instrumentation required to measure the relevant data, including the delays imposed by each element, as well as an estimation of the total response time of the whole system, including the microprocessor. So, this will also need to be addressed in future studies.

Author Contributions

Conceptualization, L.C. and D.Z.; methodology, software, validation, C.C., D.Z. and Y.X.; investigation, resources, writing—original draft preparation, writing—review, and editing, visualization; supervision; project administration, L.C., C.C., D.Z. and Y.X. All authors have read and agreed to the published version of the manuscript.

Funding

This research was funded by key research and development plan in Tianjin (20YFZCGX00770).

Institutional Review Board Statement

Not applicable.

Informed Consent Statement

Not applicable.

Conflicts of Interest

The authors declare no conflict of interest.

References

  1. Line, C.; Manzie, C.; Good, M.C. Electromechanical Brake Modeling and Control: From PI to MPC. IEEE Trans. Control Syst. Technol. 2008, 16, 446–457. [Google Scholar] [CrossRef]
  2. Satzger, C.; De Castro, R. Predictive Brake Control for Electric Vehicles. IEEE Trans. Veh. Technol. 2017, 67, 977–990. [Google Scholar] [CrossRef]
  3. Lu, X.-Y.; Wang, J.; Li, S.E.; Zheng, Y. Multiple-Vehicle Longitudinal Collision Mitigation by Coordinated Brake Control. Math. Probl. Eng. 2014, 2014, 1–13. [Google Scholar] [CrossRef]
  4. Tavernini, D.; Velenis, E.; Longo, S. Feedback brake distribution control for minimum pitch. Veh. Syst. Dyn. 2017, 55, 902–923. [Google Scholar] [CrossRef] [Green Version]
  5. Cheng, S.; Li, L.; Guo, H.-Q.; Chen, Z.-G.; Song, P. Longitudinal Collision Avoidance and Lateral Stability Adaptive Control System Based on MPC of Autonomous Vehicles. IEEE Trans. Intell. Transp. Syst. 2019, 21, 2376–2385. [Google Scholar] [CrossRef]
  6. Sardarmehni, T.; Rahmani, H.; Menhaj, M.B. Robust control of wheel slip in anti-lock brake system of automobiles. Nonlinear Dyn. 2013, 76, 125–138. [Google Scholar] [CrossRef]
  7. Nadeau, J.; Micheau, P.; Boisvert, M. Model-Based Predictive Control Applied to a Dual Regenerative and Hydraulic Brake System. In Proceedings of the 2015 IEEE Vehicle Power and Propulsion Conference (VPPC), Montreal, QC, Canada, 19–22 October 2015; pp. 1–5. [Google Scholar]
  8. Yao, M.; Miao, J.; Cao, S.; Chen, S.; Chai, H. The Structure Design and Optimization of Electromagnetic-Mechanical Wedge Brake System. IEEE Access 2019, 8, 3996–4004. [Google Scholar] [CrossRef]
  9. Ma, K.; Wang, Z.; Liu, H.; Yu, H.; Wei, C. Numerical Investigation on Fuzzy Logic Control Energy Management Strategy of Parallel Hybrid Electric Vehicle. Energy Procedia 2019, 158, 2643–2648. [Google Scholar] [CrossRef]
  10. Zhao, D.; Chu, L.; Xu, N.; Sun, C.; Xu, Y. Development of a Cooperative Braking System for Front-Wheel Drive Electric Vehicles. Energies 2018, 11, 378. [Google Scholar] [CrossRef] [Green Version]
  11. Ma, H.; Chu, L.; Guo, J.; Wang, J.; Guo, C. Cooperative Adaptive Cruise Control Strategy Optimization for Electric Vehicles Based on SA-PSO With Model Predictive Control. IEEE Access 2020, 8, 225745–225756. [Google Scholar] [CrossRef]
  12. Ma, Z.; Sun, D. Energy Recovery Strategy Based on Ideal Braking Force Distribution for Regenerative Braking System of a Four-Wheel Drive Electric Vehicle. IEEE Access 2020, 8, 136234–136242. [Google Scholar] [CrossRef]
  13. Ji, F.; Pan, Y.; Zhou, Y.; Du, F.; Zhang, Q.; Li, G. Energy recovery based on pedal situation for regenerative braking system of electric vehicle. Veh. Syst. Dyn. 2019, 58, 144–173. [Google Scholar] [CrossRef]
  14. Guo, J.; Li, W.; Wang, J.; Luo, Y.; Li, K. Safe and Energy-Efficient Car-Following Control Strategy for Intelligent Electric Vehicles Considering Regenerative Braking. IEEE Trans. Intell. Transp. Syst. 2021, 1–12. [Google Scholar] [CrossRef]
  15. Tao, Y.; Xie, X.; Zhao, H.; Xu, W.; Chen, H. A regenerative braking system for electric vehicle with four in-wheel motors based on fuzzy control. In Proceedings of the 36th Chinese Control Conference (CCC), Dalian, China, 26–28 July 2017; pp. 4288–4293. [Google Scholar]
  16. Bravo, R.R.S.; De Negri, V.J.; Oliveira, A.A.M. Design and analysis of a parallel hydraulic—Pneumatic regenerative braking system for heavy-duty hybrid vehicles. Appl. Energy 2018, 225, 60–77. [Google Scholar] [CrossRef]
  17. Ning, X.; Shangguan, J.; Xiao, Y.; Fu, Z.; Xu, G.; He, A.; Li, B. Optimization of Energy Recovery Efficiency for Parallel Hydraulic Hybrid Power Systems Based on Dynamic Programming. Math. Probl. Eng. 2019, 2019, 1–11. [Google Scholar] [CrossRef]
  18. Zhang, Y.; Zhao, C.; Li, Z. Electric Vehicle Regenerative Braking System Simulation based on Kalman Filter. In Proceedings of the 2020 Chinese Automation Congress (CAC), Shanghai, China, 6–8 November 2020; pp. 2936–2941. [Google Scholar]
  19. Xiao, B.; Lu, H.; Wang, H.; Ruan, J.; Zhang, N. Enhanced Regenerative Braking Strategies for Electric Vehicles: Dynamic Performance and Potential Analysis. Energies 2017, 10, 1875. [Google Scholar] [CrossRef] [Green Version]
  20. Xu, W.; Chen, H.; Zhao, H.; Ren, B. Torque optimization control for electric vehicles with four in-wheel motors equipped with regenerative braking system. Mechatronics 2018, 57, 95–108. [Google Scholar] [CrossRef]
  21. Zhang, L.; Cai, X. Control strategy of regenerative braking system in electric vehicles. Energy Procedia 2018, 152, 496–501. [Google Scholar] [CrossRef]
  22. Xu, L.; He, X.; Shen, X. Improving Energy Recovery Rate of the Regenerative Braking System by Optimization of Influencing Factors. Appl. Sci. 2019, 9, 3807. [Google Scholar] [CrossRef] [Green Version]
  23. Dou, J.; Cui, G.; Li, S.; Zhao, X.; Lu, X.; Yu, Z. MPC-based cooperative braking control for rear-wheel-drive electric vehicle. In Proceedings of the 2017 Chinese Automation Congress (CAC), Jinan, China, 20–22 October 2017; pp. 4419–4424. [Google Scholar] [CrossRef]
  24. Li, S.; Guo, L.; Zhang, B.; Lu, X.; Cui, G.; Dou, J. MPC-based Slip Control System for In-wheel-motor Drive EV. IFAC-PapersOnLine 2018, 51, 578–582. [Google Scholar] [CrossRef]
  25. Wagner, D.; Steinsträter, M.; Förth, M.; Stohwasser, M.; Hoffmann, J.; Lienkamp, M. Battery independent regenerative braking using model predictive control with auxiliary power consumers. Forsch. Ing. 2019, 83, 843–852. [Google Scholar] [CrossRef]
  26. Chen, J.; Yu, J.; Zhang, K.; Ma, Y. Control of regenerative braking systems for four-wheel-independently-actuated electric vehicles. Mechatronics 2018, 50, 394–401. [Google Scholar] [CrossRef]
  27. Hao, L.; Sun, B.; Li, G.; Guo, L. The Eco-Driving Considering Coordinated Control Strategy for the Intelligent Electric Vehicles. IEEE Access 2021, 9, 10686–10698. [Google Scholar] [CrossRef]
  28. Farooqi, H.; Incremona, G.P.; Colaneri, P. Collaborative Eco-Drive of Railway Vehicles via Switched Nonlinear Model Predictive Control. IFAC-PapersOnLine 2018, 51, 626–631. [Google Scholar] [CrossRef]
  29. Wang, Y.; Wang, X.; Sun, Y.; You, S. Model predictive control strategy for energy optimization of series-parallel hybrid electric vehicle. J. Clean. Prod. 2018, 199, 348–358. [Google Scholar] [CrossRef]
  30. Zhang, Y.; Bai, Y.; Yang, H. A Universal Multiple-Vector-Based Model Predictive Control of Induction Motor Drives. IEEE Trans. Power Electron. 2017, 33, 6957–6969. [Google Scholar] [CrossRef]
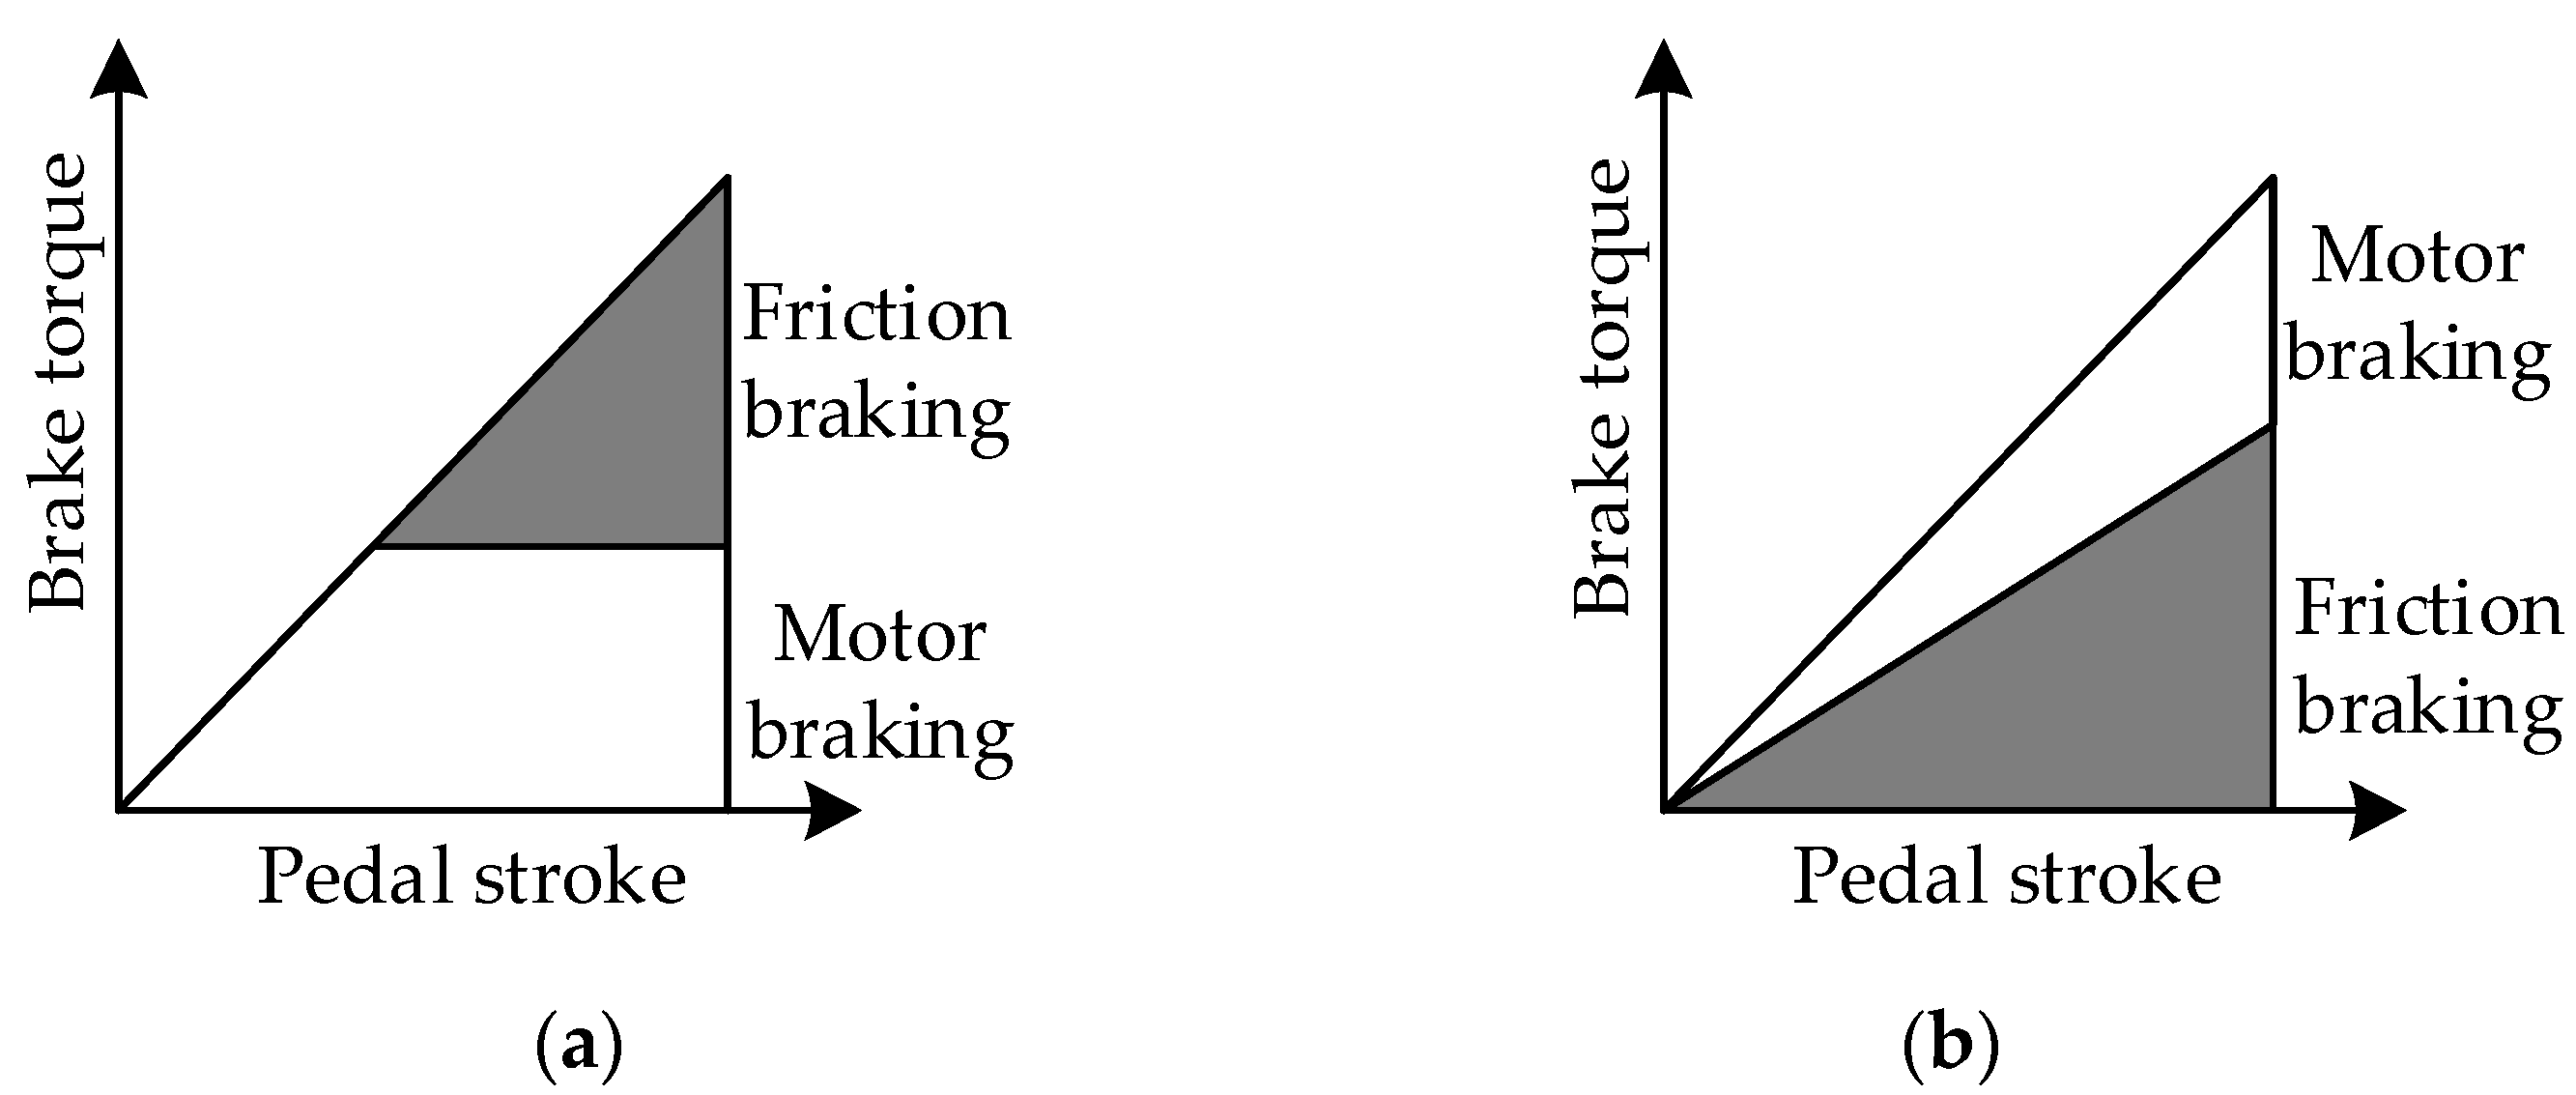
Figure 1. Cooperative braking control strategy: (a) parallel type; (b) series type.
Wevj 12 00173 g001
Figure 2. The nonlinear model predictive control process.
Wevj 12 00173 g002
Figure 3. The reference vehicle force analysis curve.
Wevj 12 00173 g003
Figure 4. The Simulink model for the regenerative brake system.
Wevj 12 00173 g004
Figure 5. The Simulink model for the NMPC algorithm.
Wevj 12 00173 g005
Figure 6. (a) The target speed curve for NEDC; (b) the target speed curve for WLTC.
Wevj 12 00173 g006
Figure 7. Target speed-time vs. actual speed-time.
Wevj 12 00173 g007
Figure 8. Target speed-time vs. actual speed-time (partially enlarged view).
Wevj 12 00173 g008
Figure 9. The battery SOC curve.
Wevj 12 00173 g009
Figure 10. The motor braking torque curve.
Wevj 12 00173 g010
Figure 11. The slip rate curve.
Wevj 12 00173 g011
Figure 12. Target speed-time vs. actual speed-time.
Wevj 12 00173 g012
Figure 13. Vehicle deceleration-time.
Wevj 12 00173 g013
Figure 14. The motor braking torque curve.
Wevj 12 00173 g014
Figure 15. The slip rate curve.
Wevj 12 00173 g015
Table 1. Main parameters used in models.
ParameterValueUnit
m s m 1928 kg
l 2675 mm
a 1263 mm
b 1412 mm
h g 530 mm
J w i 1.12 kg · m 2
J m 5.34 kg · m 2
R t 0.308 m
i t 8.28--
Table 2. The calculation of energy recovery rate.
E reg   E brk   η reg  
347411,41730.4%
240111,39521.1%
Publisher’s Note: MDPI stays neutral with regard to jurisdictional claims in published maps and institutional affiliations.