Abstract
Electrified vehicles (xEV), especially the battery electric vehicle (BEV), are burgeoning and growing fast in China, aimed at building a sustainable, carbon-neutral future. This work presents an overview and quantitative comparison of the carbon-neutral vehicles fuel options based on the well-to-wheel (WTW) analysis. A more intuitionistic figure demonstrates the fuel options for greenhouse gas (GHG) emissions and describes the sustainability. Electricity and hydrogen shift the tailpipe emissions to the upstream process, forming larger WTW emissions from a fuel cycle view. The electricity WTW GHG emission reaches as much as twice that of gasoline. However, the high efficiency of the electric drive system improves the WTW emission performance from a vehicle view, making the lowest WTW emission of BEV. The fuel options’ technical and environmental perspectives are presented. Finally, long-term carbon-neutral vehicle development is discussed.
1. Introduction
Confronted with greenhouse gas (GHG) emission concerns and the adherence to petroleum fuel, the national and local government of China had introduced a series of policies and incentives to speed up the new energy vehicles’ (NEV) commercialization [1]. As a result, the NEV, including battery electric vehicles (BEV), plug-in hybrid electric vehicles (PHEV), and fuel cell electric vehicles (FCEV), presents strong, alternative solutions. Compared to the total sales of 1.2 million in 2019, the NEV sales in 2020 reached 1.3 million [2]. Occupying almost half the population of total BEVs, China is the largest BEV market in the world. The trend towards a sustainable and renewable energy future is being accelerated.
Traditional vehicles are propelled by an internal combustion engine (ICE), which consumes petroleum fuel, such as gasoline or diesel. Despite the fact that their transmissions can adjust the ICE operating points to improve the ICE’s energy conversion efficiency, the varying propulsion power and the ICE combustion characteristics govern the ICE’s inefficiency operation and significant tailpipe emissions. The hybrid electric vehicles (HEV) combine two or more power sources, such as the ICE and battery energy storage system (ESS), to further optimize the ICE operating points with improved fuel efficiency and emissions, and there is further energy efficiency improvement by recapturing part of the braking energy [3]. These distinct features fully utilize the HEV’s potential to reduce petroleum fuel consumption and GHG emissions. Furthermore, with an increased battery ESS and stronger electric drives, the plug-in HEV (PHEV) and Range-Extender EV (RE-EV) can be charged using clean grid power and can complete more demanding driving cycles using the electric drive alone [4]. These PHEVs and RE-EVs can fully utilize the well-established refueling infrastructure, quick developing charging infrastructure, efficient electric drive, and rapidly improving battery technology, making them the best powertrain solution at present.
Discarding the ICE and the complex mechanical drive, the BEV uses battery ESS and propulsion electric motor(s), which form a more efficient electric drive, to propel the vehicle. The BEV is charged from the power grid, emitting zero emission onboard or no tailpipe, which gives BEV its so-called name “zero-emission vehicle”. However, the emissions are produced during power generation away from the city centers [5]. Therefore, the emission of BEV is shifted or transferred away from the city, forming a significant GHG emission in upstream [1,6]. The hydrogen fuel cell, functioning as an ICE, replaces the battery ESS to provide electricity onboard, feeding the electric drive continuously. The quick refueling of hydrogen mitigates the range anxiety of BEV. The more efficient fuel cell consumes hydrogen to relieve the adherence to petroleum fuel of ICE-based vehicles. The tailpipe of FCEV emits only water, making FCEV another type of “zero-emission vehicle”. The primary hydrogen generation is the coal-based chemical industry, metallurgy industry, and electrolysis [7]. A minor portion of electrolysis contributes to hydrogen generation, leading to a higher GHG emission upstream [8].
Indeed, the fuel or energy consumed onboard is the downstream process, which is the pump-to-wheel (PTW) cycle. On the other hand, fuel exploitation, refining, and power generation come from the upstream process, which is the well-to-pump cycle. Thus, WTP and PTW create the lifecycle view (i.e., well-to-wheel, WTW). Wang [9] et al. compared gasoline, methanol, and hydrogen as fuel options for FCEV from the well-to-wheel view, concluding that methanol reformation could be a promising fuel pathway for the hydrogen fuel cell vehicle. Li [10] et al. presented the assessment of battery and fuel cell vehicles using a WTW analysis. Using the current fuel pathways, Ref. [10] found that BEV emitted significant GHG emissions in the well-to-pump stage, leading to the worse GHG performance of BEV in operation mode C. Therefore, Li [10] et al. suggested cleaner hydrogen production pathways and cleaner electricity power generation. Gupta [11] et al. established the WTW cycle for heavy-duty vehicles, evaluated the 20% hydrogen and compressed natural gas mixture fuel engine, and suggested that a cleaner hydrogen feedstock was essential.
At present, the WTW analysis only focuses on several typical fuels or powertrain solutions. In this work, we establish a platform allowing all types of fuel options and powertrain solutions to be compared in one figure, using the Well-to-Wheel (WTW) method.
2. Methods and Data
To compare all kinds of fuel options equally, the energy-based unit is chosen to describe the amount of fuel. Using the fuel low heating value, the energy-based unit can be converted into the weight-based unit. For instance, one mega-joule of gasoline equals 23 g of gasoline, and one mega-joule of electricity equals 0.2777 kWh. Hence, gaseous fuel, liquid fuel, and electricity can be compared in one platform. Using the well-developed fuel pathways, the well-to-pump (WTP) GHG emissions, petroleum fuel consumption, and fossil fuel consumption can be calculated by Equation (1):
where, i is the fuel options, such as gasoline, diesel, hydrogen, or electricity. GHGWTP, PetroWTP, and FossilWTP are the greenhouse gas emission, petroleum fuel consumption, and fossil fuel consumption of fuel i during the WTP cycle, respectively. α is the different fuel pathways portion for forming the ready-to-use fuel. fGHG, fPetro, fFossil are the greenhouse gas emission, petroleum fuel consumption, and fossil fuel consumption of fuel i at different fuel pathways.
This research uses the China mix data in the Greenhouse gas, Regulated Emissions and Energy use in Technology (GREET) model developed by Argonne National Laboratory [12] to form the WTP cycle data.
Equation (2) calculates the pump-to-wheel (PTW) cycle GHG emissions, petroleum fuel consumption, and fossil fuel consumption:
where, GHGPTW, PetroPTW and FossilPTW are the greenhouse gas emission, petroleum fuel consumption, and fossil fuel consumption of fuel i during the PTW cycle, respectively. β is the different fuel pathways portion for forming the ready-to-use fuel. T, P, F are the greenhouse gas emission, petroleum fuel consumption, and fossil fuel consumption of fuel i at different fuel pathways. E is the fuel amount, which is one mega-joule of fuel in this research. The recommended value of each fuel’s emission factor is derived from Ref. [13]. Combining the WTP and PTW cycle, the fuel options’ WTW performance can be obtained:
3. Results and Analysis
3.1. Fuel-Based WTW Analysis
Using the low heating value of each fuel option and the GREET model of the China fuel mix data, Table 1 gives the calculation results. In Table 1, all the comparisons and results are calculated based on the consumption of one mega-joule (MJ) of each fuel. Due to the fact that not all the energy produced from the fuel is used to drive the vehicle, this table only considers the fuel itself. Using gasoline as a benchmark, the other fuel options are compared, as shown in Figure 1.

Table 1.
Fuel-based WTW analysis.
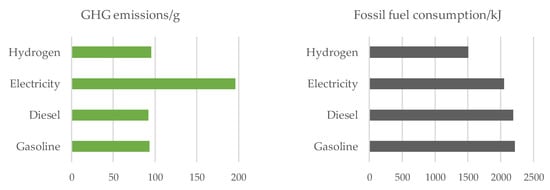
Figure 1.
GHG emission and fossil fuel consumption comparison from the fuel-based WTW analysis.
3.1.1. Gasoline and Diesel
When consuming one mega-joule of gasoline fuel on board the vehicle, 1063 kJ of petroleum fuel has been consumed during the WTP stage due to petroleum fuel drilling, exploitation, refining, and transporting. There is also 19.5 g of GHG emissions that have been emitted in the WTP stage. During usage, there is 76.7 g of GHG emissions when consuming one mega-joule of gasoline fuel. Therefore, the tailpipe emission of gasoline-fueled vehicles dominates the WTW emission, accounting for 79.17 percent. The diesel fuel shows the same trend as the gasoline fuel, while the PTW emission portion is 82.93 percent. As Table 1 shows, gasoline and diesel fuel show a strong dependency on petroleum fuel: for one mega-joule of fuel consumed onboard, more than twice the amount of petroleum fuel has been consumed from a WTW view.
3.1.2. Hydrogen and Electricity
Both hydrogen- and electricity-fueled vehicles are named zero-emission vehicles, with zero PTW emissions, as shown in Table 1. Since power generation and hydrogen production consume significant energy, the GHG emissions of hydrogen and electricity are shifted to the upstream. Currently, the hydrogen fuel consumed by FCEV is produced by electrolysis from grid electricity and by-production from the chemical industry. Therefore, the WTW GHG emissions of hydrogen are slightly higher than gasoline and diesel. Increasing the portion of clean power generation, including photovoltaic, wind power, hydropower, and nuclear power, will improve the GHG emissions of hydrogen. At the same time, hydrogen from electrolysis will benefit unstable clean power generation, such as seasonal wind power and daily photovoltaic power. At present, coal power generation takes up almost 70 percent of China’s grid electricity. Therefore, the GHG emissions of China’s electricity are much higher, reaching 196.5 g/MJ. Compared to gasoline and diesel, the GHG emissions of one MJ of electricity constitute more than twice that of its counterpart. On the other hand, the petroleum fuel consumption of electricity is only 1.75 percent that of gasoline. Less petroleum fuel consumption relieves the dependency on petroleum fuel import.
3.2. Vehicle-Based WTW Analysis
To better illustrate the GHG and petroleum fuel consumption under different fuel options in China, an intuitive chart is presented in Figure 2. Several typical vehicles are selected: Toyota MIRAI (FCEV), BYD Qin Pro (BEV), Toyota Corolla (Hybrid), Nissan SYLPHY (Gasoline), Changcheng Pao (Diesel), and VW Teramont (Gasoline). The typical vehicles’ fuel consumption performance is derived from XiaoXiongYouHao website: BYD Qin Pro (16 kWh/100 km), Toyota Corolla (4.6 L/100 km), Nissan SYLPHY (7 L/100 km), Changcheng Pao (11.8 L/100 km), and VW Teramont (12.4 L/100 km) [14]. Additionally, Toyota MIRAI fuel consumption is assumed to be 1.2 kg/100 km, according to the EPA website [15].
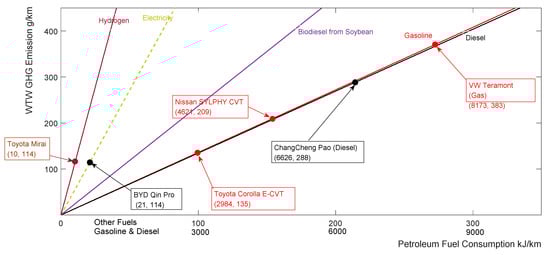
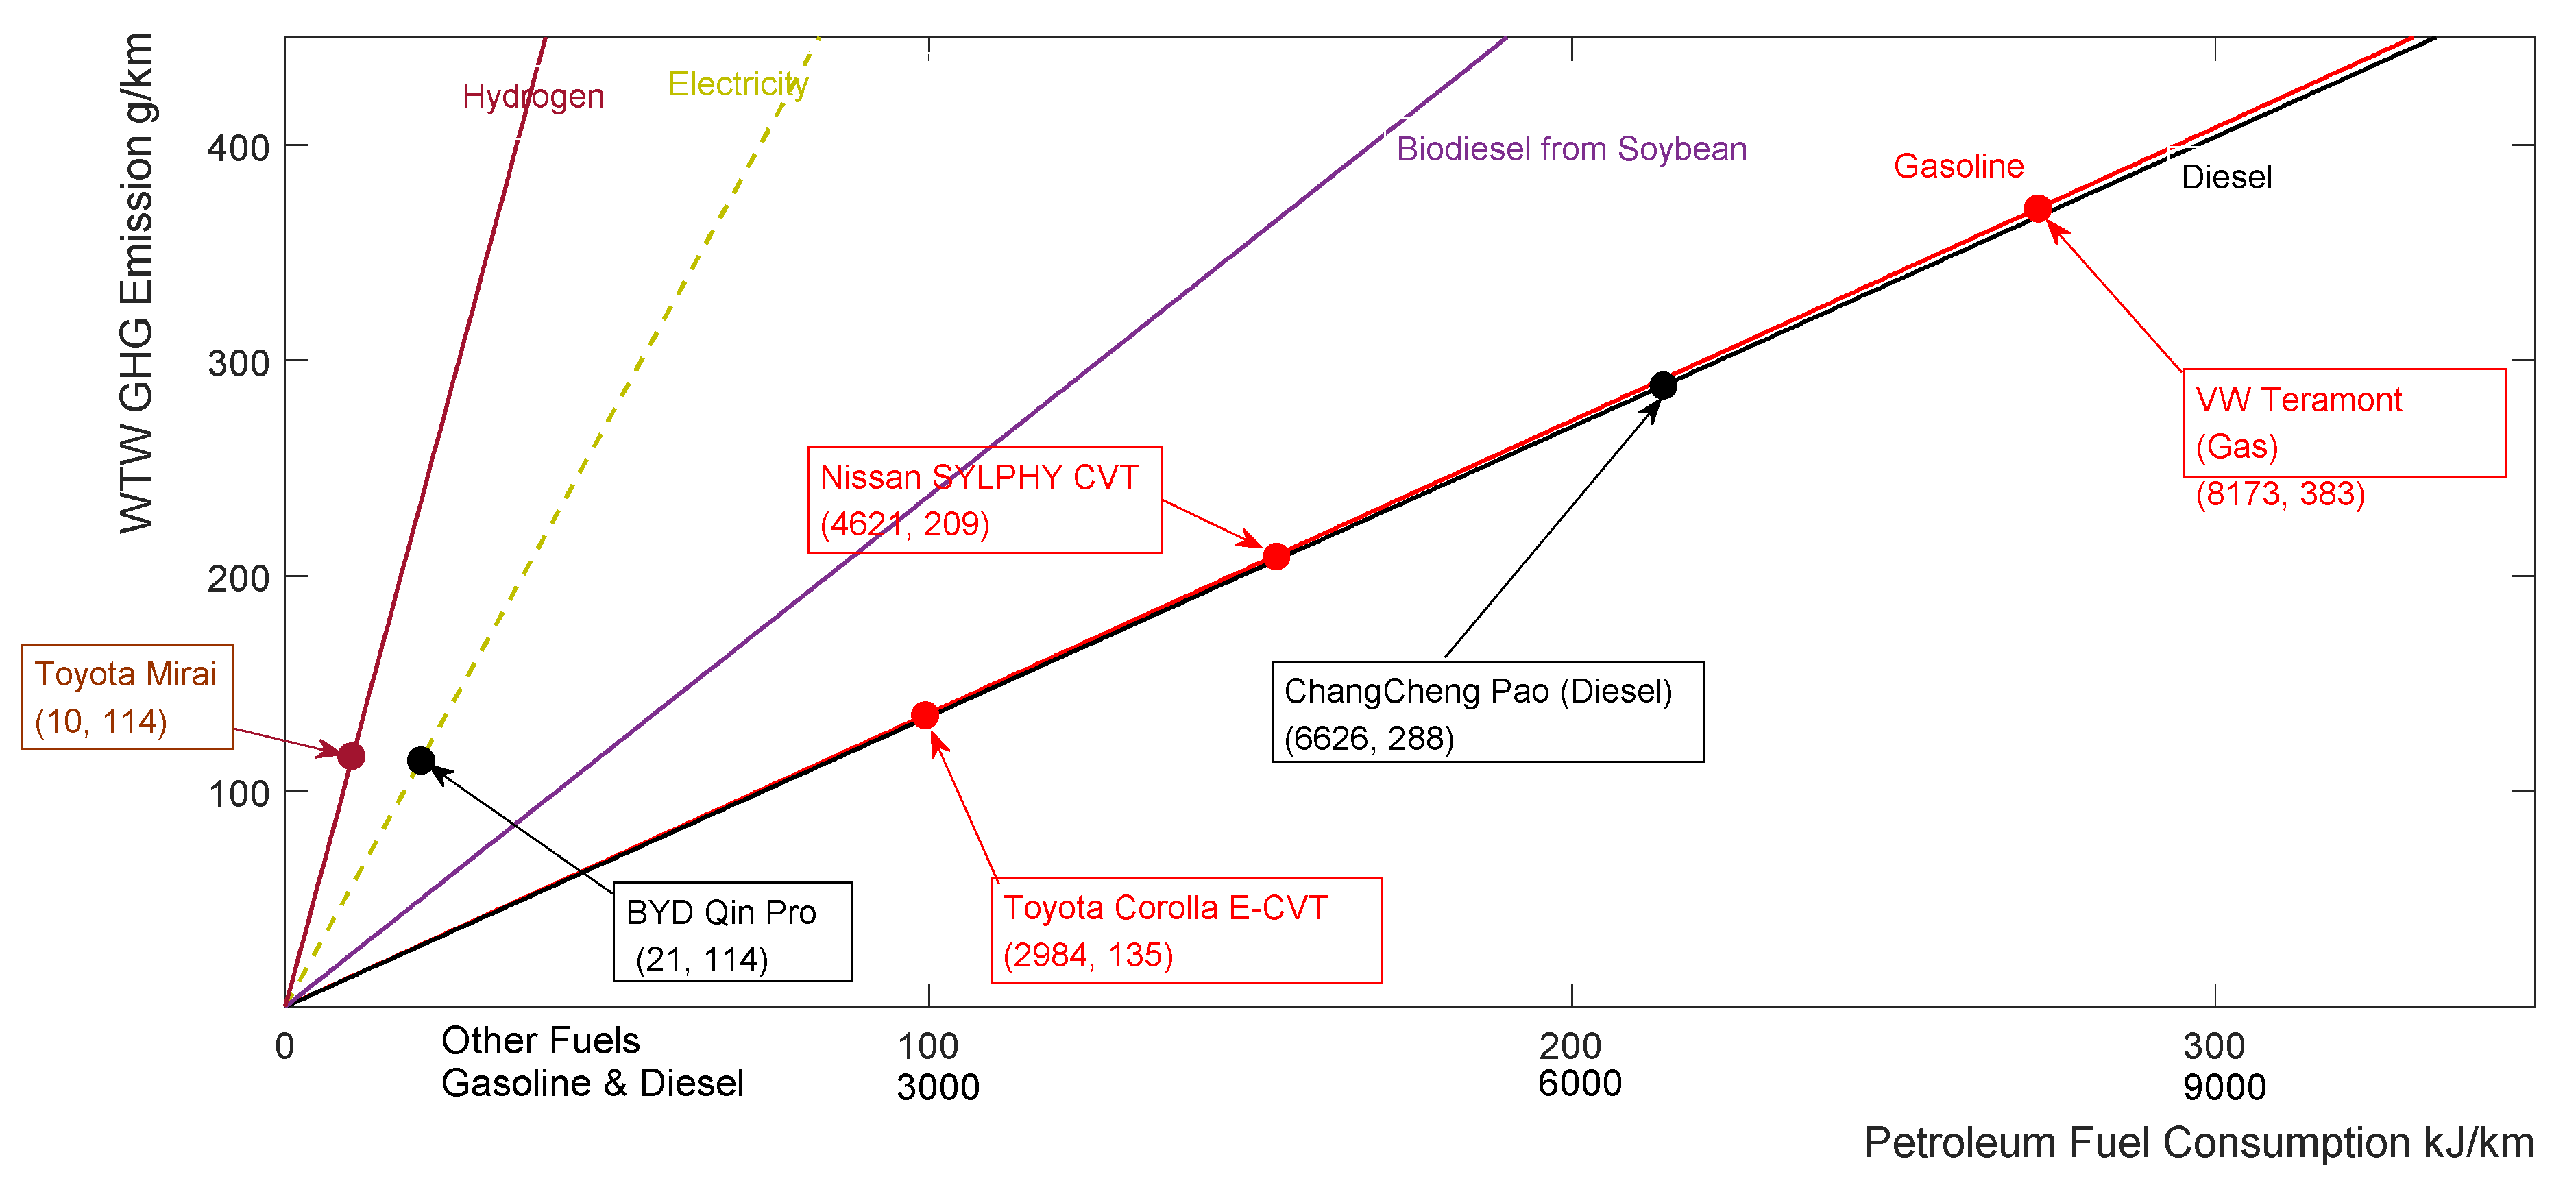
Figure 2.
WTW analysis of fuel selections and vehicle visualization based on data from 2020.
In Figure 2, there are two labels in the horizontal coordinate: the label with 3000/6000/9000 is used for gasoline and diesel fuel; the other labels (with 100/200/300 tricks) indicate hydrogen and electricity. The slope of these lines represents the dependency on petroleum fuel. A lower slope represents more dependency on petroleum fuel. The position of scatter points in the vertical coordinate represents the GHG emission performance. The higher they are towards an upright position, the worse the GHG emission performance. The Toyota Corolla shows the most energy efficiency among the three gasoline vehicles, as the Toyota Corolla occupies the lowest vertical position. Despite the WTW GHG emission of electricity being twice that of gasoline, the BYD Qin Pro has the best GHG emission performance, with 114 g/km. Since the overall onboard efficiency of BEV is much higher than that of the gasoline or diesel vehicle, most of the onboard energy of BEV can be used to drive the vehicle. Due to the poor efficiency of the ICE, only a tiny portion of one MJ of gasoline or diesel fuel can be used to drive the vehicle. Therefore, hydrogen fuel seems the most promising solution. First, the hydrogen fuel GHG performance is comparable with gasoline and diesel fuel, as shown in Table 1. Second, the fuel cell system’s onboard efficiency is high enough to fully utilize the potential of hydrogen fuel, such as in the even GHG emission performance of MIRAI and Qin Pro. Third, the hydrogen fuel’s consumption of petroleum fuel is lower than that of electricity. Figure 1 shows that the MIRAI petroleum fuel consumption is 10 kJ/km, while the BYD Qin Pro consumes 21 kJ/km. This lower consumption of petroleum fuel further relieves the petroleum fuel import.
4. Summary
Four fuel options are analyzed and compared based on GHG emissions, petroleum fuel consumption, and fossil fuel consumption. Hydrogen and electricity emit more GHG emissions in the PTW stage. However, the onboard efficiency of electric vehicles makes up for this drawback. The ICE vehicle with an advanced hybrid electric powertrain currently presents a very competitive solution in GHG emissions. The electric power for an electrified vehicle should come from renewable and sustainable sources, such as photovoltaic, wind power and hydropower, or low-emission nuclear power. Currently, the coal power generation share of total electricity generation has decreased from 70.4% in 2018 to 67.8% in 2020. Cleaner power generation technology is burgeoning and growing, as its share keeps on increasing in the total electricity generation. These developments could benefit cleaner hydrogen fuel.
Author Contributions
Conceptualization, Y.F. and Z.D.; methodology, Y.F.; software, Y.F.; validation, Y.F. and Z.D.; formal analysis, Y.F. and Z.D.; investigation, Y.F.; resources, Y.F.; data curation, Y.F.; writing—original draft preparation, Y.F.; writing—review and editing, J.Y. and Z.D.; visualization, Y.F.; supervision, Z.D.; project administration, J.Y.; funding acquisition, J.Y. All authors have read and agreed to the published version of the manuscript.
Funding
This research was funded by National Key R&D Program of China, grant number 2018YFC0604400. The APC was funded by Fundamental Research Funds for the Central Universities, grant number 00007461.
Institutional Review Board Statement
Not applicable.
Informed Consent Statement
Not applicable.
Acknowledgments
Support from Fundamental Research Funds for the Central Universities are gratefully acknowledged.
Conflicts of Interest
The authors declare no conflict of interest.
References
- Zheng, Y.; He, X.; Wang, H.; Wang, M.; Zhang, S.; Ma, D.; Wu, Y. Well-to-wheels greenhouse gas and air pollutant emissions from battery electric vehicles in China. Mitig. Adapt. Strateg. Glob. Chang. 2020, 25, 355–370. [Google Scholar] [CrossRef]
- Cai, W.; Wu, X.; Zhou, M.; Liang, Y.; Wang, Y. Review and Development of Electric Motor Systems and Electric Powertrains for New Energy Vehicles. Automot. Innov. 2021, 4, 3–22. [Google Scholar] [CrossRef]
- Hu, X.; Han, J.; Tang, X.; Lin, X. Powertrain Design and Control in Electrified Vehicles: A Critical Review. IEEE Trans. Transp. Electrif. 2021, 7, 1990–2009. [Google Scholar] [CrossRef]
- Wu, G.; Zhang, X.; Dong, Z. Powertrain architectures of electrified vehicles: Review, classification and comparison. J. Frankl. Inst. 2015, 352, 425–448. [Google Scholar] [CrossRef]
- Du, J.; Ouyang, M.; Chen, J. Prospects for Chinese electric vehicle technologies in 2016–2020: Ambition and rationality. Energy 2017, 120, 584–596. [Google Scholar] [CrossRef]
- Ke, W.; Zhang, S.; He, X.; Wu, Y.; Hao, J. Well-to-wheels energy consumption and emissions of electric vehicles: Mid-term implications from real-world features and air pollution control progress. Appl. Energy 2017, 188, 367–377. [Google Scholar] [CrossRef]
- Ren, J.; Andreasen, K.P.; Sovacool, B.K. Viability of hydrogen pathways that enhance energy security: A comparison of China and Denmark. Int. J. Hydrog. Energy 2014, 39, 15320–15329. [Google Scholar] [CrossRef]
- Ren, L.; Zhou, S.; Ou, X. Life-cycle energy consumption and greenhouse-gas emissions of hydrogen supply chains for fuel-cell vehicles in China. Energy 2020, 209, 118482. [Google Scholar] [CrossRef]
- Wang, C.; Zhou, S.; Hong, X.; Qiu, T.; Wang, S. A comprehensive comparison of fuel options for fuel cell vehicles in China. Fuel Process. Technol. 2005, 86, 831–845. [Google Scholar] [CrossRef]
- Li, M.; Zhang, X.; Li, G. A comparative assessment of battery and fuel cell electric vehicles using a well-to-wheel analysis. Energy 2016, 94, 693–704. [Google Scholar] [CrossRef]
- Gupta, P.; Tong, D.; Wang, J.; Zhuge, W.; Yan, C.; Wu, Y.; Luo, S.; He, X.; Ma, F. Well-to-wheels total energy and GHG emissions of HCNG heavy-duty vehicles in China: Case of EEV qualified EURO 5 emissions scenario. Int. J. Hydrogen Energy 2020, 45, 8002–8014. [Google Scholar] [CrossRef]
- Argonne National Laboratory, GREET: The Greenhouse Gases, Regulated Emissions, and Energy Use in Transportation Model. 2017. Available online: https://greet.es.anl.gov/ (accessed on 31 May 2021).
- National Standardization Administration. GB/T34370-2019 Conversion Methods for Energy Consumption of Electric Vehicles; National Standardization Administration: Beijing, China, 2019.
- XiaoXiongYouHao. Xiaoxiongyouhao.com. 2021. Available online: https://www.xiaoxiongyouhao.com/chxi_report_list.php (accessed on 25 March 2021).
- Compare Fuel Cell Vehicles. Fueleconomy.Gov. 2021. Available online: https://fueleconomy.gov/feg/fcv_sbs.shtml (accessed on 23 March 2021).

Publisher’s Note: MDPI stays neutral with regard to jurisdictional claims in published maps and institutional affiliations. |
© 2021 by the authors. Licensee MDPI, Basel, Switzerland. This article is an open access article distributed under the terms and conditions of the Creative Commons Attribution (CC BY) license (https://creativecommons.org/licenses/by/4.0/).