Article

Collaborative Design for Uneven Physical Structures of Multi-Layers in PEMFC

1
College of Mechanical and Vehicle Engineering, State Key Laboratory of Advanced Design and Manufacturing for Vehicle Body, Hunan University, Changsha 410082, China
2
JIANGXI KMAX Industrial Co., Ltd., Nanchang 330100, China
*
Author to whom correspondence should be addressed.
World Electr. Veh. J. 2021, 12(3), 148; https://doi.org/10.3390/wevj12030148
Submission received: 28 July 2021 / Revised: 16 August 2021 / Accepted: 26 August 2021 / Published: 8 September 2021

Abstract

:
A collaborative design for the uneven distributions of a flow channel, gas diffusion layer porosity and catalyst layer porosity are newly proposed to improve the utilization ratio of the membrane electrode assembly of the proton exchange membrane fuel cell. The effects of the uneven design of the rib width and of the uneven porosity parameters of the cathode and anode gas diffusion layer and catalyst layer on the fuel cell performance were studied in detail. Numerical simulations were designed and implemented for validation. The results show that the fuel cell performance could be improved through the collaborative design of uneven distributions for different layers. The rib width gradually decreasing and the porosity of the cathode gas diffusion layer and the cathode catalyst layer gradually increasing along the fluid flow direction would contribute to a better design compared to the regular even design. The new uneven design can make the fuel penetrate into the catalyst layer in time to participate in the reaction, improve the utilization rate of the membrane electrode assembly, and greatly improve the performance of the fuel cell.

1. Introduction

In recent years, proton exchange membrane fuel cells (PEMFCs) have received more and more attention due to their outstanding advantages such as a high efficiency, environmental friendliness, long life, easy water discharge, high specific power and specific energy. Research work is mainly dedicated to optimizing the performance of PEMFC to realize the commercialization of the fixed and automotive power supplies. The design of the flow field structure of the fuel cell bipolar plate plays an important role in the distribution of reactant gas and the distribution of liquid water in the channel [1]. In addition, the gas diffusion layer (GDL) and catalyst layer (CL), as important parts of the membrane electrode assembly (MEA) of a PEMFC, provide mass transfer channels for reactants and products, and affect the progress of electrochemical reactions inside the fuel cell. The design of the flow field structure, gas diffusion layer and catalyst layer significantly affect the transmission characteristics, performance and life of PEMFC [2].
A reasonable PEMFC flow channel design will adjust the fuel transport speed in the channel itself and the GDL before reaching the CL where the reaction occurs. The uniform distribution of the reaction gas in the flow channel will help provide a uniform current density in the reaction zone inside the fuel cell [3]. Shimpalee et al. [4] studied the performance changes of the channel/rib dimension with different configurations of the PEMFC flow field structure. Manso et al. [3] numerically studied the effect of the channel cross-sectional aspect ratio (defined as the height/width ratio) of the serpentine flow field on the performance of PEMFC. Park et al. [5] studied the effects of different channel widths and rib widths in a single serpentine flow field on the performance of the direct methanol fuel cell (DMFC) through numerical and experimental studies. The above research mainly studies its influence on fuel cell performance by adjusting the geometric parameters of the flow channel.
As a bridge between the catalyst layer and the flow channel layer, the gas diffusion layer plays a role in transporting reactants and products. A reasonable porosity distribution can provide better transportation conditions and optimize the mass transfer process. Zhou et al. [6] studied the influence of the compression deformation of the PEMFC gas diffusion layer (GDL) on contact resistance and porosity, and then analyzed the performance changes of the fuel cell. Mahmoudi et al. [7] studied the influence of the uneven compression of GDL on the cathode side of a proton exchange membrane fuel cell with an interdigital flow field on fuel cell water management and performance. Chi et al. [8] experimentally and theoretically studied the influence of GDL porosity nonuniformity caused by clamping force on fuel cell performance. Shangguan et al. [9] analyzed the influence of the porosity distribution, pressure drop and contact angle of the gas diffusion layer on the liquid water transportation process. Rabissi et al. [10] used a reasonably improved 1D + 1D physical model to support the development of gradient MEA. Kanchan et al. [2] defined different nonuniform porosity structures by step functions to study the influence of the porosity configuration in the cathode GDL on the electrochemical performance of high-temperature PEMFC. By directly or indirectly changing the porosity distribution of the diffusion layer, the transportation process of the diffusion layer is adjusted to improve the performance of the fuel cell.
As an important part of the MEA, the catalyst layer is a place that directly affects the internal electrochemical reaction of the fuel cell. Its structural design has a significant impact on the current density distribution of the fuel cell. Jiang et al. [11] focused on building an orderly structured catalyst layer on an orderly direct methanol fuel cell. The results show that the direct methanol fuel cell with ordered electrodes produces a better cell performance. Havaej et al. [12] numerically studied the influence of different catalyst loading distributions along horizontal and vertical changes on the performance of PEMFC. Ebrahimi et al. [13] used the new model to determine the optimal catalyst load distribution along the cathode catalyst layer (CCL), which improved the power density of PEMFC. Ebrahim et al. [14] performed optimization by integrating computational fluid dynamics (CFD) models and genetic algorithm optimization methods. It was determined that the maximum power density of PEMFC was increased by about 14% under the optimal catalyst load distribution. Zheng et al. [15] proposed that gradient CCL was one of the effective structures for improving the performance and durability of fuel cells. It also provided a strategy to achieve a highly durable PEMFC by combining the particle size gradient and Pt loading in the CCL structure. Yin et al. [16] improved the fuel cell performance by changing the porosity of the catalyst layer, the electrolyte fraction in the agglomerate particles, and the agglomerate particle size distribution. The catalyst layer load distribution and porosity distribution affect the electrochemical reaction rate. Appropriate structural parameters of the catalyst layer can increase the power density of the fuel cell. Soler et al. [17] studied the influence of electrode permeability and flow field configuration on the performance of PEMFC, and the effect of electrode permeability largely depends on the flow field mode. The effects of the membrane electrode assembly parameters and bipolar plate flow field structure on the performance of PEMFC are closely related.
To improve the utilization rate of the membrane electrode assembly of the proton exchange membrane fuel cell, a collaborative design method for the uneven distribution of the flow channel, the porosity of the gas diffusion layer and the porosity of the catalyst layer is proposed in the present research. The effects of the uneven design of the rib width and uneven porosity parameters of the cathode and anode gas diffusion layer and catalyst layer on the fuel cell performance will be studied in detail, and the best optimized matching results will be obtained.

2. Model Description

A numerical simulation model will first be constructed for a discussion on the uneven design.

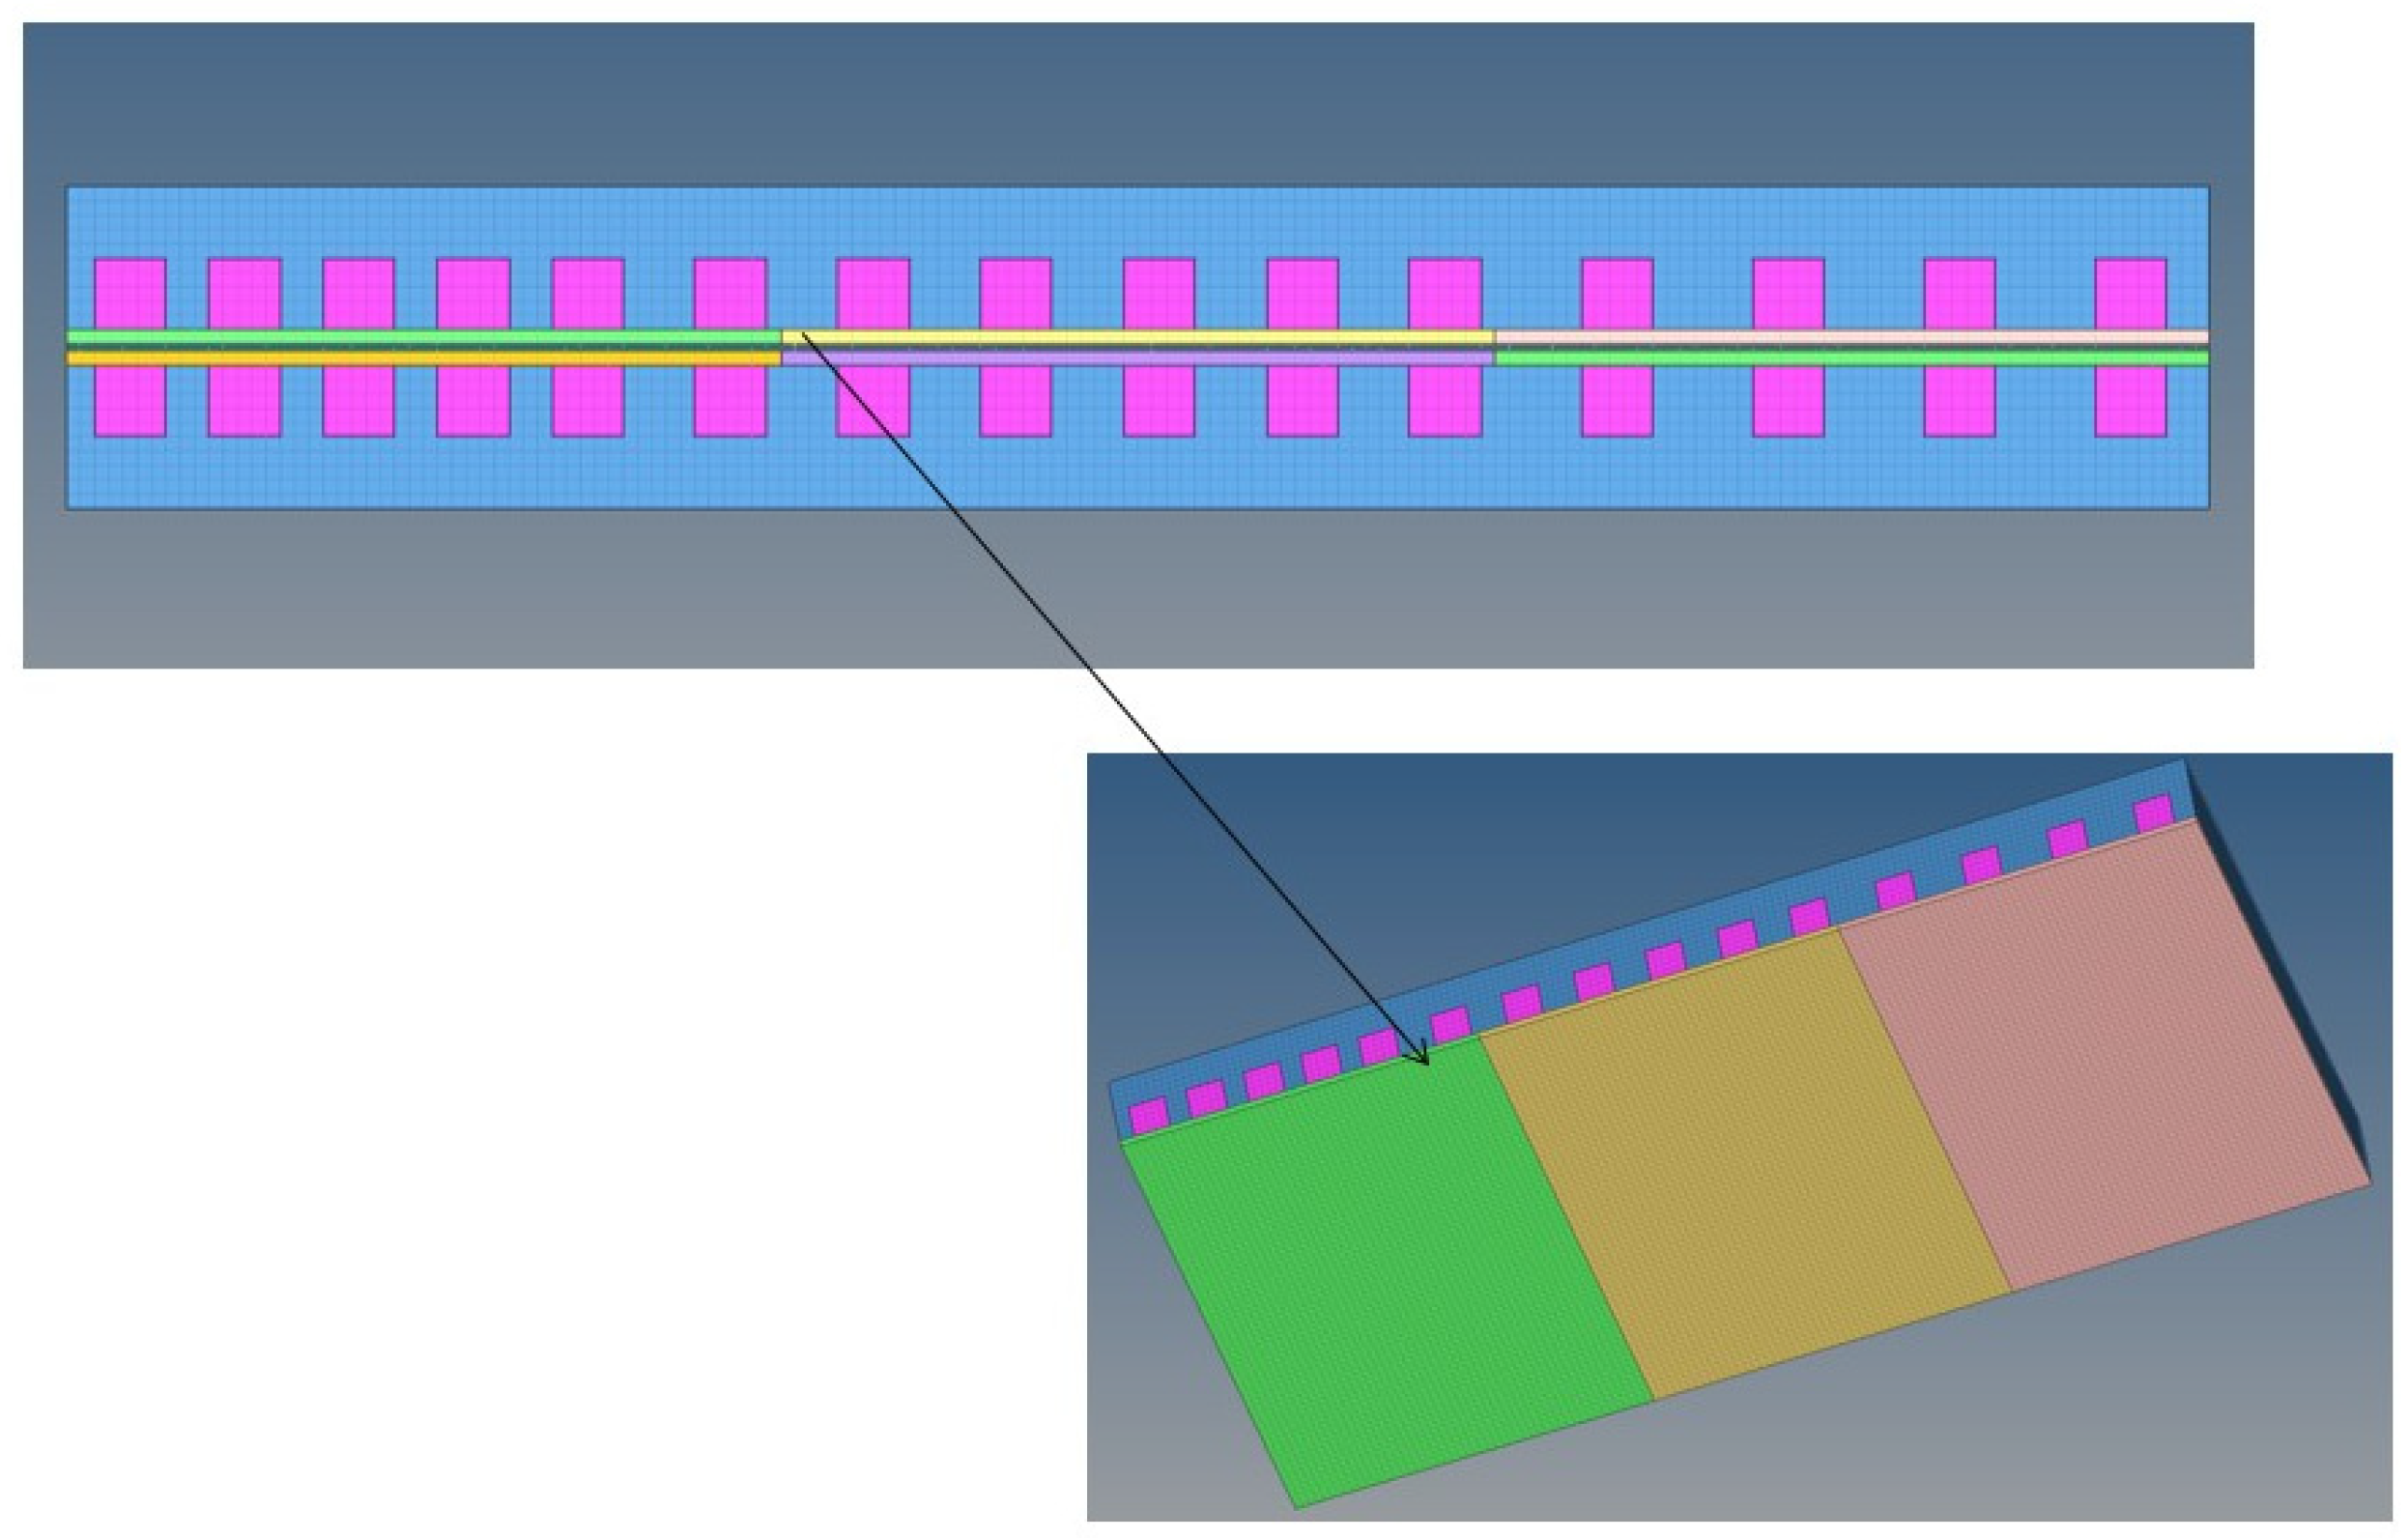
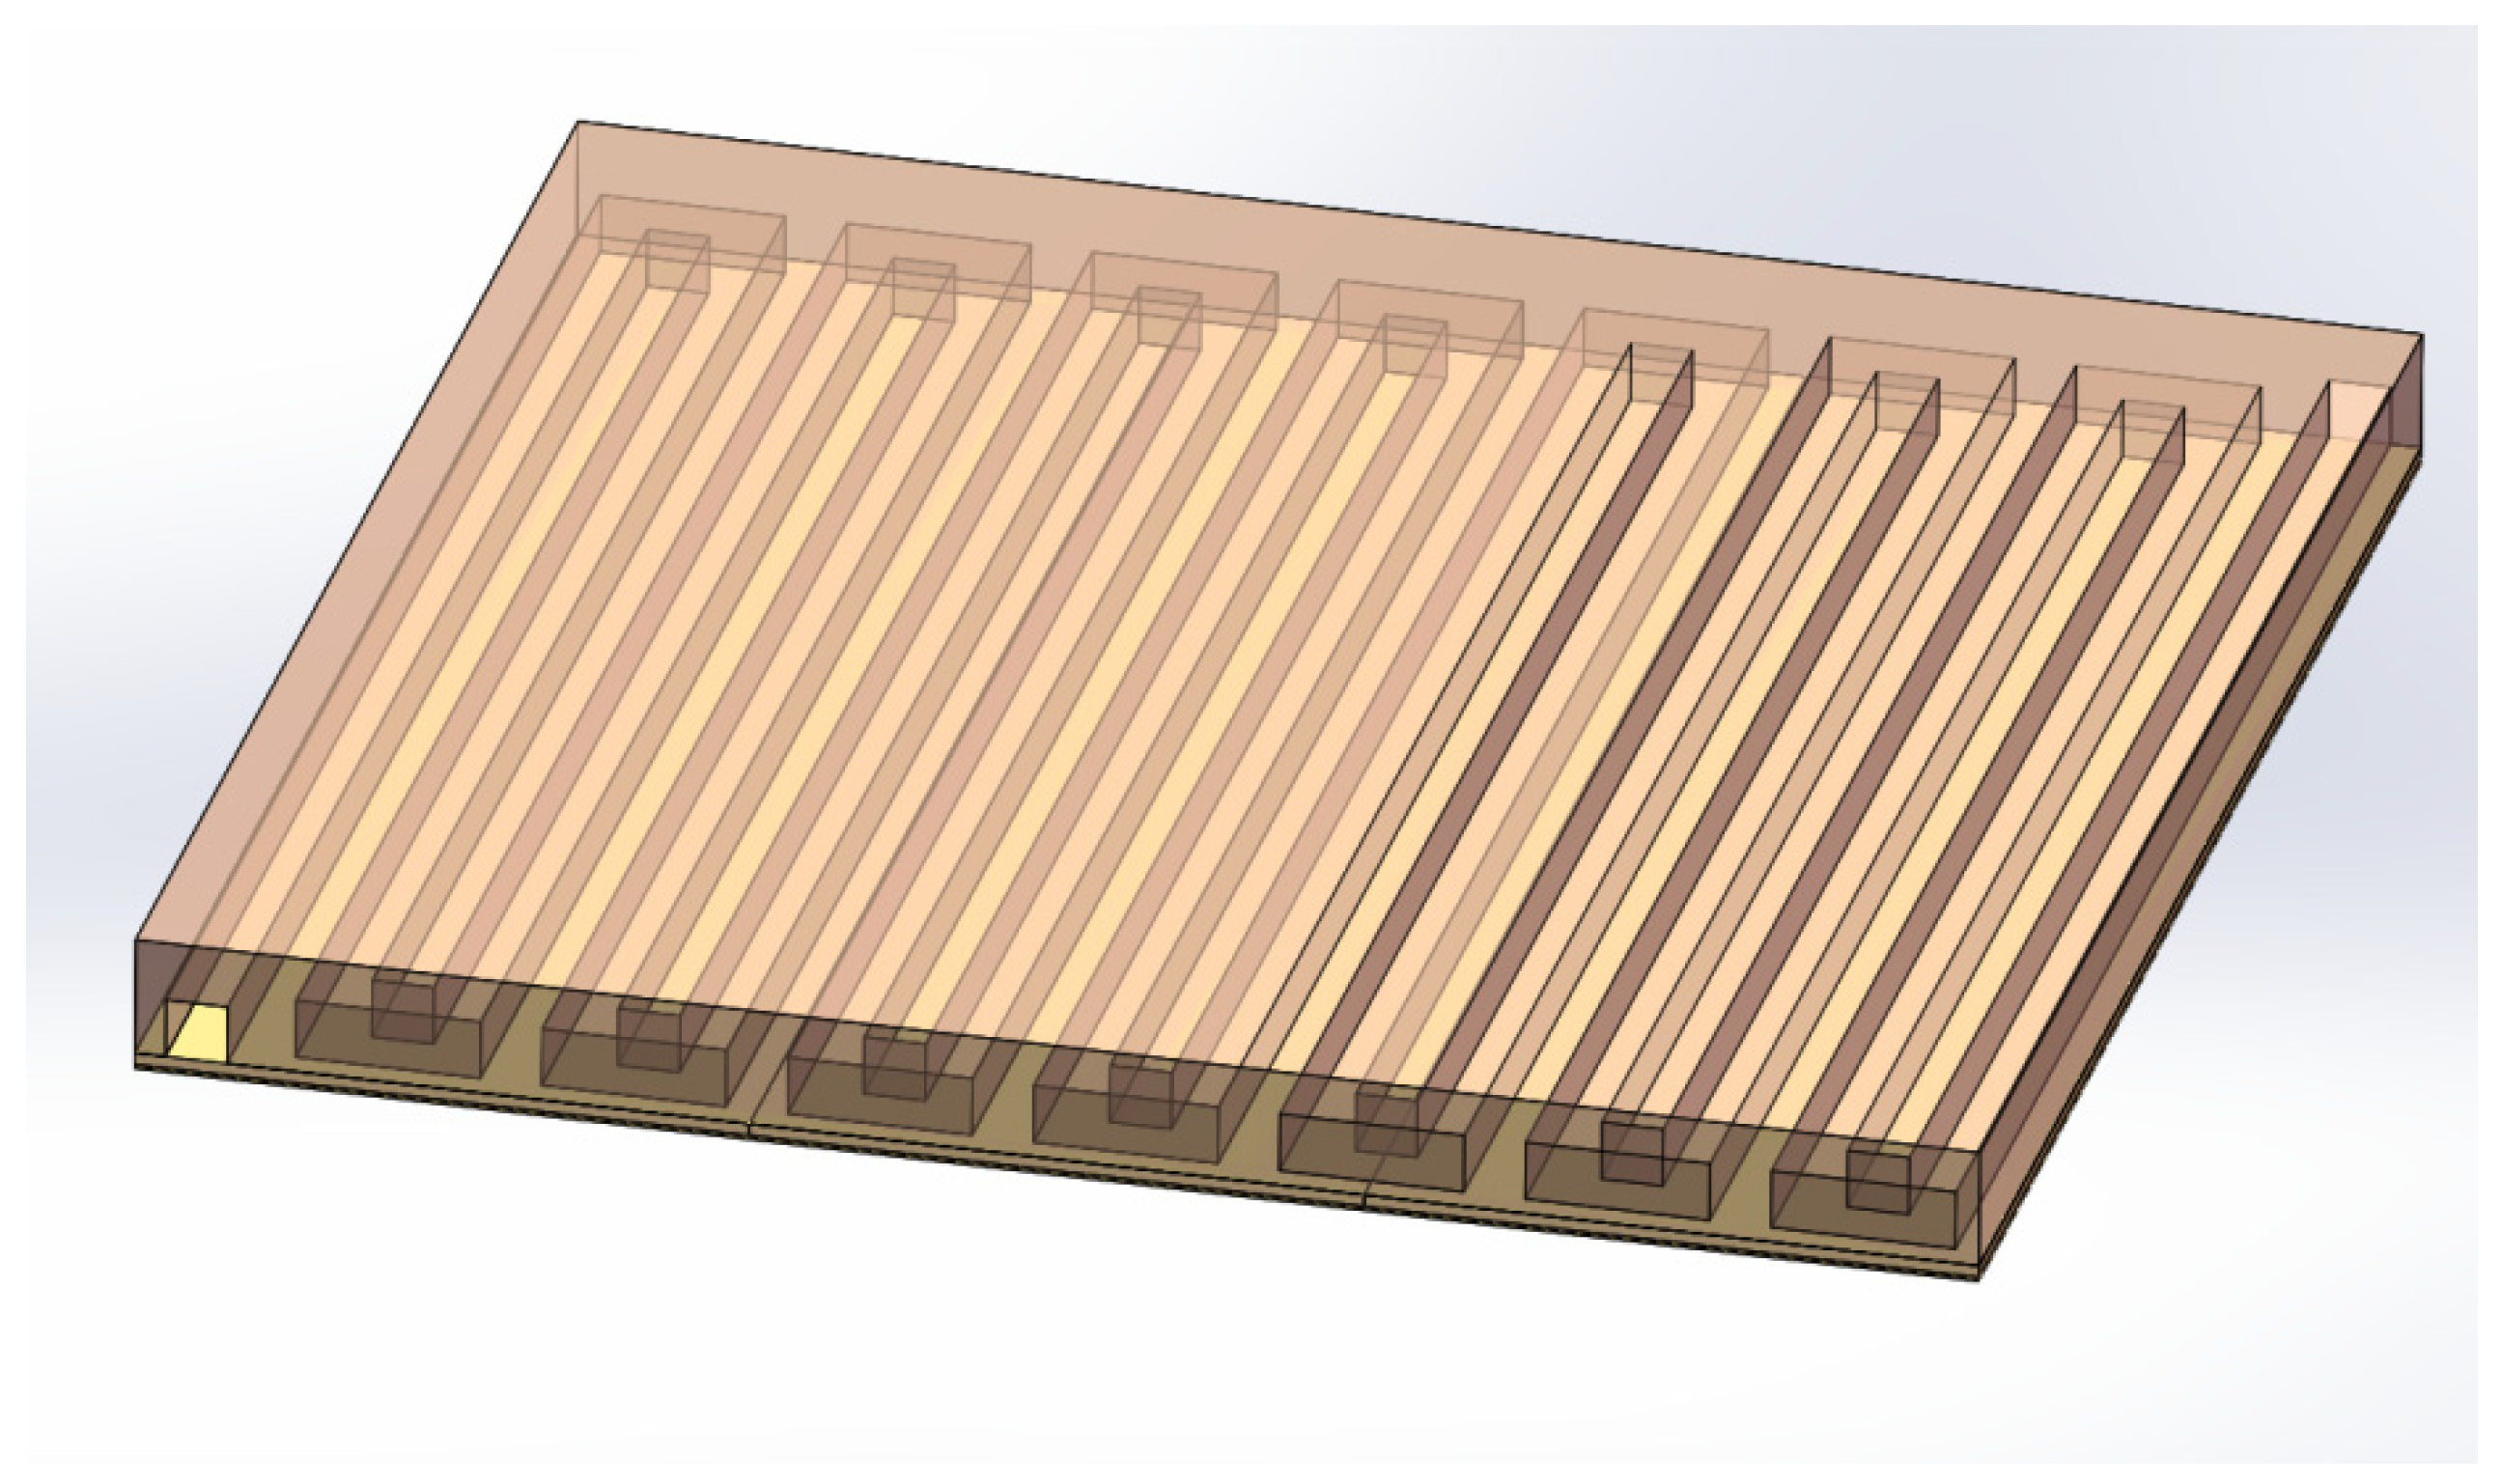
2.1. Numerical Simulation Model

Numerical simulation models for different designs of the proton exchange membrane fuel cell (PEMFC) were constructed. The effective area is 30 mm × 30 mm, and both the cathode and anode are single serpentine flow channels. One numerical model with an even design is built for reference during the analyses of the uneven designs. The schematic diagram of the PEMFC anode is shown in Figure 1, and the structural parameters and operating parameters for the model construction are shown in Table 1 and Table 2. The voltage 0.6 V is selected as the working voltage for the fuel cell in the subsequent analyses.
For the uneven design, the rib width, the porosity of the gas diffusion layer and the catalyst layer are differentially designed in areas, as shown in Figure 2. Detailed information of the different layers for the uneven design is provided in Table 3.
Table 3 shows various combinations of uneven distribution, where-represents that the parameters of different layers are kept unchanged; and ↑ (↓) represents that the rib width, the porosity of the gas diffusion layer or the catalyst layer gradually increases (decreases) along the fluid flow direction. Among them, the uneven distribution is achieved by dividing each part of the structure into three regions and setting each structural parameter in each region. The flow channel width is 0.4 mm as the rib widths are set to 0.6 mm, 1 mm and 1.4 mm, respectively; the gas diffusion layer porosity is set to 0.3, 0.5 and 0.7 with a step value of 0.2; the catalyst layer porosity is set to 0.3, 0.5 and 0.7, respectively, with a step value of 0.2. The average value of the structural parameters of each part remains unchanged during the design process. The fuel cell performance of each combination under the selected operating voltage will be predicted through simulations.

2.2. Governing Equations

The PEMFC module of Fluent software was used to study the performance changes of the proton exchange membrane fuel cell. The main assumptions of the fuel cell model are as follows:
(1)
The fuel cell operates under steady-state conditions.
(2)
The reactant gases introduced are all incompressible ideal gases.
(3)
The fuel cell works at a constant temperature.
(4)
The gas diffusion layer, catalyst layer and membrane are all isotropic porous media materials.
(5)
The fluid flow is laminar.
The physical phenomena that occur in PEMFC fuel cells can generally be expressed as the solutions of conservation equations such as mass, momentum, energy, composition, and current transmission. The main theoretical control equations are as follows:
(1)
Mass conservation equation:
ρ t + ( ρ υ ) = 0
where ρ is the density; υ is the velocity vector.
(2)
Momentum conservation equation:
( ρ υ ) t + ( ρ υ υ ) = p + ( μ e f f υ ) + S m
where p is the fluid pressure, μeff is the average viscosity of the mixture, and Sm is the momentum source term. For different regions of the fuel cell, the momentum source term is different.
For the gas flow channel:
S m = 0
For the gap between the support layer and the catalyst layer:
S m = μ K ε υ
where K is the permeability of the gas diffusion layer or the catalyst layer, and ε is the porosity of the gas diffusion layer.
For water transport in the polymer phase, an additional momentum source term is electrokinetic permeability:
S m = μ K p ε m x m υ + K Φ K P c f n f F ϕ m
where εm is the water porosity of the membrane, xm is the volume fraction of ionomer in the catalyst layer, Kf is the electrokinetic permeability, Kp is the hydraulic permeability of the membrane, cf is the fixed charge concentration, nf is the number of sulfonic acid ion charges, F is the Faraday constant and Φm is the ionomer phase potential.
(3)
Energy conservation equation:
The energy conservation in any area of PEMFC can be described as:
( ρ c p ) e f f T t + ( ρ c p ) e f f ( υ T ) = ( k e f f T ) + S e
where cp is the average specific heat capacity of the mixture, T is the temperature, k is the thermal conductivity, Se is the energy source term, and the subscript eff represents the effectiveness of the porous medium.
( ρ c p ) e f f = ( 1 ε ) ρ s c p , s + ε ρ c p
k e f f = 2 k s + [ ε 2 k s + k + 1 ε 3 k s ] 1
where ρs, cp,s, and ks respectively represent the temperature, specific heat capacity and thermal conductivity of the solid mixture.
The energy source term in the energy conservation equation includes the heat generated by the reaction, resistance heating and (or) the heat generated by evaporation or condensation in the phase change.
(4)
Constituent conservation equation:
( ε ρ x i ) t + ( υ ε ρ x i ) = ( ρ D i e f f x i ) + S s , i
where xi is the mass fraction of the gas component, and Ss,i is the component source or sink. In porous media, Di,eff is a function of the porosity ε and tortuosity τ.
D i , e f f = D i ε τ
where Di is the free flow mass diffusion coefficient.
The source term Ss,i in the component conservation equation is all 0, except in the catalyst layer where the components are consumed or produced by the electrochemical reaction. In the catalyst layer, the source terms Ss,i of hydrogen, oxygen, water vapor, and liquid water are:
S s , H 2 = j a M H 2 2 F
S s , O 2 = j c M O 2 4 F
S s , H 2 O ( g ) = σ A f g ( x s a t x H 2 O ( g ) )
S s , H 2 O ( l ) = + j c M H 2 O 2 F σ A f g ( x s a t x H 2 O ( g ) )
In the water source term, it is assumed that water is produced in liquid form and will evaporate when the adjacent air or oxygen is not saturated.
(5)
Charge conservation equation:
The current transfer can be described by the governing equation of the conservation of charge; for the current, it is:
( κ s e f f ϕ s ) = S ϕ s
For the ion current, it is:
( κ m e f f ϕ m ) = S ϕ m
where κ s e f f is the electrical conductivity in the solid phase, and κ m e f f is the ionic conductivity in the ionomer phase (including the membrane). ϕs is the solid phase potential, ϕm is the electrolytic liquid phase potential, and Sϕ is the source term that refers to the transfer current. In the anode catalyst layer Sϕs = −ja and Sϕm = −ja, in the cathode catalyst layer Sϕs = jc and Sϕm = −jc, and for the rest Sϕ = 0.

3. Results and Discussion

3.1. Effects of Uneven Design of Different Layers

Numerical simulation models were constructed according to the numerical experiment design in Table 3. With the implementation of numerical simulations, the results of the uneven designs were compared. The best combination of uneven rib width and uneven porosity distributions for the gas diffusion layer and the catalyst layer would be achieved. The comparison between uneven and even designs would also be implemented.
The various combinations of the uneven design are shown in Table 4. The parameters in the table include the parameter values of the rib width, gas diffusion layer and catalyst layer porosity in each region along the fluid flow direction. Model 1 (Model 2) is an uneven design in which the width of the ribs in the flow field is gradually reduced (increased) along the direction of the fluid flow and the porosity of each layer is uniformly distributed. Model 3 to model 14 are uneven designs with a uniform rib width and uneven porosity of the gas diffusion layer or catalyst layer.
Changing the rib width shows that along the fluid flow direction, if the rib width gradually increases, the performance is reduced by 6.59%, while if the rib width is gradually reduced, the performance is increased by 8.10%. Compared with a regular even flow field design, a reasonable change of the rib width can adjust the distribution of reactants. The pressure distribution of the cathode flow channel layer when the rib width is not uniform is shown in Figure 3. Along the fluid flow direction, the pressure of the flow channel gradually decreases, and the flow rate of the reactant gradually decreases. When the rib width goes from large to small, this can slow down the pressure drop of the flow channel layer. The hydrogen concentration distribution diagram of the anode diffusion layer is shown in Figure 4. When approaching the outlet of the flow channel, reducing the rib width allows more fuel to diffuse into the MEA, which is beneficial to improving the utilization rate of the reactants. From the standard deviation of the H2 concentration distribution in the diffusion layer in Table 5, it can be seen that the hydrogen concentration distribution of the model 2 is more uniform, which is more conducive to the penetration of hydrogen into the catalyst layer in order for it to participate in the reaction.
The performance change rate of each combination is calculated and exhibited in Table 4. The results show that the uneven porosity design of the cathode diffusion layer and the catalyst layer plays a better role. Along the fluid flow direction, the porosity gradually increases to show a better performance. Compared with the even design, the performance of the optimized uneven design (Model 13) has increased by 2.61%. The reason lies in the fact that the fuel has a strong squeezing effect and the gas diffuses smoothly into the catalyst layer when it is close to the inlet of the flow channel. Close to the outlet of the flow channel, the internal pressure at this time is not enough to allow more gas to penetrate into the diffusion layer. Increasing the porosity can help more gas participate in the reaction and improve the utilization rate of the membrane electrode. Compared with the anode, the uneven porosity distribution of the cathode can better reflect this effect, as the cathode is fed with air which has a lower concentration for the reactant oxygen. The rational distribution of the porosity distribution plays a positive role, which is more conducive to the electrochemical reaction of the reactants in the cathode catalyst layer.

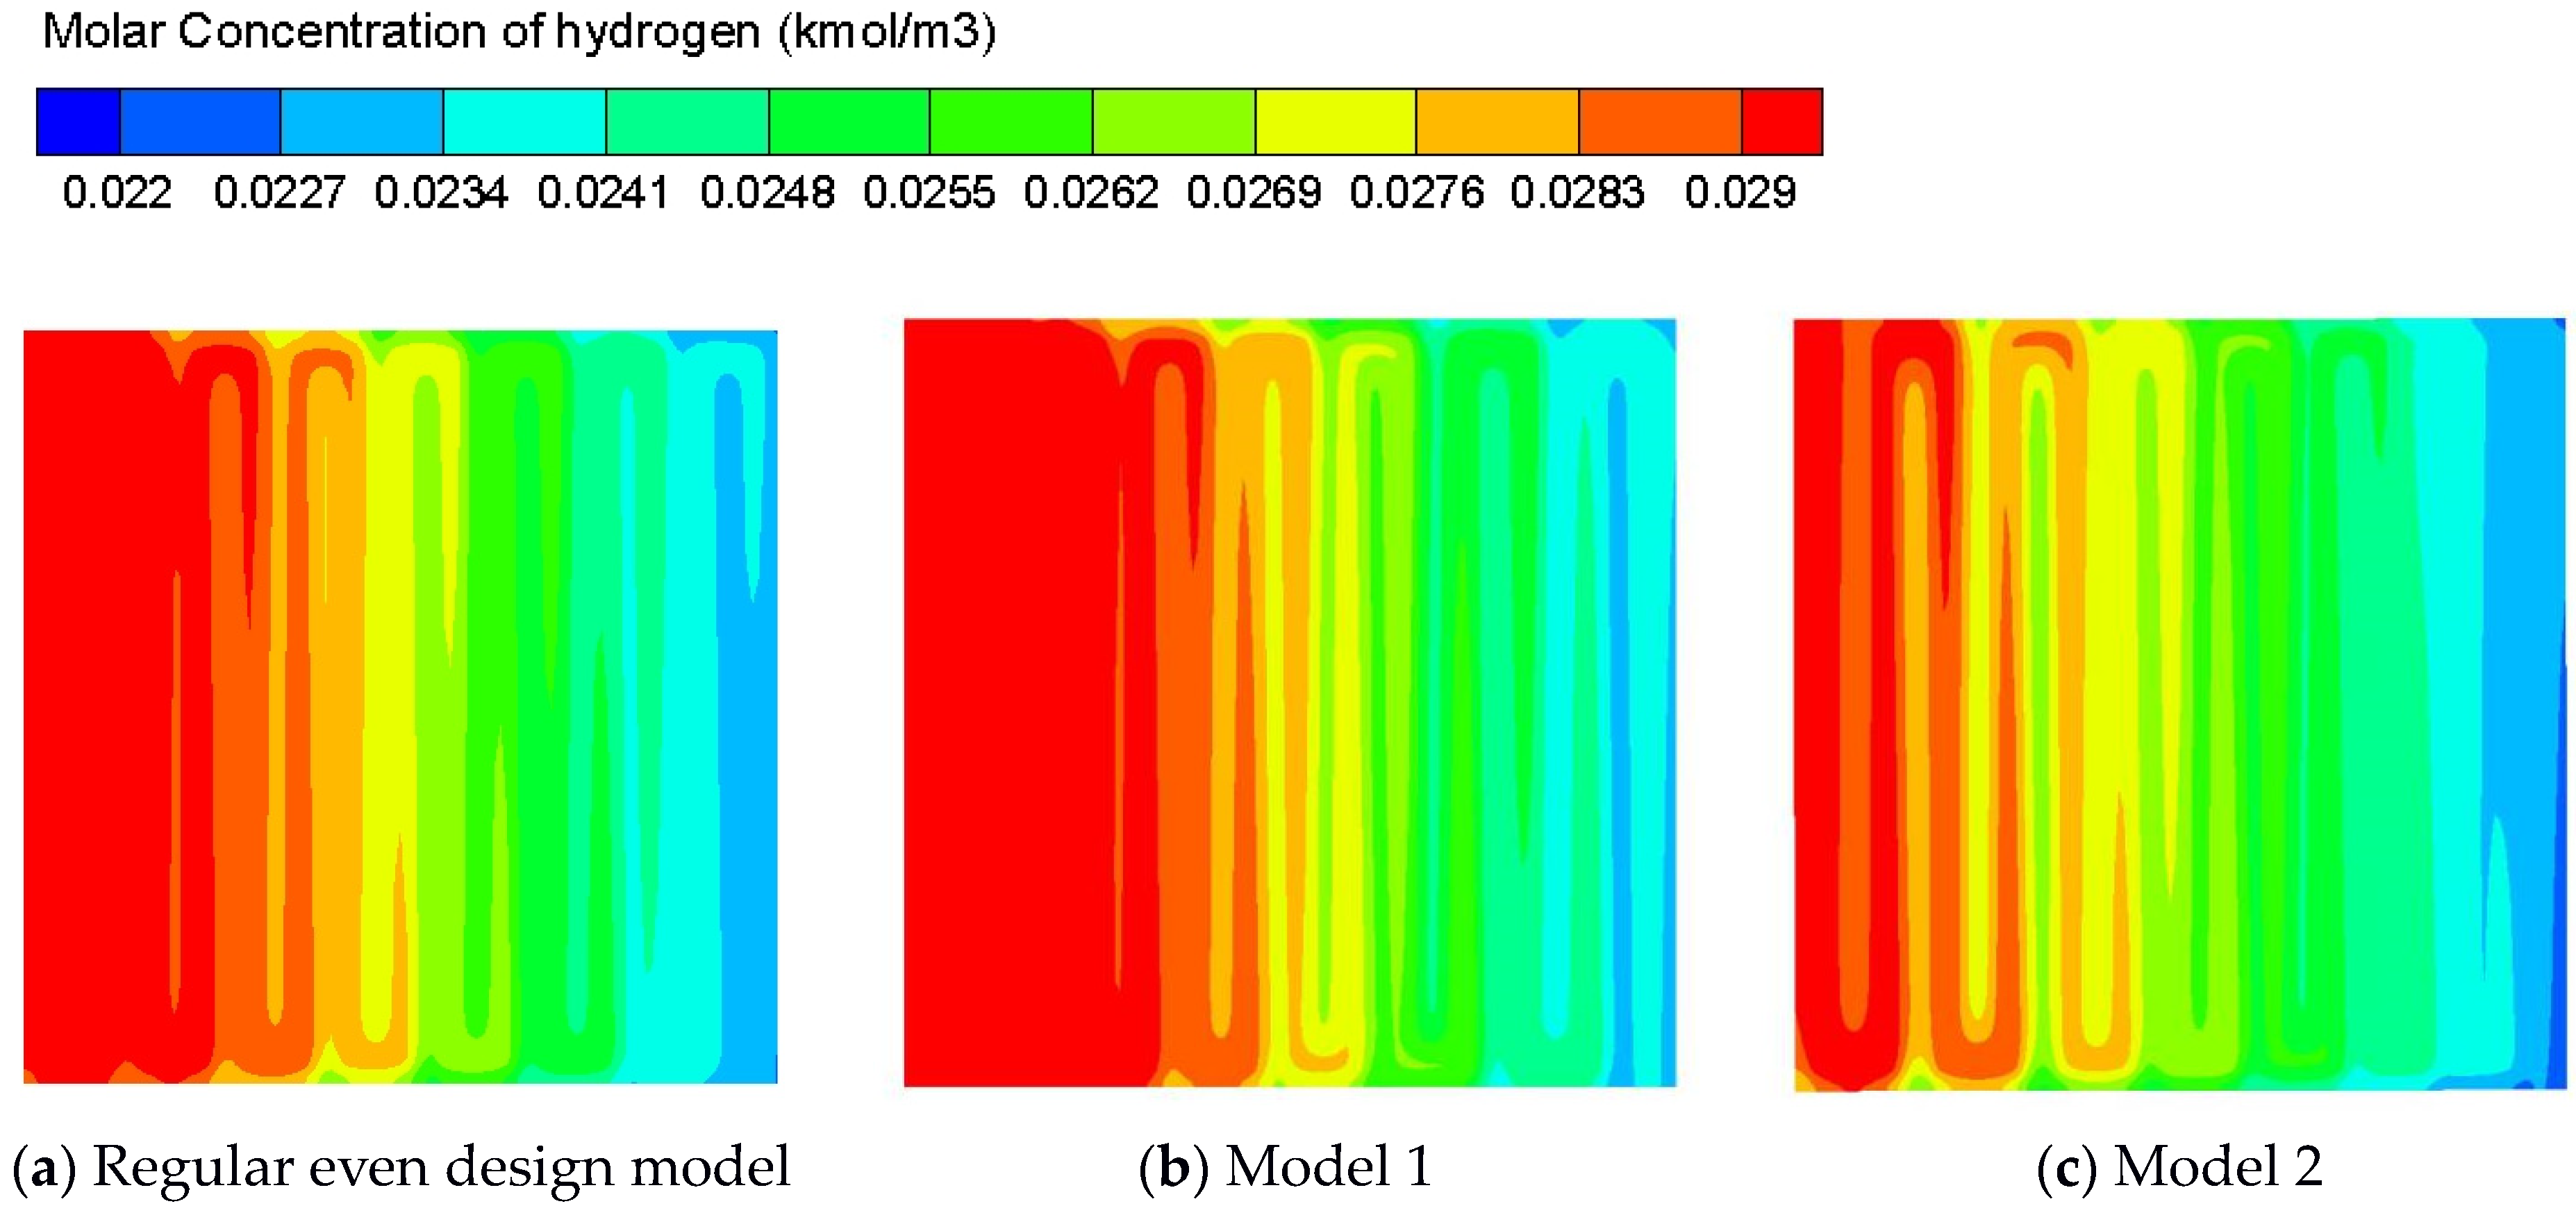
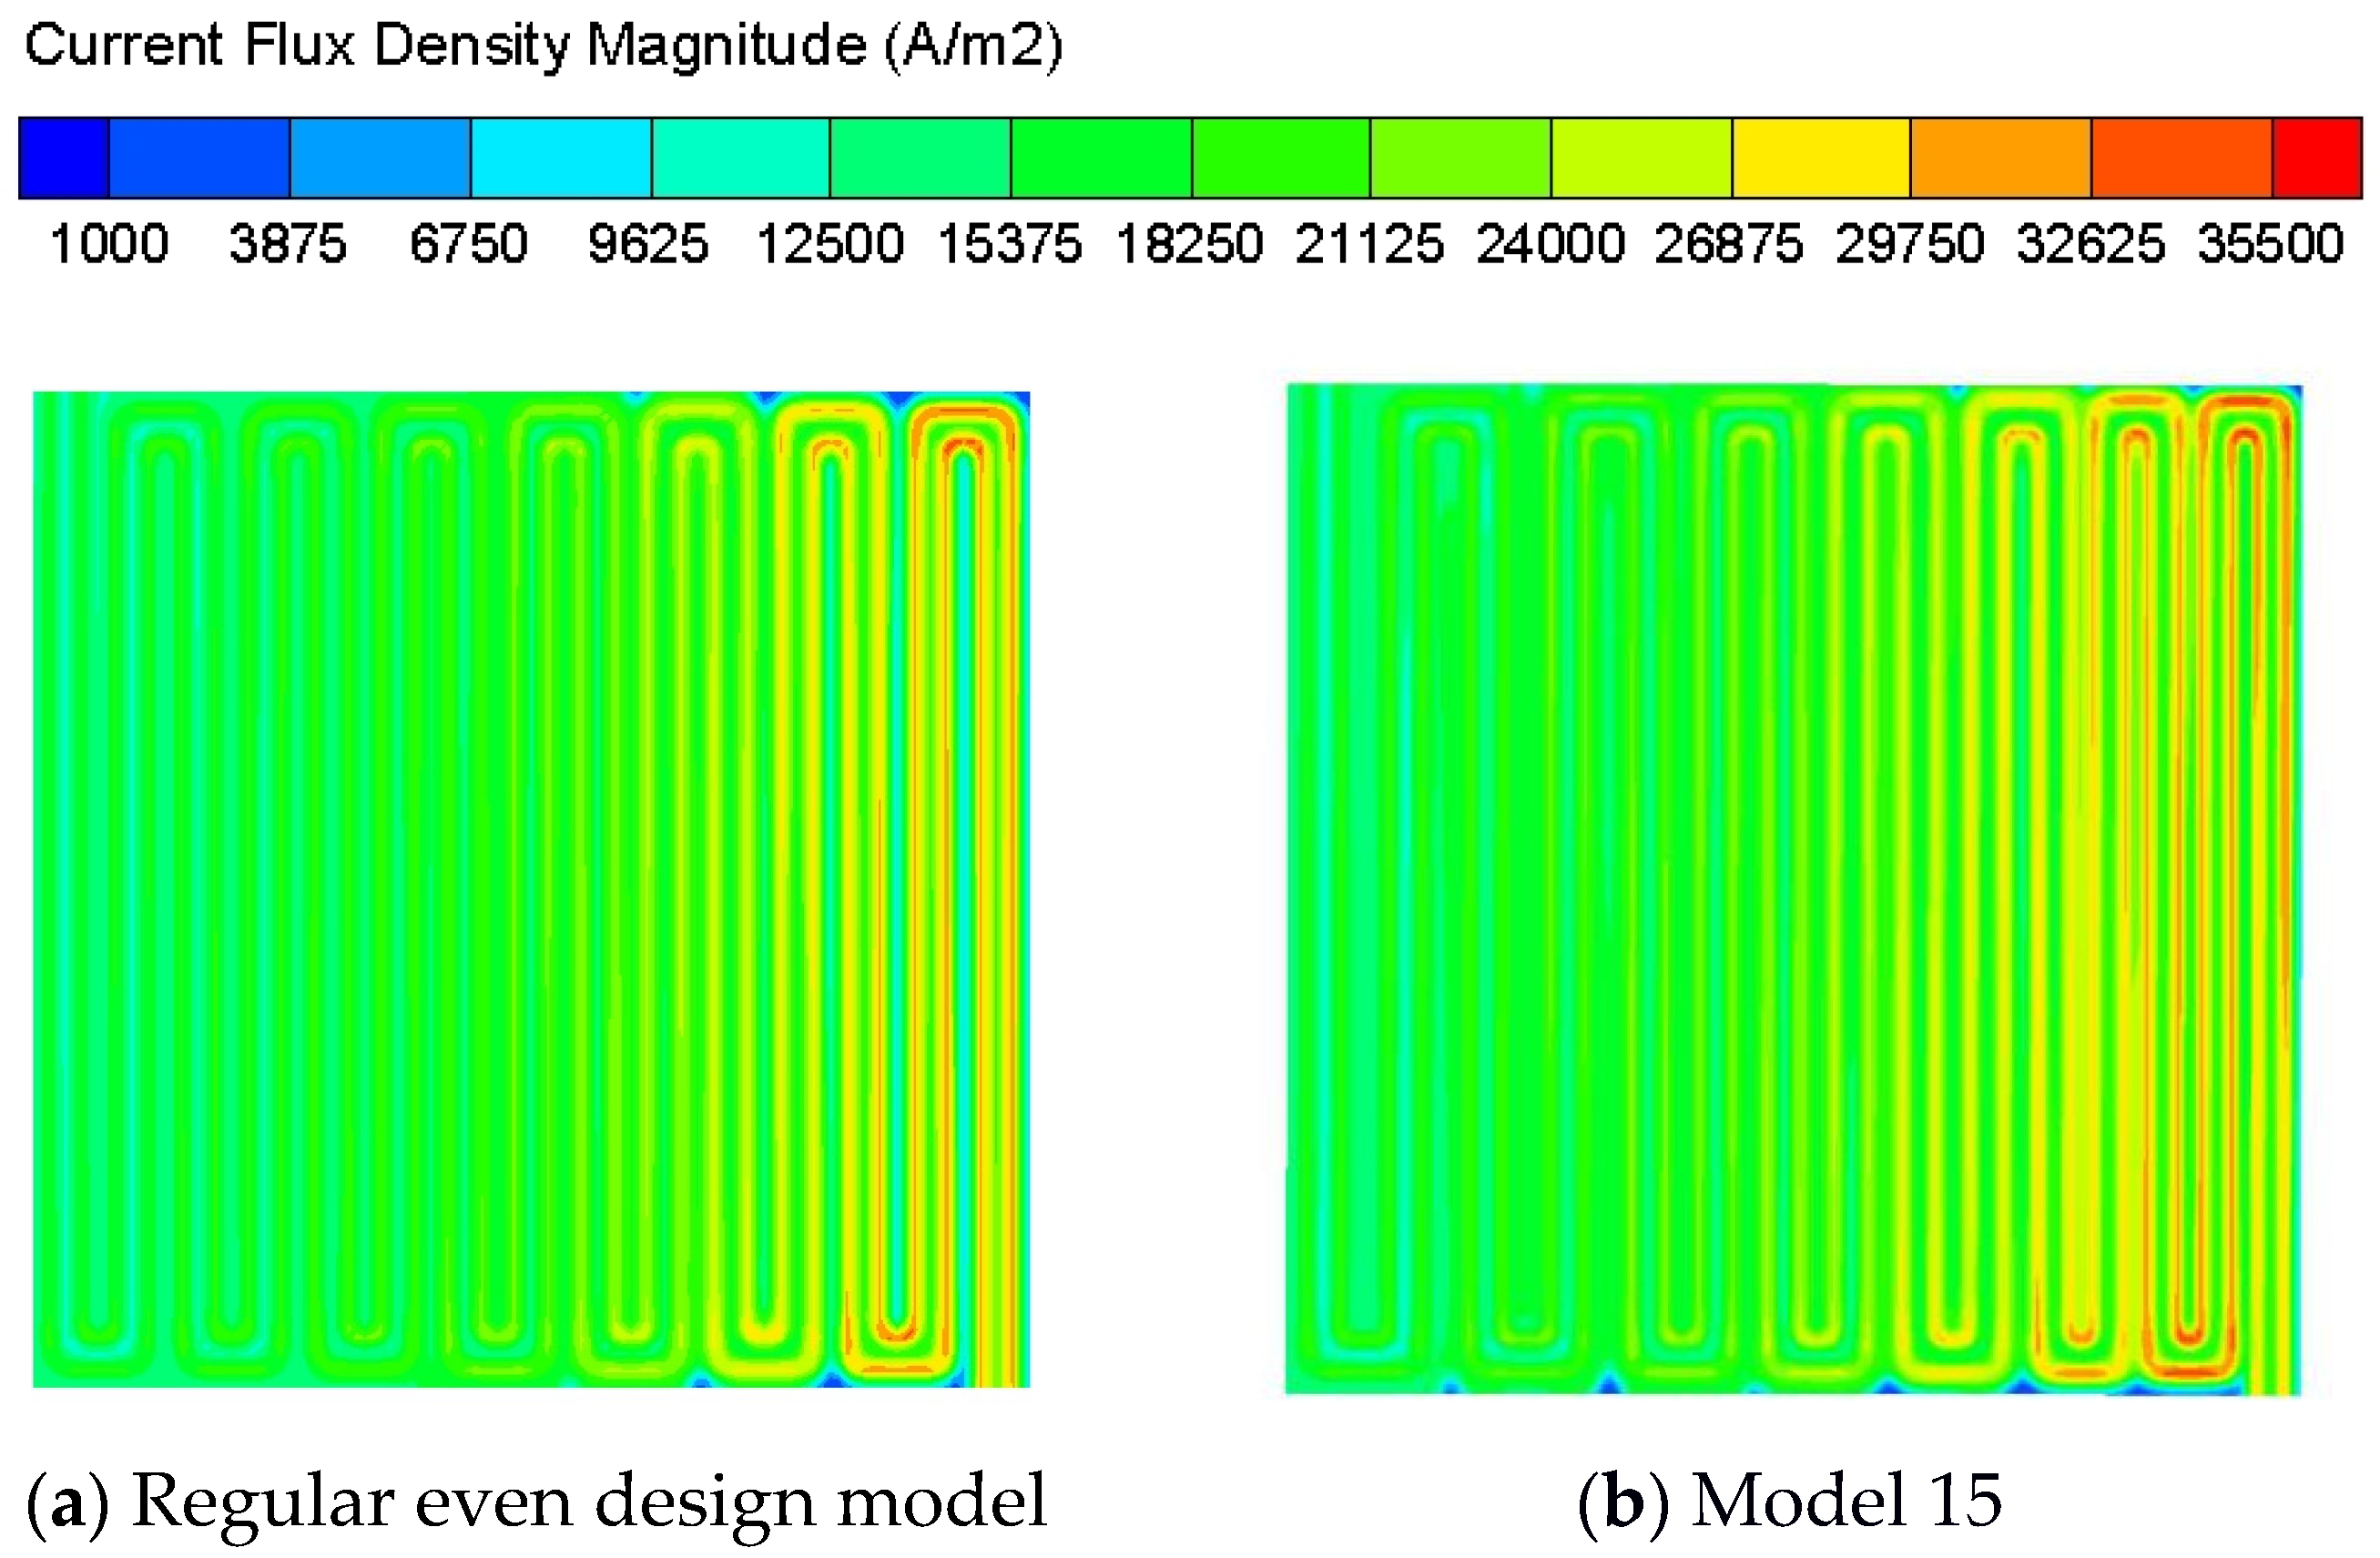
3.2. Collaborative Design of Multilayers in PEMFC

According to the analysis of the numerical simulation results, the best matching result of the uneven design is a structural design in which the rib width gradually decreases from the inlet to the outlet of the flow channel and the porosity of the cathode diffusion layer and the catalyst layer gradually increases (Model 15). The performance of the optimized uneven design is improved by 10.6% when compared with the original model. The current density distribution of the cathode catalyst layer is shown in Figure 5. The average current density of the optimized model reaches 19,925.12 (A/m2), while the original model is 18,751.09 (A/m2). The optimized structure could reasonably adjust the concentration distribution of the reaction gas by integrating with the pressure drop distribution inside the flow channel. The setting of the uneven porosity increases the utilization rate of the membrane electrode and further improves the fuel cell performance.

4. Conclusions

The uneven design of the flow channel, gas diffusion layer and catalyst layer are newly studied for the proton exchange membrane fuel cell. The effects of an uneven rib width and uneven porosity distributions of both the gas diffusion layer and catalyst layer on the performance of the fuel cell are analyzed. Compared with the regular even design, the performance of the fuel cell with the optimized uneven design is improved by 10.6%. In this new design, the rib width gradually decreases and the porosity of the cathode gas diffusion layer and the cathode catalyst layer gradually increases along the fluid flow direction. The optimal new uneven design can adjust the internal pressure distribution of the flow channel to make the reactant distribution more uniform, increase the permeability of the internal area of the fuel cell, and improve the utilization rate of the membrane electrode assembly.

Author Contributions

Conceptualization, Q.Y.; methodology, Q.Y.; software, Q.Y., S.C. and L.L.; validation, G.X.; investigation, S.C. and L.L.; data curation, S.C.; writing—original draft preparation, Q.Y. and S.C.; writing—review and editing, G.X. and L.L.; visualization, G.X.; funding acquisition, G.X. All authors have read and agreed to the published version of the manuscript.

Funding

This research was funded by the National Natural Science Foundation of China (Nos. 51975196 & 52075159), the State Key Laboratory of Clean Energy Utilization (No. ZJUCEU2020010), Research Foundation of Education Department of Hunan Province (No. 19C0754), Open Foundation of National Engineering Research Center of Near-Net-Shape Forming for Metallic Materials (No. 2020013) and Open Foundation of Guangxi Key Laboratory of Processing for Non-ferrous Metals and Featured Materials, Guangxi University (No. 2020GXYSOF16).

Conflicts of Interest

JIANGXI KMAX Industrial Co., Ltd. provided some technical support on the numerical simulation in this paper. The paper reflects the views of the scientists, and not the company.

References

  1. Cai, Y.; Fang, Z.; Chen, B.; Yang, T.; Tu, Z. Numerical study on a novel 3D cathode flow field and evaluation criteria for the PEM fuel cell design. Energy 2018, 161, 28–37. [Google Scholar] [CrossRef]
  2. Kanchan, B.K.; Randive, P.; Pati, S. Numerical investigation of multi-layered porosity in the gas diffusion layer on the performance of a PEM fuel cell. Int. J. Hydrog. Energy 2020, 45, 21836–21847. [Google Scholar] [CrossRef]
  3. Manso, A.P.; Marzo, F.F.; Mujika, M.G.; Barranco, J.; Lorenzo, A. Numerical analysis of the influence of the channel cross-section aspect ratio on the performance of a PEM fuel cell with serpentine flow field design. Int. J. Hydrog. Energy 2011, 36, 6795–6808. [Google Scholar] [CrossRef]
  4. Shimpalee, S.; Van Zee, J.W. Numerical studies on rib & channel dimension of flow-field on PEMFC performance. Int. J. Hydrog. Energy 2007, 32, 842–856. [Google Scholar]
  5. Park, Y.C.; Chippar, P.; Kim, S.K.; Lim, S.; Jung, D.H.; Ju, H.; Peck, D.H. Effects of serpentine flow-field designs with different channel and rib widths on the performance of a direct methanol fuel cell. J. Power Source 2012, 205, 32–47. [Google Scholar] [CrossRef]
  6. Zhou, P.; Wu, C.W. Numerical study on the compression effect of gas diffusion layer on PEMFC performance. J. Power Source 2007, 170, 93–100. [Google Scholar] [CrossRef]
  7. Mahmoudi, A.H.; Ramiar, A.; Esmaili, Q. Effect of inhomogeneous compression of gas diffusion layer on the performance of PEMFC with interdigitated flow field. Energy Convers. Manag. 2016, 110, 78–89. [Google Scholar] [CrossRef]
  8. Chi, P.H.; Chan, S.H.; Weng, F.B.; Su, A.; Sui, P.C.; Djilali, N. On the effects of non-uniform property distribution due to compression in the gas diffusion layer of a PEMFC. Int. J. Hydrog. Energy 2010, 35, 2936–2948. [Google Scholar] [CrossRef]
  9. Shangguan, X.; Li, Y.; Qin, Y.; Cao, S.; Zhang, J.; Yin, Y. Effect of the porosity distribution on the liquid water transport in the gas diffusion layer of PEMFC. Electrochim. Acta 2021, 371, 137814. [Google Scholar] [CrossRef]
  10. Rabissi, C.; Zago, M.; Gazdzicki, P.; Guétaz, L.; Escribano, S.; Grahl-Madsen, L.; Casalegno, A. A locally resolved investigation on direct methanol fuel cell uneven components fading: Local cathode catalyst layer tuning for homogeneous operation and reduced degradation rate. J. Power Source 2018, 404, 135–148. [Google Scholar] [CrossRef] [Green Version]
  11. Jiang, J.; Li, Y.; Liang, J.; Yang, W.; Li, X. Modeling of high-efficient direct methanol fuel cells with order-structured catalyst layer. Appl. Energy 2019, 252, 113431. [Google Scholar] [CrossRef]
  12. Havaej, P.; Kermani, M.J.; Abdollahzadeh, M.; Heidary, H.; Moradi, A. A numerical modeling study on the influence of catalyst loading distribution on the performance of Polymer Electrolyte Membrane Fuel Cell. Int. J. Hydrog. Energy 2018, 43, 10031–10047. [Google Scholar] [CrossRef]
  13. Ebrahimi, S.; Roshandel, R.; Vijayaraghavan, K. Power density optimization of PEMFC cathode with non-uniform catalyst layer by Simplex method and numerical simulation. Int. J. Hydrog. Energy 2016, 41, 22260–22273. [Google Scholar] [CrossRef]
  14. Ebrahimi, S.; Ghorbani, B.; Vijayaraghavan, K. Optimization of catalyst distribution along PEMFC channel through a numerical two-phase model and genetic algorithm. Renew. Energy 2017, 113, 846–854. [Google Scholar] [CrossRef]
  15. Zheng, Z.; Yang, F.; Lin, C.; Zhu, F.; Shen, S.; Wei, G.; Zhang, J. Design of gradient cathode catalyst layer (CCL) structure for mitigating Pt degradation in proton exchange membrane fuel cells (PEMFCs) using mathematical method. J. Power Source 2020, 451, 227729. [Google Scholar] [CrossRef]
  16. Yin, K.M.; Cheng, B.S.; Chiang, K.W. Non-uniform agglomerate cathode catalyst layer model on the performance of PEMFC with consideration of water effect. Renew. Energy 2016, 95, 191–201. [Google Scholar] [CrossRef]
  17. Soler, J.; Hontanon, E.; Daza, L. Electrode permeability and flow-field configuration: Influence on the performance of a PEMFC. J. Power Source 2003, 118, 172–178. [Google Scholar] [CrossRef]
Figure 1. Schematic diagram of the PEMFC anode structure.
Wevj 12 00148 g001
Figure 2. Schematic diagram of the uneven design structure.
Wevj 12 00148 g002
Figure 3. Pressure distribution in the cathode flow channel.
Wevj 12 00148 g003
Figure 4. H2 concentration distribution on the anode gas diffusion layer.
Wevj 12 00148 g004
Figure 5. Current density distribution on the cathode catalyst layer.
Wevj 12 00148 g005
Table 1. Structural parameters of PEMFC.
ParametersValue
Channel width1 mm
Channel height1 mm
Rib width1 mm
GDL thickness0.2 mm
Catalyst layer thickness0.026 mm
Membrane thickness0.05 mm
Table 2. Operating parameters.
ParametersValueParametersValue
Operating temperature353 KOperating pressure1 atm
Anode stoichiometric flow rate1.5Cathode stoichiometric flow rate2
Anode relative humidity30%Cathode relative humidity30%
GDL porosity0.5CL porosity0.5
Anode concentration exponent0.5Cathode concentration exponent1
Anode exchange coefficient2Cathode exchange coefficient2
Table 3. Design of numerical experiments for the PEMFC uneven design.
Rib WidthAnode Gas Diffusion LayerCathode Gas Diffusion LayerAnode Catalyst LayerCathode Catalyst Layer
-----
uneven (↑↓)uneven (↑↓)---
uneven (↑↓)-uneven (↑↓)--
uneven (↑↓)uneven (↑↓)uneven (↑↓)--
uneven (↑↓)--uneven (↑↓)-
uneven (↑↓)---uneven (↑↓)
uneven (↑↓)--uneven (↑↓)uneven (↑↓)
uneven (↑↓)uneven (↑↓)-uneven (↑↓)-
uneven (↑↓)-uneven (↑↓)-uneven (↑↓)
uneven (↑↓)uneven (↑↓)uneven (↑↓)uneven (↑↓)uneven (↑↓)
Table 4. Simulation results for uneven designs.
ModelRib Width
/(mm)
Porosity
(Anode GDL)
Porosity
(Cathode GDL)
Porosity
(Anode CL)
Porosity
(Cathode CL)
Growth Rate
10.6 1 1.40.50.50.50.5−6.59%
21.4 1 0.60.50.50.50.58.10%
310.3 0.5 0.70.50.50.5−0.21%
410.50.3 0.5 0.70.50.52.40%
510.50.50.3 0.5 0.70.5−0.03%
610.50.50.50.3 0.5 0.70.19%
710.7 0.5 0.30.50.50.50.09%
810.50.7 0.5 0.30.50.5−2.80%
910.50.50.7 0.5 0.30.50.01%
1010.50.50.50.7 0.5 0.3−0.22%
1110.3 0.5 0.70.3 0.5 0.70.50.52.09%
1210.50.50.3 0.5 0.70.3 0.5 0.70.16%
1310.50.3 0.5 0.70.50.3 0.5 0.72.61%
1410.3 0.5 0.70.3 0.5 0.70.3 0.5 0.70.3 0.5 0.72.24%
151.4 1 0.60.50.3 0.5 0.70.50.3 0.5 0.710.60%
Table 5. Standard deviation of the hydrogen concentration distribution.
Regular Even Design ModelModel 1Model 2
Standard deviation0.002233760.002323410.00204100
Publisher’s Note: MDPI stays neutral with regard to jurisdictional claims in published maps and institutional affiliations.

