1. Introduction
The mitigation of climate change is one of society’s greatest challenges in the 21st century [
1]. With the road transportation sector accounting for more than 15% of anthropogenic CO
2 emissions globally [
2] (pp. 142–146), the automotive industry is set to play an important role in mastering this global task. In recent decades, emission standards for passenger cars have been introduced in the largest automotive sales markets, with the aim of reducing the carbon footprint of road transportation [
3]. The rising number of electric vehicles (EVs) available on the market in recent years [
4] is evidence that manufacturers are choosing to electrify their fleets in order to comply with new legal requirements. However, despite the increase in the supply of EVs, vehicle registration statistics show that electric vehicles have yet to be fully accepted by the customer [
4]. In the particular case of battery electric vehicles (BEVs), the limited driving range per charge, coupled with the associated range anxiety, is one of the biggest barriers for customers today against adopting EVs [
5,
6,
7,
8,
9].
Besides trip characteristics and driving style, a BEV’s range is primarily influenced by three factors: the amount of energy that can be stored in the vehicle’s battery, the vehicle’s energy efficiency [
10], and the auxiliary energy consumption [
11]. While the first modern BEVs to become commercially available in the early 2010s achieved driving ranges of no more than 100–150 km per charge, improvements in electric powertrain and battery technology over the years have resulted in ranges of up to 500 km today [
12]. However, unlike internal combustion engine vehicles (ICEVs), a BEV’s range suffers substantially in cold ambient conditions [
10]. The two main factors influencing the range of BEVs at low temperatures are the heating energy requirements [
11,
13,
14] and the temperature sensitivity of the Li-ion battery cells [
15], which are used primarily in modern BEVs for energy storage.
Since electric powertrains have a higher efficiency than conventional ones, BEVs have less waste heat available for cabin heating than ICEVs. For this reason, electric heaters are installed in BEVs to ensure passenger comfort under cold ambient conditions [
16]. As their power is supplied by the vehicle’s battery, this adds to the amount of energy consumption and thus affects the BEVs range [
11,
17]. Taggart [
18] analyzed over 10,000 Tesla Model S and observed energy consumption increases of up to 45% at −10 °C, whereas short trips in particular showed higher consumptions due to the transient heating up of the battery and cabin. Delos Reyes et al. [
19] performed driving tests with a Nissan Leaf in Canada and found a range decrease of up to 70% at −26 °C. Horrein et al. [
13] performed a simulation to show that heating requirements can cut a BEV’s range by up to 30%, which is almost the same magnitude Michaelides [
20] observed in his investigation simulating a sedan-style EV equipped with a resistance heater at 30 °C temperature difference between cabin and ambient. Ramsey et al. [
14] also investigated the impact of heating on a BEV’s range on the basis of a simulation and found that heating requirements can cut a passenger car’s range by up to 40%.
Apart from cabin heating, the decreased performance of the vehicle’s battery at low temperatures also affects a BEV’s driving range. Cold conditions cause declined reactivity and diminished ionic conductivity in Li-ion cells [
15,
21], which affects their usable capacity [
22] and impedance [
23]. In this context, Nagasubramanian et al. [
24] showed that under extreme cold conditions (−40 °C) a Li-ion cell can lose up to 95% of its energy and more than 98% of its power capability compared to performance levels at 25 °C. Similar research shows that a cell’s capacity can drop by up to 23% at −20 °C compared to the capacity at 25 °C [
25]. Besides these temporary losses in cell performance, low temperatures also promote Li-plating, which can lead to a permanent reduction in cell performance [
26]. Li plating is the deposition of metallic lithium on the cell’s anode [
27]. This reduces the number of cyclable Li-ions and increases the cell’s impedance [
27]. Both of these effects are in part irreversible [
26], leading to a permanent reduction in the cell’s energy and power capability. To reduce such cell aging processes, the battery management system (BMS) limits charging and discharging currents at low temperatures. Steinstraeter et al. [
28] showed that a BEV’s ability to recuperate is strongly dependent on the battery’s temperature. Limited recuperation under cold conditions is a particularly critical factor of a BEV’s driving range, since the energy restored through regenerative braking under warm conditions (without limitation) can contribute 18% of the total energy required for a trip [
29].
To reduce the impact of limited recuperation and an increased heating energy demand at low temperatures on a BEV’s range, Lieb et al. [
30] and Steinstraeter et al. [
28] investigated the utilization of unused regenerative braking power for cabin heating by bypassing the battery with a heater that is fed directly with recuperation power from the electric machine(s). Lieb et al. [
30] could demonstrate a regained range potential at low temperatures of up to 8% by implementing such an electrothermal recuperation (ETR) system in their simulation. However, they set the battery’s charging capability to zero and did not consider that the battery can still be charged at cold temperatures even though charging is limited. Furthermore, due to the high thermal capacity of the simulated brake resistor, range can even decrease at medium temperatures. Steinstraeter et al. [
28] chose a layer heater instead of a brake resistor for their ETR simulation and came up with range increases of a similar magnitude.
Besides the approach to increase a BEV’s range under cold climatic conditions through ETR, other technical solutions have also been suggested to address the range issue of BEV’s at low temperatures. Michaelidis [
20], for example, showed that a BEV’s heating energy demand can be reduced by up to two-thirds when a heat pump is used instead of a resistance heater to supply the cabin with heat. However, practically two factors restrict the performance of heat pumps at low temperatures, which need to be addressed to ensure proper operation under any condition. Firstly, the coefficient of performance (COP) decreases at lower temperatures, and secondly, heat pumps show a risk of freezing when the temperature drops below the coolant’s freezing point. Both factors can be addressed by using an additional resistance heater to keep the heat pump’s performance at any time at a high level and to ensure unrestricted operation under any conditions. Auer et al. [
31] proposed a predictive thermal management system for battery electric vehicles, which utilizes navigation information of planned trips to optimize the heating strategy. The strategy includes a thermal battery and cabin preconditioning, as well as the utilization of electric machine waste heat to minimize the energy that needs to be supplied by the battery for heating during a trip. Finally, they demonstrated that at an ambient temperature of −18 °C and an energy consumption reduction of more than 5% is achievable with the system for the New European Driving Cycle (NEDC).
2. Article Contributions and Layout
In this study, we analyze logged driving data to evaluate the range reduction of BEVs at low temperatures due to the heating energy requirements and limited recuperation. The available database for our analysis originates from trips in and around Munich with a state-of-the-art BEV (Tesla Model 3) and a BEV model from 2014 (BMW i3). Since the data used for this study was collected in southern Germany, this research is specifically relevant for regions with similar or even colder climates than Central Europe. To the best of our knowledge, this is the first paper to analyze the two main factors causing a limited range of BEVs at low temperatures separately. Further research can build on our findings to promote innovative solutions for the BEV range problem at cold temperatures. The main innovations of this paper can be summarized as follows:
We analyze the measurement data from a 2014 BMW i3 and a 2020 Tesla Model 3. This enables us to conduct a cross-manufacturer evaluation as well as an assessment of differences between BEV models from different generations regarding the low temperature impact on a BEVs range.
The energy demand of cabin heating is quantified separately and independent from other factors that influence the range such as recuperation and other auxiliary consumers. Range implications are deduced based on these findings.
The amount of regenerated energy throughout a trip is quantified and how much of the energy required for propulsion is covered by regenerative braking is assessed. This allows an isolated view of the impact of limited recuperation on a BEVs range without mixing it with the impact of other influencing factors such as heating and other auxiliary consumers. Based on these findings, range implications are deduced. Additionally, the recuperation performance of selected trips is evaluated against the predicted recuperation energy potential that is computed by a longitudinal dynamics simulation.
The analysis of the durations and the occurring powers of regenerative braking phases allows the deduction of technical requirements for a ETR system such as reaction time and power capabilities.
Figure 1 illustrates the approach and layout of this paper.
Section 3 presents the datasets that served as the basis for this study. The methodology of the analysis and the development of the regenerative braking potential simulation, including a detailed calculation of a BEV’s drivetrain moment of inertia, are presented in
Section 4. The results are presented in
Section 5, divided into the influence of cabin heating and limited recuperation on the driving range. Finally, the requirements for an electrothermal recuperation system are derived based on the available data.
3. Database
This study is based on real world driving data recorded during trips in and around Munich (Germany). The database consists of logs from test drives with a 2014 BMW i3 and a 2020 Tesla Model 3 (
Table 1). These datasets originate from test drives connected to ongoing BEV projects at the Institute of Automotive Technology (FTM) of the Technical University of Munich (TUM). All trips from both datasets were conducted by the same driver, which guarantees a consistent driving style within the database. The desired cabin temperature was set to 22 °C for all trips and automatic mode was activated. The BMW data has already been published [
32], while the Tesla data was recently sampled and it had therefore not been published before.
The datasets were selected since the available signals allow the analysis of the vehicles’ heating and recuperation behavior. Both datasets were recorded via CAN split connectors. The BMW i3 data was obtained by reading the vehicle’s CAN- and LIN-Bus communication via a Vector VN1611 device and the signals were then recorded via the software Vector CANoe. For the Tesla, the data recording was performed by a self-developed logging device [
43]. Both vehicles’ logs use the same sign convention, where discharge currents are defined as negative and charge currents are positive. However, we used the definition that charge currents are negative and discharge current are positive for our analysis.
Table 2 shows the available and relevant signals sampled for each vehicle.
The trips within the database cover a wide range of ambient conditions as well as different battery temperatures, which is ideal for analyzing the effect of temperature on the vehicles’ recuperation and heating behavior. Due to the different project affiliations of the test vehicles, different routes with different planning backgrounds are present in the database. These routes can generally be classified into two categories. Trips on designed routes, on the one hand, and commuting trips on random routes on the other hand.
Table 3 gives an overview of the random trips for both vehicles.
While the data from trips on random routes allows just a limited, more general analysis, the data from trips on designed routes allows an extensive, comparative analysis of the low-temperature effects on the test vehicles’ range. The designed routes and the available log data from the respective designed routes are presented in the following subsections for each of the two vehicles separately.
3.1. BMW i3—Designed Route Data
The BMW i3 route was designed by Adermann et al. [
29] to quantify the consumption deviation of a VW eGolf over 50 trips on the same route under different conditions. The route is composed of a city, a rural, and a highway section and it is the standard test drive route used by TUM’s Institute of Automotive Technology (FTM). The route is a round trip, and it is covered without any planned stops in between the different route sections. The BMW i3 dataset includes nine drives on this route in the clockwise direction [
32].
Table 4 summarizes the main characteristics of the so-called FTM route.
3.2. Tesla Model 3—Designed Route Data
The Tesla Model 3 trips are part of an ongoing project at the FTM to quantify the range and efficiency of state-of-the-art BEVs. To investigate these factors, three routes have been designed based on typical European driving patterns [
44]. The three routes represent a city, a rural, and a highway trip, respectively. All three Tesla routes are round trips with identical start and endpoints and each route is covered without any planned stops in the clockwise direction. All routes were driven under different ambient conditions and with different SOCs.
Table 5 shows the designed route characteristics.
4. Method of Analysis
The data analysis is divided into two sections. The first section deals with the heating analysis and the second one is about the regenerative braking analysis. In both sections, a two-stage analysis is performed.
At the beginning of each section, a general, theoretical analysis regarding the respective aspect is conducted. In this part, the energy shares of heating and recuperation of all trips in the database are analyzed and range implications are deduced based on the findings. As part of the general recuperation analysis, the battery temperature dependent regenerative braking power limits are identified as well.
In the second part of each section, a detailed comparative analysis between trips on the same route is conducted for both vehicles. The direct comparison of trips with the same vehicle on an identical route allows for the determination of measured and therefore practical range implications, particularly regarding limited recuperation. Additionally, for the detailed analysis of the recuperation behavior, a longitudinal dynamics simulation was set up to assess the vehicles’ recuperation performance throughout a trip based on the theoretically possible regenerative braking potential.
4.1. Heating Analysis—Heating Energy Share
To determine how heating affects the test vehicles’ range, the vehicles’ energy consumption was analyzed. Based on the sampled current and voltage signals of the heater and the battery, the heating energy share (
HS) was identified for each trip. All integrals in this study were computed using MATLAB’s cumulative trapezoidal numerical integration (cumtrapz) function.
The reference value used in Equation (1) represents the discharged energy from the battery throughout a trip without considering recuperated energy. This is indicated by the discharge current IBat.Dis in Equation (1). The heating energy share was defined like this because it allows us to separate the impact of heating from the impact of (limited) recuperation on the vehicles’ energy consumption and thus its range. Since the computed share reflects the relation between a trip’s actual energy demand and the energy portion required for heating throughout the trip, it translates directly to an equally high reduction in the vehicle’s range due to heating for the trip.
4.2. Recuperation Analysis—Determination of Regenerative Braking Power Limitations
As the first step of the recuperation analysis, a data clustering algorithm was applied to each vehicle’s dataset to identify the respective vehicles’ regenerative braking power limitation strategies depending on the battery temperature. The algorithm divides the feature space covered by a log into equally sized subspaces. In our application, the relevant clustering feature is the battery temperature. The step size defined for clustering is 1 °C. Once all datapoints of a log have been assigned to the defined subspaces, the algorithm identifies the datapoint with the highest recorded battery power value within each subspace. Finally, the maximum power datapoint from each subspace is extracted from the log data, and all maximum power datapoints are then saved as a new dataset. When all logs from a vehicle are considered in the algorithm, the resulting dataset gives an insight into the vehicle’s battery power limitations depending on the battery temperature. This, again, provides an impression of the battery power control strategies applied for each vehicle.
4.3. Recuperation Analysis—Regnerative Braking Energy Share
Similar to the procedure for the heating analysis, the impact of recuperation on the test vehicles’ energy consumption and driving range was identified by analyzing each trip’s energy demands. However, in contrast to the heating analysis, the reference value for the computed recuperation energy share (
RS) is solely the traction system’s energy demand instead of the total energy demand. Not considering the heating energy in this analysis (Equation (2)) allows for the isolated assessment of the recuperation impact on the vehicle energy consumption and the resulting range implications.
where
IBat.Chr is the battery charge current. Since the computed energy share RS represents the regenerated energy in relation to the actual energy demand of the traction system for a trip, RS translates to an equally high range increase through recuperation for the respective trip compared to the same trip without using regenerative braking at all. Consequently, when losing the capability to recuperate due to low temperatures, the gained range increase through recuperation gets lost, which would result in a range reduction of
RS for the respective trip. However, since heating is not considered in
RS, the determined range reductions are theoretical.
4.4. Recuperation Analysis—Regenerative Braking Perfromance Analysis
The detailed recuperation analysis involves four main steps. First, a noise filter was applied to the relevant time-series signals from the logs that were required for the regenerative braking potential simulation (
Section 4.4.1). Subsequently, the powertrain of a BEV (compact car class) was reverse-engineered using CAD to derive a drivetrain moment of inertia, which was required for the simulation as well (
Section 4.4.2). The third step involved setting up and performing the simulation to predict the regenerative braking potential for selected trips in the database (
Section 4.4.3). Lastly, trip parameters were defined to allow an objective comparison of the selected trips for the detailed recuperation analysis (
Section 4.4.4).
4.4.1. Data Preprocessing
A lowpass filter was applied to the raw altitude and speed signal (
Figure 2a,b) to reduce the noise in the signals required for the regenerative braking potential simulation.
Noise filtering of these two signals was particularly important due to the use of speed and altitude gradients as core inputs for the simulation to predict the vehicle’s driving resistance and, in turn, its regenerative braking potential (
Section 4.4.2). Before filtering, the simulation detected a large amount of short and strong deceleration and incline phases throughout the trip due to noise, which led to a highly dynamic driving resistance profile (
Figure 2c). Filtering was applied to correct the observed physically implausible profile characteristics.
We applied a weighted moving average filter (Gaussian smoothing) to the signals since this allows noise to be captured and revised in even more dynamic sections without extensively disrupting the information in the data. After assessing the effect of the algorithm’s smoothing parameter (bandwidth b) on both input signals and the simulation output, we found that b = 16 was a reasonable choice for eliminating physically implausible values (outliers), as well as unrealistic profile characteristics (noise). For validation of the applied smoothing technique, we compared the measured battery power signal to the computed driving resistance power (
Figure 2c). In the case of positive predicted driving resistance, the measured battery power is always slightly higher than the predicted driving resistance. This can be explained by the powertrain efficiency. Since the battery power supply must compensate for powertrain losses, the discharge battery power needs to be greater than the actual power required for propulsion on the wheels. For the case of negative driving resistance, the difference to the measured battery power is higher than for the case of positive driving resistance. This can be explained by the circumstance that the required braking power is not always supplied by the electric machine (recuperation) but by the vehicle’s friction brakes instead.
4.4.2. Drivetrain Moment of Inertia
Knowledge of the drivetrain’s moment of inertia is needed to accurately estimate the vehicle’s driving resistance (
Section 4.4.3). Due to the lack of available information in scientific publications on BEV drivetrain moments of inertia, we reverse-engineered a CAD model of a BEV drivetrain (
Figure 3) on the basis of publicly available information.
However, the information necessary to reconstruct the drivetrain was not completely available for either of the test vehicles. We therefore collected and combined information about the drivetrains of both vehicles to design the model and estimate a general drivetrain moment of inertia.
Table A1 in
Appendix A shows the information collected. Since the general drivetrain design concepts and architectures of both test vehicles are the same, it was possible to merge the data (
Table 1). As a result, a general drivetrain model (compact car) of a single motor, rear axle driven BEV with a two-stage spur gearbox was designed.
All drivetrain components were assumed to be made from homogeneous materials with a material density of
ρComp. A mean material density was derived for the rotor and tires, which are multi-material components, based on the components’ outer dimensions and target weights. With the densities assigned to the component models, the CAD program returned the single components‘ moments of inertia around their rotational axis
IComp:
where
V is component volume and
is the radius perpendicular to the rotational axis of the component.
The total drivetrain moment of inertia
IDT was then calculated using:
with the following moments of inertia: rotor
IRot, first spur gear
IG1, second and third spur gear
IG2.
3, fourth spur gear
IG4, left driveshaft
IDS.L, right driveshaft
IDS.R, rear axle brake disc
IBD.RA, front axle brake disc
IBD.FA, rim
IRim, and tire
ITire. The gear ratios of the first and second gearbox stages are indicated by
i1 and
i2. The moments of inertia of the gears and rotor include the inertia of the shafts on which they are mounted. The result of the drivetrain inertia calculation is 10.42 kg∙m
2 for the reverse-engineered CAD model.
4.4.3. Regenerative Braking Potential
The regenerative braking potential is determined based on a longitudinal dynamics simulation (LDS). The LDS estimates the driving resistance forces acting on a vehicle for each time step of time-series data. The predicted forces are determined based on the vehicle’s speed signal vx.veh, the altitude signal h, and vehicle characteristics such as the drag coefficient cd.veh. The driving resistance represents the force responsible for the vehicle’s change in velocity throughout a trip. Since steep slopes are not present on the roads driven on by the vehicles in the datasets, a positive total driving resistance means the vehicle must supply power for propulsion, whereas a negative driving resistance means the vehicle has to supply braking power to explain the observed change in velocity. This characteristic of the total driving resistance is used to identify phases within a trip where braking power is required. The required braking power could potentially be provided by the electric machines of the vehicle to regenerate energy. Therefore, the computed negative driving resistance is referred to as regenerative braking potential.
Potential recuperation phases are assumed to be present whenever the computed total driving resistance power
PDR (Equation (5)) is smaller than zero and when the traction system current
ITS (Equation (11)) is smaller than or equal to zero.
where
PAcc is the acceleration power (Equation (6)),
PAer is the aerodynamic drag power (Equation (7)),
PRol is the rolling resistance power (Equation (8)), and
PSlo is the slope resistance power (Equation (9)).
where
mveh is the vehicle mass,
IDT is the moment of inertia of the rotating drivetrain parts,
rdyn is the dynamic tire radius,
ax.veh is the vehicle’s longitudinal acceleration, and
vx.veh is the vehicle’s longitudinal velocity.
where
ρAir is the density of air,
cd.veh is the vehicle’s drag coefficient, and
Aveh is the vehicle’s cross-sectional front area.
where
g is the gravitational acceleration,
cRol is the rolling resistance coefficient, Δ
s is the distance covered within a time step by the vehicle, and Δ
h is the change in altitude of the vehicle within a time step.
The regenerative braking power potential
PRBP is determined according to Equation (10) and the regenerative braking energy potential
ERBP is defined according to Equation (12)
The simulation model was parametrized with the values given in
Table 1. Regarding the weights considered for the simulation, a combined driver and equipment mass of 85 kg was added to the vehicle masses stated in
Table 1.
4.4.4. Trip Parameters
To enable a better trip comparison for the detailed recuperation analysis, some additional parameters besides the regenerative braking energy share
RS (Equation (2)) are introduced. The first parameter is called regenerative braking performance
RP (Equation (13)), and it quantifies how much of the predicted regenerative braking potential (
Section 4.4.3) was used by the vehicle throughout a trip.
The second parameter is the potential regenerative braking share
PRS (Equation (14)), which gives an insight into how much of the required traction energy demand for a trip could have potentially been covered by recuperation. This value assumes that the powertrain efficiency is at 100%, which makes it a theoretical number. Due to power losses during the recuperation process, the
PRS can never be fully achieved by a vehicle.
The measured range reduction (
MRR) (Equation (15)) describes the range loss due to limited recuperation on one trip compared to a reference trip with the same vehicle on an identical route.
with the regenerative braking energy share of the reference trip
RSRef and the regenerative braking energy share of any trip on an identical route with the same vehicle
RSx. Even though the
MRR represents the difference between energy portions, the analysis setup allows for the translation of this difference to an equally high range reduction. The reason for this assumption is that
RS is a value that is normalized by the respective trips’ actual energy demands and both considered
RS values relate additionally to the identical route with the same length and driven by the same driver. However, it needs to be mentioned that the trip characteristics (velocity and acceleration) on the respective route can still vary due to traffic differences and variations in powertrain efficiency. Therefore, the absolute energy demand of the traction system that serves as a reference value for
RS might not be identical for two trips on the same route driven by the same driver, which results in some uncertainty regarding the accuracy of the
MRR. Still, due to the analysis setup, the
MRR gives a good indication of practical range reductions due to limited recuperation on a specific route.
The last parameter is the unused range potential
URP (Equation (16)). It describes how much range could have been gained additionally through recuperation when the predicted regenerative braking potential would have been utilized entirely compared to the range increase that was achieved through the actual recuperated energy.
For the URP, the same assumption and therefore also the same uncertainty applies as for the MRR to allow the deduction of range implications based on energy share values. Additionally, the efficiency assumption for the PRS applies as well for the URP, which makes the URP also a theoretical value.
5. Results and Discussion
In this section, we present our findings regarding the range reduction in BEVs when operated under cold climatic conditions. We illustrate the impact of heating and limited recuperation on the test vehicles’ energy demands and discuss the resulting range implications for BEVs. Finally, we derive requirements for a system that would allow the utilization of unused regenerative braking potentials to cover heating energy demands (electrothermal recuperation) based on recuperation characteristics of the two test vehicles.
5.1. Heating—Energy Demands and Range Implications
Figure 4 displays the heating energy share (
HS) depending on the ambient air temperature at the start of all trips in the database (
Section 3). Each data point in
Figure 4 represents a single trip with the respective vehicle. When looking at the figure, it is evident that the heating energy demand correlates with the ambient temperature for both vehicles. More precisely, the
HS increases as the ambient temperature decreases. The data dispersion for similar temperatures in
Figure 4 results from different trip durations and different weather conditions (see the subsequent detailed analysis).
In our analysis we found that the energy used for heating can total up to a maximum of 31.9% (Tesla) and 30.0% (BMW) of the total energy required for a trip. Therefore, according to
Section 4.1, heating can cut a BEV’s range by almost one third. These findings are in the same range as the simulated results by Horrein et al. [
13], Ramsey et al. [
14], Iora et al. [
11], and Michaelides [
20]. The slightly lower proportion of heating energy in our results compared to Iora et al. [
11], Ramsey et al. [
14], and Michaelides [
20] is due to all of them using standardized, less dynamic driving cycles or even constant speeds for their simulations. This approach leads to a lower traction energy demand and thus a higher heating energy share compared to the heating energy share we have determined based on more dynamic experimental driving data. On the other hand, the results of Taggart [
18] (45%) and specifically the results of Delos Reyes et al. [
19] (70%), which are both based on experimental data as well, exceed our findings. However, both authors assessed the total range reduction of BEV’s under cold ambient conditions and they did not distinguish between the different effects leading to the range reduction. Furthermore, Delos Reyes et al. [
19] determined their maximum range reduction under extreme cold conditions of −26 °C. Such low temperatures were not investigated as part of this study, but the trends displayed in
Figure 4 indicate that the heating energy share would have been higher for our test vehicles at such low temperatures as well.
Table 6 summarizes the consumption figures used as the basis for
Figure 4. The table shows three trips on designed routes for each vehicle. The selected trips were driven on the same routes to enable a better comparison. The table shows that it is not only the absolute ambient temperature that determines the heating requirements. This becomes clear when comparing the heating requirements of trips R01 and R02 with the Tesla Model 3 and similarly for trips FTM01 and FTM06 with the BMW i3. The warmer trips require more heating energy, both in absolute and relative terms, which appears implausible at first sight. However, it is likely that passenger comfort and weather conditions [
45] also need to be considered when explaining the observed phenomenon. Since the driver was the same for all trips, it is assumed that the former factor can be neglected for explaining the phenomenon. The latter, however, was recorded for the trips on the designed routes, and the recorded data suggests that the cabin heat input from solar radiation on sunny days reduces the heating requirements. On the other hand, contact between the body and windows of the car with fluids of higher specific thermal capacity and a higher thermal conductivity than air (e.g., rain or snow) increases the heat transfer away from the cabin, which has a negative effect on the heating requirements. Although this is considered a likely reason for the observed phenomenon, the available dataset does not allow a detailed analysis of the impact of weather conditions on the test vehicles‘ heating requirements. Therefore, this factor remains open for further research.
Summing up
Section 5.1, the following findings were made:
The results of the general analysis show that heating energy demands can cut a BEV’s range by up to 31.9%. Furthermore, the detailed heating analysis indicated that heating energy demands do not simply depend on the absolute ambient temperature but are likely to be impacted by other factors such as weather conditions as well.
5.2. Regenerative Braking—Limitation and Range Implications
To gain a basic understanding of the vehicles’ ability to regenerate energy at different battery temperatures, the maximum detected recuperation power values in our database are plotted against temperature, as shown in
Figure 5.
Below 10 °C, the maximum permissible recuperation power of both test vehicles shows a strong, approximately linear, dependency on battery temperature. Above 10 °C, no significant limitation can be detected either for the Tesla or the BMW. On the basis of the recorded data, the Tesla enabled regenerative braking when the battery reached a temperature of −4 °C. For the BMW, no exact statements can be made regarding the minimum battery temperature for allowing recuperation due to the lack of operating data at lower temperatures. However, based on the available data, the lowest measured battery temperature at which regenerative braking could be detected was −1.5 °C in the BMW.
The observed power limitations for regenerative braking can have a major impact on the vehicles’ energy consumption and thus their range. This becomes particularly clear when looking at
Figure 6. The figure displays the regenerated energy in relation to the amount of energy required to supply the traction system’s (TS) energy demands over a trip for all trips in the database. Considering the TS energy demands as the reference value only, rather than total energy demand, which includes heating energy requirements, allows an isolated analysis of the effect of limited recuperation on the vehicle’s energy consumption and the resulting range implications. Our analysis showed that the recuperated energy can cover up to 42.2% (Tesla) and 38.6% (BMW) of the traction system’s energy requirements. This potential decreases with lower battery temperatures. By losing the capability to regenerate energy at low temperatures, a BEV’s range can therefore theoretically drop by approximately 42% at the extremes when recuperation is disabled entirely. However, depending on the trip length and the battery starting temperature the theoretical range decreases indicated by
Figure 6 may not unfold entirely, because the battery temperature may not stay below the critical temperature where no recuperation is possible throughout a whole trip. The route characteristics (length and duration) and the battery starting temperature are therefore the decisive factors for the identified theoretical range reductions to unfold.
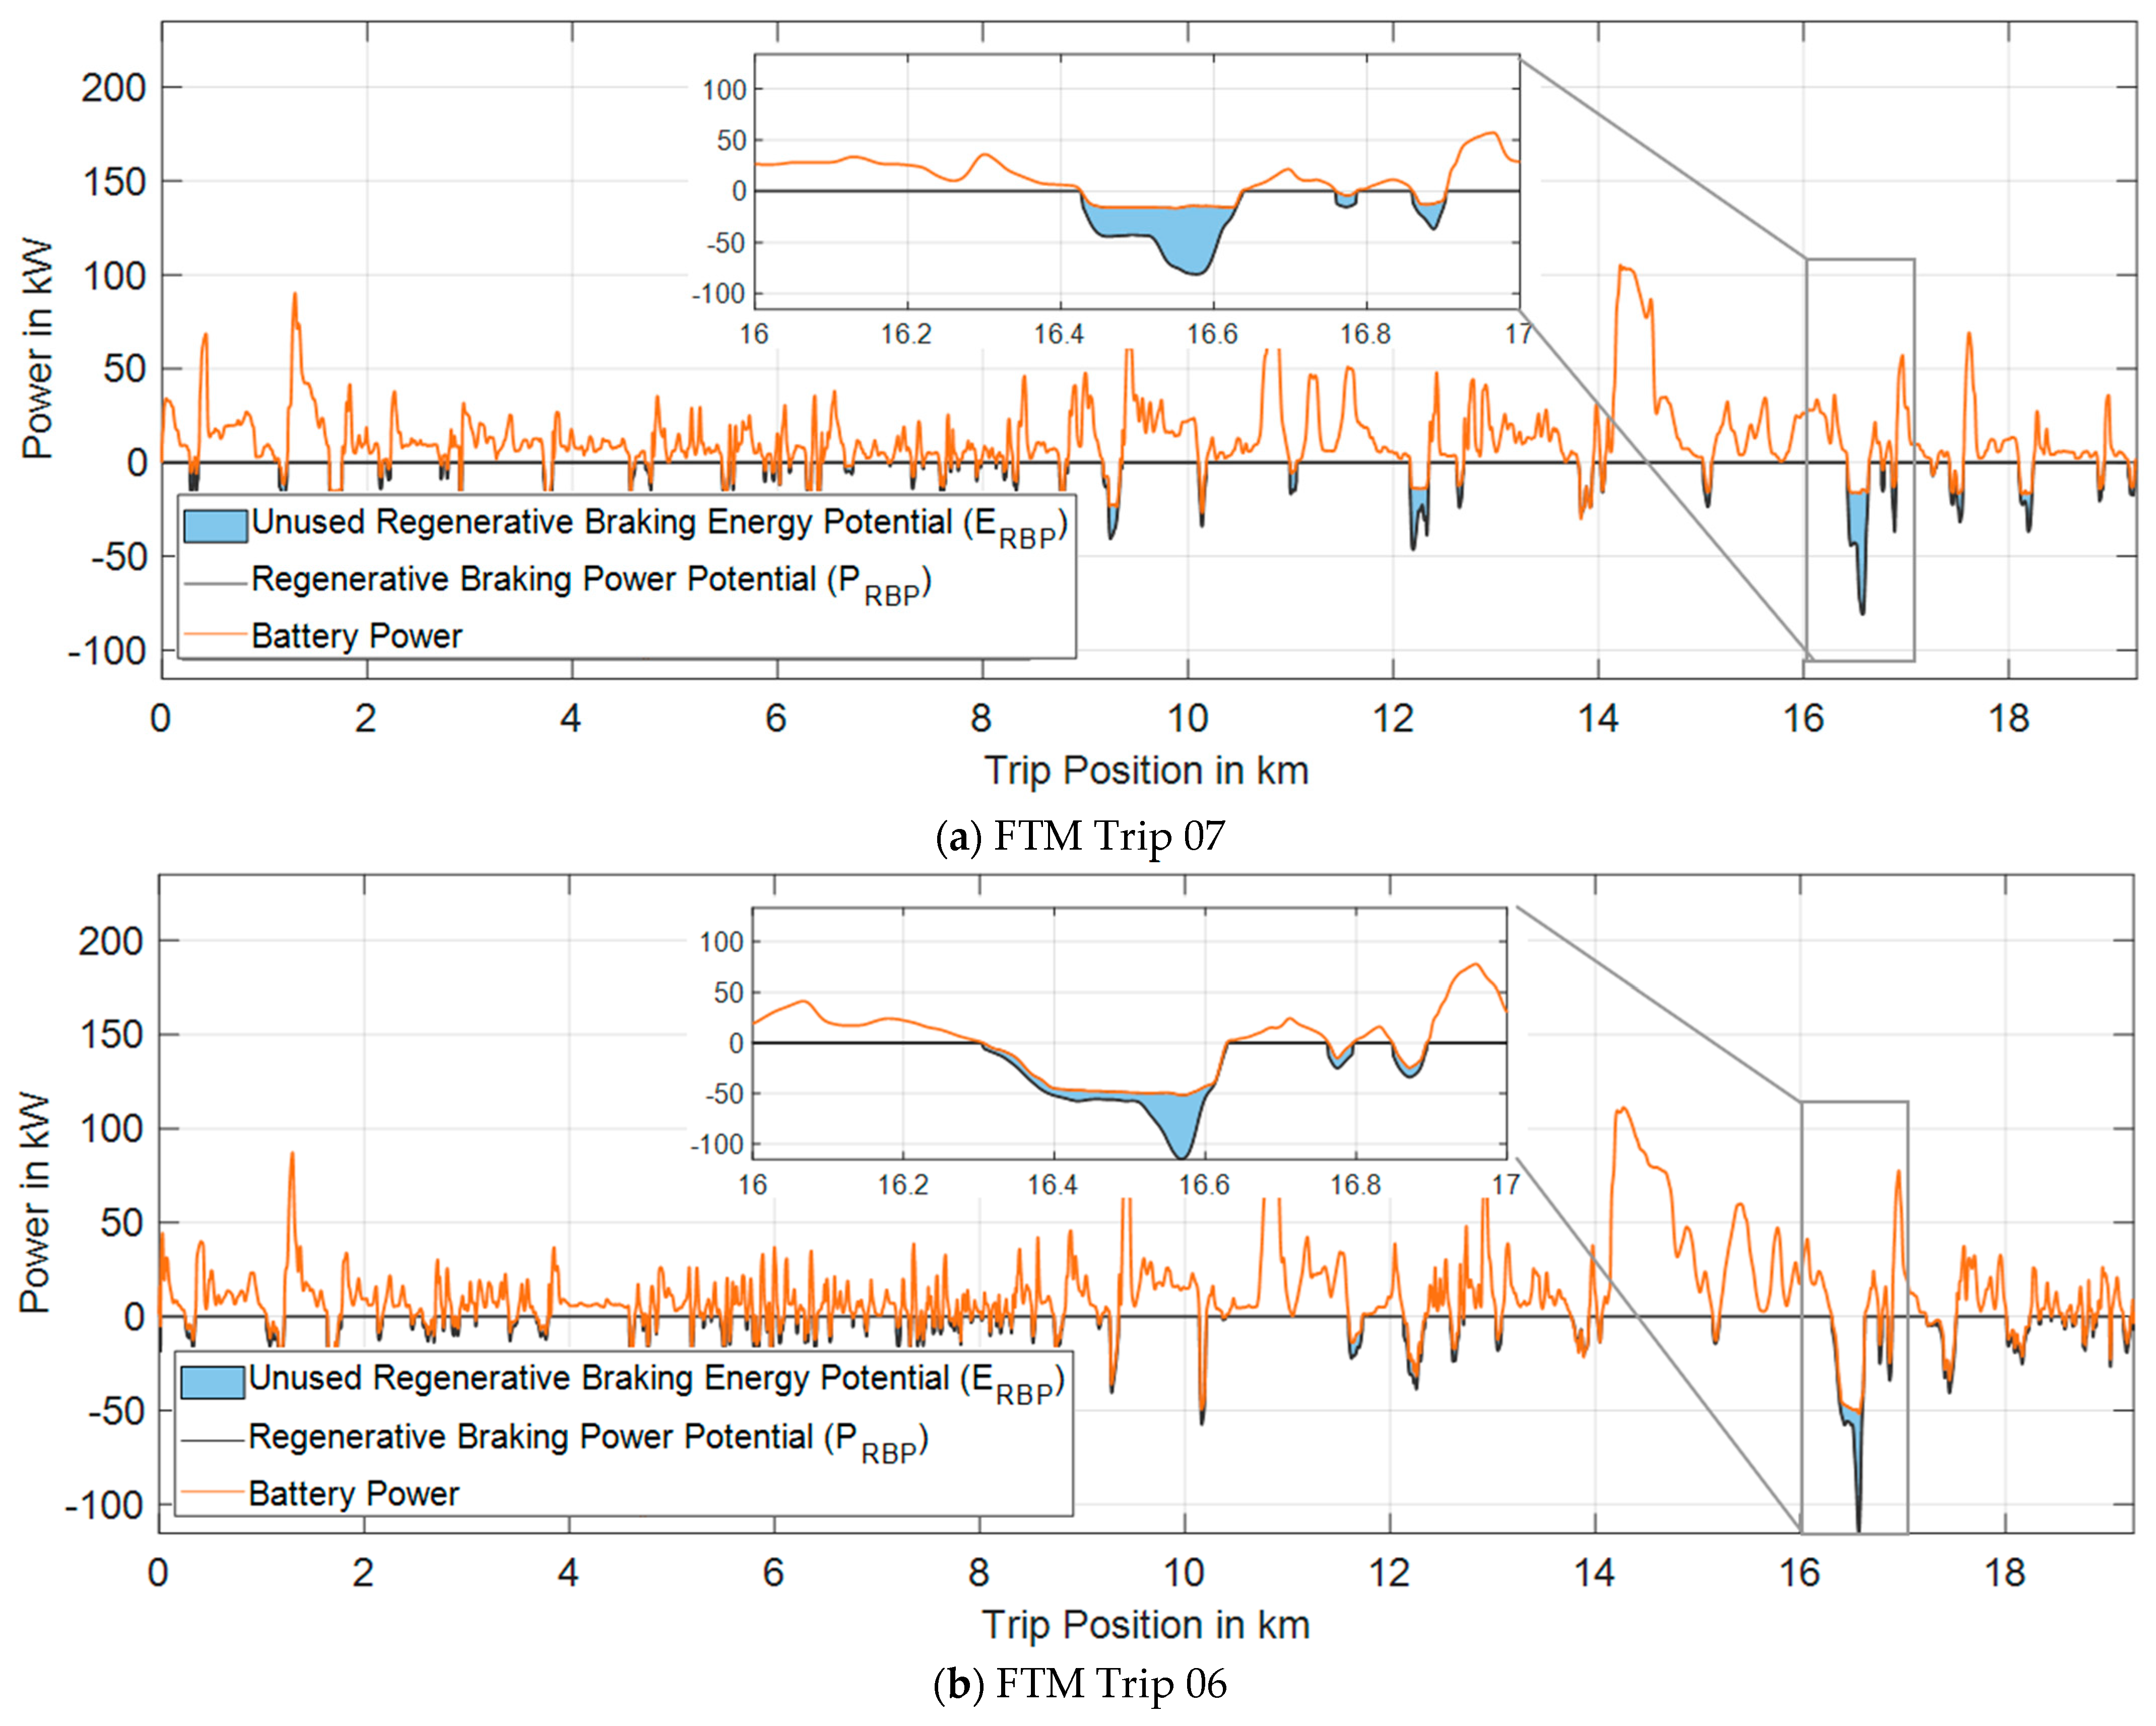
For the subsequent detailed recuperation analysis, we selected two trips of the BMW i3 on the FTM route (
Figure 7 and
Figure 8) and three trips of the Tesla Model 3 on the Rural route (
Figure 9 and
Figure 10) at different battery temperatures. The first figure displays the vehicles’ speed, the battery temperature and the SOC profile.
Figure 8 and
Figure 10, on the other hand, visualize the respective trips’ recorded battery power signal against the predicted regenerative braking power potential P
RBP and the unused regenerative braking energy potential
ERBP (
Section 4.4.3). To emphasize the difference of the regenerative braking limitation on the presented trips, an exemplary section in
Figure 8a,b and
Figure 10a–c is enlarged.
Figure 8 compares the two trips with the highest and lowest battery temperatures on the FTM route (
Section 3.1) in the database for the BMW i3. It is clearly visible that during the colder trip (FTM Trip 07), less regenerative braking energy potential can be used than in the warmer trip (FTM Trip 06), as indicated by the more prominent blue areas during the recuperation phases in
Figure 8a compared to those in
Figure 8b. The impact of the observed recuperation limitation on the vehicle’s energy consumption and its range is quantified and summarized in
Table 7. While the vehicle could regenerate no more than approximately 16% of the traction energy required for the colder trip, the figure increases to almost one fourth for the warmer trip. According to the definitions in
Section 4.4 one can translate these numbers directly to the vehicle’s range implications. Consequently, the 8.33% difference between the discussed regenerated energy portions of the two presented trips is equal to the range loss on FTM Trip 07 compared to FTM Trip 06 due to limited recuperation (see
MRR in
Table 7).
Table 7 also reveals that even for the warmer trip, the predicted regenerative braking energy potential was just 67.4%, which indicates that FTM Trip 06 was also affected by a recuperation limitation. The
URP shows that the vehicle could have gained an additional range advantage of 11.74% for the FTM Trip 06 and 15.11% for FTM Trip 07 when it would have used the respective predicted regenerative braking potential to the fullest (assumption: powertrain efficiency of 100%).
The detailed analysis of the BMW already showed how the recuperation capability of a BEV is affected by cold conditions, however, the analysis of the Tesla trips shows in an even more significant manner how the battery temperature impacts regenerative braking (
Figure 10). While for the coldest of the three displayed trips (Trip R01), high amounts of unused regenerative braking potential are visible throughout the trip, but almost no unused regenerative braking potential can be identified for the warmest of the three rural trips (Trip R05). The fact that the Tesla recuperated highly efficiently under warm conditions is also underlined by the
URP of a mere 3.46% for Rural Trip R05. For the coldest trip, on the other hand, the visible regenerative braking restriction leads to a
URP of 22.46%, and the inefficient usage of regenerative braking under cold conditions is also reflected by the regenerative braking share of just 6.6%. Compared to the
RS of Rural Trip 02, which was 17.13%, that of Rural Trip 05 was 28.3%. This finally leads to a measured range reduction of 21.7% for the Tesla Model 3 on the rural route due to limited recuperation under cold conditions (
Table 8).
Summing up
Section 5.2, the following findings could be made:
The regenerative braking analysis shows that a BEV’s recuperation capability is subject to control strategies that limit the maximum permissible regenerative braking power depending on the battery temperature. The lower limits to allow any recuperation at all were found to be −4 °C (Tesla Model 3) and −1.5 °C (BMW i3), while above 10 °C no significant recuperation power limitation could be identified for either vehicle. The general recuperation analysis shows that theoretically, a range reduction of up to 42.2% is possible when the recuperation is completely shut off for a whole trip. However, the detailed comparative regenerative braking analysis shows that practically, range reductions due to limited recuperation of up to 21.7% are more realistic. The reason for the considerable deviation between the theoretical and practical identified range reduction was found to be an increased battery temperature throughout a trip, which leads to a less restricted recuperation behavior with trip progression. Therefore, a complete recuperation shut off throughout a trip and the resulting massive range reduction of up to 42.2% due to limited recuperation are unlikely to occur.
5.3. Requirements for Direct Use of Regenerative Braking Power
Lieb et al. [
30] presented a concept to transform unused regenerative braking power under cold conditions directly into thermal energy for heating using a brake resistor. Other authors, such as Sakhdari and Azad [
46], proposed the development of a similar system. Through our detailed analysis of the driving data, we were able to derive the requirements for such a system, which are presented below. We made a statistical analysis of the test vehicle’s recuperation characteristics, where we analyzed the duration and the power of regenerative braking phases. The trips were classified according to the battery temperature at the start of the trip in order to exclude any distorting effects due to limited recuperation.
Figure 11 and
Figure 12 show the relative frequency of the duration and power clusters of the BMW i3 and Tesla Model 3 datasets, respectively. The duration of over 50% of the recuperation phases is less than 3 s for both vehicles, which can be explained by the one-pedal feeling. Instantaneous regenerative braking when the accelerator pedal is released results in many short recuperation phases. The largest proportion is in the time range between one and three seconds. Under cold conditions (
TBat ≤ 0 °C), recuperation currents only occur between 1 s and 3 s and between 5 s and 10 s in the BMW i3. This is primarily due to the small database in this range. In contrast, the Tesla dataset shows recuperations below 0 °C for every time range up to 20 s. However, beyond this, no effect of temperature on the duration of recuperation phases can be detected. Only rarely is a recuperation phase longer than 20 s, while 95% of the phases are shorter.
The power of regenerative braking again illustrates the effect of the one-pedal feeling. In the BMW i3, the share of recuperation phases with powers ≤2.5 kW is at about 90%, while for the Tesla such recuperation phases make up at least 60% of phases over the whole temperature range. This indicates that in many deceleration phases, the driver brakes just slightly. In the BMW i3, the power is between 2.5 kW and 5 kW for about 10% of recuperations, with only little recuperation occurring in higher power ranges. In the Tesla, on the other hand, recuperation phases with higher powers also occur, but recuperation with more than 20 kW hardly ever occurs. Again, no clear effect of battery temperature on the statistical distribution can be observed.
From these observations, the following requirements can be derived for an electrothermal recuperation system.
Response times in the lower millisecond range: The system should have a fast response and a short ramp-up time to capture short recuperation phases below 1 s.
Power transformation of up to 20 kW: The system should be able to transform up to 20 kW of electric power into heating power.
The identified power requirement can only be fulfilled by high-voltage auxiliary consumers, namely the heating and air conditioning system. While a rapid high power transformation cannot be implemented at the air conditioning compressor, an ohmic resistance heater is able to represent such a power sink. However, it should be noted that such a heater needs to be controlled directly via CAN bus and not, as is usually the case, via CAN and LIN bus. Such a system was investigated by Steinsträter et al. [
28] and they could show that a BEV can achieve a range increase of 8% at −10 °C compared to a BEV that is not able to use regenerative braking potentials directly for heating (ETR) under the same conditions. Even though a range increase of 8% under cold conditions is considerable, it does not compensate for the identified range losses in this paper due to heating and limited recuperation. The main reason for this circumstance is the limited conversion of regenerative braking power potential to heat by the vehicle’s in situ heating requirements and the ability of the coolant to absorb heat energy. This means when cabin heating requirements are satisfied (e.g., cabin temperature is already at the desired temperature) and when the coolant has already reached its maximum temperature, no further usage of ETR is possible. Another factor is the heater’s power limitation of 20 kW, which does not allow for the utilization of peak regenerative braking power potentials above 20 kW for the ETR.
6. Conclusions and Outlook
One of the greatest barriers for customers today to purchase battery electric vehicles is their limited driving range compared to the range of combustion engine vehicles. Additionally, the already limited range of BEVs decreases sharply at low temperatures. This is mainly caused by heating energy demands, which need to be supplied by the battery, and the reduced recuperation capability to protect the battery against accelerated aging.
In this analysis, these two effects were studied separately to identify their contribution and impact on a BEV’s range under cold conditions. The investigation is based on two datasets, which consist of multiple trips with BEV models from the compact car class. The two test vehicles are a 2014 BMW i3 and a 2020 Tesla Model 3. Both datasets were subject to a general analysis, which included all available trips. Beyond that, a detailed analysis was conducted for trips in each database that were driven on the same route at different ambient temperatures.
The detailed analysis regarding the impact of limited recuperation on the range included a comparison of the vehicles’ measured regenerative braking behavior with the predicted, theoretically possible recuperation potential throughout a trip to assess the vehicles’ regenerative braking performance in more detail. The predicted potential was determined by a longitudinal dynamics simulation for both vehicles. Finally, technical requirements were derived for a system that allows the utilization of unused regenerative braking energy potentials under cold conditions by transforming them into thermal energy to be used for heating (electrothermal recuperation—ETR).
As a result of the investigation, the following key findings were made:
Heating energy demands can cut a BEV’s range by almost one third.
While the ambient temperature has a significant impact on the heating energy demands, other factors such as weather conditions are likely to impact the heating energy demands as well.
A BEV’s maximum regenerative braking power capability depends on the battery temperature.
Regenerative braking power limitations apply to the battery temperature range below 10 °C and the limitations increase with lower battery temperatures.
At a battery temperature of −4 °C, regenerative braking is disabled entirely (Tesla Model 3).
Theoretically, a BEV’s range could be cut by up to 42.2% if regenerative braking would be disabled for a whole trip (battery temperature stays below −4 °C throughout the trip).
Practically, based on the available data, range reductions due to limited recuperation of up to 21.7% were identified.
In total, range reductions of approximately. 50% are possible at low temperatures due to the combination of both heating energy demands and limited recuperation.
Technical requirements for an ETR-system to reduce the identified range losses were found to be a fast response time in the lower millisecond range and a power capability of 20 kW.
Restrictions regarding the achievable range regain with such a system still apply due to the limited energy storage capability of the heating circuit and the inability of the heater to utilize peak recuperation potential powers.
Building on the results of this paper and the awareness of the current limitations of ETR, future research could investigate ETR-optimized heating circuits to increase the potential of electrothermal recuperation further. In addition, this study demonstrates that an optimized recuperation limitation strategy could help increase a BEV’s range under cold conditions. Based on the findings, further research could also investigate the trade-off between the energy demand for thermal battery preconditioning and the loss of energy due to limited recuperation when the battery is cold at the trip start. Additionally, the impact of different recuperation limitation strategies on battery life, safety, and long-term range versus the benefit of regenerating more energy and providing more range to customers under cold conditions is a topic this study opens up.


