1. Introduction
At 28%, the transportation sector in the United States (US) accounts for the largest source of greenhouse gas (GHG) emissions [
1]. Consumer adoption of electric vehicles (EVs) is a critical component of decreasing transportation sector emissions and other pollution as well as meeting US GHG reduction goals. Research suggests that meeting GHG reduction goals would require replacing about 350 million internal combustion engine vehicles with EVs (or about 90% of the existing US fleet) by 2050 [
2]. In 2018, EVs accounted for just 4% of all light-duty vehicle sales [
3]. If the US is to realize the emission reduction benefits of EVs, efforts to accelerate EV adoption will need to ramp up significantly. To help accelerate EV adoption, to date, 14 US states and the District of Columbia currently have Zero Emission Vehicle (ZEV) regulations in place that target 30% ZEV sales by 2030 [
4].
To meet GHG reduction goals and EV sales targets, key EV adoption barriers must be met. Barriers to EV adoption center around lack of familiarity (due to limited production and promotion from vehicle manufacturers), vehicle price, driving range, and perceived lack of charging infrastructure. Although consumer interest in EVs has been increasing, many are still unfamiliar with EVs. A 2020 study found that just 30% of US consumers reported being “knowledgeable” about EVs [
5]. While there is often a higher upfront cost to EVs compared to fossil fuel vehicles, this additional cost can be mitigated by fuel and maintenance savings, in addition to tax incentives that are federally and locally available for certain EV models [
6]. Even with significant improvements to EV battery range over the past few years, consumers still perceive a lack of available charging and many do not understand how and where to charge [
7]. Further, several studies have shown that low-income and minority communities are disproportionately impacted by environmental and transportation injustice. These studies indicate that transportation electrification offers key opportunities to reduce harmful air pollution and improve transit reliability and cost for these communities [
8].
Support at a local level is needed to meet state ZEV goals and electric utilities are in a unique position to help address these barriers by providing their customers with information and education to encourage EV adoption and provide customers with accessible and reliable charging infrastructure. Further, the amount of electricity consumed by EVs in the United States is expected to increase from 2.85 terawatt-hours (TWh) in 2018 [
9] to between 58 and 153 TWh by 2030 [
10]. To ease the transition to EVs, electric utilities in the US have begun to launch programs to both address barriers to EV adoption and to manage the increased electricity demand associated with EV charging. According to a 2018 study, most utilities in the US were engaged in early-stage EV activities, including providing EV information on websites, electrifying utility-owned fleets, and assessing potential grid impacts [
11]. Few utilities currently have programs in place to address EV charging, including providing special EV rates, managed charging, and vehicle-to-grid (V2G) programs [
11].
Portland General Electric (PGE) has encouraged EV adoption in and around Portland, Oregon in a variety of ways. In partnership with the City of Portland and Portland State University (PSU), PGE launched the first “Electric Avenue” on the PSU campus in 2011 [
12]. This initiative provided EV owners with free public charging (subsidized by PSU) included in the cost of parking. In 2016, PGE moved and expanded the PSU Electric Avenue location to outside its headquarters in downtown Portland. Simultaneously, PGE launched an Employee EV Research Program, which gave eligible PGE staff financial incentives to assist with purchasing an EV.
Building off its experience with the first Electric Avenue locations and the Employee Research Program, PGE launched a coordinated set of three five-year pilot programs in late 2018 that encourage greater electrification of the transportation sector in its service territory (the Portland and Salem metro areas) [
13]. While each pilot program has its specific activities and immediate targets, the pilots work together to achieve several overlapping, near-term outcomes including increasing customer awareness and use of EVs, transit buses, and public charging stations, and to lower barriers to adoption of EVs for all customers, including those in underserved communities (those with limited or no access to charging) and environmental justice communities, which include “minority and low-income communities, tribal communities, and other communities traditionally underrepresented in public processes” [
14]. This article discusses evaluation research conducted for two of the three transportation electrification pilots, specifically:
Outreach, Education, and Technical Assistance Pilot: To increase adoption of EVs, PGE provides EV technical assistance to organizations that are considering fleet electrification, workplace charging, or procurement of EVs. PGE is working with auto dealers to install educational kiosks (developed by a partner organization) at dealerships to educate auto dealer staff and consumers about EVs and a proprietary EV charger labeling system. In addition to general consumer marketing, PGE is also partnering with Original Equipment Manufacturers (OEMs) to offer combined PGE and OEM EV incentives to PGE customers. PGE has also sponsored ride-and-drive events to allow customers, including rideshare drivers, to test drive EVs and has sponsored an exhibit at the Portland International Auto Show.
Community Charging Infrastructure Pilot: PGE has installed six Electric Avenue charging locations throughout its service territory (a total of 14 Level 2 chargers and 26 DC fast chargers). Locations include areas with limited existing fast charging and high proportions of multifamily properties. The pilot aims to test pricing signals to encourage off-peak charging and examine the impact of community charging on increasing adoption of EVs by customers and transportation network company (TNC) drivers. Future research will involve conducting intercept surveys with Electric Avenue users to better understand user experience and impacts on multifamily residents.
While not discussed in this paper, PGE is also installing utility pole-mounted Level 2 chargers in its service territory that it hopes will provide a quick and efficient way to expand charging access to customers.
2. Materials and Methods
The authors are conducting a five-year evaluation of PGE’s Transportation Electrification Pilots. During the first and second years of the evaluation, the authors compiled data through various sources, including ride-and-drive intercept surveys, pre- and post-pilot general population surveys, and an online focus group with TNC drivers. The authors also used Electric Avenue charger utilization data to explore usage patterns [
15,
16].
2.1. General Population Surveys
In 2018, PGE conducted a baseline survey with the general population of residential customers that indicated whether they were considering purchasing a vehicle in the next five years. Additionally, the survey explored EV awareness and perceptions in the PGE territory. The authors adapted the 2018 Baseline survey to create a post-pilot launch survey that was fielded in late 2019. For the 2018 (“Baseline”) and 2019 (“Wave 1”) surveys, a random sample of PGE residential customers with email addresses were invited to take the web-based survey via email invitation. To mitigate response bias, neutral language was used in the invitation and did not specifically mention that the topic of the survey was EVs. The surveys included screening questions to terminate the survey for those who reported being under the age of 18 or working in the automotive, environmental, energy, utility, or market research industry.
Both the Baseline and Wave 1 surveys included questions about awareness, consideration of purchase, and intention to purchase or lease an EV as well as questions explicitly addressing the pilot activities, such as if PGE customers were familiar with any pilot campaigns. Overall, 929 (54%) of Baseline and 1026 (59%) of Wave 1 survey respondents reported planning to purchase a vehicle in the next five years. The authors weighted Baseline and Wave 1 survey results to correct for sampling and non-response bias present in the survey data. The weights are calibrated through an iterative raking technique to align with population benchmarks on age, income, county, and PGE residential customer segment. All Baseline and Wave 1 survey results presented in this article are weighted.
2.2. Ride-and-Drive Intercept Surveys
In 2019, the authors conducted in-person intercept surveys at two PGE-sponsored ride-and-drive events. One event in April 2019 targeted the general public at an Electric Avenue opening, while the November 2019 event specifically targeted individuals employed as TNC drivers. The key objectives of these surveys were to understand reasons for attending the events, consideration and intention to purchase or lease an EV in the near future, attendee satisfaction, and attendee exposure to other PGE outreach and education campaigns or resources. The authors attempted to survey all individuals who test drove an EV at each event. The authors completed 15 surveys at the April event and 24 surveys at the November event. In total, 39 surveys were completed with ride-and-drive participants. Although the sample is small, it does account for most individuals who test drove vehicles at the events (n = 48) and is thus reflective of the ride-and-drive populations. In addition to the two ride-and-drive surveys conducted by the authors, PGE staff conducted a survey at the National Drive Electric Week event in September 2019. Seventy-nine event attendees who participated in a ride-and-drive completed the survey.
2.3. TNC Focus Group
In July 2020, the authors conducted an online synchronous focus group with TNC drivers who were PGE customers who drove for a national TNC company and were considering purchasing or leasing an EV for their next vehicle. This qualitative data collection approach was chosen by the authors to gain an in-depth understanding of participants’ experiences as a TNC driver and their reasons for considering EVs and how they would use EVs and EV charging for rideshare driving. Through moderator-led group conversations, focus groups uncover deeper insights about a particular topic than is possible with a structured quantitative research technique [
17].
The authors recruited focus group participants from a list of 199 TNC drivers who had signed up for a rideshare EV informational session and ride-and-drive event (as discussed above) sponsored by PGE’s ride-and-drive implementer in November 2019. The authors invited all 199 TNC drivers via email to fill out a short focus group screening survey. The survey confirmed that potential participants were currently or recently a TNC driver, did not work for an industry that would pose a conflict of interest, were PGE customers, did not currently own an EV, and were considering an EV for their next vehicle. All other respondents were excluded from being considered for participating in the focus group. The team recruited 10 participants, of which seven attended the online focus group.
2.4. Electric Avenue Charger Utilization and User Group Analysis
In 2020, the authors also conducted an analysis of Electric Avenue charger utilization data to determine how a USD 0.19/kWh surcharge during PGE’s peak system hours (3:00 p.m.–8:00 p.m.) impacted charger usage and how utilization varied across three user groups:
TNC subscribers: Rideshare drivers who have free monthly unlimited use of PGE’s Electric Avenue sites, subsidized by a TNC company.
Monthly subscribers: General population users who pay USD 25 per month for unlimited charging at PGE’s Electric Avenue sites.
Non-subscribers: General population users who pay per hour at PGE’s Electric Avenue sites, ranging from USD 3 per hour for L2 charging, and USD 5 per session at fast charging stations.
All three user groups are subject to the USD 0.19/kWh surcharge during peak hours. The analysis was conducted based on the charging data measured at the chargers at each site from March 2019 to October 2020.
3. Results
The following sections present results from the ride-and-drive intercept surveys, TNC focus group, general population surveys, and Electric Avenue charge utilization and user group analysis.
3.1. Ride-and-Drive Intercept Surveys
Findings from the ride-and-drive surveys show that vehicle battery range and charging needs vary between the general public and TNC drivers. Intercept survey findings show about three-quarters (12 of 15) of general public survey respondents reported driving 200 miles or less each week, which suggests that EVs with a 100-miles-per-charge range can likely fulfill the driving needs of these respondents. In contrast, over half (13 of 24) of TNC driver respondents reported driving over 400 miles each week for their TNC rides, suggesting TNC drivers need long-range EVs coupled with easily accessible public charging. TNC drivers were also more likely to report owning more than one vehicle (17 of 24 vs. 8 of 15). Over half (14 of 24) of TNC respondents indicated, however, that the vehicle they use for TNC rides is also for personal use.
The ride-and-drive events appear to increase attendees’ likelihood of purchasing or leasing an EV in the next five years, especially among TNC drivers. Most general public (14 of 15) and TNC driver respondents (20 of 24) reported they would be “somewhat” or “very” likely to purchase or lease an EV within the next five years. About one-third (6 of 15) of the general public and two-thirds (16 of 24) of TNC driver survey respondents indicated that the ride-and-drive event increased their likelihood of purchasing or leasing an EV “a great deal” (
Figure 1). Similarly, at a larger ride-and-drive event, nearly all (99%) of 79 surveyed National Drive Electric Week ride-and-drive participants reported that they were “very likely” to consider an EV for their next vehicle purchase and about two-thirds (66%) reported the ride-and-drive made them “much more likely” to purchase an EV in the future. These finding are consistent with previous studies that have found direct experience with EVs through ride-and-drives to be effective in increasing consideration of EVs [
18].
After the test drive, respondents mentioned a variety of concerns they had about purchasing or leasing an EV. Both general public and TNC driver survey respondents were primarily concerned about the purchase price of the vehicle (7 of 15 and 14 of 24, respectively) and the vehicle driving range (7 of 15 and 14 of 24, respectively).
3.2. TNC Focus Group
Participants of the TNC focus group conducted in 2020 indicated they were primarily interested in EVs to reduce fuel and maintenance costs and help the environment. Two participants mentioned wanting an EV because it would have a much better fuel economy than their current vehicles. Similarly, others wanted to reduce the amount they spent on fuel as well as move away from fossil fuels. Participants also expected lower vehicle maintenance costs. Participants estimated they could save between USD 400 and USD 625 in monthly maintenance and fuel costs by switching to an EV and using the USD 25 Electric Avenue unlimited charging subscription, with one driver estimated their monthly fuel and maintenance costs would reduce from USD 750 to USD 125. A few participants indicated they fill up their gas tank every day or every other day, and two participants mentioned needing to get oil changes about once a month. One TNC driver said avoiding the USD 70 oil changes would result in “significant savings” by switching to an EV. Another was looking forward to not having to replace brake pads due to the regenerative braking in EVs.
Upfront vehicle cost as well as qualifying for low-interest financing are likely barriers to purchasing an EV for TNC drivers. One participant voluntarily mentioned the difficulty rideshare drivers encounter qualifying for vehicle loans. Lenders reportedly do not consider TNC driving wages as income until the driver has done it for at least two years, and after that, it may not be considered “steady” income. When asked of the group, all other participants agreed that qualifying for financing to purchase the EV was a concern for them.
All participants preferred an unlimited monthly charging subscription over pricing per session. Participants agreed the per session charging rates were not practical for the amount of charging they would need and that the USD 25 unlimited charge was “reasonable” and “the way to go” for a rideshare driver.
3.3. General Population Surveys
This section presents key findings from Wave 1 of the general population survey fielded to PGE residential customers in November 2019 with comparisons to the Baseline survey fielded in 2018 where questions are analogous. The surveys included questions about pilot awareness, consideration of purchase, and intention to purchase or lease an EV as well as questions specifically addressing the pilot activities. In the Wave 1 survey, 1026 PGE residential customers indicated they were likely to purchase or lease a vehicle in the next five years. The findings are broken down into three segments: EV Non-Considerers, EV Considerers, and EV Intenders (see
Table 1 for definitions of each segment).
3.3.1. Intention to Purchase
The number of respondents intending to purchase an EV in the next five years has increased significantly since the Baseline survey (24%, up from 17%), largely due to a shift from the number of EV considerers to the number of EV intenders (
Table 1). The decrease in EV considerers was largely among respondents who were considering a plug-in hybrid EV (PHEV) for their next vehicle; respondent consideration of battery electric vehicles (BEVs) remained the same between the two surveys. The authors found that the proportion of PGE customers who are considering or intending to purchase an EV (49%) is higher compared to the overall US population (36%) [
19].
3.3.2. Familiarity with BEVs and PHEVs
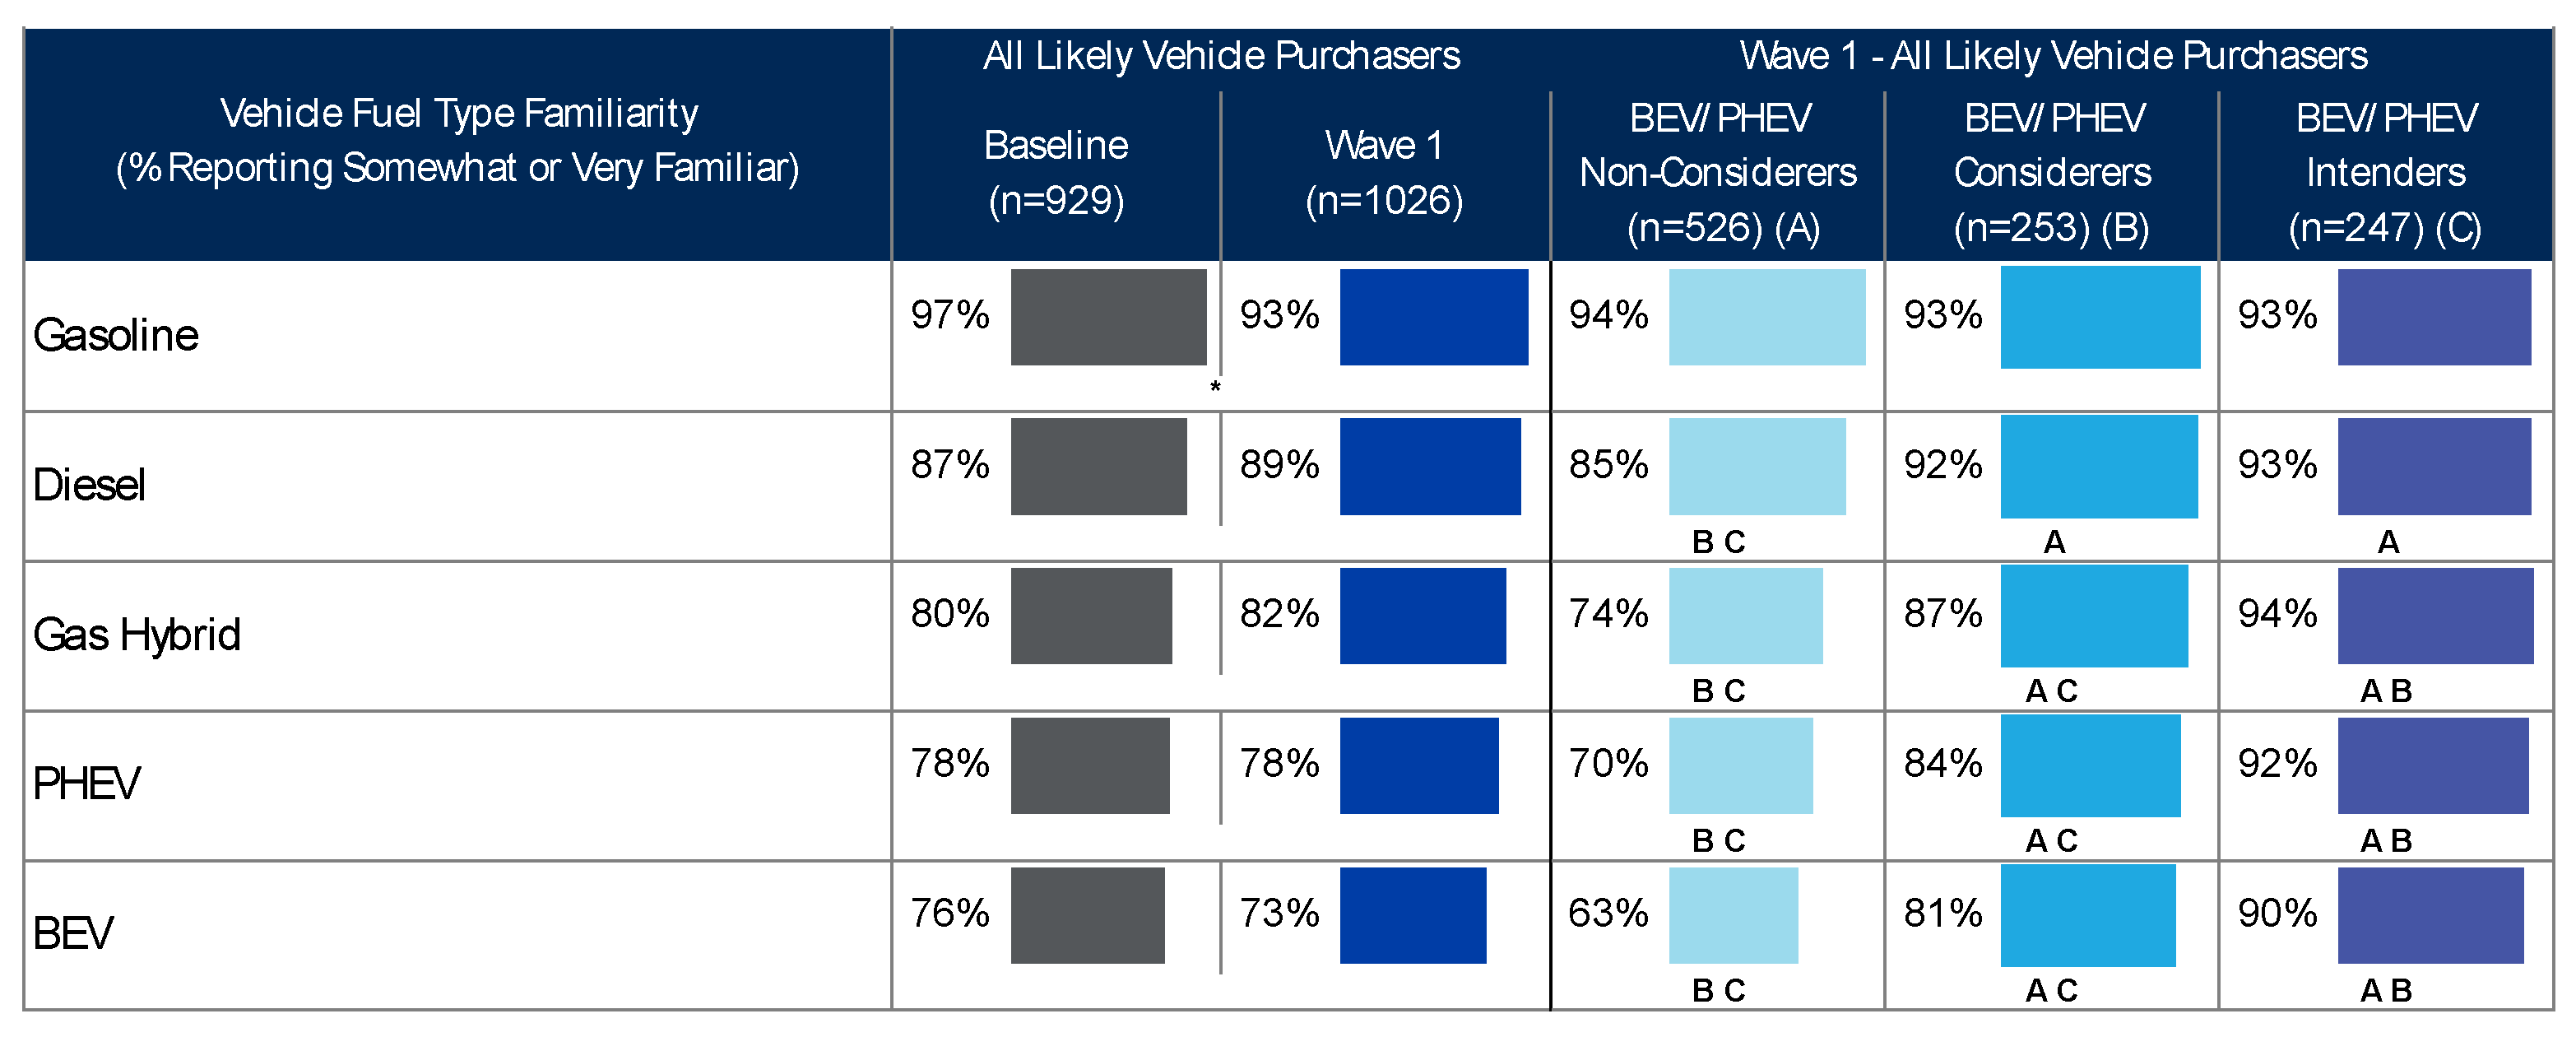
Respondents have moderate to high levels of familiarity with BEVs and PHEVs, which is consistent with Baseline survey findings. About three-quarters of respondents indicated they were at least somewhat familiar with BEVs (73%) and PHEVs (78%;
Figure 2). Respondents in the considerer and intender segments are significantly more likely to report being familiar with BEVs and PHEVs compared to those in the non-considerer segment. Further, analysis of combined Baseline and Wave 1 survey results shows low-income respondents and seniors (respondents aged 65 or older) are less familiar with EVs (Low-income respondents included those who meet the Housing and Urban Development (HUD) low-income guidelines for the state of Oregon (80% percent of the area median household income level) [
20]). Over one-third (67%) of low-income respondents indicated they were very or somewhat familiar with EVs compared to 77% of non-low-income respondents. Similarly, 68% of seniors indicated they were very or somewhat familiar compared to 76% of non-seniors.
Survey respondents report finding BEVs and PHEVs to be the most environmentally friendly vehicle types, unchanged since the Baseline survey. Respondents in the non-considerer segment are least likely to report that EVs are very environmentally friendly (reporting an 8–10 on a scale from “0” to “10”); however, all respondents are generally in agreement that gasoline and diesel vehicles are the least environmentally friendly vehicles.
When asked why respondents would consider purchasing or leasing an EV, the environmental impact and operational cost savings were the most cited considerations (
Figure 3). Respondents in the intender segment were most likely to report considering the environmental impact. Respondents in the non-considerer segment were most likely to indicate fuel and operating costs as a consideration, significantly more so than considerers. Similarly, most respondents who were considering or intending to purchase or lease an EV in the next five years reported that protecting the environment and lower fuel costs were major factors in their consideration (82% and 70%, respectively).
3.3.3. Barriers to Purchasing
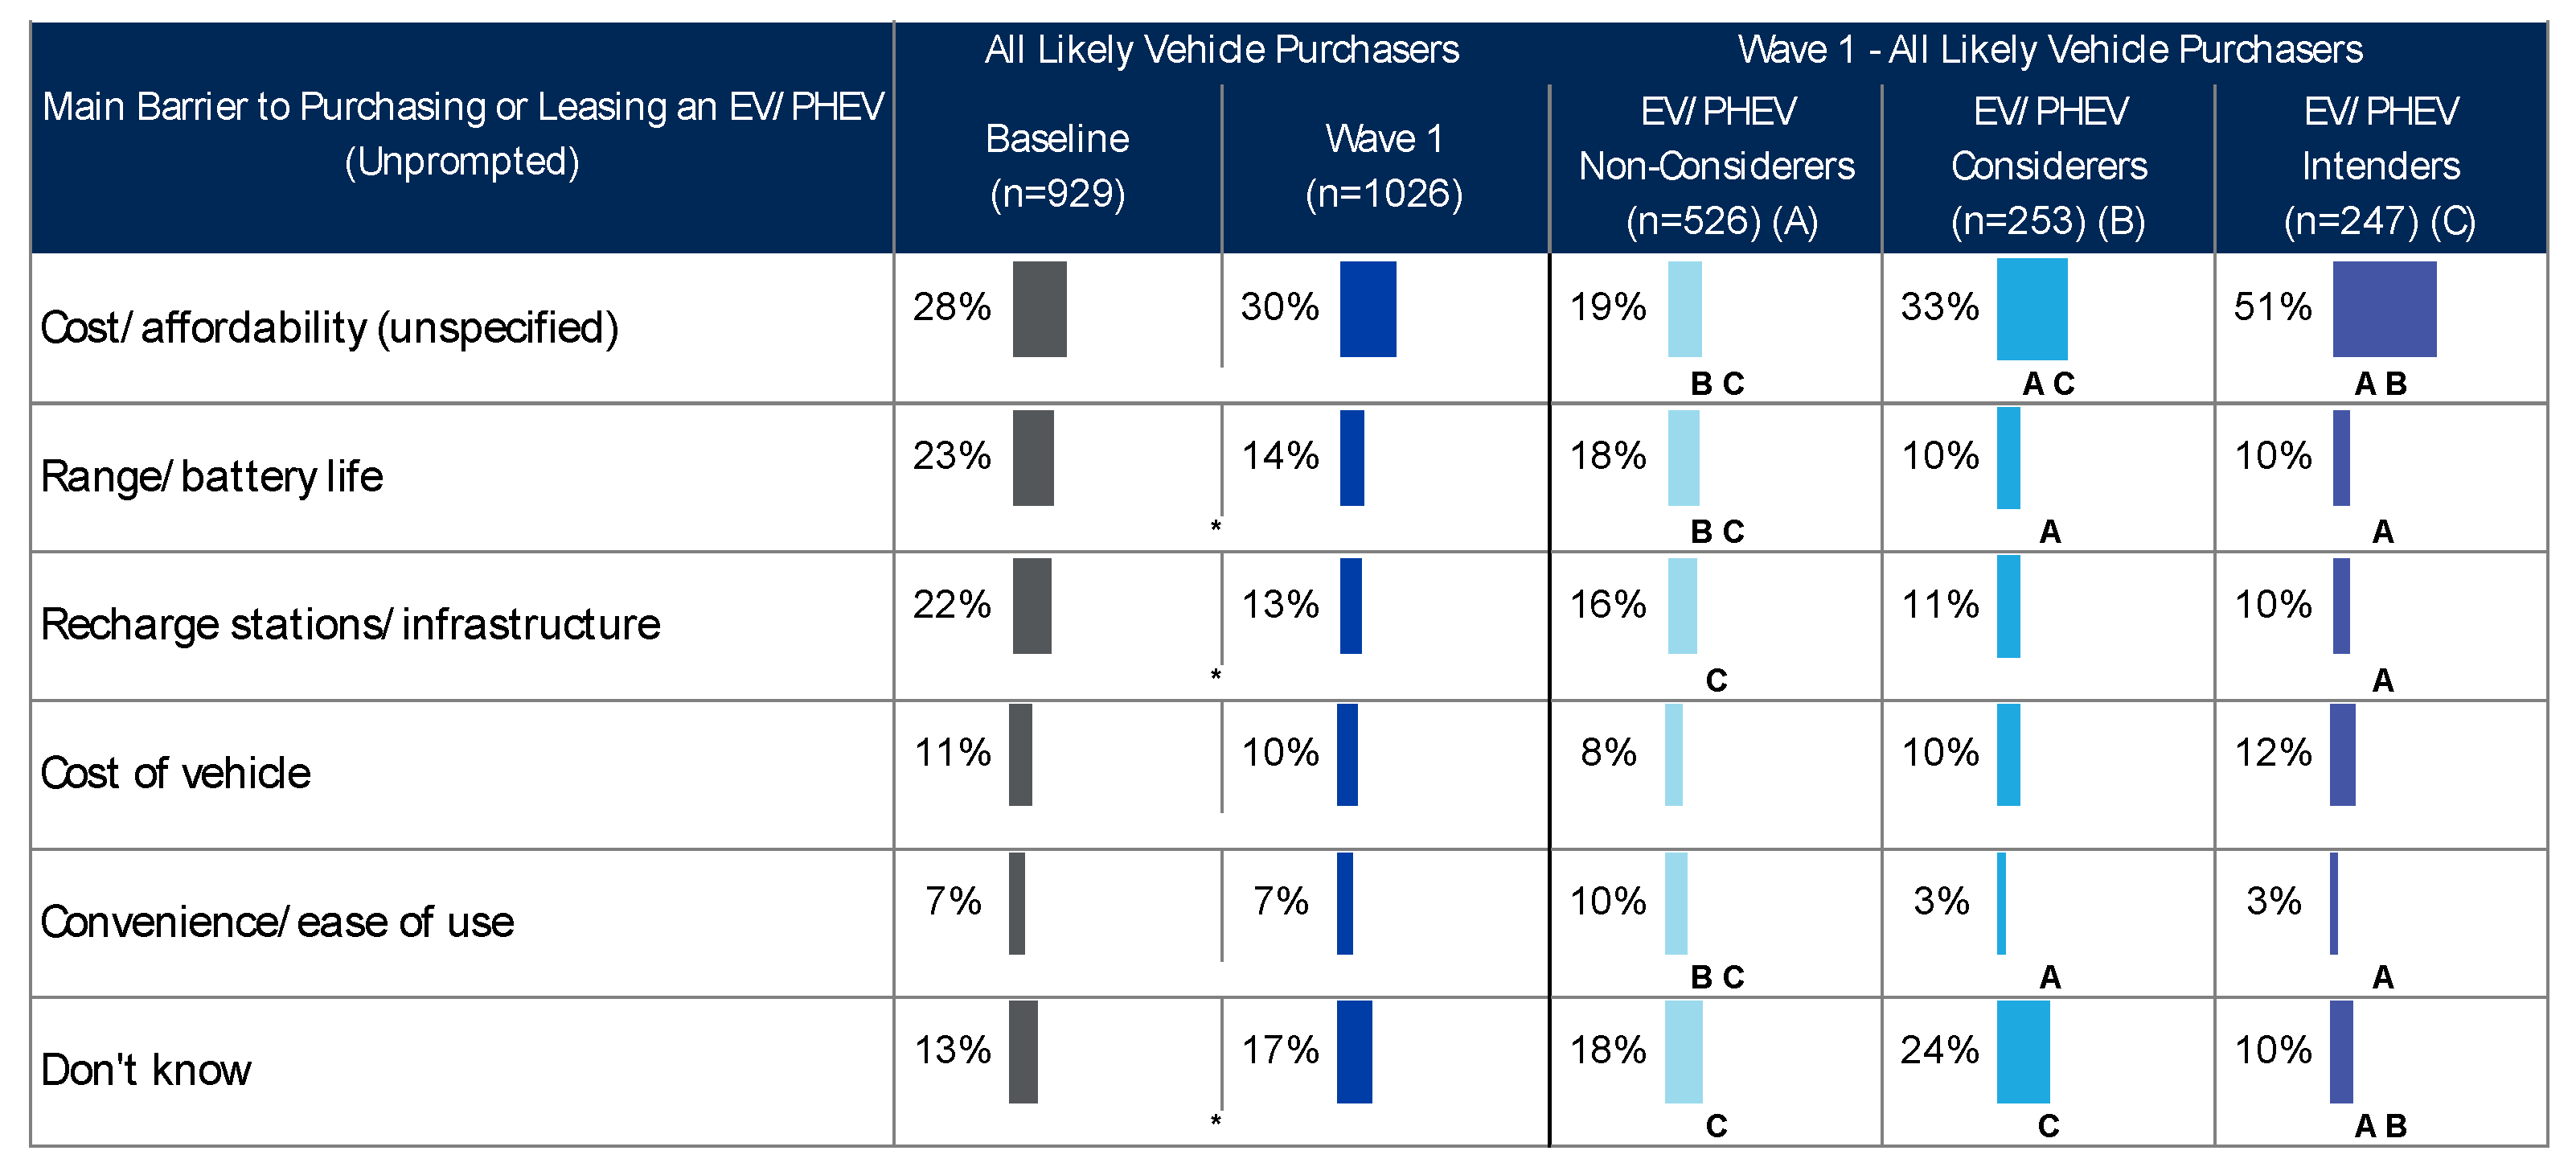
Survey results show that vehicle range has become less of a barrier to purchasing or leasing an EV, with the affordability of EVs remaining the greatest barrier. In an open-ended response, one-third (30%) of respondents mentioned that cost or affordability were barriers to purchasing or leasing an EV, unchanged since the Baseline survey (
Figure 4). There was a notable decrease, however, in the number of mentions related to vehicle range and charging availability compared to the Baseline survey. Interestingly, respondents in the considerer and intender segments were significantly more likely to report cost or affordability as barriers compared to non-considerers, likely because respondents in these segments have spent more time researching these vehicle types and understand the costs compared to conventional vehicles.
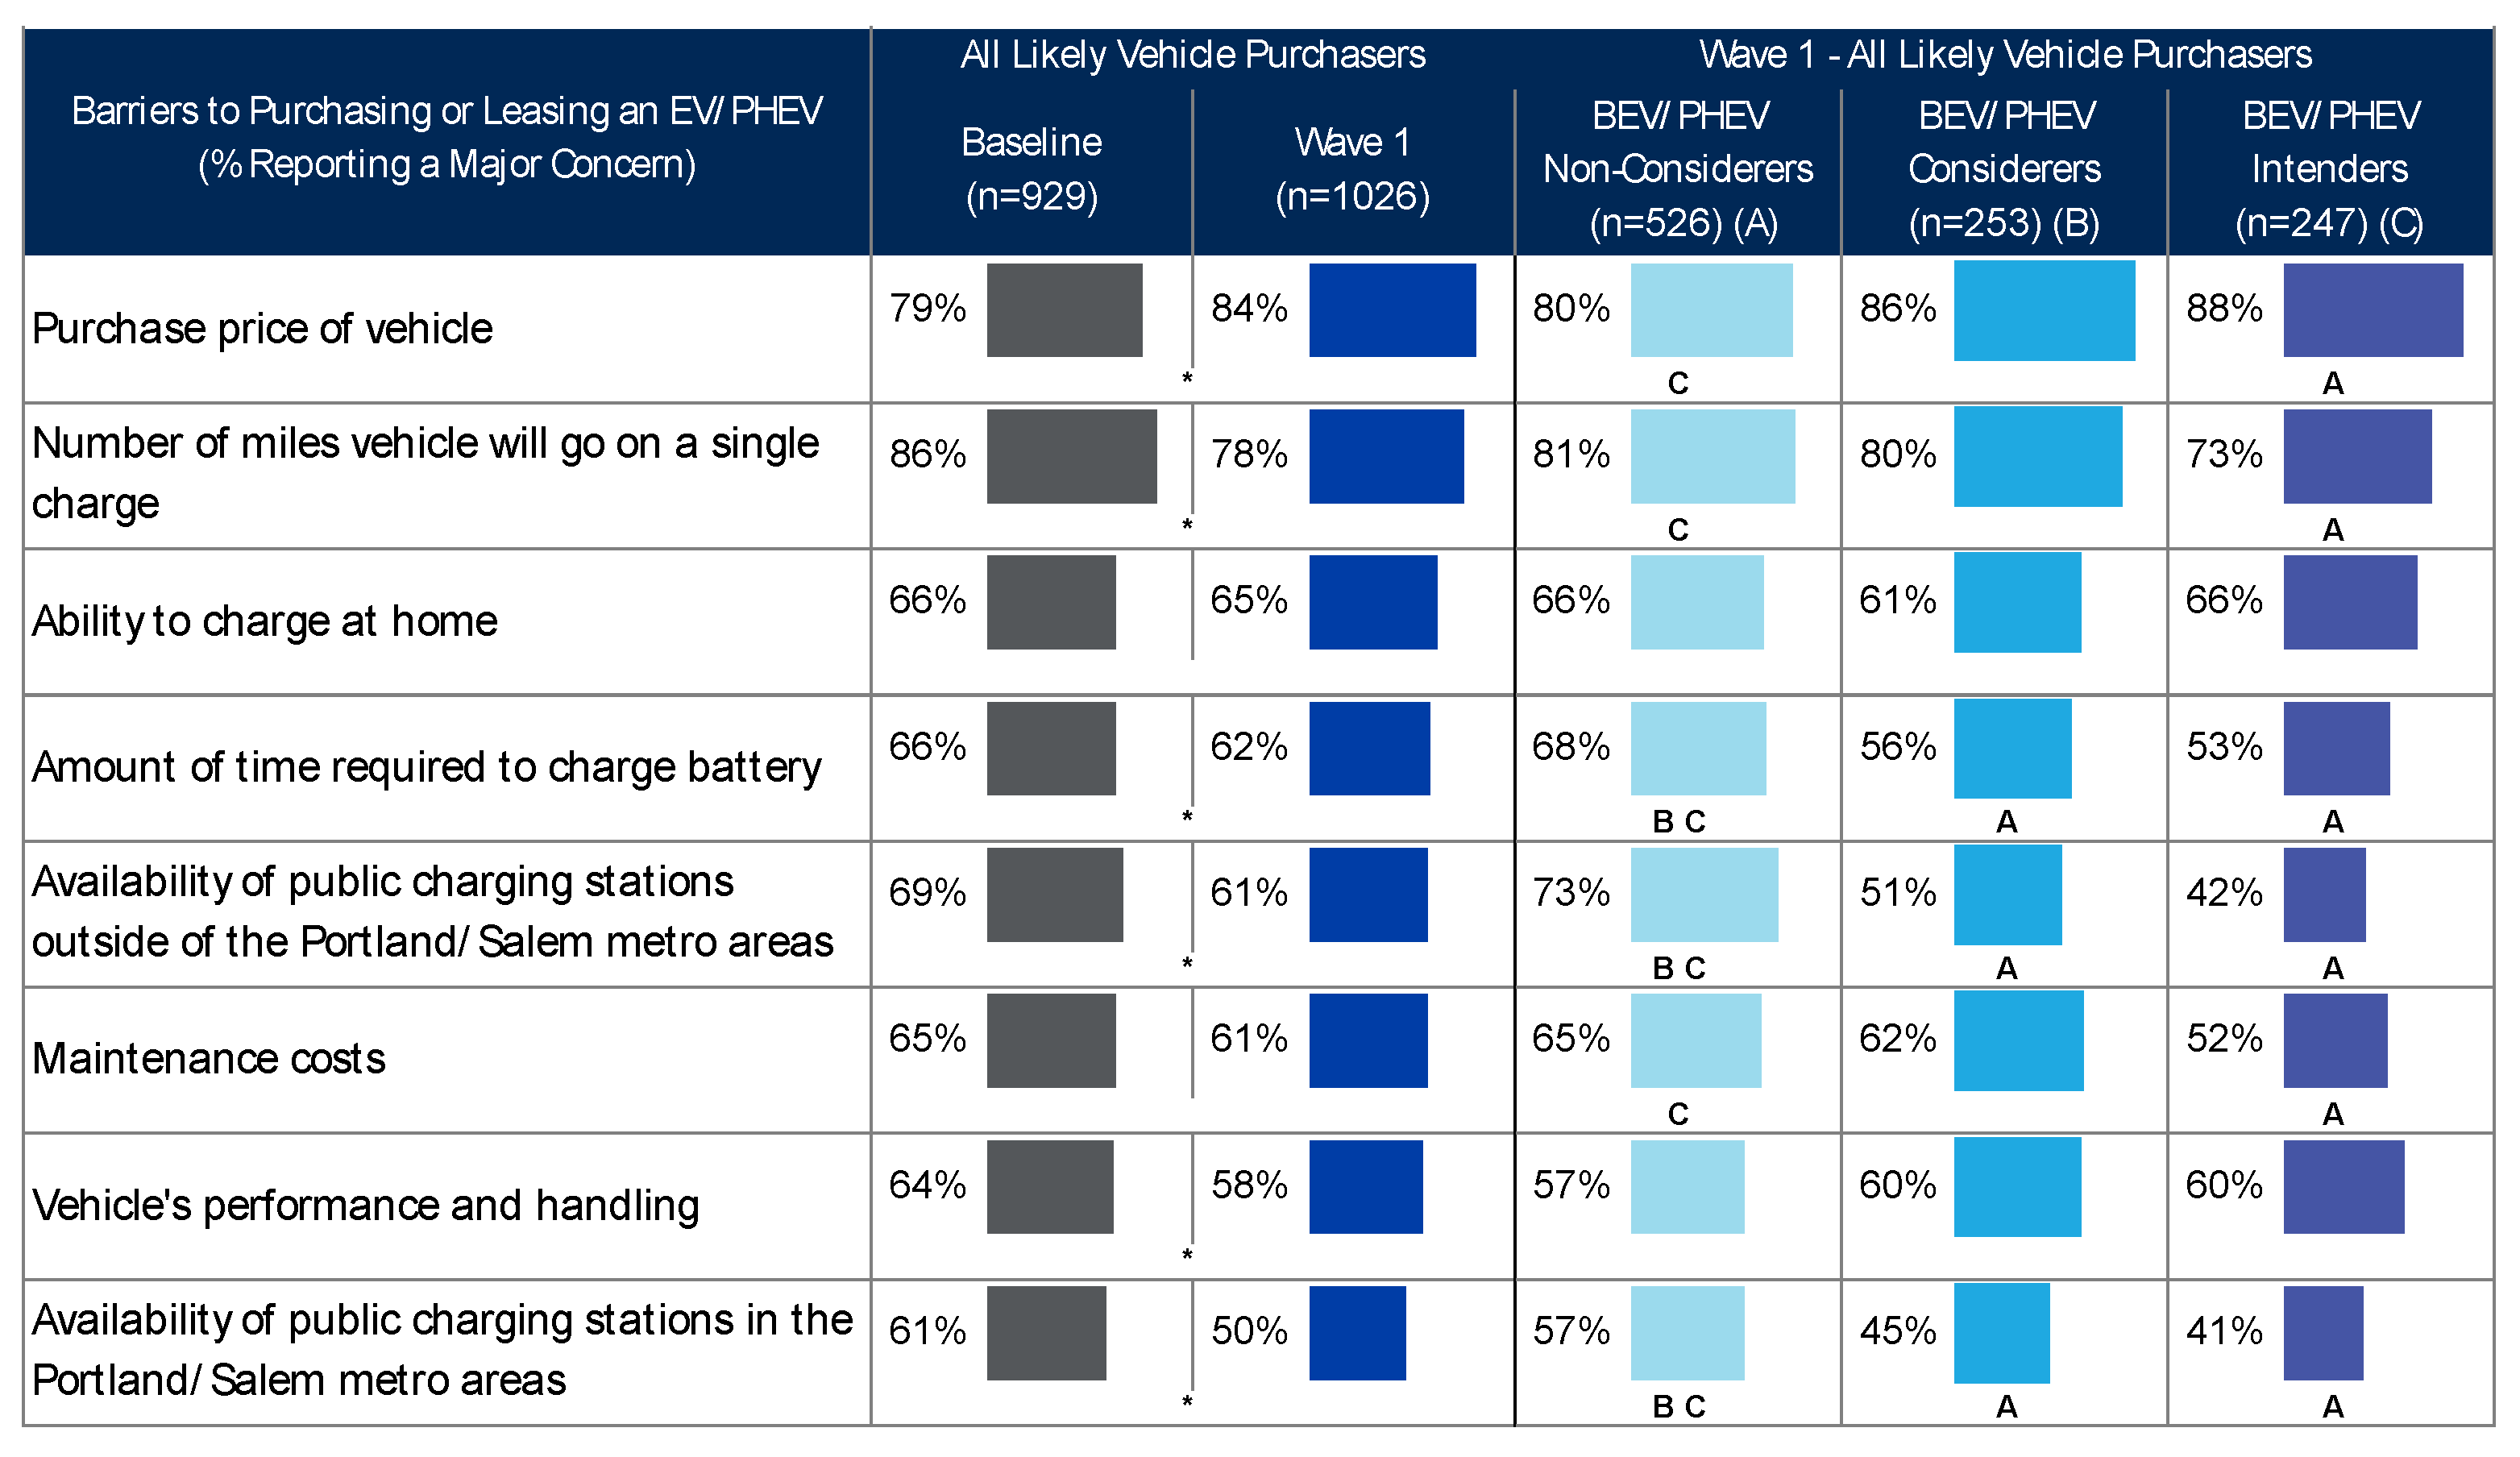
Similarly, when provided with a list of potential concerns to purchasing or leasing an EV, a large majority of respondents reported that the purchase price of the vehicle was a major concern, followed closely by vehicle range (
Figure 5). Concern about vehicle purchase price has increased significantly since the 2018 Baseline survey (84%, up from 79%). Concern with vehicle range and availability of public charging within PGE’s service territory and outside its territory, however, has decreased significantly since the Baseline survey. Among those respondents who reported vehicle range was a concern, about two-thirds (62%) indicated that the range would need to be over 200 miles to alleviate concerns.
3.3.4. Challenges Faced by Environmental Justice Communities
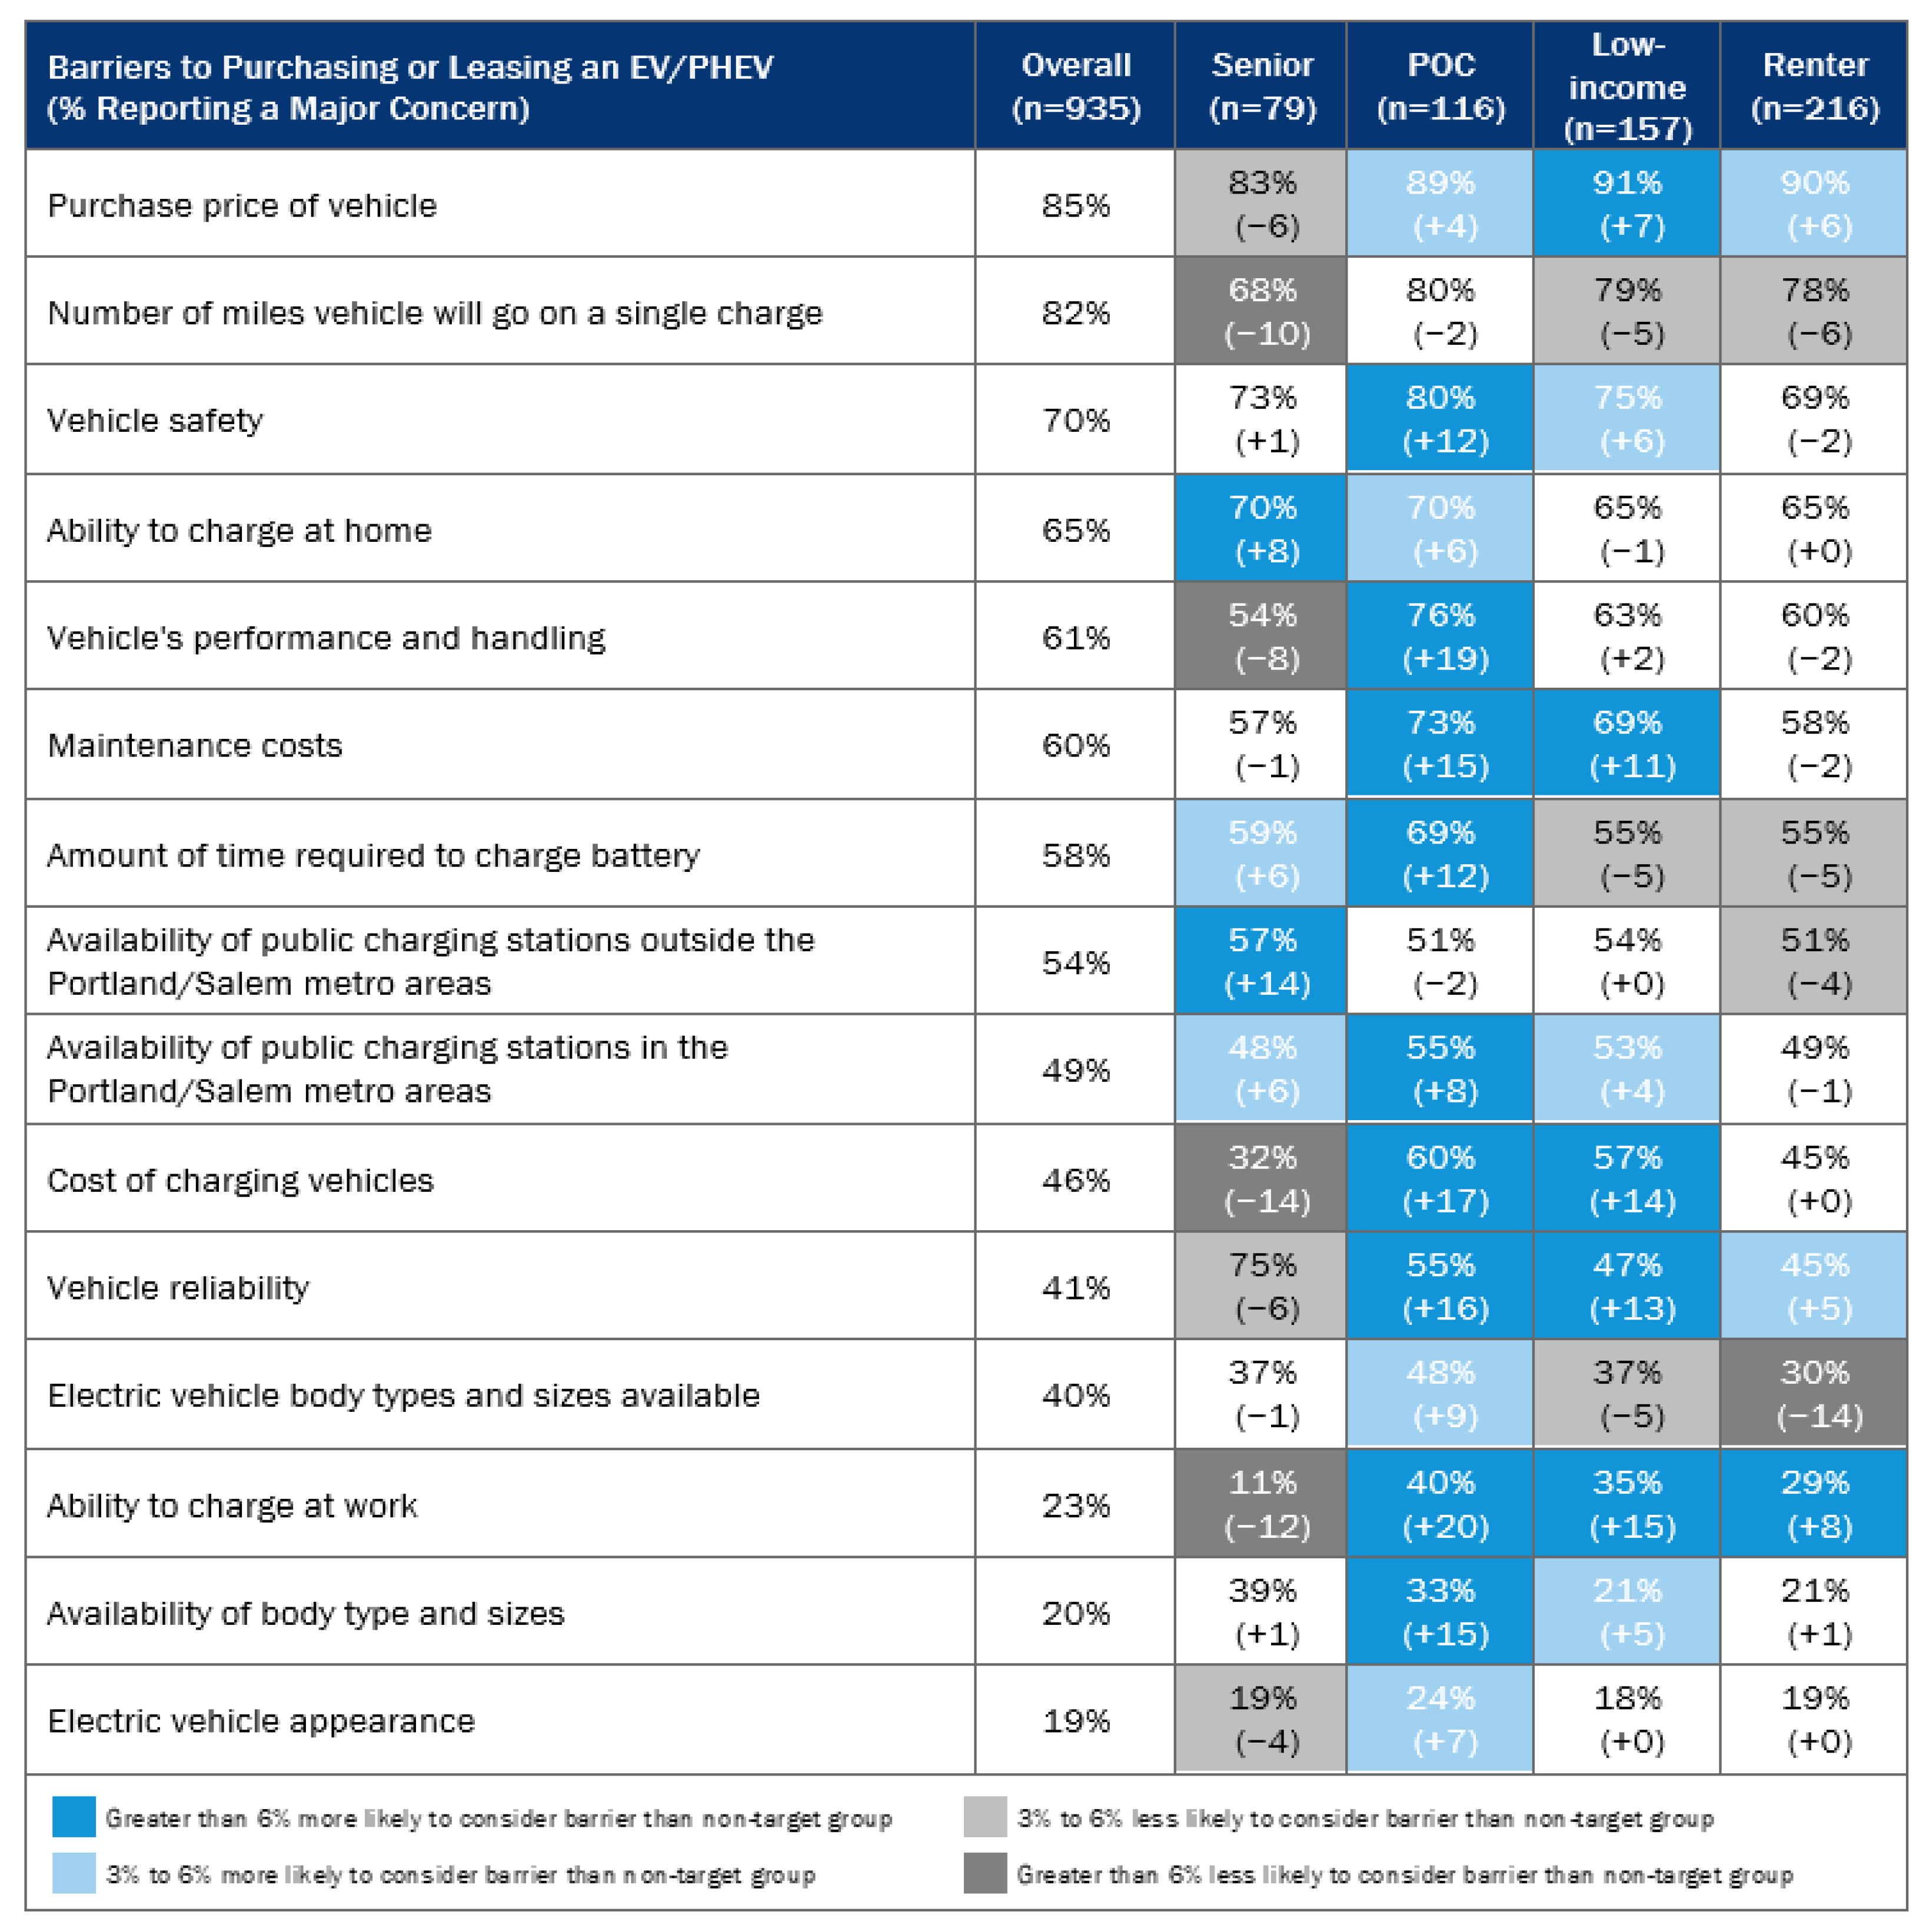
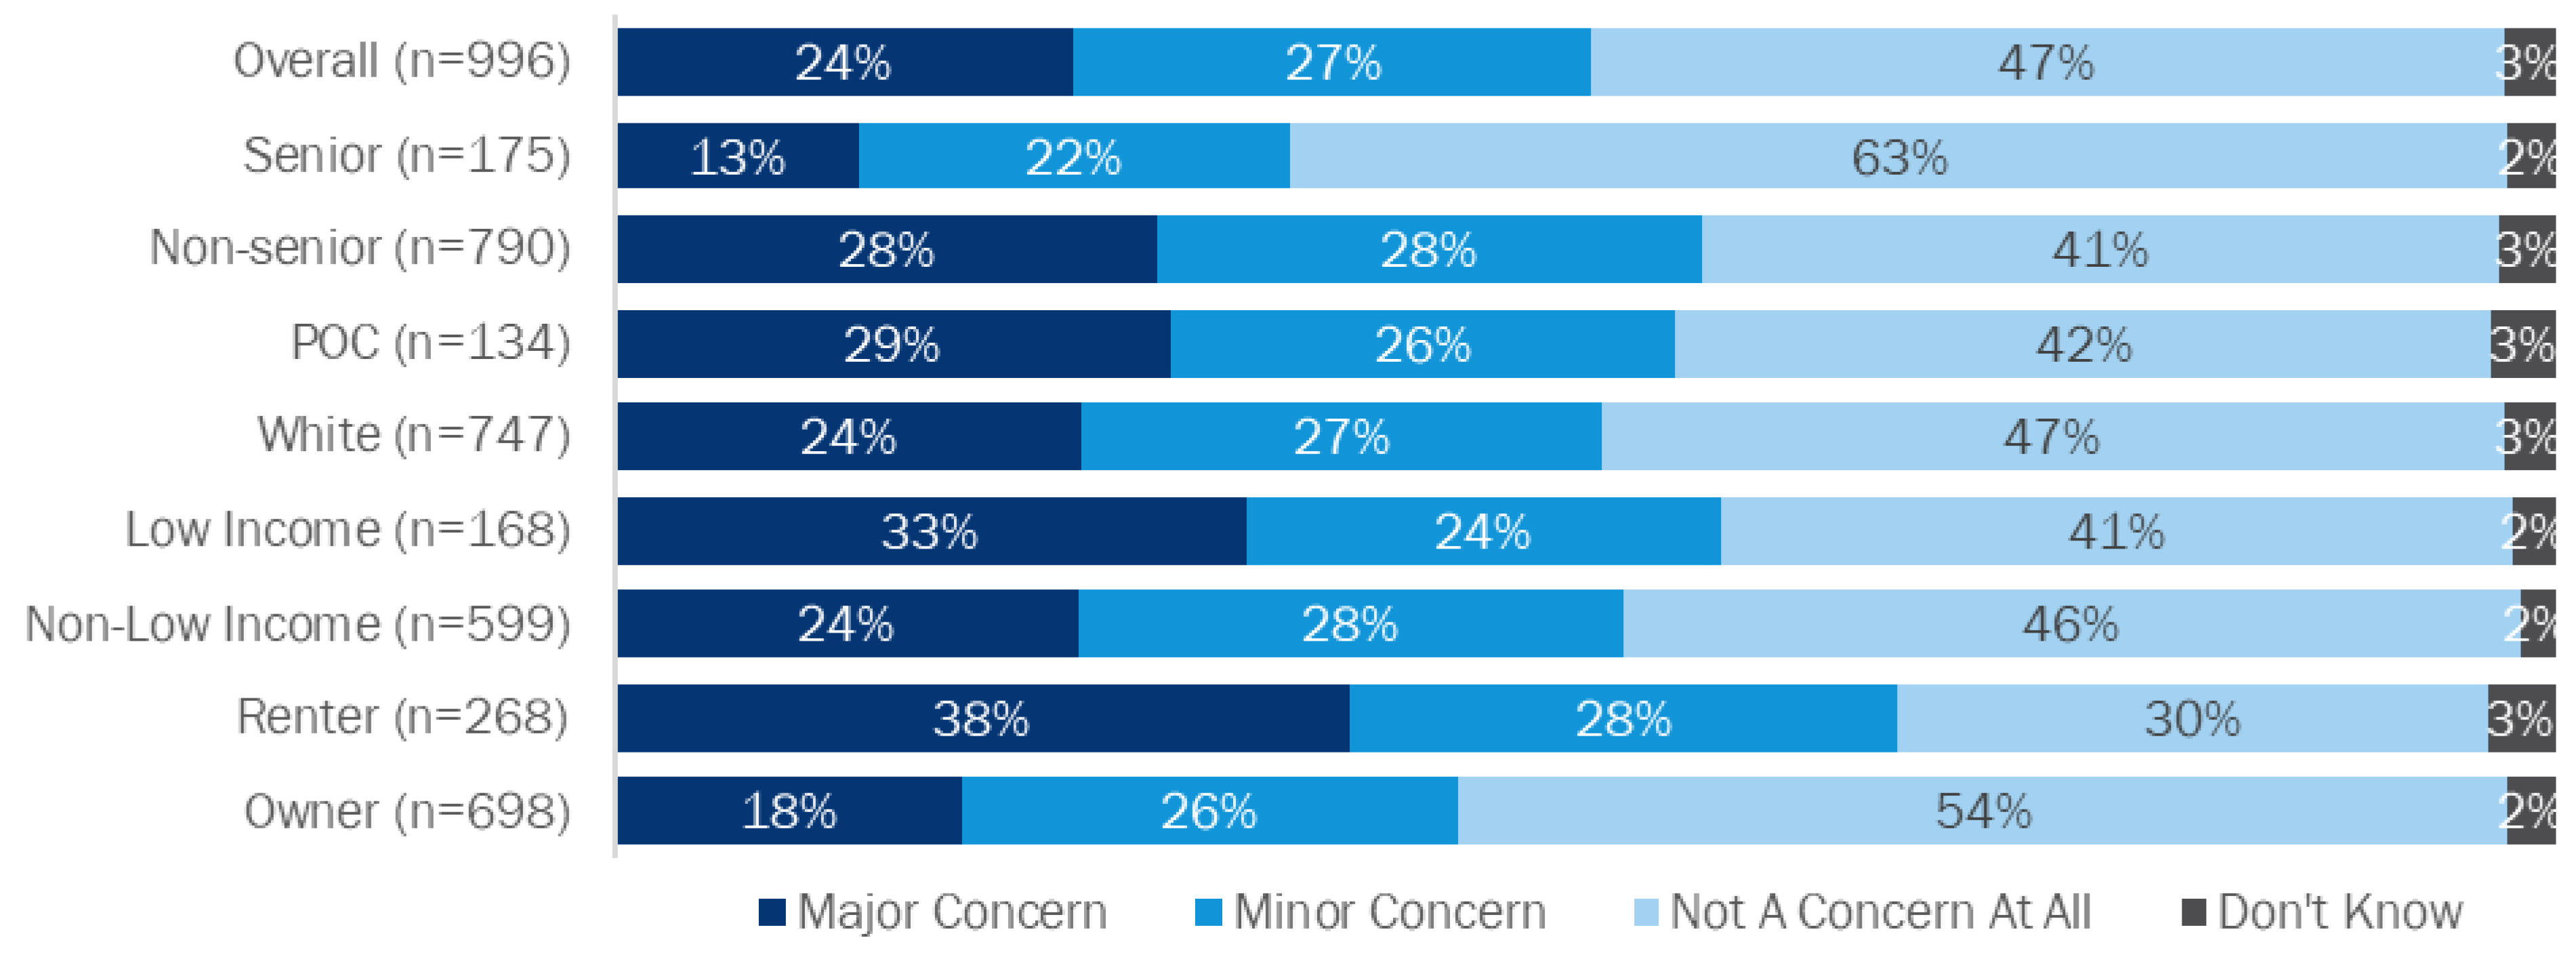
The authors also explored how barriers to purchasing or leasing an EV varied by survey respondents who identified as low-income, persons of color (POC) (POC included respondents who indicated they were Hispanic/Latino (42% of the POC group), Black or African American (9%), Asian (Japanese, Korean, Pacific Islander, etc.) (40%), or American Indian/Native American (8%)), and renters. These groups were found to be more likely to categorize certain characteristics of EVs as “major concerns”, indicating that these groups face some unique barriers to adoption (
Figure 6). EV considerers and intenders who identified as low-income, POC, and renters were more likely to indicate the purchase price of the vehicle, vehicle reliability, and ability to charge at work as major concerns when thinking about whether to purchase or lease an EV. POC and low-income respondents also showed greater levels of concern about the cost of charging EVs and vehicle maintenance costs. These results suggest that renters, those with low-income, and those who identify as POC know less about the advantages of owning an EV. Additionally, respondents who identified as POC exhibited higher levels of concern about several aspects of EV technology including the vehicle’s performance and handling, safety, the amount of time required to charge the battery, availability of body types and sizes, and appearance. These groups would benefit from targeted information or communication to increase understanding of the technology and the benefits associated with owning or leasing an EV, in addition to support connected to sources of financing and funding for EVs.
Renters, POC, and low-income respondents were all more likely to say that their current parking situation is a major concern for their decision on whether to purchase an EV in the future (
Figure 7). One possible explanation for the differential levels of concern among these communities is that renters, low-income respondents, and POC were all less likely to say they have an electric service outlet available where they park their car at work and at home. Furthermore, renters commonly live in multifamily properties that often lack dedicated parking spaces and can face higher costs and split incentives between the renter and owner for building out charging infrastructure [
21].
3.3.5. Charging and EV Information Awareness
Home charging is the most important consideration to respondents, and its availability may factor into decisions to purchase or lease an EV. Overall, about three-quarters (73%) of survey respondents indicated that having charging available at home is most important to them. Respondents in the intender segment were significantly more likely to report home charging being most important to them than other segments (87%, compared to 67% of non-considerers and 73% of considerers). When asked if respondents had access to an electrical service outlet where they park their vehicle, about two-fifths (39%) reported having one, with intenders being most likely to report having one (47%, compared to 35% of non-considerers and 40% of considerers).
Fewer than one-fifth (14%) of respondents indicated that public charging is the most important location to have charging available. However, a large majority (87%) reported having noticed public charging locations in Oregon. Among those respondents who reported noticing public charging locations, about two-fifths (40%) reported they noticed signs or other information at these stations—a similar proportion was seen in the Baseline survey (35%). About two-thirds of respondents who reported seeing signage could not identify the company who owned the charging equipment, a significant increase from the Baseline survey (65%, up from 56%). Tesla and PGE were the two companies most mentioned by respondents (7% and 5% of respondents who reported seeing signage, respectively).
Survey respondents report having received information about EVs from a variety of sources, with their electric utility being an important source of information (
Figure 8). About half (48%) of respondents reported primarily receiving information about EVs from friends and colleagues, unchanged since the Baseline survey. About one-quarter (23%) of respondents reported receiving information about EVs from PGE, down from 32% in the Baseline survey. When asked which source of information respondents find most useful, PGE was ranked fifth (9%) among all sources of information, with friends and colleagues (33%), general internet searching (29%), automobile reviews (24%), and automobile manufacturers (13%) rounding out the top five most useful information sources.
3.4. Electric Avenue Charger Utilization and User Group Analysis
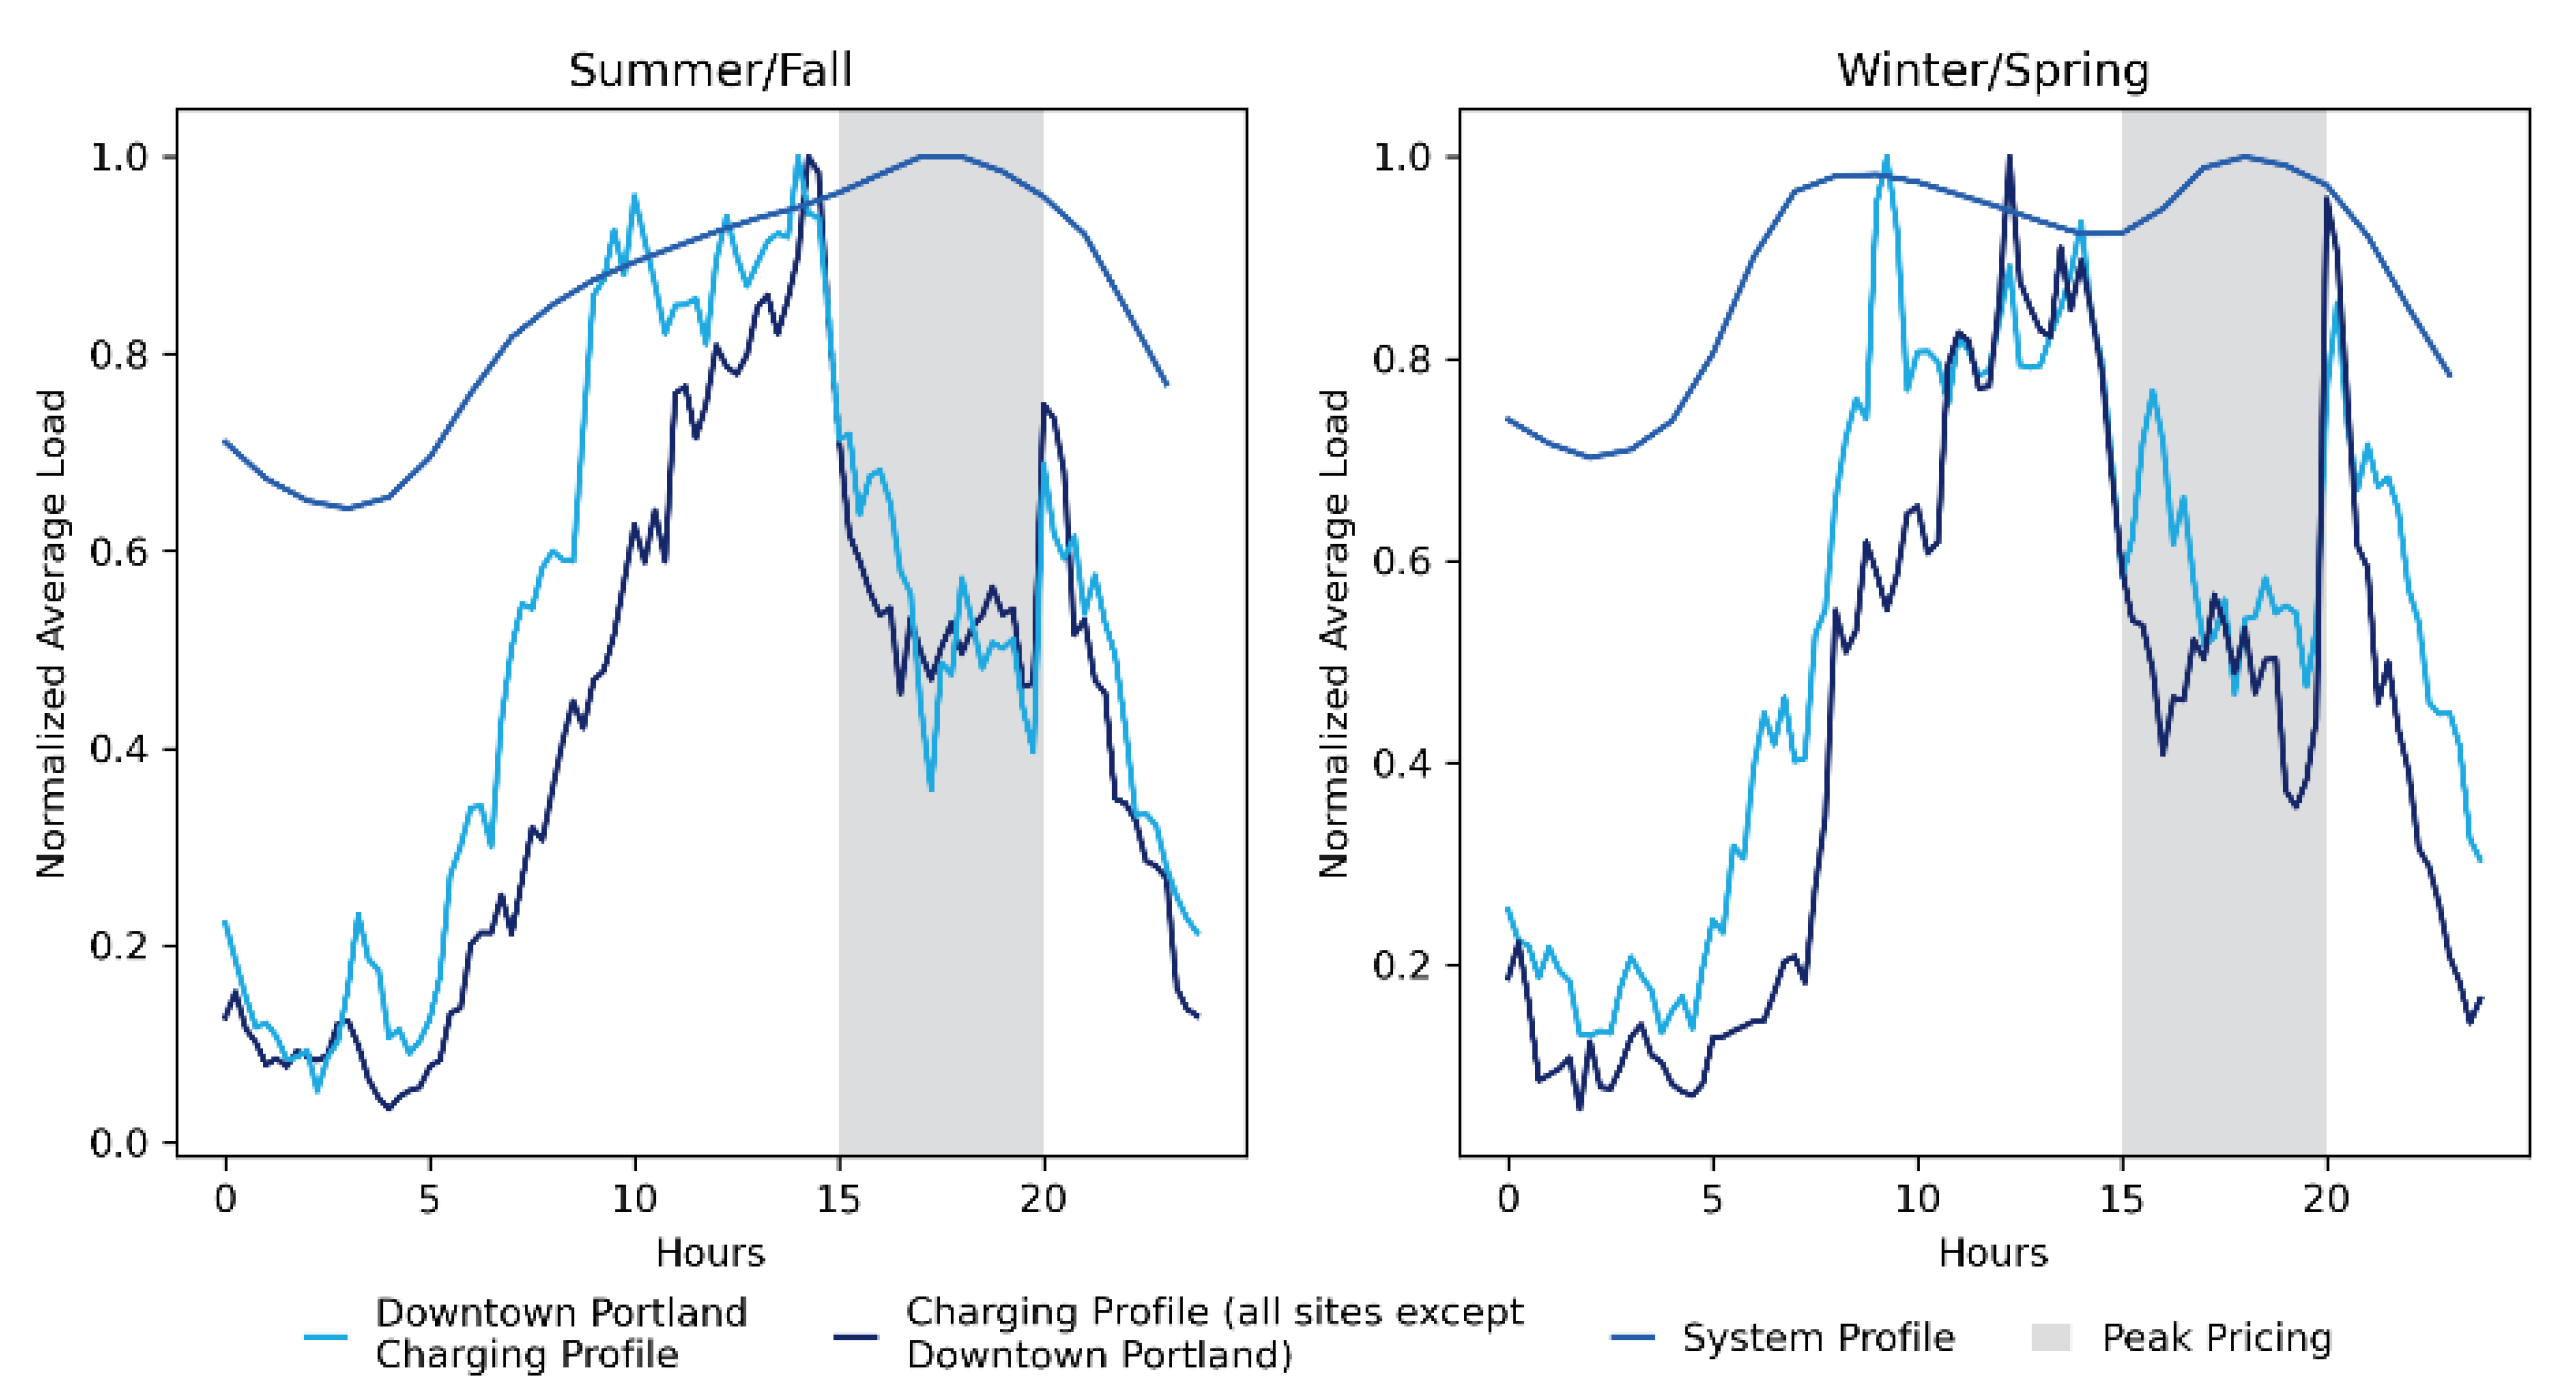
Analysis of PGE’s Electric Avenue charger utilization data shows that the peak pricing surcharge between 3:00 p.m. and 8:00 p.m. is effective in shifting charging away from system peak load periods. The normalized average system load in the summer peaks around 6:00 p.m.–7:00 p.m. when EV charging load is lowest during the peak pricing window (
Figure 9). In the winter, neither the morning nor evening system peak occurs when charging load is peaking. The authors estimate a shift of 14.2 MWh (2% of charging load during the peak pricing surcharge period) during the study period, or 39.1 kWh/day (3% of daily charging load) resulting from the peak pricing surcharge.
As discussed in the Materials and Methods section, the authors categorized PGE Electric Avenue users into three groups (TNC subscribers, monthly subscribers, and non-subscribers) and investigated the differences in usage patterns between these groups. The authors found TNC subscribers consume 1.5 times more energy each month than monthly subscribers, and 2.9 times more than non-subscribers. While TNC subscribers make up the smallest share of users, they have the highest per customer energy consumption in most months. This is expected as rideshare vehicles travel more miles than personal vehicles (According to a publicly released dataset, full-time TNC vehicles are driven an average distance of 29,000 miles per year compared to 11,488 miles per year for personally owned vehicles [
22]). The largest share of users in each month are non-subscribers, but they consume much less energy per customer compared to the subscriber groups (
Figure 10). This finding is consistent with the idea that customers who consume more energy per month have greater motivation to enroll in a subscription program or that customers with a monthly subscription plan are more likely to go to the same charging network to fully utilize the subscription. During the initial period of the COVID-19 pandemic (March to May 2020), TNC subscribers experienced the greatest decrease in energy consumption and non-subscriber users experienced the most significant drop in the number of users.
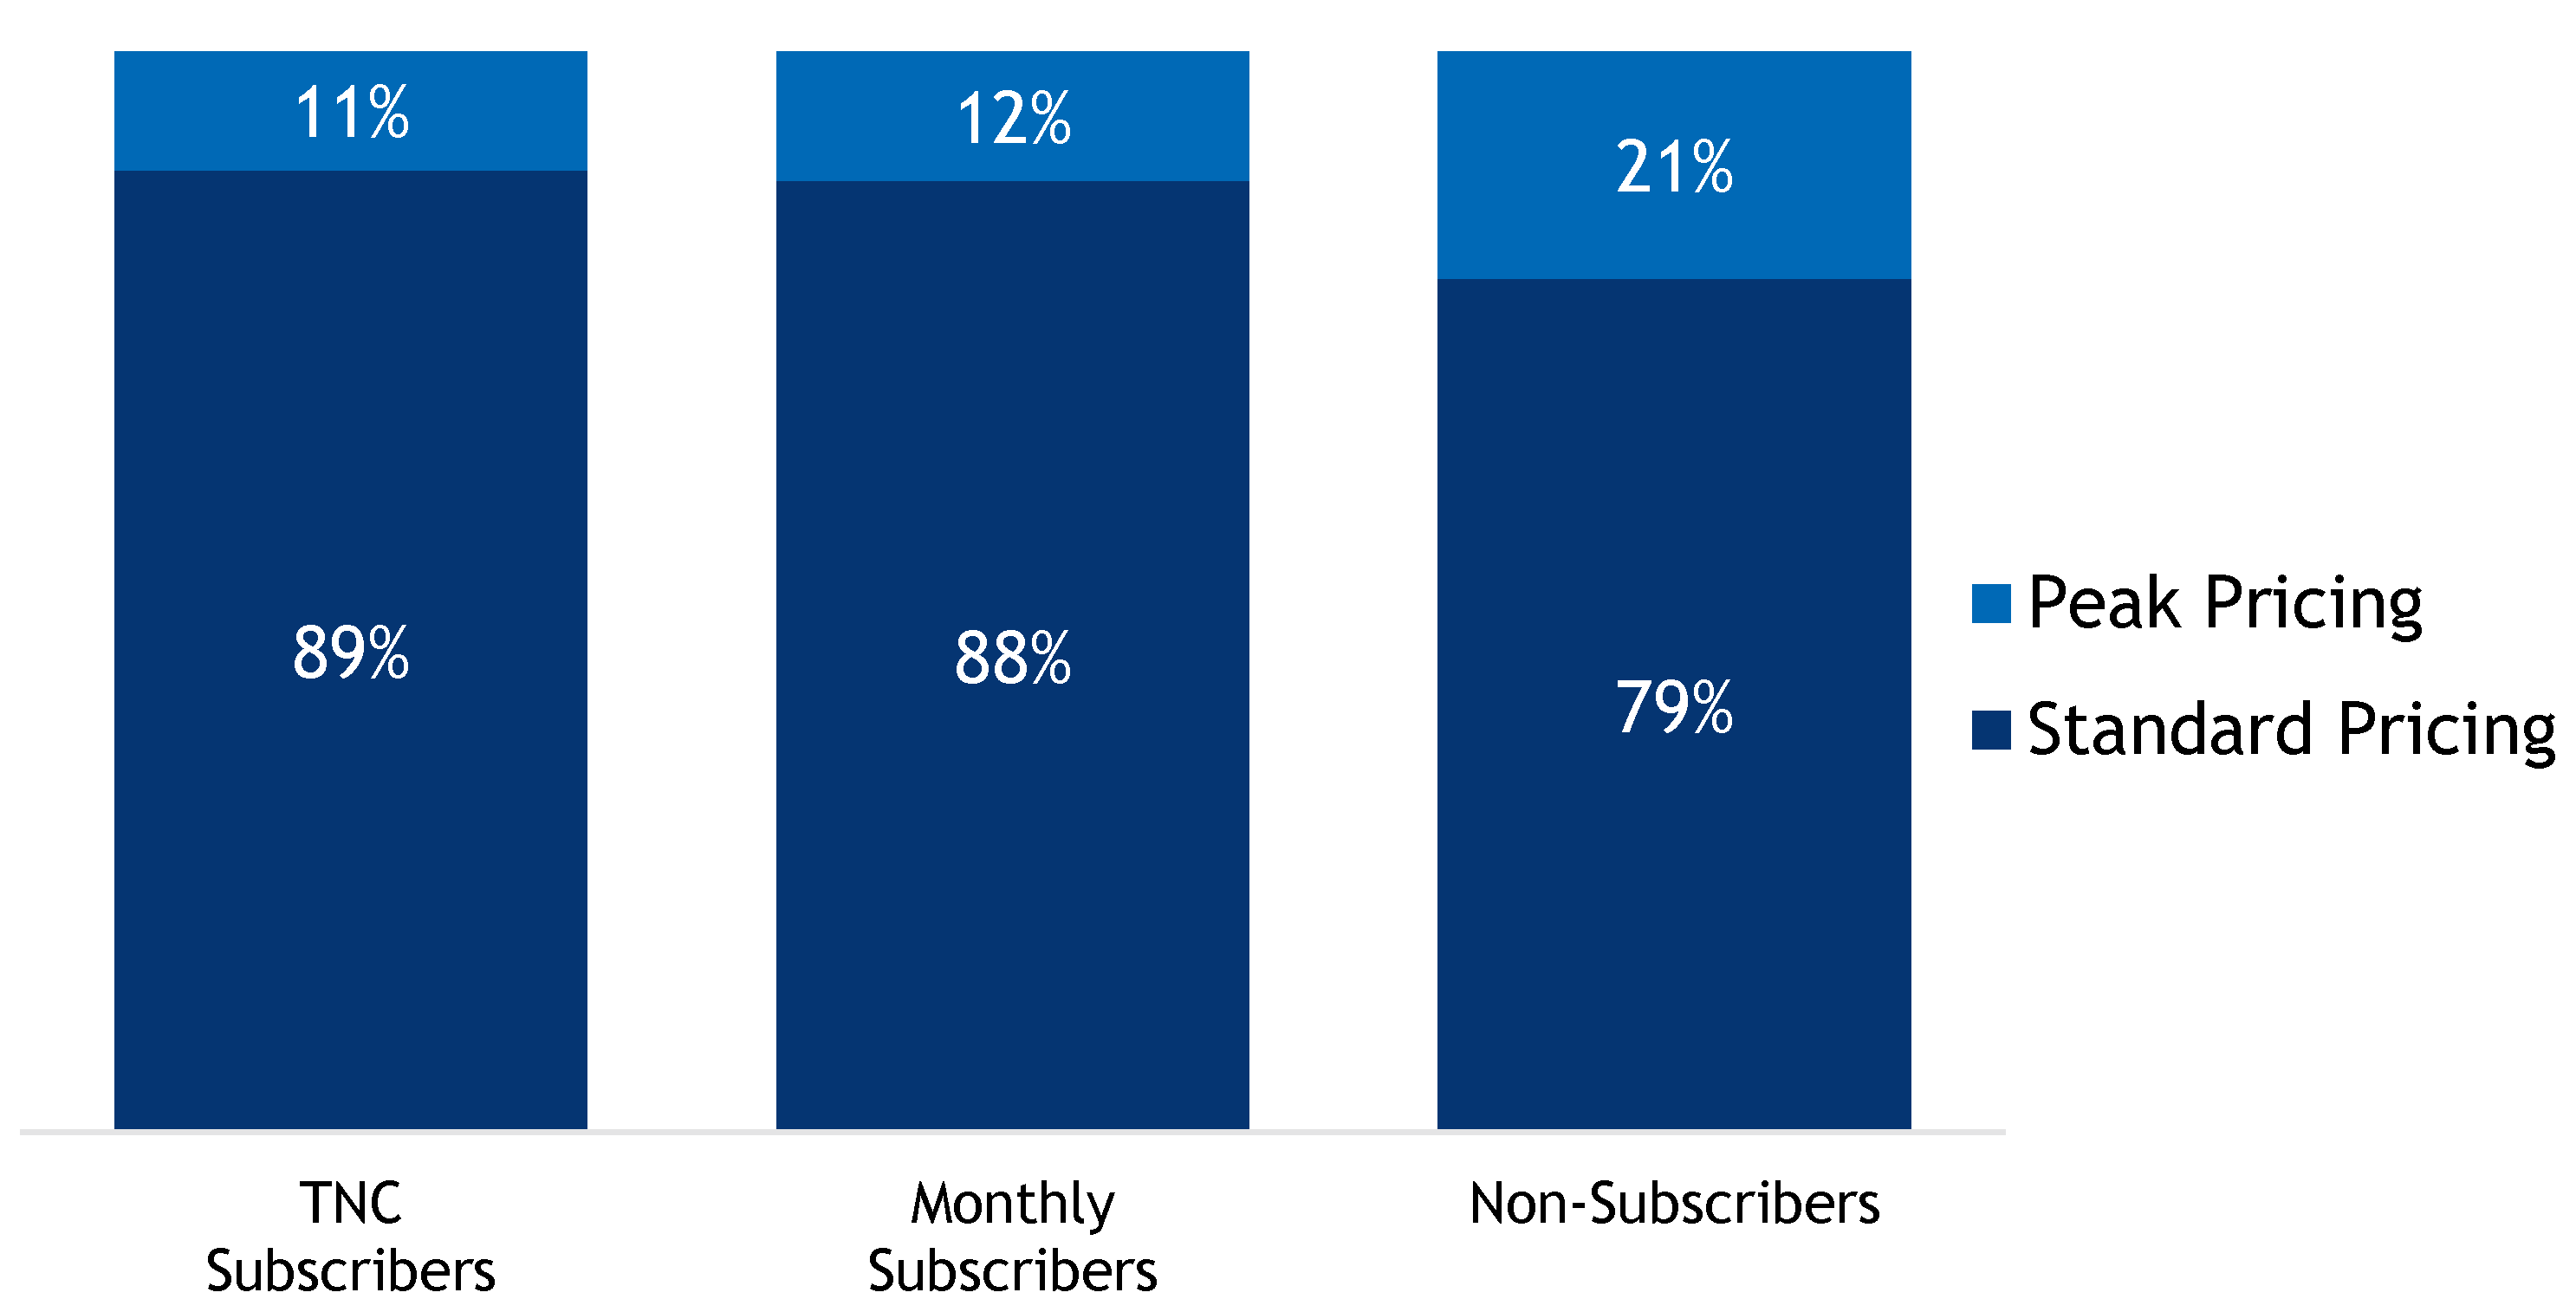
Charging behavior of users on subscription plans differs from non-subscription users. Non-subscriber users conduct about 21% of their charging during the peak pricing period while subscribers conduct 10–13% of their charging during the peak pricing period (
Figure 11). The greater share of on peak charging among non-subscriber users as compared to subscription drivers indicates that the peak period surcharge might be most effective in changing charging behavior if the driver is already on a subscription plan. (The authors will conduct Electric Avenue intercept surveys in the future that will explore differences between subscriber and non-subscriber users.)
4. Discussion
Increasing consumer adoption of EVs in the US will require a coordinated effort, one in which electric utilities can play an important role. The findings presented in this article show that utility programs, such as what has been implemented by PGE, can be effective at increasing awareness of EVs for the general population as well as more targeted groups such as TNC drivers. The research on environmental justice communities highlights opportunities for utilities to address misconceptions and increase awareness of the benefits of EVs for these groups. Further, these pilots have also provided reliable access to charging that is responsive to utility grid needs.
As most consumers lack firsthand experience with EVs, utility-sponsored ride-and-drive events can provide consumers with a low-pressure test-driving experience, which has been shown to increase the likelihood of purchasing an EV. Further, increased adoption of EVs among TNC drivers not only decreases the cost burden on drivers who are often from environmental justice communities, but also provides riders with the experience of being in an EV.
Since PGE’s first pilot was implemented in late 2018, the number of EV models with a range of greater than 200 miles has increased steadily, with most new models coming on to the market exceeding 200 miles [
23]. The research presented in this article corresponds to this trend, indicating that battery range is becoming less of a concern to consumers. Vehicle cost continues to be a primary barrier to adoption, however, especially for those identifying as POC, low-income, seniors, and TNC drivers. While vehicle purchasing incentives will likely continue to be useful in the short term, long-term market trends may reduce this barrier similar to what has been seen with vehicle range. Vehicle costs will likely fall following the trend in the reduction in battery costs, which have gone from USD 1100/kWh in 2010 to USD 137/kWh in 2020 with a target of reaching cost parity with gasoline when battery prices reach USD 100/kWh [
24]. In the short term, however, financial assistance targeted to high-usage TNC drivers (including vehicle incentives, rental subsidies, and partnerships with financial institutions to provide low-interest loans) to reduce the barriers to purchasing an EV would likely be impactful. Utilities can also work with TNCs to offer subscription-based charging to rideshare drivers, which provides drivers with access to reliable charging infrastructure and stable fuel costs to encourage EV adoption among TNC drivers.
The authors’ analysis of survey data uncovered trends among low-income customers, renters, and POC in their perceptions of EVs and barriers to adoption, suggesting that these groups have misconceptions of owning an EV and face some unique barriers to adoption, especially when it comes to charging access. Utilities could consider providing messaging targeted at these communities focused on the potentially lower cost of fuel compared to gasoline (depending on utility location) and the lower maintenance costs associated with EVs (estimated to be about 50% lower) [
25]. One possible way to accomplish this is through partnerships with community-based organizations (CBOs) and non-profits that support these communities to develop targeted education campaigns focused on the features of EVs that are part of a typical car-buying decision to help ease concerns about the technology (PGE has established a grant fund called the Drive Change Fund that is aimed to support CBOs, non-profits, and other organizations in EV education and outreach, EV purchasing, and charger installations). These communities would also likely benefit from access to programs that allow them to share in the benefits of transportation electrification without investing in a vehicle, including ridesharing, electrified public transportation, and other e-mobility (e.g., electric scooters and electric bicycles).
Electric utilities are also in a unique position to increase access to fast and reliable public charging infrastructure. Although customer survey findings show home charging is where most consumers would likely charge, there is a significant and growing proportion of consumers in urban areas who are unable to charge at home because they live in homes without a driveway or live in multifamily buildings where installing a charging station is more difficult. According to the 2019 American Housing Survey, one-third (33%) of housing units in the US do not have vehicle parking [
26]. Utility-provided or sponsored charging locations provide an affordable and reliable public charging option to those who are unable to charge at home or work. In addition, results from this research indicate that consumer recognition of the electric utility is generally high and having utility-branded charging infrastructure draws customer attention to where charging is located. The increased visibility of charging can help decrease the perception that public charging availability is limited.
While there is concern about the increased electricity demand associated with charging EVs, this research suggests pricing mechanisms can be effective at managing EV load at public charging stations. Analysis of PGE’s Electric Avenue charger utilization shows pricing structures can be designed to curtail electricity use during peak demand periods. Subscription users were particularly responsive to the increased price signal with the lowest percentage of usage during the peak period compared to non-subscription users. The analysis also indicates that TNC drivers, while fewer in number, use significantly more energy than the other groups compared (1.5 times more than monthly subscribers and 2.9 times more than non-subscribers). Further, results from the TNC focus groups indicate that there was a perceived fuel cost saving when accessing subscription-based pricing models, which was an important component to lowering EV adoption barriers for this group. These findings suggest that utilities can leverage pricing models to reduce demand during critical peak periods while also encouraging high-usage customers who will increase overall utilization of public charging infrastructure.
Taken together, the findings in this article illustrate how electric utilities can play an important role in encouraging EV adoption. Since 2018, there has been considerable change in consumer consideration and intention to purchase an EV in PGE’s service territory. The ongoing pilot and evaluation activities are providing an opportunity for PGE to test and learn how best to serve their customers as transportation electrification accelerates. These lessons learned will be useful for other utilities and regulators and, at the close of the five-year pilot period, should provide important conclusions on the most effective solutions.

