Article

Flexible Charging of Electric Vehicles: Results of a Large-Scale Smart Charging Demonstration

1
Center of Expertise Urban Technology, Faculty of Technology, Amsterdam University of Applied Sciences, 1097 DZ Amsterdam, The Netherlands
2
Alliander, 6812 AH Arnhem, The Netherlands
3
ElaadNL, 6812 AR Arnhem, The Netherlands
*
Author to whom correspondence should be addressed.
World Electr. Veh. J. 2021, 12(2), 82; https://doi.org/10.3390/wevj12020082
Submission received: 16 April 2021 / Revised: 21 May 2021 / Accepted: 22 May 2021 / Published: 29 May 2021

Abstract

:
Flexible charging can be applied to avoid peak loads on the electricity grid by curbing demand of electric vehicle chargers as well as matching charging power with availability of sustainable energy. This paper presents results of a large-scale demonstration project “Flexpower” where time-dependent charging profiles are applied to 432 public charging stations in the city of Amsterdam between November 2019 and March 2020. The charging current on Flexpower stations is reduced during household peak consumption hours (18:00–21:00), increased during the night-time, and dynamically linked to solar intensity levels during the day. The results show that the EV contribution to the grid peak load can be reduced by 1.2 kW per charging station with very limited user impact. The increased charging current during sunny conditions does not lead to a significantly higher energy transfer during the day because of lack of demand and technical limitations in the vehicles. A simulation model is presented based on empirical power measurements over a wide range of conditions combining the flexibility provided by simulations with the power of real-world data. The model was validated by comparing aggregated results to actual measurements and was used to evaluate the impact of different smart charging profiles in the Amsterdam context.

1. Introduction

Electric vehicles (EVs) are no longer only a niche market and will increasingly define passenger mobility with a market growth of over 30% for the last five years and an accumulated amount of 5 million EVs on the roads in 2019 [1]. The electrification of transport and the need for more and faster charging is expected to add a considerable load on the electricity infrastructure in the near future [2]. Because the timing of the peak in demand of EV charging coincides largely with the peak in household consumption, the total peak load will increase directly with the addition of more EVs and the limits of the grid capacity may be reached [3,4,5]. As such, electric mobility provides a substantial challenge to grid operators to provide sufficient capacity while maintain grid stability and security without having to carry out expensive and disruptive grid reinforcements. The city of Amsterdam has set the ambitious target of achieving local zero emission transport by 2030 for all transport modalities (including buses, city logistics, taxis, shared vehicles, and private vehicles). The required expansion of charging stations will increase the load on the local electricity grid. Smart charging of EVs offers opportunities for better managing and incorporating this additional electricity demand within the boundaries of the existing grid.
Smart charging research in recent years has mainly been focused on simulation and modeling to investigate the impact on the grid [5,6,7], energy market prices [8,9] and matching of renewable energy profiles [10]. The results show that smart charging can give significant advantages in reducing grid load during peak moments but the extent to which depends on the specific details of the profiles and assumptions used in the models [7,9,11]. The simulation work is valuable for exploring the feasibility and optimizing the impact of various smart charging strategies, but often, the suggested architectures are based on complicated communication schemes between vehicles and a centralized management system and are not suitable for short-term implementation [3]. Moreover, simulation studies include many assumptions on charging behavior based on start time distributions, charge volume distributions, average power level of charging equipment and the potential of rescheduling charging sessions [12,13,14,15] but lack real-world data on actual charging power and will underestimate several practical effects such as differences in the charging characteristics of different EV models, state of charge (SOC) and battery degradation effects, local circumstances such as the number of sockets per station or the maximum current level of the internal safety fuses, and other effects. As a result, the results may deviate significantly from real-world implementations. Empirical cases are needed to validate simulated results and fine-tune assumptions before applying the insights in practice.
There are several pilot studies where smart charging has been applied in practice [9,16,17]. These studies confirm the potential of smart charging to suppress peaks in grid load, but the number of empirical studies is still limited, and these tend to have only few chargers in a well-controlled environment [18,19,20]. In the period of January to August 2018, a medium scale pilot called ‘Flexpower 1’ was conducted in order to perform a quantitative analysis of how the various stakeholders are affected by smart charging in the complicated setting of the public charging network in Amsterdam [21]. A static smart charging profile was deployed on 39 public charging stations in Amsterdam, providing a lower charging current limit during peak consumption hours (07:00–08:30 and 17:00–20:00) and a higher current limit during the rest of the day. The impact on users was assessed by studying to what extent average charging powers and volumes were increased or reduced as result of the Flexpower profile. The results of this project were promising in terms of limited impact on EV drivers and positive impact on the grid.
The current paper describes the project ‘Flexpower 2’, which ran between November 2019 and March 2020 as a follow up to ‘Flexpower 1’, increasing the number of charging stations from 39 to 432 and providing a dynamic charging profile that changes on a daily basis based on the forecasted solar irradiation level. The aim of this follow-up study was to quantitatively evaluate the effect of smart charging on (i) the match of sustainable energy generation and charging profiles, (ii) impact on the grid, and (iii) impact on EV users. The large volume of data on charging transactions also allowed us to build a simulation model based on empirical power measurements over a wide range of conditions, combining the flexibility provided by simulations with the power of real-world data. The experiment was terminated prematurely because of the lockdown following the outbreak of the Corona virus in The Netherlands. The restrictions caused such a large change in vehicle movements that the data were no longer useful for this analysis. The fact that the data were collected primarily in the winter will cause seasonal effects to be obscured, but the seasonal comparison in [22] shows that these effects are expected to be small.

2. Materials and Methods

During the ‘Flexpower 2’ study, data were collected on about 10,000 users responsible for approximately 100,000 unique charging transactions on 432 public charging stations. The dataset contains transactions of battery electric vehicles (BEVs; all-electric vehicle) as well as plug-in hybrid electric vehicles (PHEVs; cars with dual fuel systems) since these share the same public charging infrastructure. The general public was informed of the project via stickers on the charging stations and a news campaign. However, no attractive or repulsive effect of Flexpower stations can be found in the data; users have not changed their charging behavior.
This study is a follow up to the project ‘Flexpower 1’, and a detailed description of the experimental design, data sources, and methods of analysis is presented in the corresponding research paper [21]. The costs associated with upgrading a grid connection are about EUR 700/year and were sponsored by the city of Amsterdam. The smart charging profile that was applied in the ‘Flexpower 2’ follow up study was changed on two main aspects compared to the preceding study: (i) the current limitations in the morning were lifted and were shifted from 17:00–20:00 to 18:00–21:00 in the evening to better counteract the household load on the grid, (ii) the current limit during the day was linked to the weather forecast in Amsterdam. When a high intensity of solar irradiation was expected, a higher current limit was applied on the charging stations than when a low solar irradiation was forecasted. The profile is plotted in Figure 1 including a reference level representing regular charging stations in Amsterdam. Rather than making the current limitation directly proportional to the local solar power production, a two-level approach was chosen to ensure transparency to the users of the charging stations and to simplify the statistical analysis of the data.
The specific type of EV is not known in the data, but a classification is inferred based on the charging behavior over multiple sessions of the same payment ID. The classification consists of the number of phases and maximum current, for example, 1 × 16 A means the vehicle can charge over one electrical phase with a maximum of 16 ampere. For each time interval in the data, the average power is computed and interpreted if possible. For example, charging at 3.7 kW is interpreted as 16 A charging on a single phase, 5.5 kW as 25 A charging on a single phase and 11 kW as 16 A charging on three phases, etc. The data records that have an average power which matches an existing technical configuration available on the market are labelled with the corresponding interpretation and this process is repeated for all combinations of conditions (single/double occupancy, Flexpower/reference stations and all current limitation levels—8 distributions in total). The records that fall outside of the known technical ranges cannot be interpreted and are not labelled. These cases are caused by unknown factors such as reduced charging power when the battery approaches a full state-of-charge.
We distinguish five main groups which are presented in Table 1 (there are also a few 3 × 32 A models on the market, these have been combined with the 3 × 25 A category). The 1 × 16 A category, which includes many PHEVs, is dominant in terms of number of vehicles and sessions but only represents 24% of the total energy demand.

3. Results and Discussion

In the following section, we present and discuss the impact the Flexpower profile has on the EV charging process. Results are presented on (i) charging power per active session, (ii) charging power per station (which represents the total grid load contribution of EV charging), (iii) positively/negatively affected sessions on Flexpower charging stations compared to the reference stations, (iv) the effect of dynamic current levels linked to solar intensity, and (v) results of a simulation using measurements of real-world transactions as input.

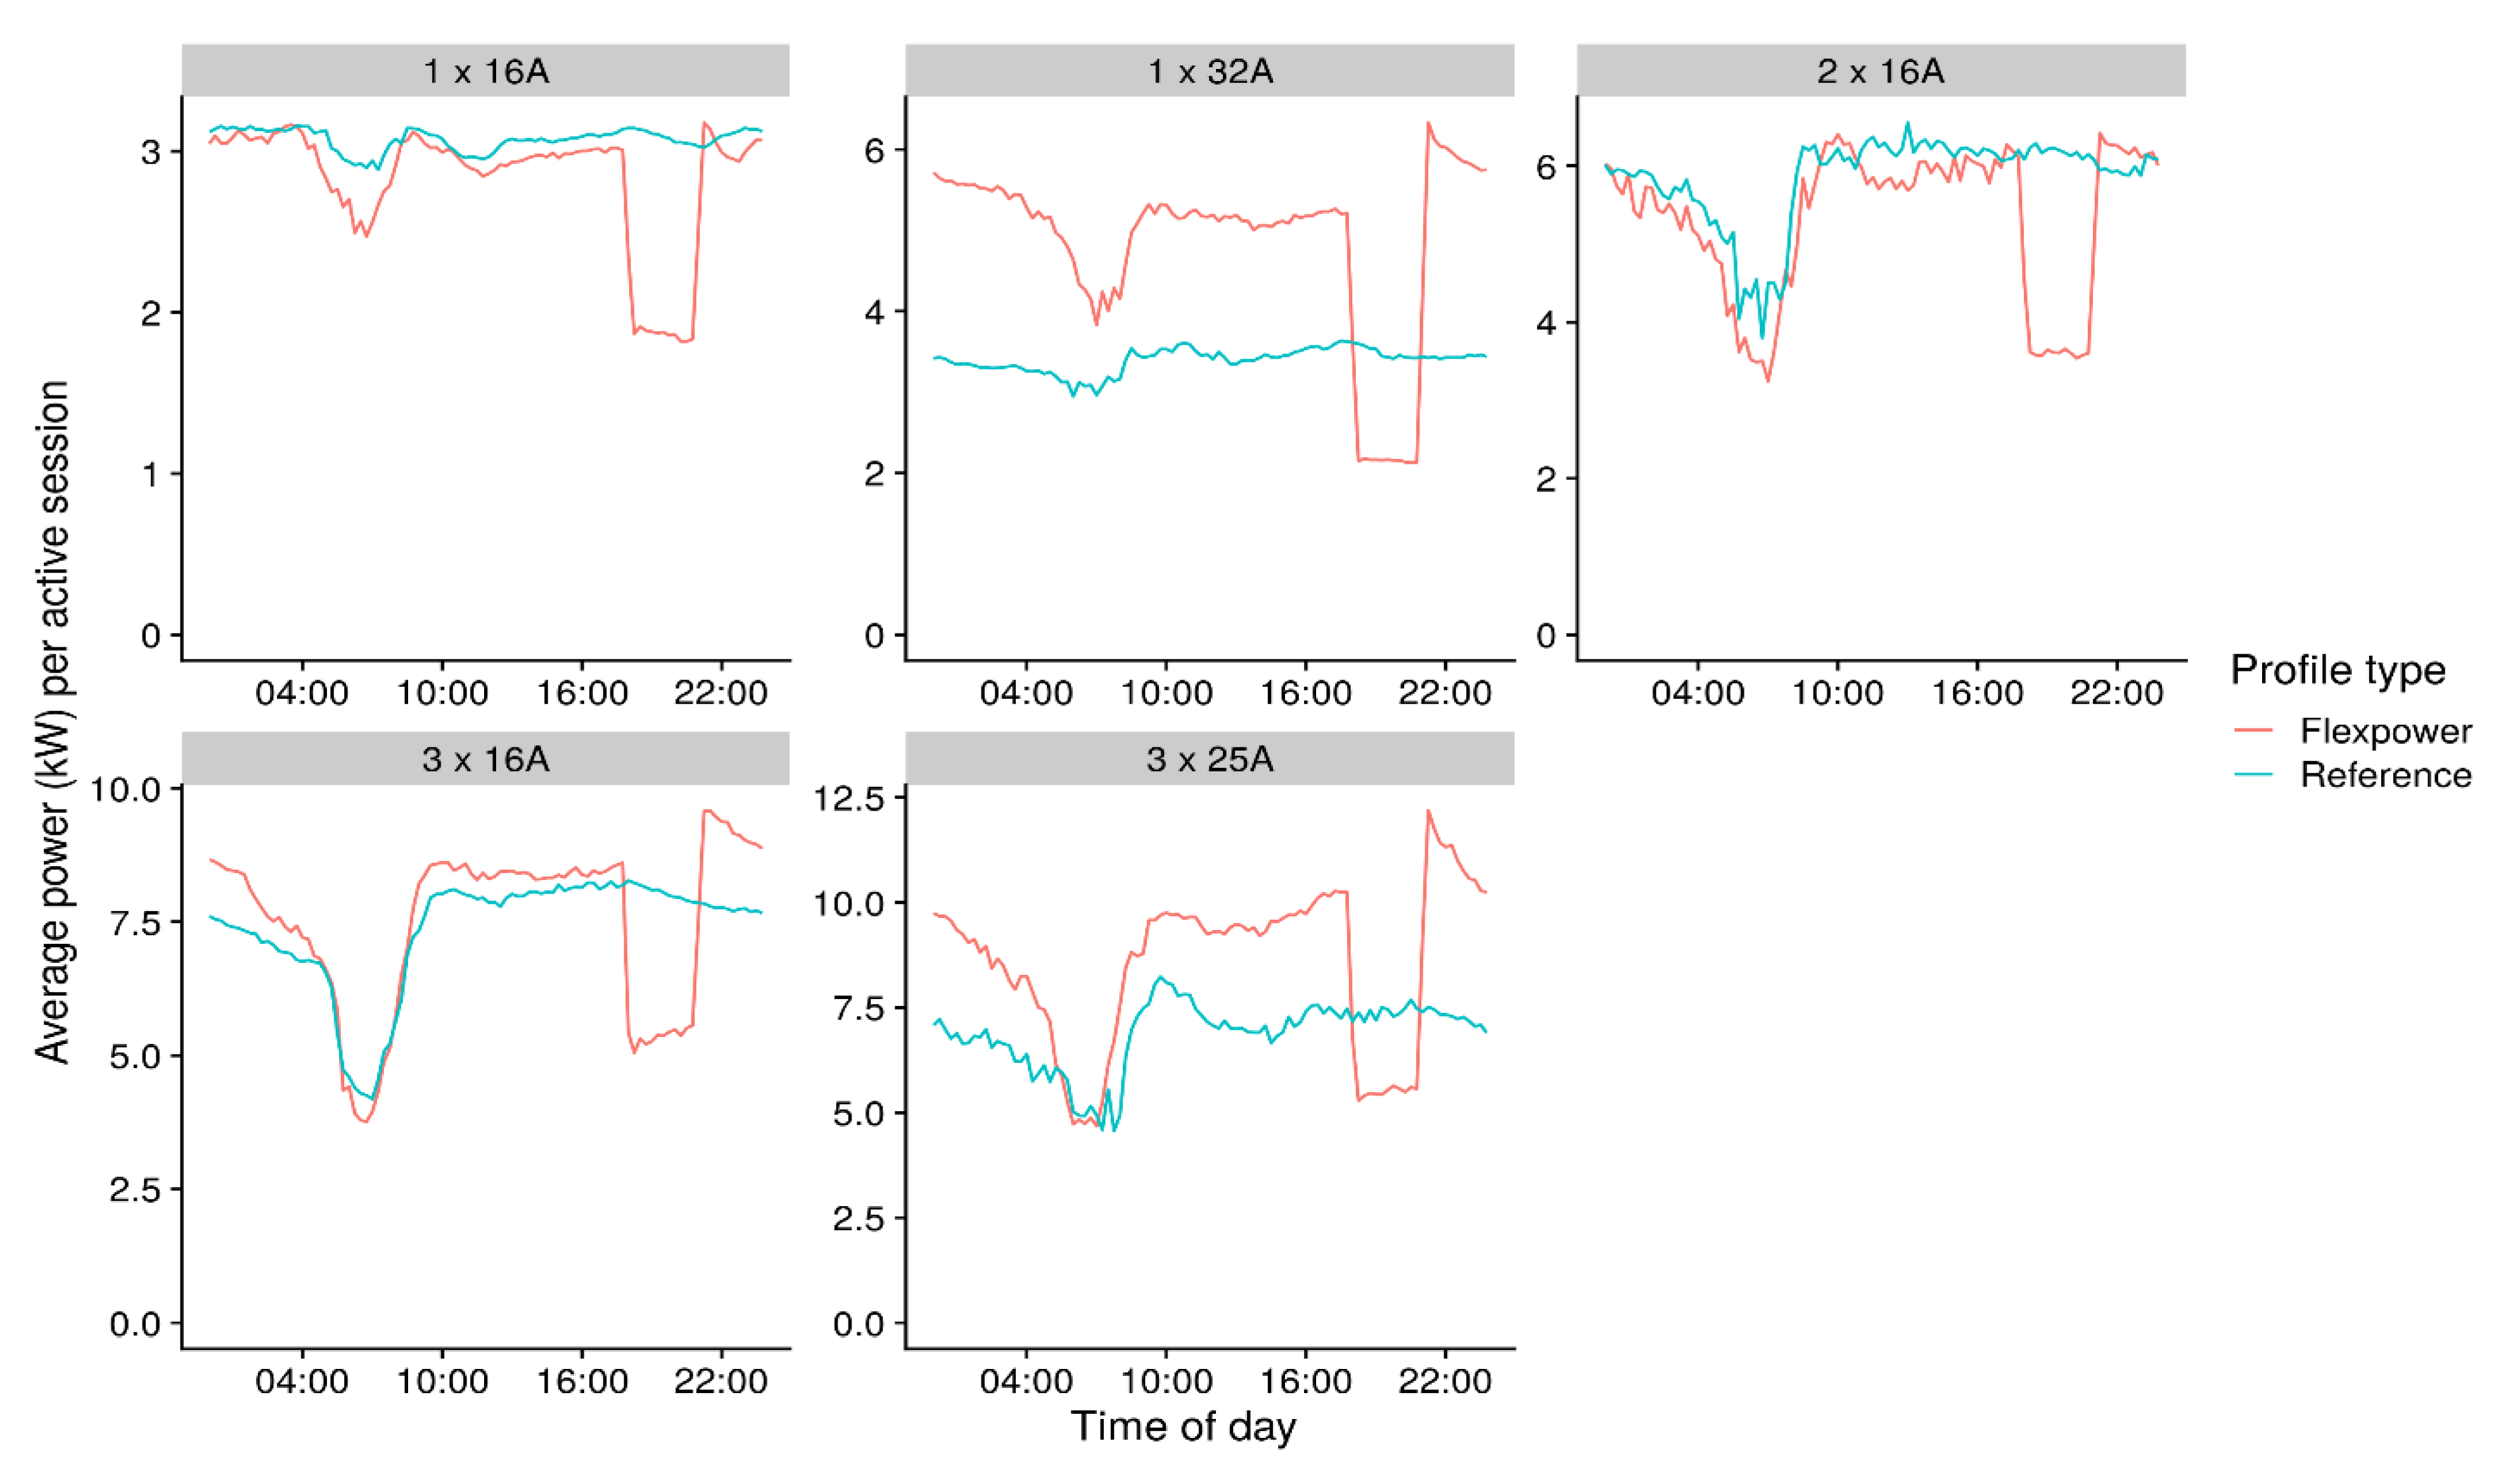
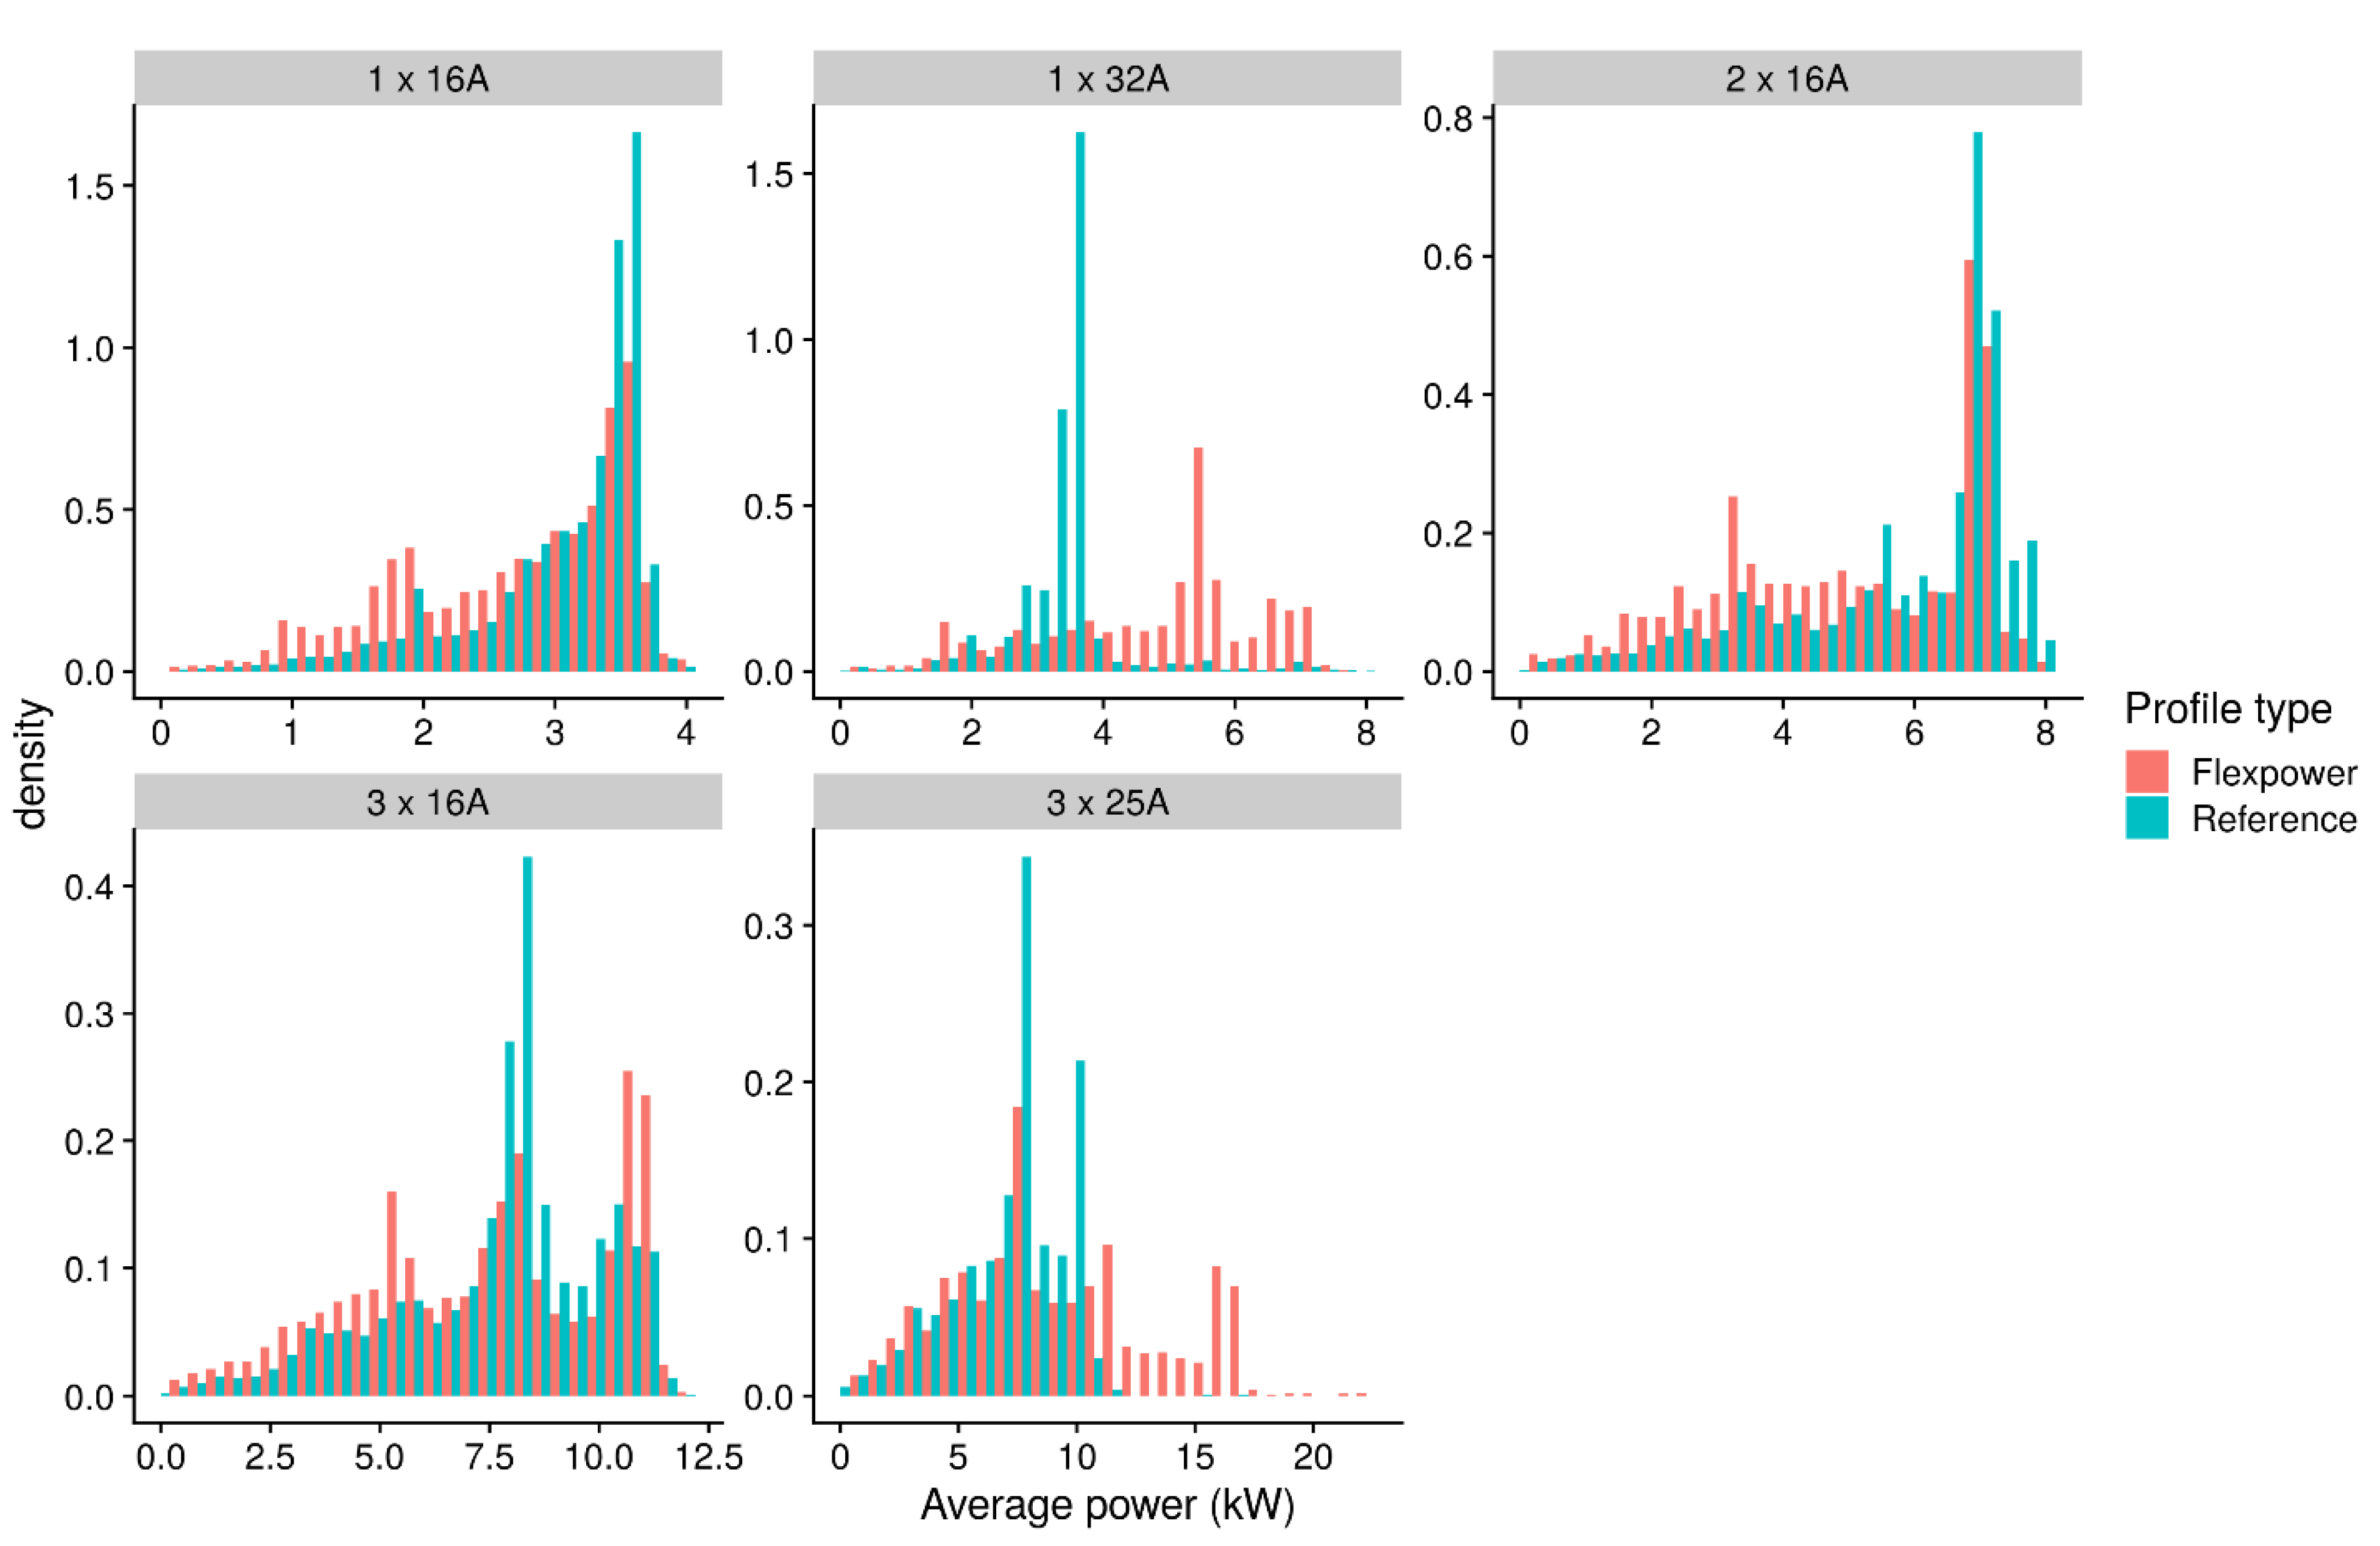
3.1. Average Charging Power Per Session

To investigate the impact on the effective charging power of the different vehicle categories, we calculate the average power on the Flexpower and reference stations as a function of time of day. Since the time-dependent profile is the same on all Flexpower stations, the results for all stations can be aggregated. The results are presented in Figure 2. The blue line is calculated from sessions on reference stations, which always have a limit of 25 A for both sockets combined and have 16 A fuses on the individual sockets. It is interesting to note that the reference stations offer the same condition all day, but nevertheless, the charging power fluctuates over time, especially for the categories charging on more than one phase, and is significantly lower than the theoretically expected value (3.7 kW for 1 × 16 A, 11 kW for 3 × 16 A). This shows that there are other factors besides the charging station characteristics that determine the effective power. The red line shows the average power on Flexpower stations that have a time-dependent current limit. All categories show a reduction of 30–50% in power during the evening hours (18:00–21:00) as a result of the lower current limit. The rest of the dynamics differ between the vehicle categories.
The 1 × 16 A and 2 × 16 A categories are internally limited to 16 A and therefore cannot profit from the increased current limit during off-peak hours. The same applies for the 3 × 16 A category, even though this category shows an increase in power late in the evening. This can be explained by the double occupancy effect. Public charging stations in Amsterdam have two sockets, but the current limit applies to the whole station. The station uses software to optimize the energy transfer to both sockets and can provide full current to both sockets if it is possible to assign dedicated phases to each of the connected vehicles. A 3 × 16 A vehicle which is connected simultaneously with another vehicle always requires at least one of the phases to be used for both sockets and the current limit is shared. On regular charging stations, there is 25 A to share, and this configuration results in charging at 12.5 A per socket. On Flexpower stations, the vehicle can continue to charge at 16 A even during double occupancy because the station-wide limit is increased to 35 A. This effect is strongest in the evening when the occupancy rate is highest. The double occupancy effect can also occur for 1 × 16 A and 2 × 16 A vehicles, but because of the high market share of single-phase vehicles, the criterium of >3 phases is not exceeded very often in these cases.
The 1 × 32 A and 3 × 25 A categories can profit from higher current levels during off-peak hours and the removal of the 16 A fuse on the sockets, which can clearly be seen in Figure 2.
The dip in power in the early morning is the result of a very low number of active charging sessions that are all approaching a full state-of-charge. The last part of the charging process is often slower due to the battery management system which reduces the average power.

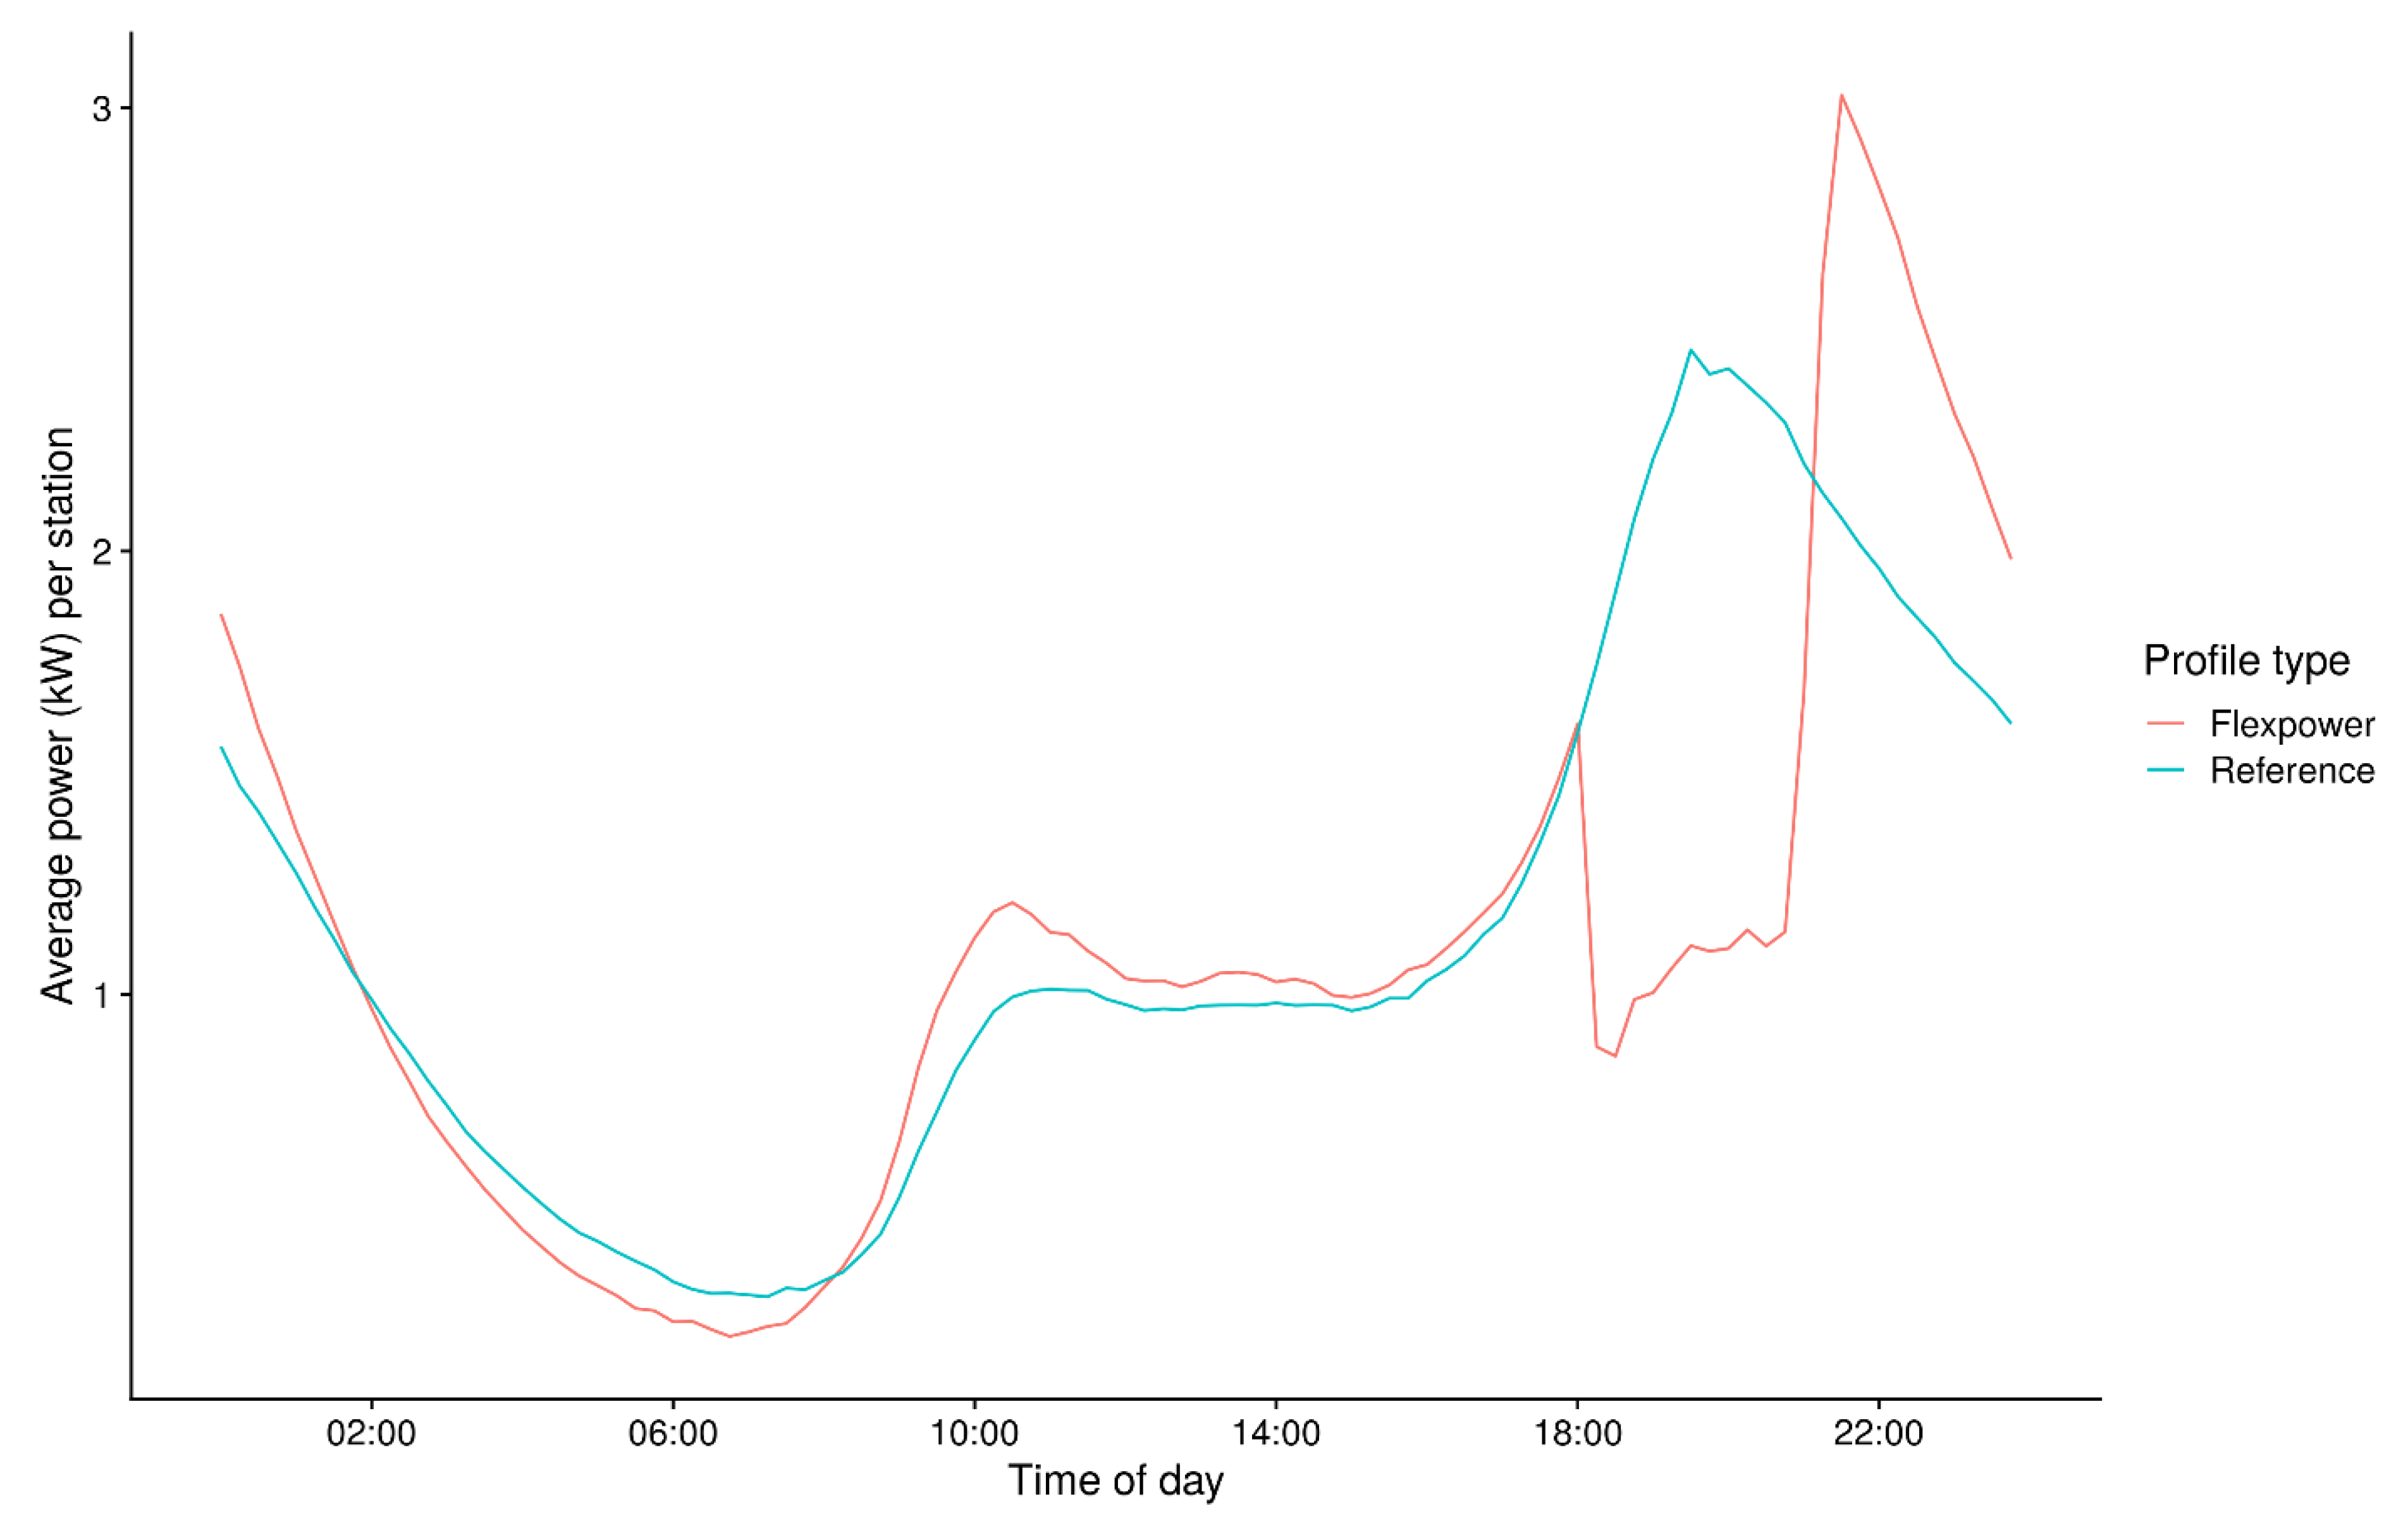
3.2. Total Grid Load

The results in Figure 2 do not reflect the number of active charging sessions, which varies a lot over the day. When we average the charging power over the number of stations instead of the number of active sessions, we get a better picture of the total grid load contribution of EV charging over the day (an idle charging station is still counted in the average). These results are presented in Figure 3.
The blue line represents the average power of a reference station and clearly shows that the peak in demand occurs between 18:00 and 22:00. The energy transfer then continues to decrease until 07:00. The average power per station is approximately constant during the day.
The red line, representing the average power of a Flexpower station, follows the same trend, except for the artificial decrease in power between 18:00–21:00 because of current limitations. This creates outstanding demand which is met at an accelerated rate after limitations are lifted, creating a rebound peak. Even though this rebound peak is higher than the original demand peak, it occurs at a time when household demand has already decreased causing the total load on the grid to be more evenly distributed. Flexpower reduces the load on the grid during the peak (at 19:30) with 1.2 kW per station.

3.3. Positively and Negatively Affected Sessions

An important indicator for smart charging in practice is the extent to which EV users are positively or negatively affected by providing a Flexpower profile compared to the current standard static charging profile. A session on a Flexpower station is defined as being negatively affected when it results in a lower amount of charged energy compared to a similar transaction on a reference station. However, since the amount of charged energy in a session depends on the battery size of the EV and the SOC of the batteries, we prefer to analyze this indicator by looking at the average power per transaction. The average power is directly proportional to the amount of energy charged and is insensitive to effects of battery size and SOC.
Figure 4 shows the distributions of the average power per transaction for the five different vehicle categories. We can identify several shifts in the distributions that correspond to the positive and negative impact of the Flexpower profile. For the 1 × 16 A category, there is a shift from 3.7 kW to 1.9 kW, and the 2 × 16 A category shows a shift from 7.4 kW to 3.7 kW, which are the result of the current being reduced by a factor of two during evening hours. The 1 × 32 A category shows the same shift to lower power but also a much larger shift to values above 4 kW. This is the result of being able to charge at 25 A and 35 A during off-peak hours. The 3 × 16 A category shows a shift to lower power levels because of current limitations but also a positive shift from 8 kW to 11 kW. This can be explained by the fact that vehicles no longer have to share the current during double occupancy. The 3 × 25 A category distributions contain the shift to lower power levels because of limitations and the double occupancy effect, as well as the positive shift because vehicles can charge at 25 A during off-peak hours.
The number of positively and negatively affected sessions are quantified as the percentage of transactions associated with these shifts and are determined by subtracting the two distributions from each other. This leads to the results in Table 2. The 1 × 16 A and 2 × 16 A categories cannot profit from Flexpower, and the 3 × 16 A has only limited benefit. The 1 × 32 A category has the largest advantage, followed by the 3 × 25 A category. The lower negative impact percentages of both these categories show that negative impact in a transaction is often compensated during more favorable conditions beforehand or afterwards.
Since most sessions complete charging before being disconnected and are unaffected by definition, the total share of negatively affected sessions is only 6%. Most of these sessions are PHEVs and will not experience any range anxiety as a result of Flexpower. The vehicles capable of charging over 3 phases or at higher current are less negatively affected and often even positively affected by Flexpower (the total share of positively affected sessions is 4%). Overall, we can conclude that the impact of Flexpower on customers is very limited and that the positive and negative effects are of equal magnitude.

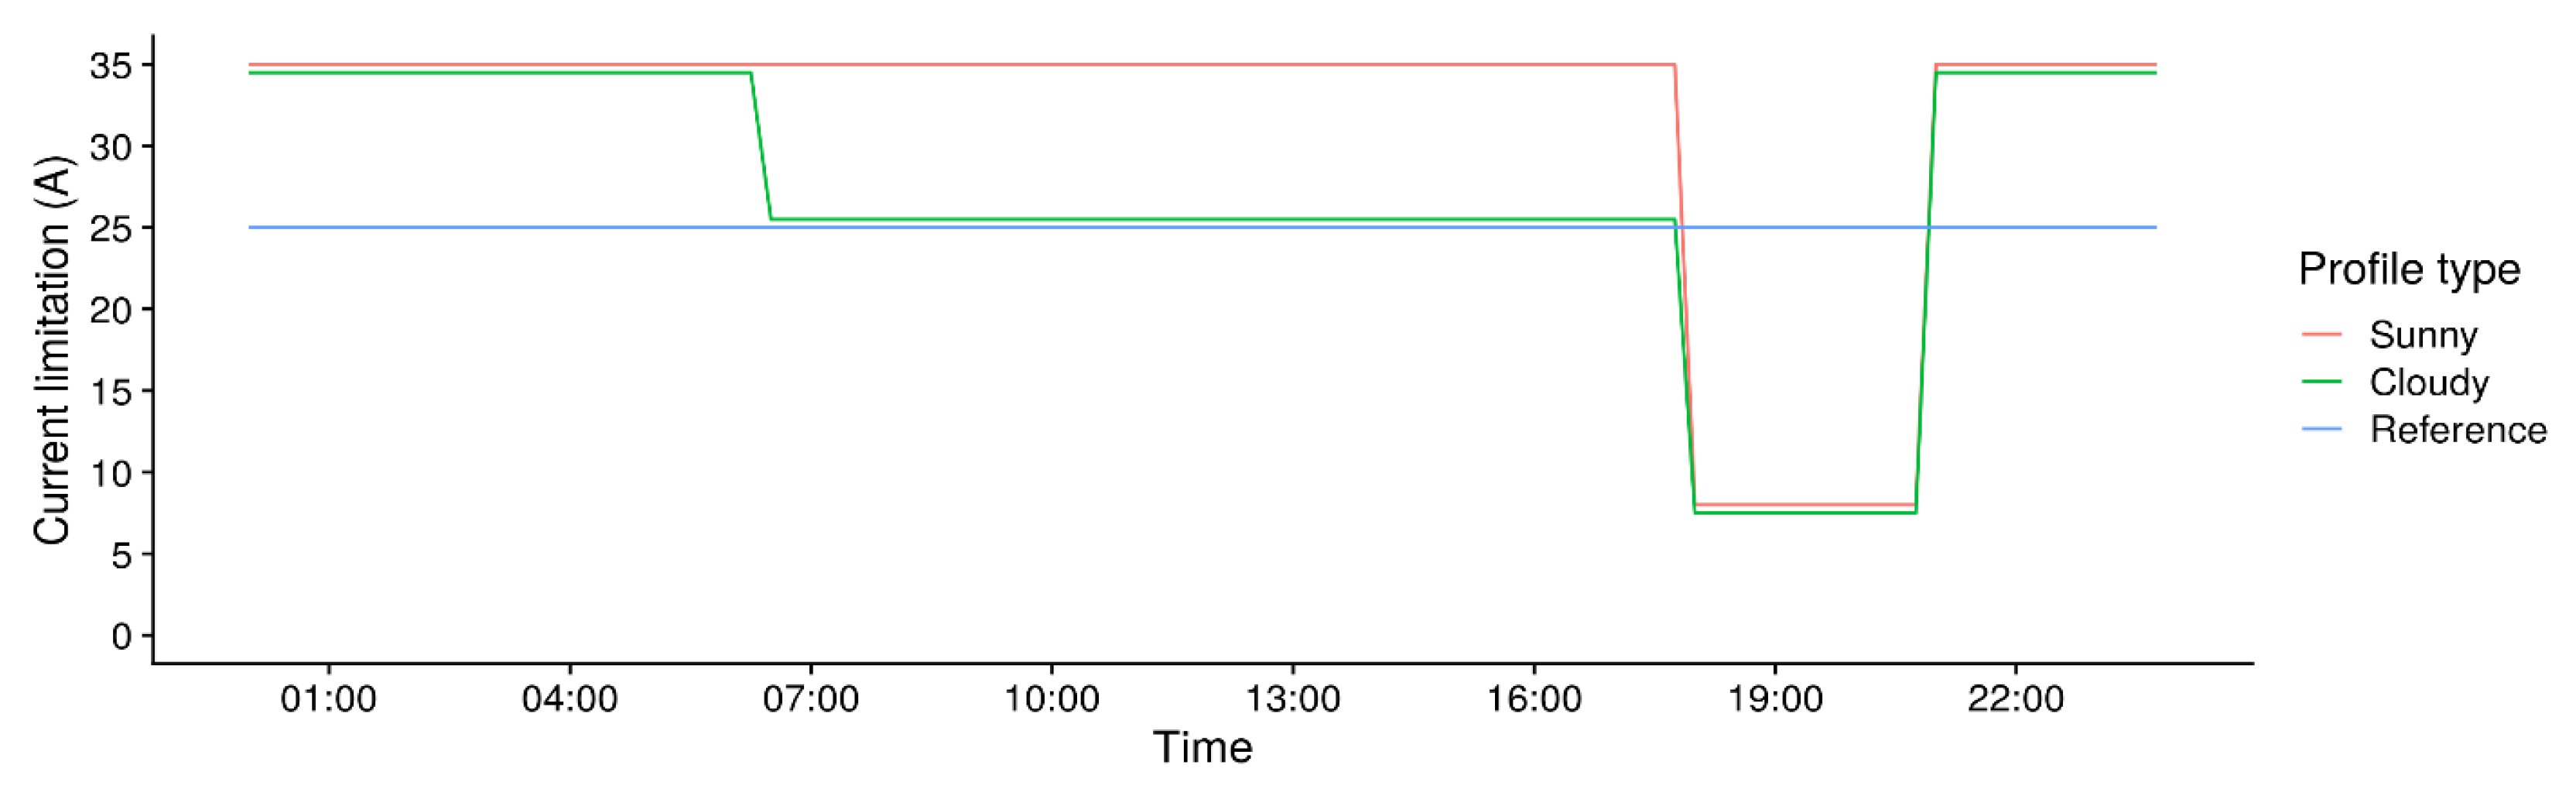
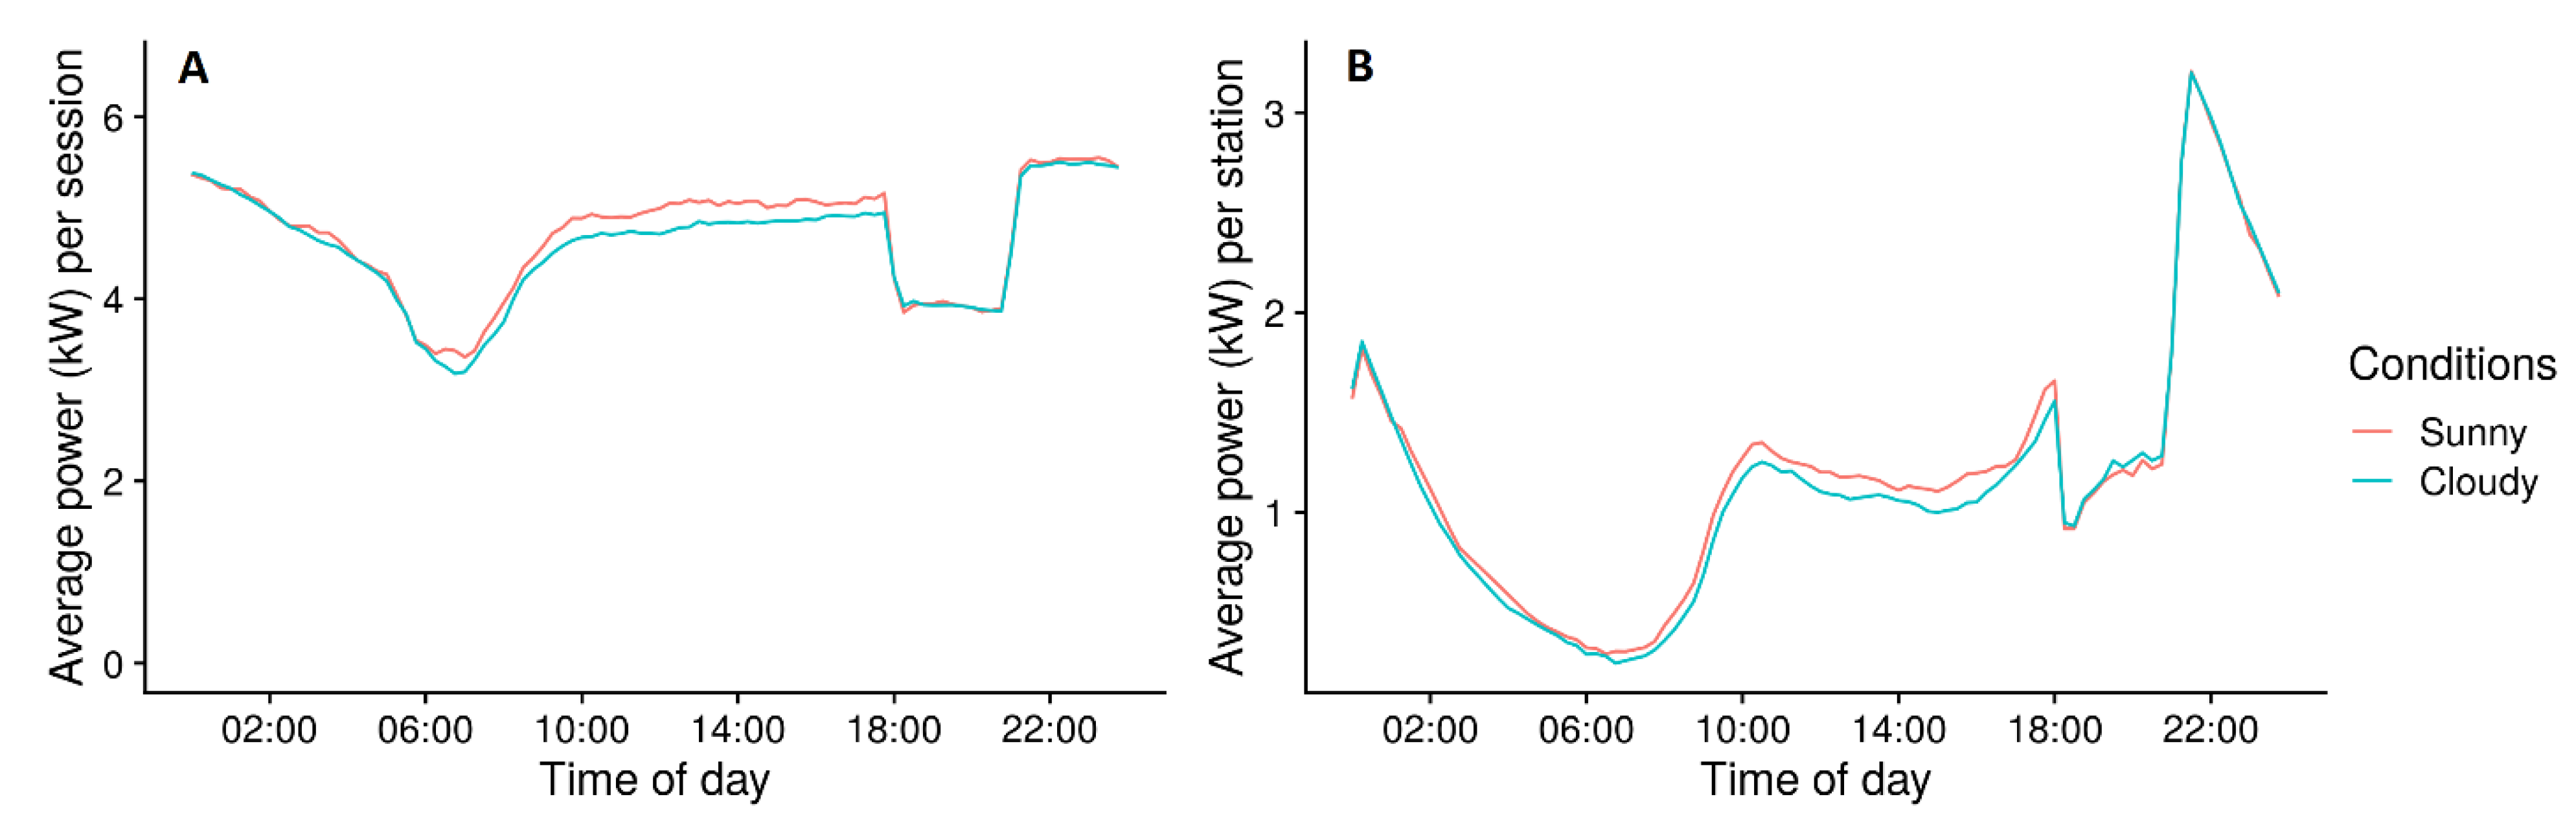
3.4. Solar Intensity Levels

The time-dependent current profile on Flexpower stations is updated each night depending on the weather forecast for the coming day. If the probability that the sun will shine (parameter ‘d1zon’ from the Dutch weerlive API [23]) is 40% or higher, the current limit is set to 35 A between 06:30 and 18:00, if it is lower it is set to 25 A during this time. This dynamic adaptation of the smart charging profile is done to investigate to what extent EVs can be used to absorb peaks in local solar power generation.
Figure 5 shows the average power per session and the average power per station for both solar intensity levels. It can be seen that the higher current limit leads to slightly higher power per session and also to a slightly higher power per station, indicating more energy was charged during the day and relieving a small portion of the evening load. The difference is not very large because only a limited share of vehicles can profit from the increased current limit during high solar intensity conditions, and double occupancy, for which the higher current limit gives an advantage, occurs less frequently during the day. Moreover, if vehicles complete charging before disconnecting, a higher power will not lead to higher energy volume; the battery will just be fully charged faster. If EVs are to be used to absorb future peaks in local solar power, extra incentives are needed to promote charging during overlapping hours.

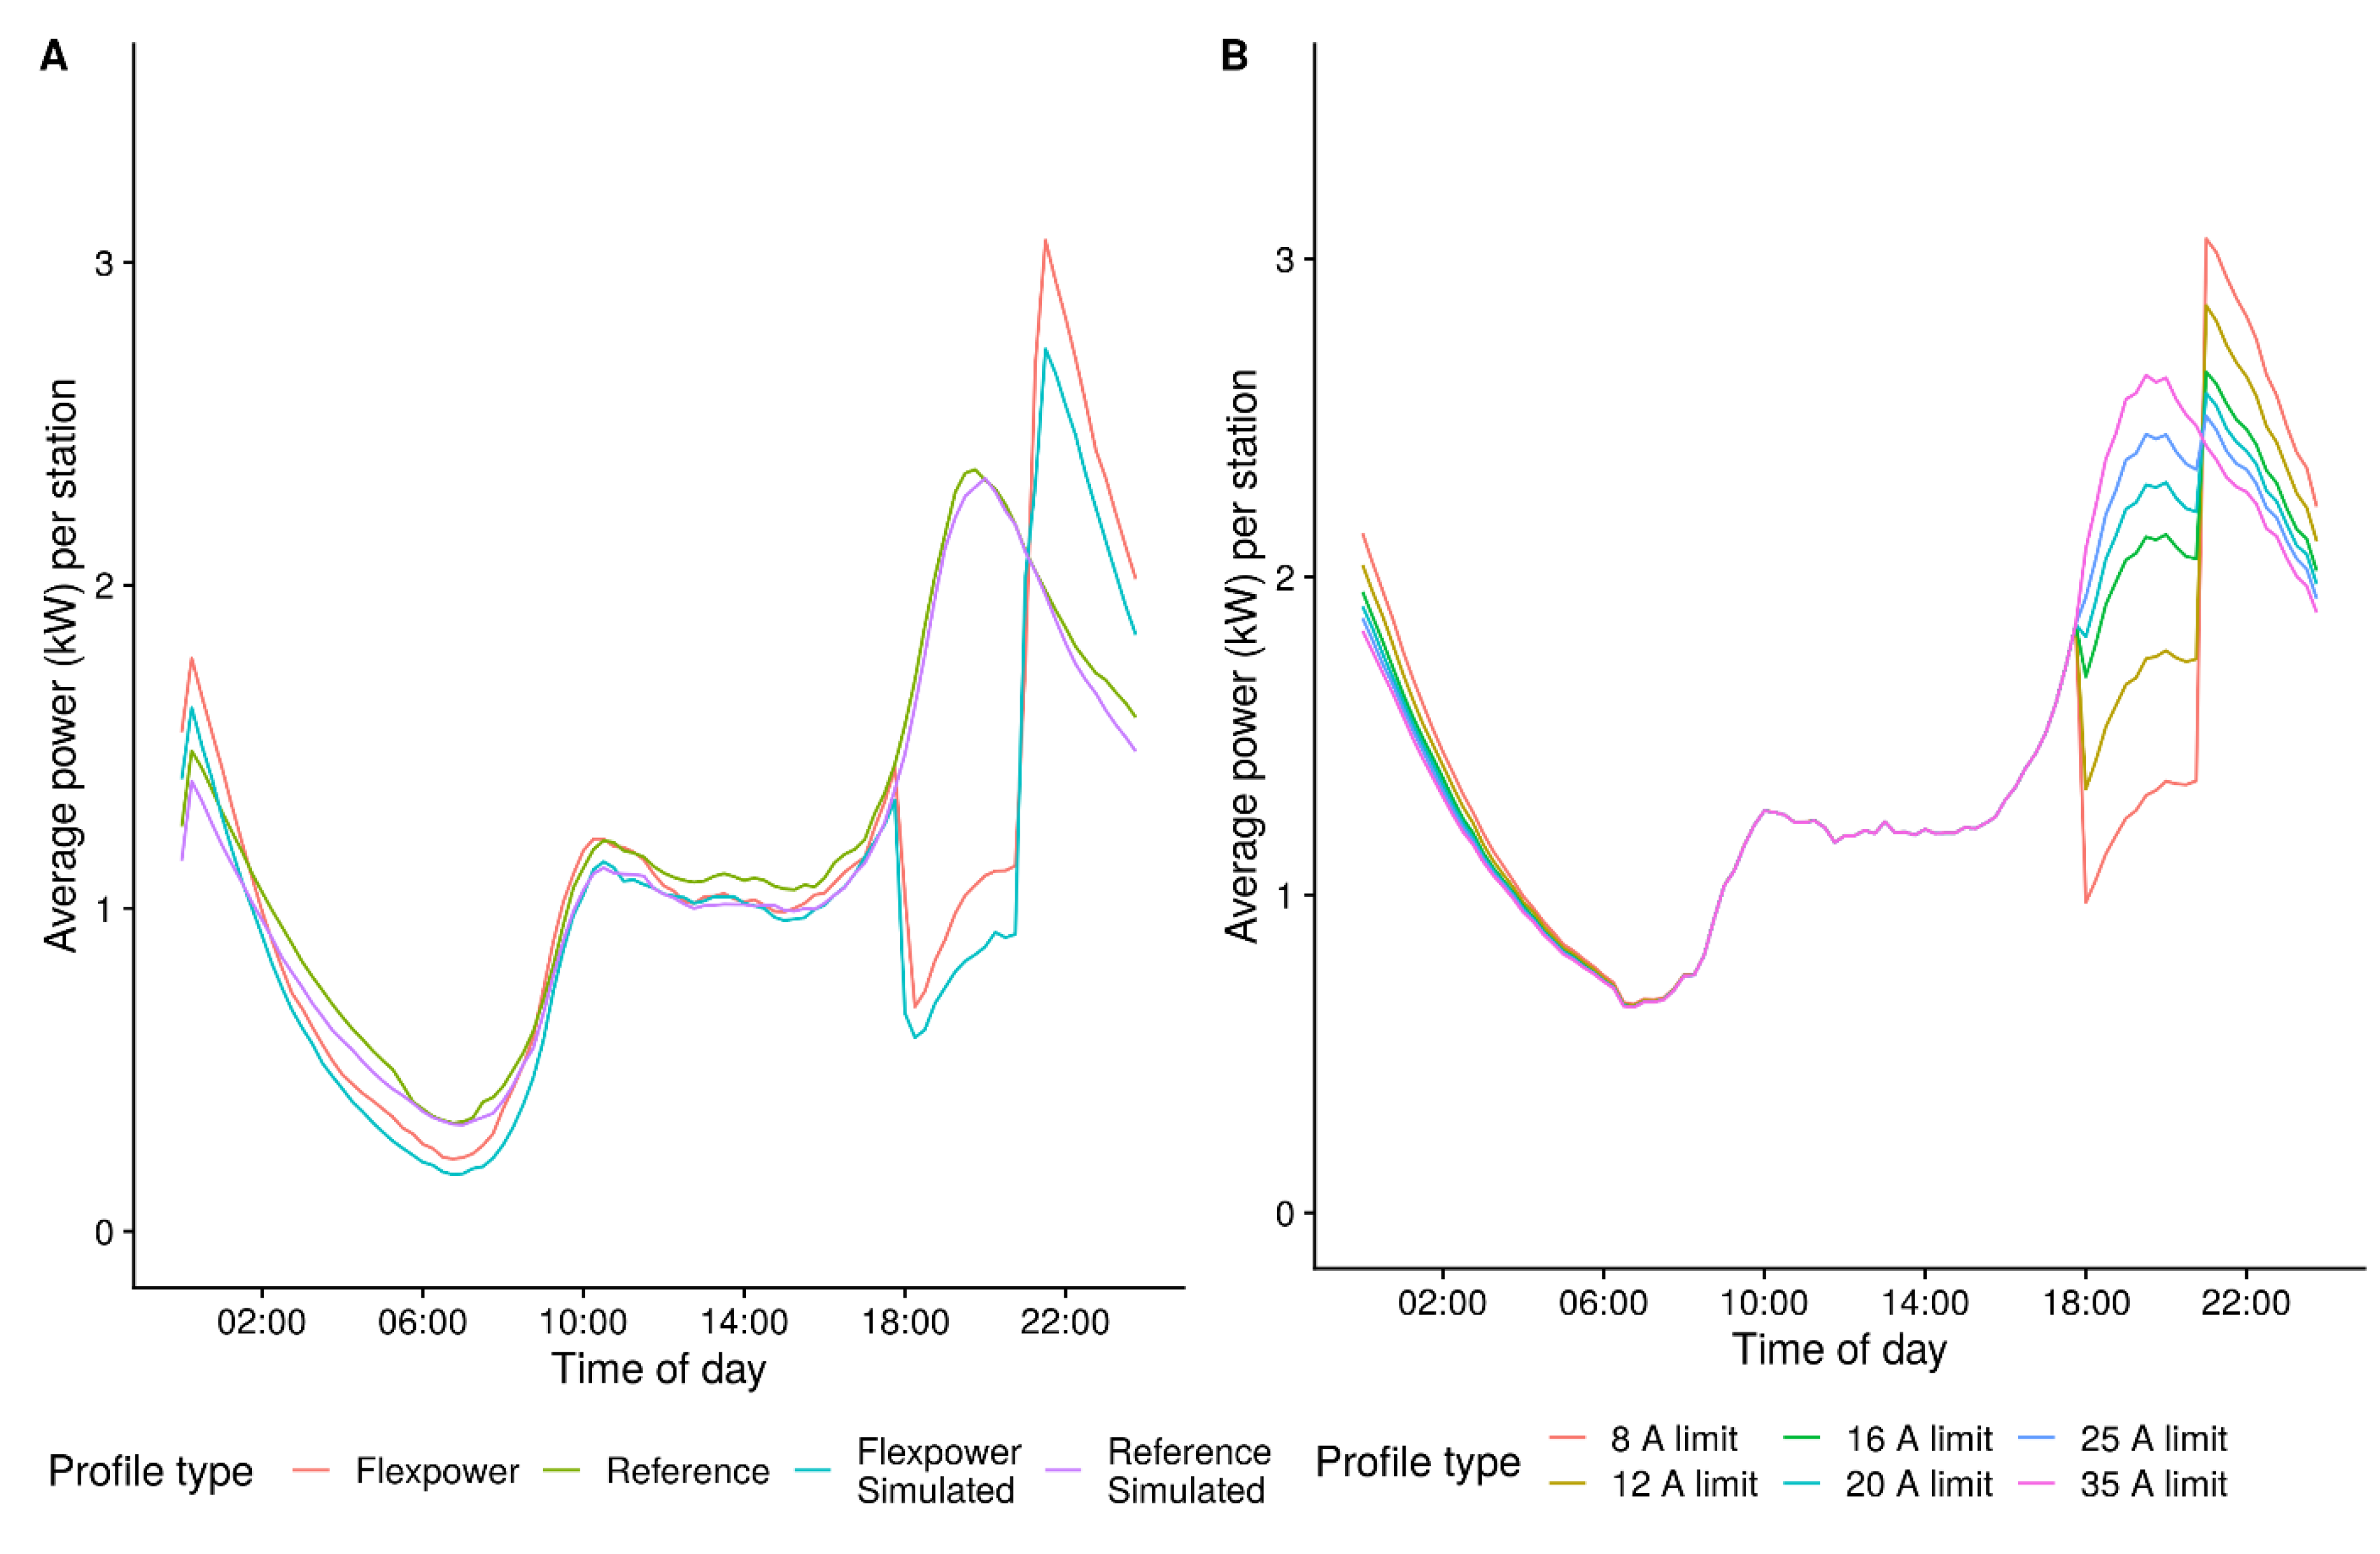
3.5. Simulation Model

The possibility to apply a time-dependent current limit on live charging stations with real users is a unique opportunity to evaluate smart charging strategies under real-world conditions. However, because there are so many known and unknown factors that influence the charging process and often only one or two transactions take place on a charging station per day, it takes many stations and several weeks to be able to draw reliable conclusions. Moreover, it is undesirable to subject real users to more aggressive profiles, limiting their access to energy and directly impacting their mobility. Therefore, it is of great added value to be able to simulate the impact of smart charging profiles.
To ensure that simulation gives reliable results, we use empirical measurements of actual charging sessions as input for the model, as it is known that these are very different from theoretical values [21]. The occupancy of a station, the vehicle category, and the applied current limit are known factors that influence the charging power. We construct a power table containing every combination of these factors (e.g., a single 1 × 32 A vehicle on a Flexpower station with a 16 A current limit) and determine the average charging power under these circumstances from the data. The empirical values are up to 30% lower than the theoretical power under the corresponding conditions.
The simulation takes the start time, end time, and total energy of a real transaction and simulates how this session would have developed over time if a different smart charging profile had been implemented. For each 15-min interval, a value is taken from the power table corresponding to the conditions as they were at that moment in time. A distinction is made between sessions that completed charging before being disconnected and sessions that continued charging until the connection was ended by the user. When simulating the first scenario, the process stops when the total energy volume reaches the amount that was charged in the original transaction, the battery capacity is the limiting factor. The amount of time it takes to reach this energy volume may be shorter or longer depending on the conditions during the session. When simulating a non-completed transaction, the process continues until the end of the transaction is reached. This can result in a larger or smaller amount of energy depending on the conditions during the session.
To validate the reliability of the simulation model, the transactions from a random selection of 50% of all stations (reference and Flexpower) were simulated with the corresponding current limitation profiles (as illustrated in Figure 1), and the results were compared to the actual measurements on the remaining 50% of the stations. In total, over 150.000 transactions were run through the simulation. The aggregated results are shown in Figure 6A. The simulated results very closely match the real results, indicating that the impact of a smart charging profile can be accurately evaluated with our model for the specific context of Amsterdam.
Because it was shown that the simulations give reliable results for the grid impact, we can now simulate different scenarios for a fixed set of transactions. Since the input transactions are now the same every time, an accurate comparison can be made of the grid impact, depending on the specific profile configurations, but also of how individual transactions were influenced by the profile in terms of total energy or charging time.
Figure 6B shows how the current limit level during the evening hours influences the avoided grid load and the rebound peak. Simulations were run where the current limit level between 18:00–21:00 was set to 8 A (actual Flexpower profile), 12 A, 16 A, 20 A, 25 A, and 35 A. Since we do not have actual measurements of charging behavior at 12 A and 20 A, the power values were interpolated between 8 A and 16 A and between 16 A and 25 A since it is expected that the power in those intervals increases linearly with the current limit.
The lower the current limit during evening hours, the higher the rebound peak is, where the current limit of 35 A is the only case which does not show a discontinuity at 21:00, indicating there is outstanding demand at this time regardless of the conditions during the evening hours and there are conditions for which a 35 A limit is advantageous (e.g., double occupancy of 3-phase vehicles). The difference in grid load and magnitude of the rebound peak between the 8 A and 16 A current limits is much larger than the difference between 16 A and 25 A. This can be explained by the fact that all vehicles can profit from the increase from 8 A to 16 A, but only a limit number of vehicles can benefit from a higher current than 16 A.
The results from the simulation model show that the impact of smart charging strategies can be studied in a virtual environment. Any set of real or hypothetical transactions can be evaluated on multiple profiles to evaluate the impact on the users, total sales, the grid load, and overlap with generation of sustainable energy. This allows us to estimate the business case of new strategies without directly exposing real users and without weeks of delay to accumulate sufficient data. The simulation model has become a valuable tool to experiment with smart charging profiles using input calibrated to the Amsterdam context and to evaluate policy decisions.

4. Outlook

The ambitious renewable energy targets in Amsterdam and corresponding growth in EV market share will make a smart charging strategy unavoidable. Part of the ongoing study is to combine data on charging transactions with measurements on the local electricity grid to better understand the interaction between the household and EV contributions to the load and to be able to customize smart charging profile depending on the local circumstances instead of the current one-size-fits-all approach.
The current profiles are now communicated with the charging stations over OCPP (Open Charge Point Protocol) one day ahead. The protocol allows for real-time communication, and we aim to implement this in the project. This would allow dynamic adjustment of the current limit depending on actual occupancy and demand levels as well as emergency interventions when the grid load passes a critical threshold.

5. Conclusions

A time-dependent current limit was deployed on 432 public charging stations in the city of Amsterdam where the current was reduced during the peak hours of household energy consumption (18:00–21:00), was increased during the night, and dynamically linked to the forecasted level of solar intensity during the day. By alternating a lower current during peak hours with a current surplus during off-peak hours, we were successfully able to suppress the load of EV charging on the grid by 1.2 kW per station during a designated time window with minimal consumer impact.
The results in this paper show a large difference between the theoretical charging limit and the practical power levels that are realized. For example, for the 1 × 16 A vehicles, the actual charging power is stable around 3 kW (Figure 2), while the theoretical limit for 1 × 16 A is 3.7 kW, a difference of about 20%. This discrepancy can be found for all categories and is an important insight to help make policy and models more realistic. This difference between theoretical limit and the charging power in practice arises from the sum of many factors, some associated with the vehicle and some associated with the charging station and the grid. It is difficult to say to what extent this result applies to different cities and countries as the local circumstances may differ significantly for public charging infrastructures in terms of connection types, vehicle fleet composition, and occupancy rates. Using measurements from real transactions for calibration, the simulation presented in this paper could be evaluated for different contexts.
It was also shown that in the current situation, the possibility of increasing charging volumes during the day is limited by the level of demand, low occupancy rates, and technical limitations of most of the electric vehicles currently on the market. If the goal of better overlap of EV charging with solar power generation is to be realized, consumers need more incentives to charge during the day.

Author Contributions

Conceptualization, R.v.d.H. and F.G.; methodology, F.S., A.B., and P.C.B.; formal analysis, P.C.B. and A.B.; writing—original draft preparation, P.C.B.; funding acquisition, R.v.d.H. All authors have read and agreed to the published version of the manuscript.

Funding

This research was partially funded by the Interreg North Sea Region Programme through the project SEEV4-city.

Acknowledgments

The authors would like to thank all partners participating in the Flexpower project: Vattenfall, Liander, ElaadNL, and the City of Amsterdam.

Conflicts of Interest

The authors declare no conflict of interest.

References

  1. Ev, I.G. Outlook to Electric Mobility; International Energy Agency (IEA): Paris, France, 2019. [Google Scholar]
  2. Figenbaum, E. Perspectives on Norway’s supercharged electric vehicle policy. Environ. Innov. Soc. Transitions 2017, 25, 14–34. [Google Scholar] [CrossRef] [Green Version]
  3. García-Villalobos, J.; Zamora, I.S.; Martín, J.I.; Asensio, F.J.; Aperribay, V. Plug-in electric vehicles in electric distribution networks: A review of smart charging approaches. Renew. Sustain. Energy Rev. 2014, 38, 717–731. [Google Scholar] [CrossRef]
  4. Galus, M.D.; Vayá, M.G.; Krause, T.; Andersson, G. The role of electric vehicles in smart grids. Wiley Interdiscip. Rev. Energy Environ. 2013, 2, 384–400. [Google Scholar] [CrossRef]
  5. Daina, N.; Sivakumar, A.; Polak, J.W. Electric vehicle charging choices: Modelling and implications for smart charging services. Transp. Res. Part C Emerg. Technol. 2017, 81, 36–56. [Google Scholar] [CrossRef]
  6. Pallonetto, F.; Mangina, E.; Milano, F.; Finn, D.P. SimApi, a smartgrid co-simulation software platform for bench-marking building control algorithms. SoftwareX 2019, 9, 271–281. [Google Scholar] [CrossRef]
  7. Richardson, D.B. Electric vehicles and the electric grid: A review of modeling approaches, Impacts, and renewable energy integration. Renew. Sustain. Energy Rev. 2013, 19, 247–254. [Google Scholar] [CrossRef]
  8. Verzijlbergh, R.A.; Grond, M.O.W.; Lukszo, Z.; Slootweg, J.G.; Ilic, M.D. Network impacts and cost savings of con-trolled EV charging. IEEE Trans. Smart Grid 2012, 3, 1203–1212. [Google Scholar] [CrossRef]
  9. Hildermeier, J.; Kolokathis, C.; Rosenow, J.; Hogan, M.; Wiese, C.; Jahn, A. Smart EV Charging: A Global Review of Promising Practices. World Electr. Veh. J. 2019, 10, 80. [Google Scholar] [CrossRef] [Green Version]
  10. Speidel, S.; Braunl, T. Driving and charging patterns of electric vehicles for energy usage. Renew. Sustain. Energy Rev. 2014, 40, 97–110. [Google Scholar] [CrossRef]
  11. Mu, Y.; Wu, J.; Jenkins, N.; Jia, H.; Wang, C. A spatial–Temporal model for grid impact analysis of plug-in electric vehicles. Appl. Energy 2014, 114, 456–465. [Google Scholar] [CrossRef] [Green Version]
  12. Sadeghianpourhamami, N.; Refa, N.; Strobbe, M.; Develder, C. Quantitive analysis of electric vehicle flexibility: A data-driven approach. Int. J. Electr. Power Energy Syst. 2018, 95, 451–462. [Google Scholar] [CrossRef] [Green Version]
  13. Yang, Z.; Li, K.; Foley, A. Computational scheduling methods for integrating plug-in electric vehicles with power systems: A review. Renew. Sustain. Energy Rev. 2015, 51, 396–416. [Google Scholar] [CrossRef]
  14. Quirós-Tortós, J.; Ochoa, L.F.; Alnaser, S.W.; Butler, T. Control of EV charging points for thermal and voltage management of LV networks. IEEE Trans. Power Syst. 2015, 31, 3028–3039. [Google Scholar] [CrossRef]
  15. Aunedi, M.; Woolf, M.; Strbac, G.; Babalola, O.; Clark, M. Characteristic demand profiles of residential and commercial EV users and opportunities for smart charging. In Proceedings of the 23rd International Conference Electricity Distribution (CIRED 2015), Lyon, France, 15–18 June 2015; pp. 1–5. [Google Scholar]
  16. Bauman, J.; Stevens, M.; Hacikyan, S.; Tremblay, L.; Mallia, E.; Mendes, C. Residential Smart-Charging Pilot Program in Toronto: Results of a Utility Controlled Charging Pilot. World Electr. Veh. J. 2016, 8, 531–542. [Google Scholar] [CrossRef] [Green Version]
  17. Zweistra, M.; Janssen, S.; Geerts, F. Large Scale Smart Charging of Electric Vehicles in Practice. Energies 2020, 13, 298. [Google Scholar] [CrossRef] [Green Version]
  18. Khoo, Y.B.; Wang, C.-H.; Paevere, P.; Higgins, A. Statistical modeling of Electric Vehicle electricity consumption in the Victorian EV Trial, Australia. Transp. Res. Part D Transp. Environ. 2014, 32, 263–277. [Google Scholar] [CrossRef]
  19. Das, R.; Wang, Y.; Putrus, G.; Kotter, R.; Marzband, M.; Herteleer, B.; Warmerdam, J. Multi-objective techno-economic-environmental optimisation of electric vehicle for energy services. Appl. Energy 2020, 257, 113965. [Google Scholar] [CrossRef]
  20. Geelen, D.; Refa, N.; Spiering, R. Smart charging electric vehicles based on a flexibility market. In Proceedings of the 25th International Conference on Electricity Distribution, Madrid, Spain, 3–6 June 2019. [Google Scholar]
  21. Bons, P.C.; Buatois, A.; Ligthart, G.; Geerts, F.; Piersma, N.; Hoed, R.V.D. Impact of Smart Charging for Consumers in a Real World Pilot. World Electr. Veh. J. 2020, 11, 21. [Google Scholar] [CrossRef] [Green Version]
  22. Quiros-Tortos, J.; Ochoa, L.F.; Lees, B. A statistical analysis of EV charging behavior in the UK. In Proceedings of the 2015 IEEE Conference on PES Innovative Smart Grid Technologies Latin America (ISGT-LA 2015), Montevideo, Uruguay, 5–7 October 2015; pp. 445–449. [Google Scholar]
  23. weerlive API. Available online: http://weerlive.nl/delen.php (accessed on 3 April 2020).
Figure 1. The time-dependent profile deployed on the selected Flexpower charging stations under sunny and cloudy conditions compared to the current limit per phase on a regular public charging station in Amsterdam.
Wevj 12 00082 g001
Figure 2. The average power over the day for the different vehicle categories during charging. The resolution of the graph is 15 min, which is limited by the resolution of the data.
Wevj 12 00082 g002
Figure 3. The average power per station over the day for Flexpower and reference stations. The plotted value represents the total grid load contribution of EV charging.
Wevj 12 00082 g003
Figure 4. Distribution of the average power per transaction per vehicle category for Flexpower and reference stations. The average is calculated for the whole session, so periods of slower charging during the current limitation can be compensated in the preceding or following hours. Only sessions that have not finished charging upon disconnection are shown (47.3%).
Wevj 12 00082 g004
Figure 5. The average power per active session (A) and per station (B) over the day for different weather conditions.
Wevj 12 00082 g005
Figure 6. (A) Average charging power per station for the actual data on Flexpower and reference stations, as well as a simulation of the Flexpower and reference profiles on the same transactions. (B) Simulations of the average charging power per station on a fixed set of transactions using different current limitation levels during the evening hours (18:00–21:00).
Wevj 12 00082 g006
Table 1. An overview of the inferred EV categories with examples of corresponding popular models on the market and the distribution on over several indicators on Flexpower stations (November 2019 to March 2020).
Vehicle CategoryExample of Model on the MarketNumber of SessionsSessions (%)Number of VehiclesVehicles (%)Energy (MWh)Energy (%)Average Energy/Session (kWh)
1 × 16 AMitsubishi Outlander (PHEV)42,98749%597743%255.5824%5.95
1 × 32 AJaguar I-Pace14,04316%165412%221.9121%15.80
2 × 16 AVW e-Golf49656%8006%59.606%12.00
3 × 16 ATesla Model 316,83319%363226%352.5833%20.95
3 × 25 ATesla Model S60657%7976%155.1214%25.58
unknown 26693%8876%34.193%12.81
Table 2. Percentage of charging sessions that was influenced by Flexpower and how. The numbers only reflect the sessions that were not completed at the moment of disconnection.
Vehicle CategoryNegativeNo ImpactPositiveSessions That Have Completed Charging (%)
1 × 16 A19%77%4%64.7%
1 × 32 A5%28%67%59.8%
2 × 16 A23%77%0%62.6%
3 × 16 A15%74%11%58.5%
3 × 25 A2%64%34%52.9%
Publisher’s Note: MDPI stays neutral with regard to jurisdictional claims in published maps and institutional affiliations.

