Article

Experiences from Battery-Electric Truck Users in Norway

Institute of Transport Economics, NO-0493 Oslo, Norway
*
Author to whom correspondence should be addressed.
World Electr. Veh. J. 2020, 11(1), 5; https://doi.org/10.3390/wevj11010005
Submission received: 11 October 2019 / Revised: 18 December 2019 / Accepted: 19 December 2019 / Published: 22 December 2019

Abstract

:
This paper presents experiences from pilot-projects with battery-electric trucks in Norway, focusing on purchasing processes, technology, vehicle choices, user experience and various performance aspects. Furthermore, we discuss the electrification potential for battery-electric trucks and compare their total costs of ownership and associated socio-economic costs with internal combustion engine (ICE) trucks for a range of technological maturity scenarios. The results show that experiences have generally been positive but tailoring of use patterns is often required. Furthermore, at their current maturity level, battery-electric trucks could, to some extent, replace typical use of Norwegian ICE trucks, depending on the situation. In terms of costs, we expect that battery-electric light distribution trucks will first become competitive with ICE trucks when technology reaches mass production.

Graphical Abstract

1. Introduction

Norway’s National Transport Plan for 2018–2029 sets ambitious targets for the introduction of zero-emission commercial vehicles as a means to fulfil CO2 reduction objectives towards 2030. By 2025, all new lighter vans are required to be zero-emission vehicles. By 2030, the same applies to all new heavy vans and 50% of new Heavy Goods Vehicles (HGVs) [1]. Achieving these targets, however, is not straightforward. The Nordic Council of Ministers [2], for example, finds that given current policy, Norway (and other Nordic countries) faces sizable emission reduction gaps in freight transport in light of the 2030 climate objectives, and that major trend changes are needed in the production and adoption of alternative propulsion systems and lower-carbon fuels.
Although several manufacturers have announced intentions to start series production in 2019–2020 [3], the market for zero-emission electric trucks (e-trucks) has, to date, largely consisted of pilot tests, meaning that most trucks with battery-electric powertrains (BE-trucks) are converted versions of standard diesel trucks. In Norway, the first BE-truck became operative (registered) as late as September 2016, and when the current study began in April 2018, this had only increased to three trucks. By July 2019, the Norwegian fleet still counted only 15 e-trucks, all utilizing battery-electric technology, including heavy vans that are registered as light lorries due to their high battery weight. With these numbers, freight vehicles lag behind compared to electric vans and buses, for which production stages are somewhat more mature [3].
By the autumn of 2019, all e-trucks in Norway are still conversions from diesel trucks and heavy vans. Volvo seems to be among the first manufacturers opening sales of small-series BE-trucks from week 42 in 2019, with expected delivery in the first half of 2020, while MAN will be able to deliver a small handful of BE-trucks to the Norwegian market during late 2019 or the start of 2020. For fuel cell hydrogen-electric trucks (FCHE-trucks), there still seems to be some way to go before series-produced vehicles reach the market. In the fall of 2019, however, four FCHE-trucks, converted from diesel truck chassis’, will be phased into operation for a major distributor of groceries in central Norway.
The aim of the present paper was to identify and present experiences gained by pilots with BE-trucks in Norway so far. Building on information from pilot users, this work further provides insights into the potential and costs for electrification in both the near term and longer term. This is done by (1) looking at how pilot vehicles are used and what adjustments have had to be made in daily use patterns compared to similar patterns for ICE trucks, (2) analysing user patterns for different vehicle segments, (3) developing cost models that compare total costs of ownership of BE- (and FCHE-) trucks versus ICE-trucks in a number of scenarios for technology maturity, and (4) assessing socio-economic costs of phasing in zero-emission trucks. While the first two analyses thus focus on BE-trucks, in the latter two, it was possible and insightful to also consider FCHE solutions. Understanding user experiences and technological and economic barriers and enablers perceived by operators is crucial for achieving the ambitious uptake of zero-emission vehicles that Norway envisions over the next decade. Particularly for freight vehicles, there seems to be a knowledge gap regarding these topics.

2. Literature Background

To date, research on the adoption of e-trucks has been relatively limited compared to what is the case for passenger cars, and to a lesser extent, buses. This applies both to research on user experiences and on reasons behind the adoption (by firms) of electric vehicles e.g., [4]. For TCO analyses, there are also particularly few studies for medium and heavy-duty vehicles [5]. The main reason for this is that the number of e-trucks is still small and in an early phase. This is caused by prohibitively high purchase prices compared to ICE-vehicles, and by technological and operational limitations and uncertainties, such as short driving ranges, operational stability, resale prices, etc. [6,7,8].
Although battery-electric heavy-duty vehicles (HDVs) have, to date, reached higher technological readiness levels than their FCHE counterparts and therefore, dominate pilots [7,9], the small number of battery-electric HDVs that are currently in use are largely conversions from diesel vehicles [8]. From 2019, however, several manufacturers have started up selected pilots [8].
When it comes to user experiences, a case study based on interviews of frontrunner companies in Amsterdam [4] revealed that important factors for adoption are positive social and environmental effects, as well as strategic considerations. Respondents reported positive experiences using electric vehicles, but at the same time, technological limitations were identified as adoption barriers. Firms successfully adopting BE-vehicles also reported having to carry out significant adjustments of e.g., route planning. Kleiner et al. [7] reported similar findings in an overview of the status for electric logistics: common experiences across countries are that drivers are generally well-accepting of e-trucks, but that e-trucks have operational limitations compared to ICE trucks, and that the availability and choice of vehicles has, to date, been limited. Kleiner et al. [7] also found that few business cases are provided, and that from these, it becomes clear that specific local characteristics are very important for success (e.g., topography, temperature and availability of (financial) incentives).
With regard to the feasibility of e-trucks in terms of cost competitiveness and technical capabilities, findings are mixed [8]. On the one hand, there are significant extra costs for investing in e-trucks compared to those with ICE. In TCO analyses assessing the current situation, these are generally either calculated by summing cost estimates for different components [10] or based on a small number of observations. This situation leads to estimates that, thus far, are uncertain and vary widely between studies. Estimates of capital cost premiums of electric propulsion systems in the future also vary considerably, particularly for FCHE-trucks [9]. However, there seems to be a consensus that capital cost premiums compared to conventional vehicles will decrease considerably with larger scales of production, with BE-trucks remaining cheaper than FCHE-technology, and reaching cost-competitiveness vis-à-vis ICE at a faster rate e.g., [11,12,13].
On the other hand, there are operating costs which, due to longer mileages, are more significant for TCO of trucks than for passenger cars [9]. Operating costs for electric propulsion tend to be lower than for diesel vehicles due to, amongst other reasons, higher energy efficiency for electricity and savings on energy costs and general maintenance [5,6,14]. This emphasizes the idea that high utilization may be key for recovering the cost premium of investment, and thereby, for the competitiveness of e-trucks.
Nevertheless, according to Plötz et al. [9], it is this degree of utilization, due to range challenges, that makes the potential for electrifying heavy freight transport by road controversial. Indeed, technological barriers stemming from limited driving ranges and long recharging times are lower for trucks with shorter yearly mileages. This is also the reason why e-trucks are starting to get deployed in urban use cases. For larger trucks and trucks with high annual mileages, barriers for electrification are larger [15].
Comparing BE- and FCHE-propulsion, Mulholland et al. [15] found that BE-systems yield higher energy efficiency but are currently most suitable for shorter-distance driving, due to limited battery capacity and long recharging times. As a potential motivator for the adoption of FCHE-trucks, compared to BE-trucks, a selection of German experts identified the longer driving ranges. However, there are concerns about insufficient fueling infrastructure becoming available [8].
Overall, it is likely that the operational and economic feasibility of electric HDVs is currently still highly dependent on characteristics of the specific use case, not least the public policy instruments.

3. Methodology

The current paper builds on four interrelated analyses: (1) User experiences, (2) Electrification potential in light of typical user patterns, (3) Models for cost of ownership and comparisons of decomposed cost levels for different propulsion technologies, and (4) Socio-economic costs of phasing in zero-emission trucks. The results from the first analysis are presented for different vehicle segments (light and heavy distribution trucks, tractors for semitrailers, refuse collection vehicles, and to a lesser extent, vans). A similar analysis for zero-emission buses in Norway was presented at EVS32 in Lyon [16]. In the other analyses, the presentation of results will focus on light distribution trucks, which seems to be the vehicle segment with the largest electrification potential in the short term (in addition to electric vans, which are already a commercial product category).

3.1. User Experiences

To assess user experiences, we carried out a case study based on semi-structured interviews of enterprises with experience in operating e-trucks in Norway. Sample selection is based on the list of projects [17] that have received support from ENOVA (the Norwegian Government Agency for the transition towards a low-emission society), the Norwegian Public Road Administration’s vehicle registry Autosys, as of December 2018 [16], and the project list of ‘Klimasats’, which is the Norwegian Environment Agency’s climate initiative for transitions to low-emission solutions in the public sector. In addition to truck operators, such as freight forwarders, a number of relevant government/public policy bodies and manufacturers were also interviewed.
The interviews were open-ended and conducted as Skype meetings (in Norwegian) with representatives closely involved in investment or policy decisions of each of the identified organizations. As preparation, subjects were sent a questionnaire, after which the open-ended interview questioning allowed them to articulate perceptions freely. To allow clarifications and correction of any misunderstandings, subjects were sent the interview minutes for comments and approval. Although specifics varied, interview questions were related to the vehicle purchase process and supplier, trial experiences (technology choice, design, feedback from owners/drivers/passengers, energy use, range, vehicle performance, service/maintenance, charging performance and use of existing fleet), decomposed investment and operation costs, as well as public frameworks and incentives that could contribute to faster diffusion of zero-emission vehicles into the Norwegian market.

3.2. Electrification Potential Given Typical Vehicle User Patterns

Given the current state of technology, the most important barriers for the electrification of vehicle fleets are driving range limitations and long charge times of larger BE-vehicles. These barriers are especially relevant for freight transport by road. Compared to buses, freight vehicles generally cover larger service areas and have less predictable daily driving patterns, which often also complicates daytime charging. In addition, owners of freight vehicles rely on their vehicles to generate income. Loss of cargo capacity due to large and heavy batteries or time required for daytime charging translates directly into higher costs, and may also lead to needs for increased vehicle-km to perform the same level of services compared to a vehicle with combustion engine.
In our analysis, we look at the Norwegian potential for electrifying freight vehicles, distinguishing between the near term (with particular focus on how technological limitations such as driving ranges and engine size relate to current use patterns and requirements) and the longer term (where we focus more on the influence of different vehicle-dependent obstacles for electrification) given that transport assignments can be distributed between vehicles with more flexibility.
The main sources for our analysis are base data from both the Norwegian vehicle registry, Autosys [18] and Statistics Norway’s survey of trucks for 2016 and 2017 [19]. In the latter, samples of truck operators report all transport assignments for one week, and sample selection is done such that all weeks of the year are represented. Combining these two sources, we constructed a dataset including information on amongst others, vehicle category and age, engine power, use of trailer (during reporting week) and trip length.
We also aggregated data from trip level to daily mileages, using maximum daily mileages as a proxy for the minimum driving range that electric vehicle alternatives should have to be suitable for the user. Using the maximum daily mileages ensures that we take into account day-to-day variations, which may pose challenges with respect to battery sizing, predictability, and charging requirements (see, e.g., an analysis of the potential for use of BE-vans by Norwegian Craftsmen in Figenbaum [20]). In cases where vehicles have two or more daily trips starting from the same postcode (as approximation for vehicles returning to a base with a charging opportunity), daily mileages were adjusted to reflect that requirements for driving ranges would be lower.
Furthermore, we set a number of criteria for trucks to be considered as having electrification potential in the shorter timeframe:
  • Maximum daily mileage is shorter than the driving range on a fully charged battery (the latter is set to a maximum of 150 km based on specifications of and pilot experiences with current electric alternatives; this also agrees with Anderhofstadt and Spinler [8] who identified upcoming e-trucks by Daimler and MAN having maximum driving ranges of up to 200 km, which must be derated somewhat for Norwegian winter driving, and similarly, Volvo’s announced FE Electric-truck)
  • Engine power ≤500 HP (according to a major manufacturer interviewed, there are currently effectively no alternatives to diesel or biodiesel for higher engine powers; this is supported by none of the current battery-electric trial vehicles having engine powers >500 HP)
  • Not requiring the use of a trailer, except tractor units (due to the high engine power required for driving with heavier trailers and following the above manufacturer’s feedback)
  • Trucks up to five years old (i.e., the fleet segment where transport actors and manufacturers report that requirements for new purchases are set, and taking into account that annual mileages decrease with vehicle age)
Altogether, this yielded a sample of 6150 trucks with information on static fleet data, daily user patterns and variations.

3.3. Cost Competitiveness of Electric vs. ICE Operation

To investigate the cost-competitiveness of electric trucks with trucks with ICE, we developed models for total costs of ownership. Similarly to the core of many existing studies e.g., [5,13,21,22], we established cost functions that are decomposed into relatively detailed cost components. We distinguished between technology-dependent costs (which vary between technologies and are divided further into time-dependent, distance-dependent and maintenance costs), and technology-independent costs (equal or assumed equal for all technologies). The cost aspects considered in our model are summarized in Table 1.
The starting points for the technology-dependent cost functions are validated base parameters from a National Freight Model for Norway, hereafter referred to as NFM [23,24]. An advantage of starting with this model is that the technology-dependent cost functions can later be used for analyses of different future scenarios using the same model.
With regard to investment/capital costs, we distinguished between ‘reference investment costs’ for the diesel alternative (from the NFM) and investment cost premiums of alternative technologies. For e-trucks, cost parameters (hereunder investment cost premiums) are based on (confidential) data collected in the user interviews, updates and refinements of cost parameters from Hovi and Pinchasik [25], feedback from actors in the Norwegian transport sector, data from Jordbakke et al. [3], and cost development forecasts e.a. [12]. We found that estimates for cost premiums of converted heavy-duty trucks are in line with Weken et al. [26]. Subsidies towards cost premiums were not included in our calculations, as these are granted only in a limited number of cases and because one of the study’s objectives was to illustrate when alternative propulsion vehicles can be competitive on their own.
Furthermore, TCO calculations are done considering a depreciation period of 5 years (the typical leasing period), with depreciation based on the counter-balance principle. Hereby, it is expected that batteries last at least the entire typical leasing period without requiring replacement, in light of lifetime estimates spanning between 6.6 and 11 years [5,22,27].
However, due to uncertainty around remaining battery lifetime after the leasing period, and due to the lack of a second-hand market (in particular for the early-phase market for BE- and FCHE trucks), the availability of data on resale prices is limited [8,22,28,29] and is set conservatively. For e-trucks, this entails that we use the same residual value share as for diesel vehicles (using NFM parameters), but with an additional ‘uncertainty’ discount, depending on the production maturity phases, i.e. discount of 50% under the early market phase scenario, 25% under small-scale series production, and no discount under mass production. The latter is based on examples from the market for BE-passenger cars which found that Norwegian leasing firms initially operated with low residual values due to uncertainty, but that these values have normalized with market maturity [30].
As in most TCO analyses see, e.g., [21,27], or [29] costs and savings occurring at different stages in the vehicle’s lifetime are discounted to their present value. We used a discount rate of 3.5% (upward adjustment from the NFM representing commercial cost of leasing).
Regarding distance-dependent costs, energy prices are split into a base price and any applicable levies, using the same sources as above. For electricity, costs are further split into regular charging, and a cost premium of 50% per kWh in case of fast charging (representing additional costs of requiring charging at higher power/effect, e.g., connection upgrades). While we include road toll charges and their exemptions for zero-emission vehicles, ferry costs and exemptions are not included in the analysis due to limited data availability and particularly high dependence on use location.
Driving distances and mileages are set to 45,000 km/year for trucks, based on NFM parameters and adjusted to reflect mileages feasible for BE use cases, i.e., particularly urban/regional distribution patterns.
Regarding maintenance, we assume that costs for e-trucks are 50% lower than indicated for ICE trucks by NFM parameters. This is based on conclusions by Huismans [5], and by Zhou [22], who suggested that maintenance costs for electric trucks are about 30–50% of the level for similar diesel vehicles, and Jadun [31], who expects savings on maintenance to increase with larger-scale adoption.
Other cost aspects in the table are based on NFM parameters. The annual weight fee is treated as a technology-independent cost component, because its environmental component is only marginal.
Not presented here are costs related to infrastructure establishment, charging/filling time, any need for back-up capacity, any decreases in cargo capacity given heavy batteries, and any decrease in operating hours during the day because of range limitations and/or lack of access to fast charging throughout the day. These themes are discussed later in our analysis of electrification potentials and use patterns.
It should also be noted that for BE- and FCHE-trucks, available data on cost premiums and operation are currently still limited and uncertain in many studies e.g., [5,10,27], amongst others, because manufacturers are cautious about sharing detailed information. However, data availability is expected to improve with future adoption, and our flexible model set-up is designed to allow easy incorporation of new estimates for all parameters.
Based on the inputs above, and given expectations that cost premiums of electric trucks will decrease materially with technology maturity e.g., [4,12,13], we assessed three scenarios to illustrate implications for cost-competitiveness: (1) today’s early market phase for BE- and FCHE-trucks, (2) small-scale series production, both with current and lower hydrogen prices, and (3) mass production. For today’s early phase, our assumptions on cost premiums of electric vs. ICE vehicles are based on the sources above. For small-scale series production, we assume that battery-electric vehicles cost twice as much as corresponding ICE vehicles; hydrogen-electric vehicles three times as much. Under mass production, battery-electric vehicles are assumed to cost 50% more than ICE vehicles; hydrogen vehicles about double. The latter is in line with estimates on system cost reductions for MD trucks at production scales of 100k systems a year [32], page 15, and which imply a cost premium of ca. 95%. For all scenarios, we present a decomposed analysis to illustrate the role of different cost components for competitiveness and differences between ICE vehicles and BE- and FCHE-trucks. For reasons of space, cost decompositions are only presented for light distribution trucks, but reference is made to equivalent analyses for heavy distribution trucks and tractors for semitrailers. Today’s retail pump price of hydrogen is 72 NOK/kg excl. VAT (~€ 7.35) [33] can potentially be halved with self-production (operator interview) or moderate production scale increases [34].

3.4. Socio-Economic Costs of Phasing-in Zero-Emission Technologies

To complement the assessment of cost competitiveness, we carried out an assessment of the socio-economic costs of phasing in alternative propulsion technologies, i.e., the sum of public and private costs and benefits. For society as a whole, costs can be expected from the investment premium of zero-emission vehicles, while benefits stem from savings on fuel/energy costs and general vehicle maintenance compared to diesel vehicles. In addition, society can expect benefits through reduced negative external effects (local emissions), for which cost factors are based on Rødseth et al. [35] and adjustments in Thune-Larsen et al. [36].
In our TCO analysis, road toll and fuel levy exemptions for zero-emission vehicles are treated as a benefit for the private firm. Because these exemptions simultaneously entail revenue losses for the state, they are considered neither as a cost or benefit, but as a socio-economic transfer. Following guidelines from the Norwegian Ministry of Finance, we do, however, include a 20% ‘tax financing cost’ as a socio-economic cost on this transfer.
Finally, by relating the sum of social-economic costs to the reduction of CO2-emissions when replacing an ICE vehicle by a zero-emission truck, we arrived at socio-economic costs per reduced tonne in CO2 emissions for the different maturity scenarios.

4. Results

4.1. User Experiences

4.1.1. The Trials

A technical summary of the characteristics of early Norwegian trials with e-trucks, and whose operators formed the core of the interviews, is shown in Table 2. Trials were operated in the South East of Norway, and were implemented in food distribution, household and business refuse collection and recycling service segments. The e-trucks operated vary in power and total weight, and were mostly registered in 2018. All trucks operated five days a week and with expected annual mileages ranging from 18,000 to 120,000 km, divided into about 250 business days per year, and one to three working shifts per day.
In addition to the vehicles in the table, two operators using BE-light commercial vehicles were interviewed for comparison. These companies currently do not have regular operations of heavy-duty e-trucks, but one of them had tested a heavy BE- van for 14 days.

4.1.2. Procurement Process

In the procurement process of the BE-pilot trucks, one important incentive was financial support from the authorities through a Norwegian Environment Agency municipality support program (‘Klimasats’), or more commonly, the ENOVA scheme. ENOVA is a government instrument financed by an energy fund and can provide support for 40–50% of the additional costs of zero-emission trucks, in addition to the full costs of a charging station, depending on the size of the applicant firm. Another incentive for electric vehicles are specific requests in public tenders, but it was emphasized that environmental characteristics must be weighted more than price if a bid in public tenders with e-trucks should be competitive. Long and sometimes uncertain vehicle delivery time, relative to the often limited time between tender results and start of contracts, was identified as a potential risk by operators. In addition, although it was not difficult for the operators to find potential suppliers, a challenge for the first operator was that the supplier did not have agents in the Norwegian market. This situation contrasts with the electric LDV operators interviewed who commented that they have a framework agreement with all major vehicle suppliers.

4.1.3. Battery/Charger Technology

Battery choices for the trucks were based on requirements set by the operating purpose of the vehicles. For the larger trucks in the pilots, battery capacities chosen ranged between 200 and 300 kWh, with a corresponding range (on full charge) of between 140 and 200 km. This contrasted to the LDV operators interviewed, where the battery size was smaller (56 kWh). Lithium-ion battery technology was mostly chosen, while the heavy vans from Iveco have sodium nickel chloride batteries of 80 kWh installed.
Regarding charging technology and solutions, most operators charged trucks overnight and during lunch breaks at the depot, due to challenges with establishing fast chargers. Similarly, the LDV operators interviewed utilized overnight depot charging. A summary of the selected battery capacity (including for vans), associated range on full charge, and charger solution chosen by the operators, is shown in Figure 1.

4.1.4. Experience from Operation

Operator feedback related to different aspects of trial operation is outlined below. Due to the limited number of operators who currently have e-truck experience in Norway and thus, could be interviewed, feedback is deliberately described only in general terms and not analyzed further.

Design

Although the design of the e-trucks did not convey major issues, some user comments were made about a lack of focus on reducing the specific vehicle weight of the chassis, to better accommodate the associated weight increases due to battery, cooling aggregate, and insulation. Other comments encompassed the limited availability of different vehicle size alternatives. In general, much of the design knowledge for e-trucks has been transferred from buses, with the most important difference being battery dimensioning due to different possibilities for opportunity charging. This means that the trucks must carry more energy on board (ideally to cover one shift, or about 200 km per day for distribution). A failure in, e.g., overnight charging, thus becomes critical for truck operations the next day because of the (often) long charging time.

Owners/Drivers

Despite initial reservations, both managers and drivers were generally pleased with the e-trucks. Several operators commented that the trucks contribute to a good working environment, and when working properly, are pleasant and fun to drive. The main challenge, according to operators was trusting a new technology and overcoming range anxiety. Other specific issues included changes in driving license requirements (for the heavy vans, due to increased total weight and changes in vehicle classification), which limited the ability to recruit drivers to those holding such licenses.
In general, the pilottrucks were reported to produce less noise and vibrations than regular ICE vehicles, although in some cases, mechanical noise became more noticeable. Reduced noise/vibrations were received positively by owners/drivers, both in terms of a positive impact on the work environment, but also because operators recognized a potential for operation during night times in densely populated areas where noise restrictions preclude ICE operation.
Nearly all operators interviewed said that the e-trucks give a positive environmental profile to their enterprise. Several operators reported high public interest for both customers and media, and that their client also felt a sense of pride.

Energy Use

According to operators, the energy use of the e-trucks under real-life conditions proved significantly lower than for ICE vehicles per km (~1–1.5 kWh/km vs. ~3–8 kWh/km with ICE). Operators also noted that energy used for waste compressors, heating and cooling, if derived directly from the battery, reduces the driving range for the vehicle. In some cases, this was solved by using an external HVO-based generator. Issues were also reported due to the lack of soft start functions of cooling units.

Range/Route

Despite the fact that most e-truck trials were intended to directly replace routes of ICE vehicles, in practice, this has not always been the case. Some vehicles have been put in operation in central areas, where topographical differences and range requirements are relatively low and where they are most useful due to low noise and reduction of local emissions. Other operators optimized routes for charging during pick-ups/deliveries or breaks. However, it was noted that where a fleet has varying daily driving requirements, the e-trucks are particularly vulnerable to unexpected transport assignments in the afternoon.
A number of operators further reported that driving ranges did not live up to their expectations, both in terms of manufacturer/supplier specifications and display readings in the vehicle. This variation has meant that in some cases, ranges used for planning have had to be significantly adjusted downwards, and in general, very conservative values for route planning are used. Such issues were also reported for LDVs, assumed to be due to the number of stops en route coupled with a relatively low driving speed, cargo loadings, and variable route topography. Range differences between summer/winter have so far not been apparent, but there has been little experience with operation during cold days as of yet.

Vehicle Performance

Experience with the technical/general performance of the trucks has been mixed. One truck operator reported major technical issues and extensive vehicle downtime. For LDVs and the refuse collection trucks, operators were generally happy with technical performance, and most of the issues reported were relatively minor and attributed to the conversion from diesel to electric powertrains, and teething problems. Noteworthy general performance comments included mixed experiences with braking capacity, vehicle traction and engine power. For some (but not all) operators, adjustments fixed these issues.
Most operators reported reduced freight capacity for the e-trucks compared to the equivalent ICE vehicles, which, in some cases, was considered by the operator to be a major issue affecting operation. Reasons for the reduced capacity are the significant battery weight and, in some cases, battery position in the vehicle.

Charging

The availability and possibility of charging along the routes were found to be highly restrictive factors by operators. In addition, various technical issues were also reported relating to charging problems and/or lack of experience. Examples include difficulties with problem diagnostics, charging restrictions specified by the manufacturer during a ‘run-in’ period before putting the vehicle in operation, and some issues related to the cold Norwegian winter climate. A number of other more minor technical issues were mostly resolved quickly.
For BE-LDVs, the operators interviewed mentioned challenging power peaks when charging many vehicles simultaneously. Challenges also occurred relating to the availability of grid power when building new terminals, and incentives for the development of charging infrastructure at rented locations. Some operators called for a form of central coordination for smarter charging for the business sector, and load distribution/capacity utilization.

Ownership Costs

The interviews provided information on different cost components, such as for the chassis, energy, maintenance, chargers, and operation. For reasons of confidentiality, these are not explicitly discussed here, but were an important input for modelling total cost of ownership for different propulsion systems. In general, however, the interviews suggested that at current cost levels, BE-vehicles had purchase costs of between ~1.5 and 4 times the cost of corresponding ICE-vehicles, depending on vehicle classes. Operators agree that BE-vehicles have significantly lower costs of operation than ICE vehicles. This is particularly due to savings on energy costs and road toll charges; maintenance costs, too, are reported to be lower than for ICE vehicles. However, the largest maintenance costs usually occur after 4 to 5 years. Battery changes were not expected to be required during the effective vehicle lifetime, but it is known that these may be expensive. Overall, due to, e.g., the high purchase costs, many operators expect that the e-trucks will be more expensive over their lifetime than a corresponding ICE truck.

4.2. Electrification Potential Given Typical Vehicle User Patterns

4.2.1. Potential for Electrification in the Near Term

The main barriers for the adoption of BE-HDVs in the near term stem from driving range limitations of battery-electric (pilot) vehicles, limited engine power, and, as a result, limitations to the possibility to drive with a trailer. To assess the extent of these barriers, we looked at use patterns and the composition of the Norwegian commercial vehicle fleet.
From an analysis of base data from Autosys and Statistics Norway’s survey of trucks, we found that the majority of Norway’s commercial vehicle fleet (ca. 75%) consists of trucks of up to five years old, of which most have engines ≥500 HP and are driven with a trailer. In light of limitations in terms of power and availability of alternatives to diesel, this suggests that near term electrification of this segment of trucks is unlikely.
For trucks with engines <500 HP, the trucks not using trailers in the reporting week (which are considered most suitable for electrification) constitute 16.6% of the total fleet, while those using trailers equate to another 7.5%. For the latter, trailer use often encompasses lighter city trailers, i.e., leaving some potential for electrification.
In terms of mileage, we found that newer trucks constitute an even larger share (85%) than in terms of vehicle number. Further, over 70% of mileage with newer trucks is carried out with engines ≥500 HP, mostly with a trailer attached. This is noteworthy since it is largely the segment for newer trucks where user requirements are set. These observations also confirm that based on current use patterns, electrification in the near term seems unlikely for a large part of the Norwegian commercial vehicle fleet.
Regarding segments where near-term electrification is most likely, and taking into account also variations in daily use, we found that trucks with engine power <500 HP and maximum daily mileages up to 200 km constitute only 3% (without trailer) and 1% (with trailer) of the total mileage driven with newer trucks. This indicates that with current technological limitations, the electrification potential in terms of vehicle-km that can be electrified is currently small. The potential might increase when access to charging infrastructure improves, supporting longer daily driving distances.
After our assessment of engine power and trailer use, we focused on differences between categories of trucks (with engines <500 HP, up to 5 years old, and without trailer (except for tractors for semitrailer). In this segment, trucks with closed chapel make up the largest share of mileage (ca. 50%), particularly for the driving of shorter daily distances. Tractor units with semitrailer constitute about a quarter of total mileage, but are mostly used on longer distances. Special trucks (e.g., refuse collection trucks and crane truck), in turn, stand for 20% of total mileage, in part, over shorter daily distances, while trucks with platform body and tank trucks make up only small shares of driving in this segment.
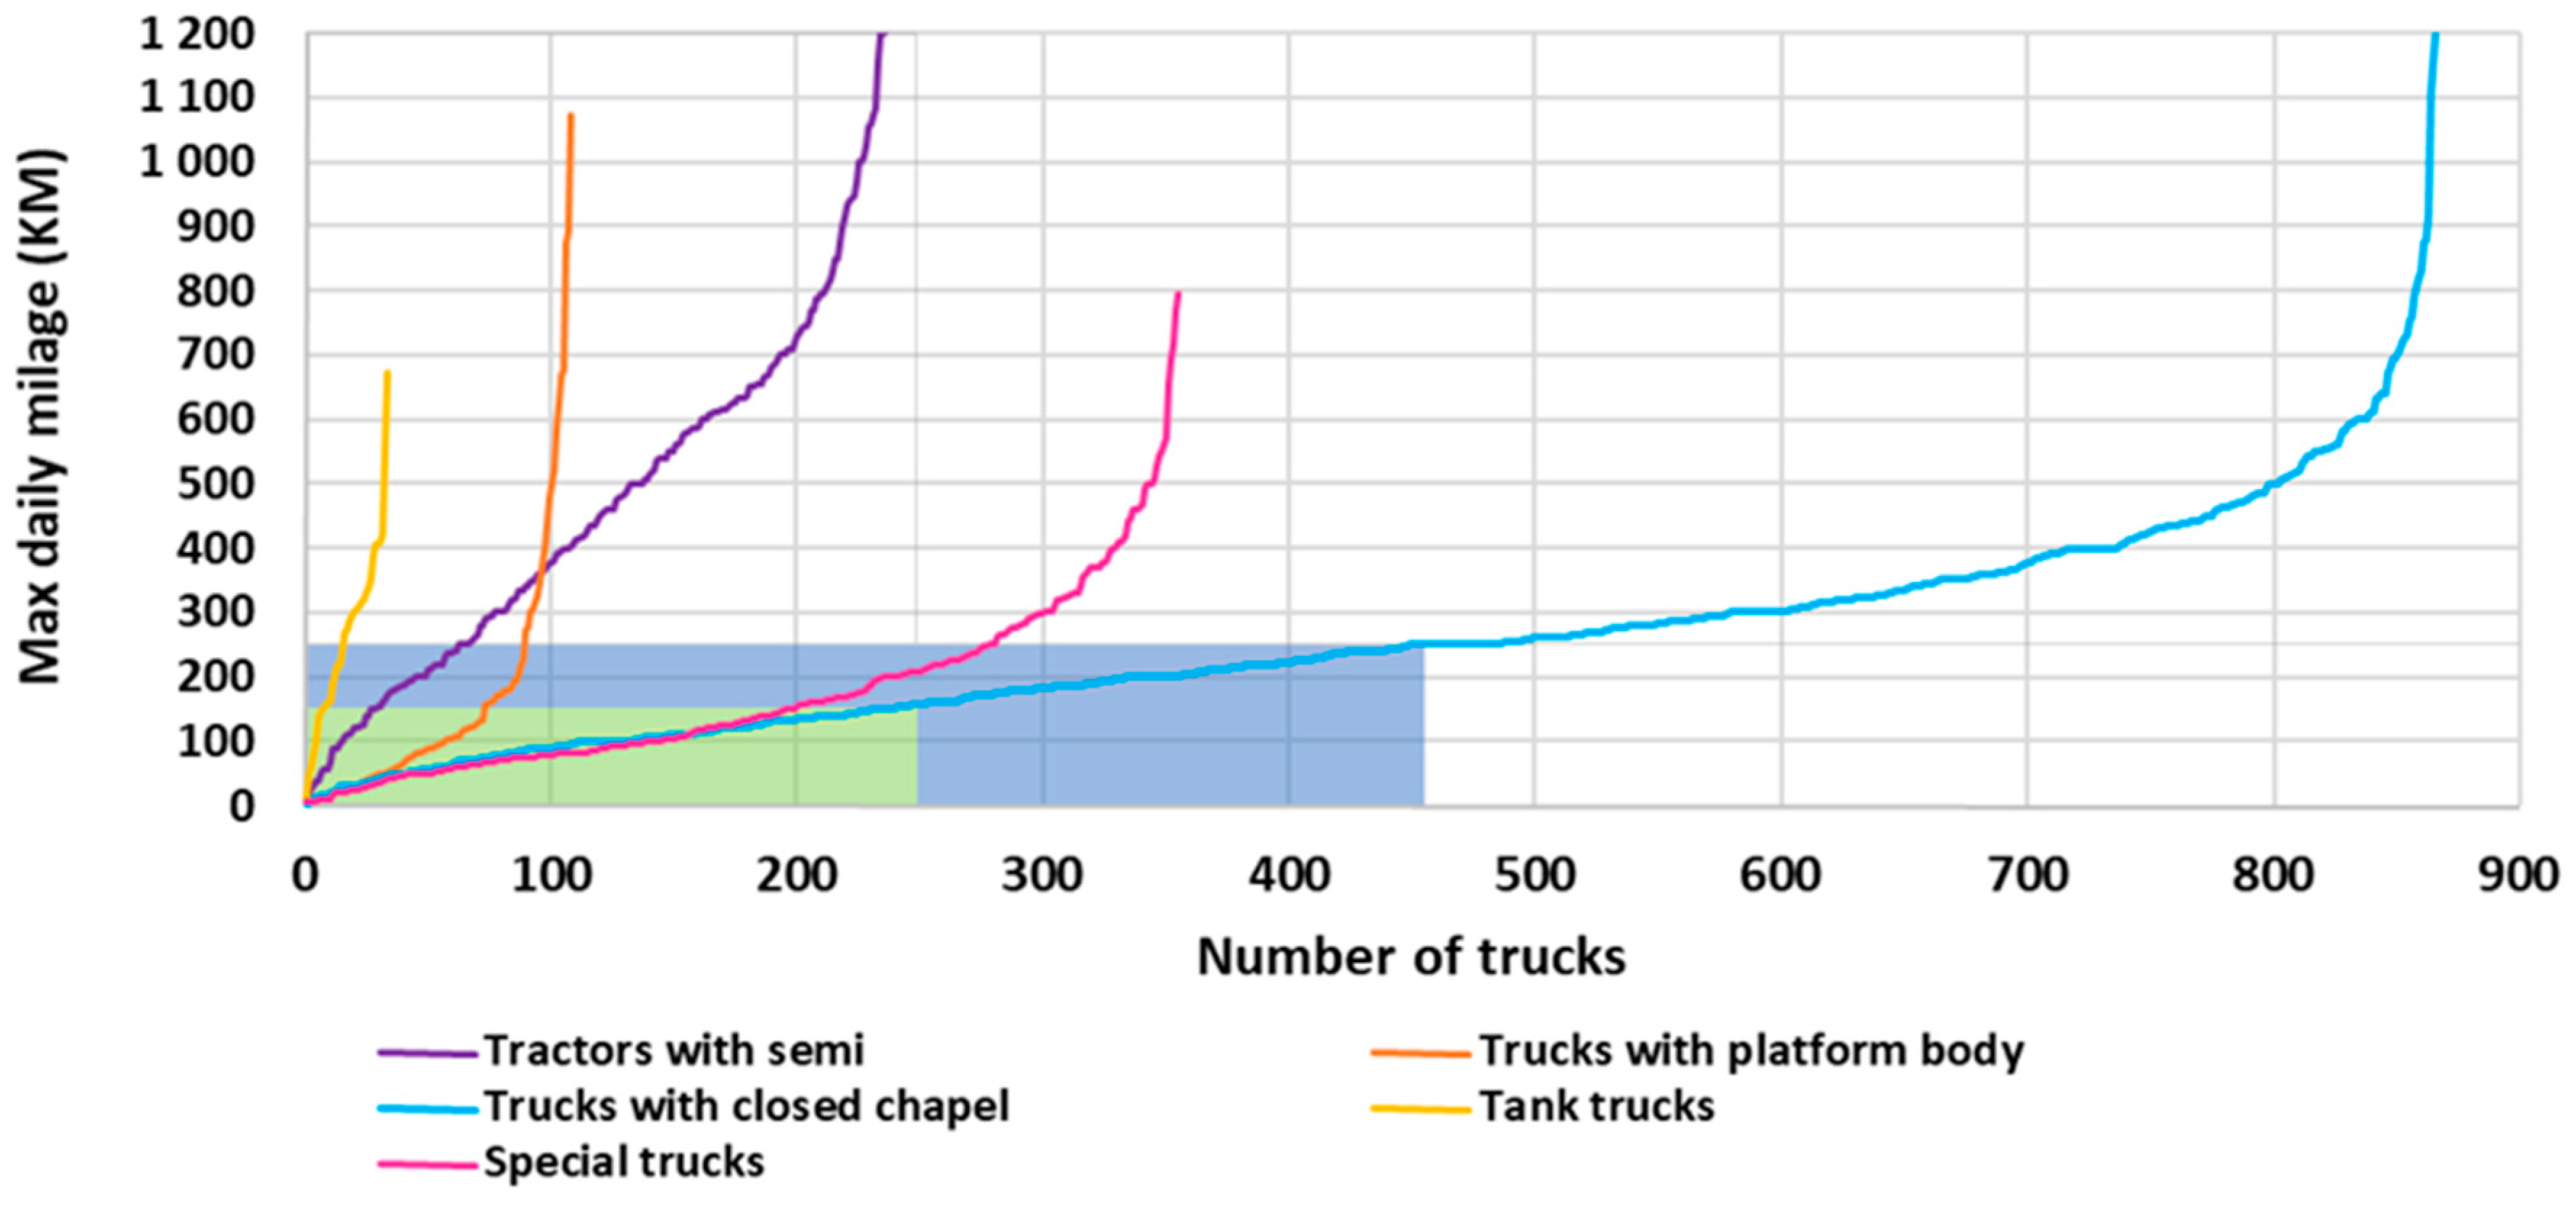
To investigate range limitations, we further looked at the maximum daily mileage for each truck, as reported in the reporting week for the survey of trucks. Figure 2 shows an illustration of these maximum daily mileages in ascending order for different truck categories. Where daily mileages of a vehicle are below 150 km (the assumed all-electric driving range on a full battery without requiring daytime charging), vehicles are assumed to have potential for electrification (green-shaded area). For daily mileages between 150 and 250 km, we consider that a certain additional electrification potential exists, provided the availability of sufficient daytime charging opportunities or improved batteries (blue-shaded area).
Figure 2 shows that special trucks and trucks with closed chapel have most vehicles in the segment with potential for electrification, thereby constituting the main market for near-term electrification. This is confirmed by our case study, as early pilots with e-trucks were carried out with distribution and refuse collection trucks. For the other vehicle categories, maximum daily driving distances exceed what can currently be supported by battery-electric alternatives.

4.2.2. Potential for Electrification in a Longer Term

In a longer term, firms owning multiple trucks might have some flexibility to redistribute transport routes between vehicles, e.g., by assigning BE-trucks more to shorter-distance transport of volume goods. This flexibility is not easy to quantify because the transport industry is very fragmented and further consists of both hire-transporters (with many small firms) and own-transporters. Although we do not have data on the share of firms carrying out own transport, in our sample, own-transport constitutes 27% of trucks but only 18% of mileage. This suggests that on average, own-transport is carried out with smaller vehicles driving shorter mileages than hire-transport, implying that own-transport is more suitable for electrification. Own-transport vehicles are also more likely to be operated from only one terminal and can thus more easily be charged overnight. The fact that vehicles used for own-transport are, on average, older, however, works in the opposite direction.
Even with route redistribution and more abundant charging opportunities in the longer term, several challenges for the electrification of trucks remain, in particular relating to engine power, driving ranges, the trade-off between battery weight and payload, and limitations to the use of trailers.
Most driving is carried out by trucks having an engine power between 500 and 600 HP (53% of trips, 54% of vehicle-km and 66% of tonne-km), while driving with larger engines makes up relatively small shares. This suggests that if the majority of transport assignments are to be carried out with e-trucks in Norway, e-trucks with and engine power of up to 600 HP would be have to be available in the market.
With regard to driving ranges, Table 3 illustrates the distribution of daily mileages for newer trucks, for different engine powers.
The table shows that more than a quarter of all driving with trucks in Norway is carried out by vehicles with daily mileages of up to 100 km, a fifth by vehicles with daily mileages between 100 and 200 km, and around 13% by vehicles with daily mileages between 200 and 300 km. Although a sizable share of driving is done with (much) higher daily mileages, this suggests that if batteries of e-trucks could support a vehicle range of 300 km (alongside engine powers up to 600 HP), this could give a potential for electrification for a large share of transport.
With regard to the weight of batteries, we looked at mileages driven with and without trailer for trucks ≤5 years old. Here, we found that for almost 79% of mileage with cargo, it is volume and not weight that fills up capacity and constitutes the capacity dimensioning factor. This suggests that the extra weight of batteries might not be as critical as is sometimes assumed. Furthermore, a proposal adopted by the European Parliament in April 2019 opens up for a two-tonne additional total vehicle weight allowance for zero-emission trucks [37,38]. This corresponds to the weight of about 200 kWh of batteries, and possibly more in the future, as the energy density of lithium-ion battery cells has been increasing by around 5–7%/year [39].
Next, we looked at the distribution of total mileage without trailer attached (as it is the vehicle, not trailer, that is most crucial) by capacity utilization and vehicle’s maximum allowed total weight. Here, we found that, respectively, three quarters and a fifth of total mileage is driven by vehicles with maximum total weights between 10 and 20 tonnes and 20 and 30 tonnes. Driving with smaller vehicles only constitutes a fraction of total mileage. More importantly, for over 80% of total mileage driven with cargo, at least 20% of the vehicles’ weight capacity is unutilized. Particularly for vehicles with payloads over 10 tonnes, which constitute most of mileage with cargo, this indicates that there would often be sufficient ‘weight capacity’ to carry several tonnes of battery.
Finally, we looked at limitations on the use of trailers. Here, we found that 45% of trips are driven without trailer attached, particularly by trucks with engines between 200 to 600 HP, and of those, particularly with largest engines in this interval. In terms of mileage, rather than trips, the share of driving without trailer is only 28%. This indicates that trips without trailer are on average considerably shorter than trips where trailers are used.
There may be variations in how a vehicle is used over a year that may reduce the potentials described above. The datasets used only cover 1 week of trucking. A truck that is not fully utilizing the capacity during this week could potentially be doing it another week of the year. BE-trucks may thus reduce the flexibility of some operators to take on different transport assignments over the year.

4.3. Cost Competitiveness of Electric vs. ICE Operation

In Section 3.3., we described the development of a model for comparing decomposed ownership costs of different propulsion technologies. For readability, results from our comparisons are presented in two tables. Table 4 shows decomposed ownership costs for light distribution trucks based on the current early stage of technological maturity for BE- and FCHE-alternatives, while Table 5 presents a similar decomposition for the scenarios with small-scale series production and mass production of electric vehicles, including a reduction hydrogen fuel prices. For conciseness, several smaller cost components were aggregated. Components that differ significantly between technologies or that might be used to create policy incentives, however, are presented separately. Wage costs are shown to illustrate their magnitude compared to other cost drivers.
Table 4 illustrates that in today’s early stage, ownership costs for light distribution vehicles with electric propulsion are considerably higher than for ICE-based propulsion systems. Compared to diesel vehicles (0.95 EUR/km), ownership costs for BE-vehicles (1.48 EUR/km) and FCHE-trucks (2.23 EUR/km) are, for example, 57% and 136% higher, respectively. Although not shown in further detail here, our calculations show that these figures are 55%/128% for heavy distribution trucks and 92%/161% for tractors for semitrailers. Compared to light distribution trucks, differences stem primarily from differences in investment cost premiums and fuel/energy consumption. It can further be seen that at 0.93 EUR/km, wage costs are of a similar order of magnitude as vehicle-ownership costs for light distribution vehicles with ICE. Our estimates on operational costs for both battery- and hydrogen-electric trucks fall within the ranges identified in a review of different studies by Plötz et al. [9].
Table 5, in turn, shows that small-scale series production considerably reduces ownership costs for electric trucks. For FCHE light distribution trucks, per-km costs fall to 1.54 EUR (at current hydrogen prices), or 1.41 EUR if prices of hydrogen were to fall by half (driven by higher demand and larger-scale production). Even at these prices, however, ownership costs for FCHE vehicles remain considerably higher compared to ICE-trucks. For BE-trucks, in turn, ownership costs under small-scale series production, at 0.98 EUR/km, approach those of diesel trucks at typical mileages.
For the scenario with mass production, we found that ownership costs for battery-electric vehicles fall below those of ICE-vehicles. At this point, FCHE-trucks are still more expensive at annual mileages of 45,000 km, but may nevertheless have potential in specific use cases, e.g., within long-haul transport, where BE-operation yields more limitations.
When focusing on individual cost components, we see that capital costs, albeit decreasing with technological maturity stage, remain the main cost driver for electric trucks in the foreseeable future. Administration and insurance costs and general levies such as Norway’s annual weight fee, are only minor costs drivers. Even though the weight fee has an environmental component, this component plays such a small role that its effects are marginal at most. Costs for washing, consumables, and tyres, too, are only moderate cost drivers, and not expected to differ between technologies. Costs for general maintenance, in turn, are expected to be lower for electric vehicles than for ICE, but savings make up a minor share of TCO.
Looking at energy-related expenses, however, we found considerable differences. For diesel vehicles, in addition to fuel costs, operators pay a CO2-levy and road use levy (together equaling ~0.26 EUR/km), while energy costs for biodiesel and biogas vehicles are of a similar order. On top of this come road toll charges of around 0.14 EUR/km. Energy costs for BE-vehicles, in turn, are much lower, at under 0.05 EUR/km (or around 0.07 EUR/km with only fast charging). For FCHE-vehicles, energy costs at current prices are still relatively high, but could fall towards 0.13 EUR/km. These results show that savings on operation costs for electric vehicles increase with annual mileage, particularly due to lower energy costs per km, but also due to toll savings and to a lesser extent, savings on maintenance.
Just as distance-dependent costs decrease with increasing annual mileages, capital costs (derived from the investment base and premium cost) will also decrease with annual driving distances. To illustrate this, Table 6 summarizes at what annual mileages BE- and FCHE-trucks may become cost-competitive with corresponding ICE-trucks. Results are presented for light distribution trucks, heavy distribution trucks, and tractors for semitrailer.
The table shows that in the current early market phase, e-trucks cannot compete with the costs of ICE-based vehicles, except for when mileages would be unrealistically high in light of limitations to the driving range set by current battery technology.
In the scenario assuming small-scale series production, our calculations show that BE-vehicles become cost competitive compared to diesel vehicles at mileages between 43,000 and 58,000 km. The reason for BE-light distribution trucks reaching cost-parity versus diesel at lower mileages than heavy distribution trucks is that the cost premium of investment is relatively high compared to savings on energy costs. Again, it is important to remember that estimates on cost premium and fuel consumption are uncertain, and that fuel consumption is affected by load weight and topography. Data on vehicle usage, e.g., from Statistics Norway’s Survey of Trucks, indicate that such annual mileages are not unusual for newer diesel-based trucks. Provided that limitations to range, payload etc., are reduced, e-trucks may thus become a feasible alternative.
Finally, in the scenario assuming mass production, we found that BE-vehicles become cost-competitive compared to diesel operation starting from annual mileages between 19,000 and 23,000 km, and at even lower mileages compared to biodiesel and biogas vehicles. These findings indicate that even when advantages such as toll exemptions would be reduced, BE-vehicles may prove cost-competitive alternatives.
For FCHE-trucks, in turn, we find that ownership costs are higher than for BE-trucks in all scenarios, because both cost premiums of investment and energy costs per km are expected to remain higher, even when hydrogen prices are reduced by half. Compared to ICE-based trucks, we find that FCHE-operation may become cost-competitive in a stage of mass production at annual mileages between 50,000 km (tractors) and 65,000 km (heavy distribution trucks). Such mileages are not uncommon in many use cases (particularly for tractors). Even though BE-operation might be cheaper, limitations might, therefore, make hydrogen the alternative of choice in cases with, e.g., intensive use, long-haul unsuitable for BE-trucks, or when cost premiums for FCHE trucks are reduced more than is assumed here.

4.4. Socio-Economic Costs of Phasing-in Zero-Emission Technologies

With regard to the socio-economic costs of phasing-in zero-emission technologies, Section 3.4. describes components that constitute public and private costs and benefits. Table 7 shows how these public and private costs and benefits sum to socio-economic costs, and what this implies for society’s costs per tonne reduction in CO2-emissions. Figures are for light distribution trucks and compared to a diesel truck, assuming today’s early phase of technological maturity (and cost levels) for electric vehicles. To illustrate the role of mileage, figures are further presented both for typical annual mileages of 45,000 km and lower mileages of 20,000 km.
From the table, it can be seen that a transition to alternative propulsion technologies yields socio-economic costs of between EUR 43,000 and 353,000 per truck when assuming typical mileages. Consequently, the costs of reducing CO2-emissions by one tonne vary from EUR 340 for biogas to 2760 for FCHE trucks, while it is EUR 1440 for BE-trucks.
At low annual mileages, socio-economic costs from a transition to biogas and hydrogen are slightly lower, while for electric propulsion, they are somewhat higher. These differences are due to external damage costs from diesel operation being lower at lower mileages, but also savings on energy costs and maintenance from a transition to alternative propulsion being lower. Since reductions in CO2-emissions are much lower with less intensive vehicle use (while cost premiums of alternative propulsion trucks remain the same), the socio-economic costs per unit CO2 reduced are considerably higher at lower mileages.
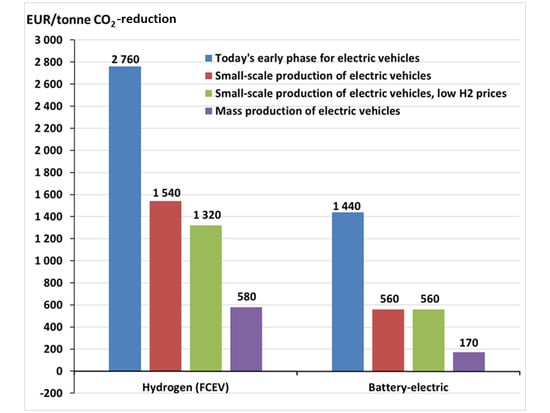
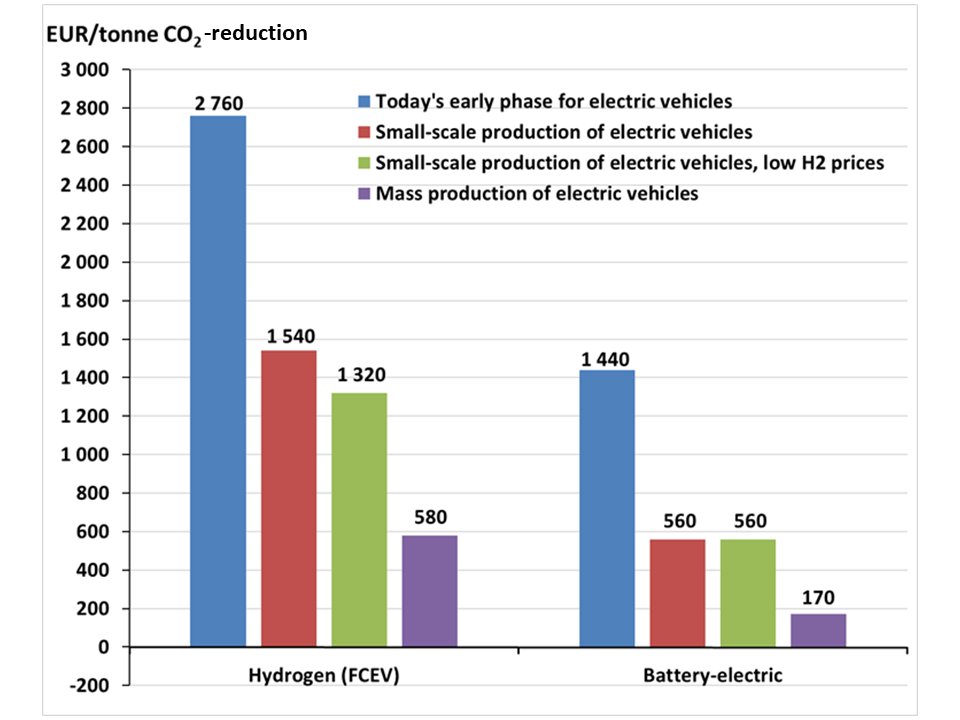
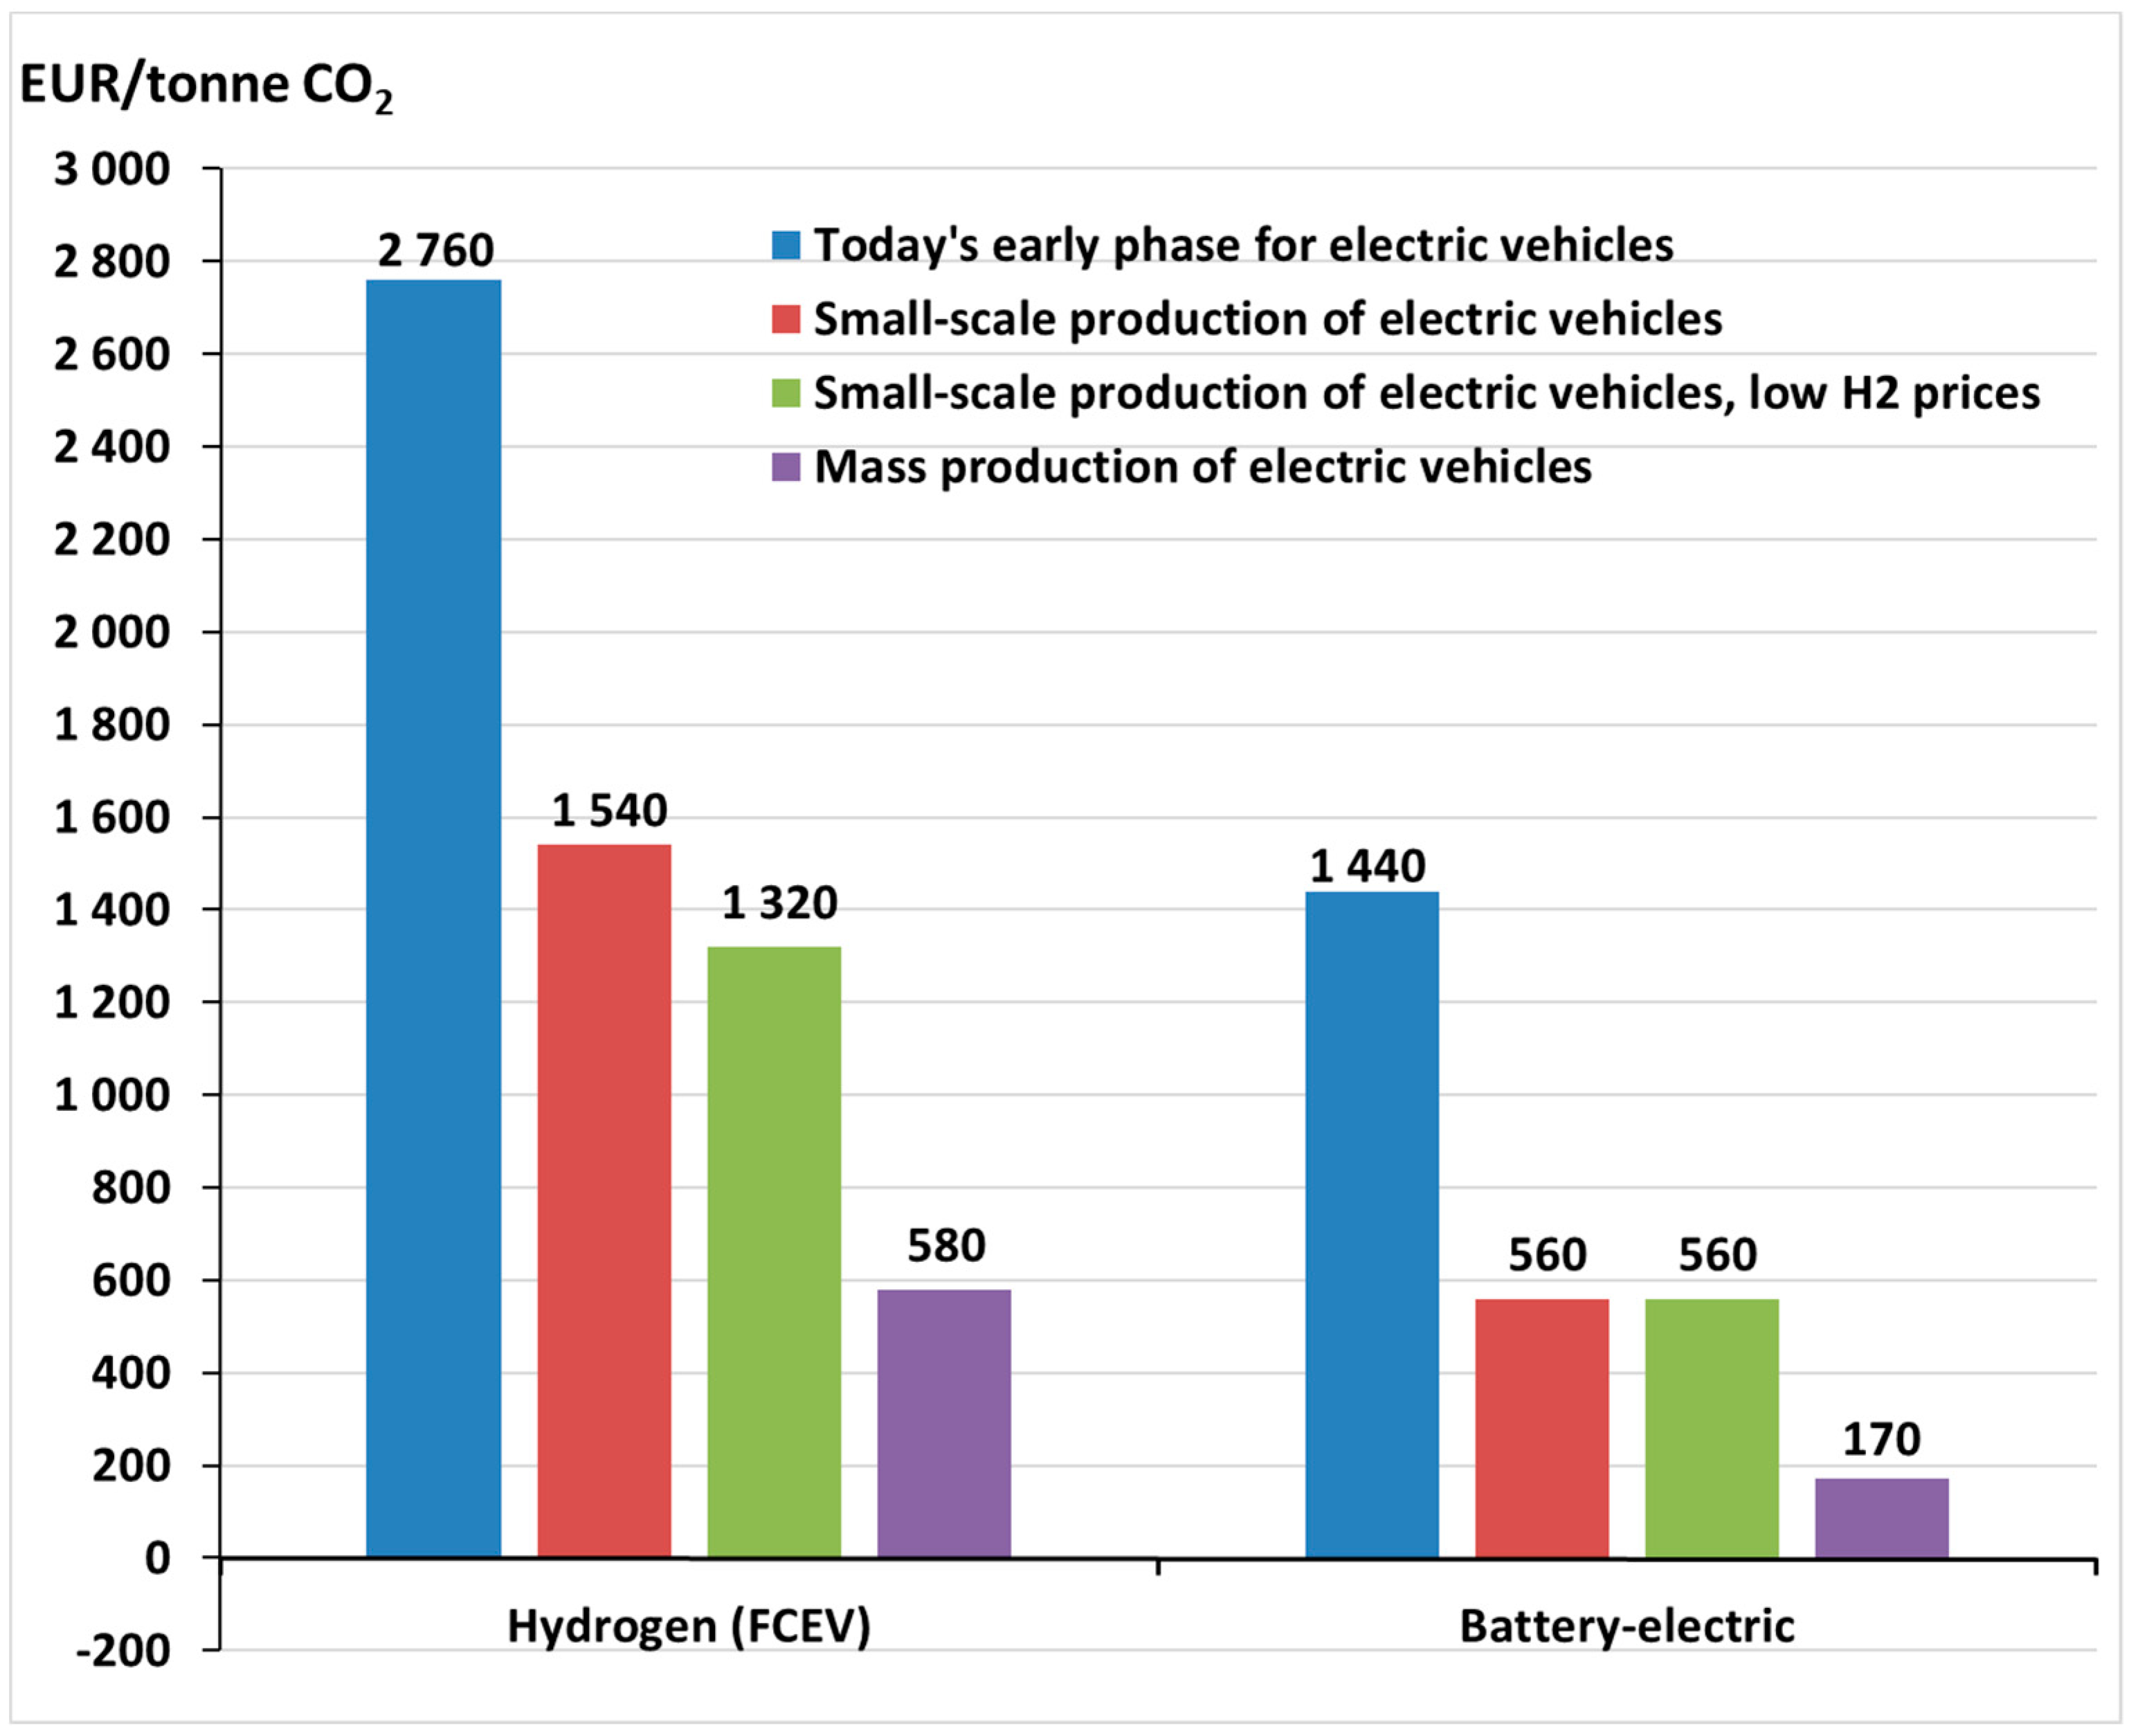
Figure 3 illustrates how socio-economic costs per reduced tonne in CO2-emissions go down in future scenarios with larger scales of production (i.e., lower investment cost premiums) and at typical mileages.
The figure clearly shows that socio-economic costs for reducing CO2-emissions towards alternative technology trucks become lower when electric propulsion systems reach more mature stages. At the same time, it is assumed that the costs of FCHE-vehicles will remain higher than for BE-vehicles. This is due to both higher cost premiums of investments and lower savings on energy costs compared to conventional trucks. Moreover, Weken et al. [26] concluded that although FCHE technology is considerably more expensive and less technologically mature than BE-trucks, it could prove a solution to the range and charging time challenges of BE-trucks.

5. Discussions and Conclusions

Currently, the adoption of zero-emission commercial vehicles in Norway is limited in light of the ambitious targets for the phasing in of these vehicles stated in Norway’s National Transport Plan for 2025 and 2030, and the contribution that is needed from road transport to be able to meet Norway’s CO2-reduction objectives by 2030. At the present time, only a few BE-trucks are in operation in Norway, and all of these are conversions of vehicles with diesel engines, with purchases being driven mostly by strategic considerations (such as image, having an early mover advantage etc.). It is expected that a limited number of small-scale series-produced BE-trucks will be delivered to the Norwegian market during the first half of 2020. These are expected to be distribution trucks with 2 and 3 axles. According to Weken et al. [26], most battery-electric trucks announced for market introduction are for lower weight classes.
Experiences from the few pilots in Norway with BE-trucks have been promising (especially for waste and recycling trucks), but not in all respects. Although operators are positive about working conditions, energy savings and lower operating and maintenance costs, they have generally had to perform considerable tailoring of route/location choices. Weken et al. [26] also found that transport firms, drivers and customers generally give positive feedback on their experience with electric trucks. Nonetheless, a number of issues for the Norwegian e-trucks have also been experienced, varying from minor teething problems to a couple of major issues requiring battery/part changes. A number of challenges were, for example, indicated with regard to lower traction than the operators need, and challenges with charging, range and vehicle capacity reductions. Experience with use in (cold) winter periods has, so far, been limited, but could bring to light additional challenges.
Looking at typical user patterns for light distribution trucks with ICE for base data from Statistics Norway’s truck survey, we found that the majority of newer trucks have annual mileages that considerably exceed the current capability of a BE-alternative. Nonetheless, there is also a sub-segment where there is potential for electrification, if daily driving patterns are relatively uniform or the truck is operating in a fixed shuttle service between two locations, giving an opportunity for fast charging connected to loading and unloading. The same opportunity will occur if the truck is visiting the same terminal, storehouse or refuse plant during the day. Looking at day-to-day variation, however, indicates that in many cases, BE-operation using current technology levels will require considerable route tailoring and daytime charging.
If a transition to electric heavy-duty transport is to be made, charging infrastructure must be further developed. Although most operators currently use depot charging, an emphasis is increasingly being placed on fast charging. One operator, for example, suggested that the Norwegian Public Roads Administration should establish fast chargers for HDVs at all vehicle control stations (weighing stations) in the main road network.
It should be noted that cost estimates for the current early production phase are based on the interviews, feedbacks, and information discussed in Section 4.1, while for future stages of production maturity, cost estimates (and thus results) are based on a first rough approach, as described in Section 3.3. Particularly for FCHE-electric vehicles, cost development paths are necessarily uncertain, since very limited information is available, and information that is available is based on a very early development stage, characterized by small production volumes of all components. Both for BE- and FCHE-vehicles, we have in progress a more elaborate and detailed techno-economical approach for expected developments in costs of alternative technologies, in order to improve our estimates.
Weken et al. [26] found that without subsidies, BE-trucks are so far not economically feasible because of cost premiums, which are high due to expensive low-volume niche production (largely conversions). Furthermore, higher mileages yield higher savings on operation costs, but achieving higher mileages is often hindered by technological limitations. From our analysis of cost-competitiveness of different propulsion technologies and different maturity levels, it also appears important to keep incentives to foster further diffusion of zero-emission trucks, such as ENOVA-support schemes and exemptions of road toll charges. This will reduce the barrier that zero-emission vehicles have significantly higher investment costs than similar vehicles with ICE. The same applies for having an emphasis on environmental characteristics in public (and private) tenders, as electric solutions might otherwise not be selected due to their current higher cost. Access to bus lanes for zero-emission trucks will additionally help make these more attractive, because it makes driving times during rush hours in urban areas shorter and more predictable, thus helping to reduce time-dependent costs for such trucks.
Incentives for zero-emission trucks are also important to create demand, in order to speed up the manufacturers’ start-up of series productions. Altenburg et al. [4] also considered that larger-scale production of electric vehicles is needed to lower the price, improve the business case, and increase adoption. Our analysis of ownership costs illustrated that reductions in investment premiums of electric vehicles, through cheaper series and mass production, go a long way to improving the cost-competitiveness of zero-emission solutions compared to ICE-trucks.
In the short term, several of the operators interviewed for this study intend to expand the use of BE-vehicles. Driven by the Norwegian Government’s ‘Klimasats’ initiative for transitions to low-emission solutions in the public sector and tender requirements for zero-emission operation, a number of BE-refuse collection vehicles have for example been ordered, with delivery in 2020 (rebuilt from ICE). In addition, multiple operators have placed pre-orders for Tesla tractor units, but emphasize that these are very preliminary given a number of yet unanswered questions on specifications and (tracking) capacity.
In summary, findings in this paper suggest that there might be a growing potential for electrification of commercial vehicles in Norway. Nevertheless, in the years to come, incentive schemes, charging solutions, policy facilitation, and technological developments will remain important aspects for zero-emission adoptions.
With regard to the socio-economic costs of phasing-in zero-emission technologies, we found that costs are currently highest for FCHE-vehicles, and lowest for biogas. At typical mileages, socio-economic costs per tonne CO2 reduced versus diesel operation, lie at EUR 340 for biogas, EUR 1440 for BE-, and EUR 2760 for FCHE-trucks. In a scenario with mass production and lower cost premiums of electric vehicles, these costs are calculated to fall to EUR 580/tonne for FCHE-vehicles to EUR 170/tonne for BE-vehicles.

Author Contributions

Conceptualization, I.B.H. and E.F.; Methodology, I.B.H., E.F., D.R.P., R.J.T.; Formal Analysis, D.R.P., I.B.H., R.J.T. and E.F.; Investigation, D.R.P., I.B.H., E.F.; Data Curation, I.B.H., D.R.P., R.J.T.; Writing—Original Draft Preparation, D.R.P., R.J.T., E.F., I.B.H.; Writing—Review & Editing, D.R.P., I.B.H., R.J.T., E.F.; Visualization, D.R.P., R.J.T., I.B.H.; Supervision, I.B.H. and E.F.; Project Administration, I.B.H. and E.F.; Funding Acquisition, E.F. All authors have read and agreed to the published version of the manuscript.

Funding

This work was performed and funded within MoZEES, a Norwegian Centre for Environment-friendly Energy Research (FME), co-sponsored by the Research Council of Norway (project number 257653) and 40 partners from research, industry and the public sector.

Conflicts of Interest

The authors declare no conflict of interest.

References

  1. Norwegian Government. Nasjonal Transportplan 2018–2029, Meld. St. 33 (2016–2017); Government proposal adopted by Norwegian Parliament; Norwegian Government: Oslo, Norway, 2017.
  2. Nordic Council of Ministers. Measures for Reduced CO2-Emissions from Freight Transport in the Nordic Countries; TemaNord-Report; Nordic Council of Ministers: Copenhagen, Denmark, 2019. [Google Scholar]
  3. Jordbakke, G.N.; Amundsen, A.; Sundvor, I.; Figenbaum, E.; Hovi, I.B. Technological Maturity Level and Market Introduction Timeline of Zero-Emission Heavy-Duty Vehicles; TØI-/MoZEES-Report 1655; Institute of Transport Economics: Oslo, Norway, 2018. [Google Scholar]
  4. Altenburg, M.; Anand, N.; Balm, S.H.; Ploos van Amstel, W. Electric freight vehicles in city logistics: Insights into decision-making process of frontrunner companies. In Proceedings of the European Battery, Hybrid and Fuel Cell Electric Vehicle Congress, Geneva, Switzerland, 14–16 March 2017. [Google Scholar]
  5. Huismans, M. Electric Trucks: Wishful Thinking or the Real Deal? The Potential of Electric Tractor-Trailers as a Means of CO2 Reduction in the Netherlands. Master’s Thesis, Delft Technical University, Delft, The Netherlands, 21 June 2018. [Google Scholar]
  6. Taefi, T.T.; Stütz, S.; Fink, A. Assessing the cost-optimal mileage of medium-duty electric vehicles with a numeric simulation approach. Transp. Res. D Transp. Environ. 2017, 56, 271–285. [Google Scholar] [CrossRef]
  7. Kleiner, F.; Beermann, M.; Catay, B.; Beers, E.; Davies, H.; Lim, O.C. Current status of the electrification of transport logistic vehicles—Early niche markets and commercialization opportunities. In Proceedings of the European Battery, Hybrid and Fuel Cell Electric Vehicle Congress, Geneva, Switzerland, 14–16 March 2017. [Google Scholar]
  8. Anderhofstadt, B.; Spinler, S. Factors affecting the purchasing decision and operation of alternative fuel-powered heavy-duty trucks in Germany—A Delphi study. Transp. Res. D Transp. Environ. 2019, 73, 87–107. [Google Scholar] [CrossRef]
  9. Plötz, P.; Gnann, T.; Wietschel, M.; Kluschke, P.; Doll, C.; Hacker, F.; Blanck, R.; Kühnel, S.; Jöhrens, J.; Helms, H.; et al. Alternative Drive Trains and Fuels in Road Freight Transport–Recommendations for Action in Germany; Report by Öko-Institut e.v.; Ifeu Institute for Energy and Environmental Research and Fraunhofer ISI: Heidelberg, Germany, 2018. [Google Scholar]
  10. Miller, M.; Wang, Q.; Fulton, L. Truck Choice Modeling: Understanding California’s Transition to Zero-Emission Vehicle Trucks Taking into Account Truck Technologies, Costs, and Fleet Decision Behavior; Research Report from the National Center for Sustainable Transportation at UC Davis; University of California: Davis, CA, USA, 2017. [Google Scholar]
  11. ICCT. Transitioning to Zero-Emission Heavy-Duty Freight Vehicles; White Paper by the International Council on Clean Transportation; International Council on Clean Transportation: Washington, DC, USA, 2017. [Google Scholar]
  12. IEA. Global EV Outlook 2018: Towards Cross-Modal Electrification; Report by the International Energy Agency; International Energy Agency: Paris, France, 2018. [Google Scholar]
  13. Fulton, L.; Miller, M.; Burke, A.; Wang, Q.; Yang, C. Technology and Fuel Transition Scenarios to Low Greenhouse Gas Futures for Cars and Trucks in California; Report by UC Davis Institute of Transport Studies; University of California: Davis, CA, USA, 2019. [Google Scholar]
  14. Barrett, S. Fuel cells power forward on the roads and for power generation. Renew. Energy Focus 2017, 18, 29–32. [Google Scholar] [CrossRef]
  15. Mulholland, E.; Teter, J.; Cazzola, P.; McDonald, Z.; Gallachóir, B.P.Ó. The long haul towards decarbonising road freight—A global assessment to 2050. Appl. Energy 2018, 216, 678–693. [Google Scholar] [CrossRef]
  16. ENOVA. Prosjektliste 2012–2017. Available online: https://www.enova.no/om-enova/om-organisasjonen/prosjektliste-2012--2018/ (accessed on 11 September 2019).
  17. NPRA. Forhandlerregistrering Av Nye Og Brukte Kjøretøy. Available online: https://www.vegvesen.no/kjoretoy/Kjop+og+salg/for-forhandlere (accessed on 11 September 2019).
  18. Hovi, I.B.; Figenbaum, E.; Thorne, R.J.; Pinchasik, D.R.; Amundsen, A.H.; Hagman, R. Experiences from trials with battery electric buses in Norway. In Proceedings of the 32nd International Electric Vehicle Symposium, Lyon, France, 19–22 May 2019. [Google Scholar]
  19. Statistics Norway. Godstransport Med Lastebil. Available online: https://www.ssb.no/statbank/list/godstrans (accessed on 11 September 2019).
  20. Figenbaum, E. Can battery electric light commercial vehicles work for craftsmen and service enterprises? Energy Policy 2018, 120, 58–72. [Google Scholar] [CrossRef]
  21. Ahani, P.; Arantes, A.; Melo, S. A portfolio approach for optimal fleet replacement toward sustainable urban freight transportation. Transp. Res. D Transp. Environ. 2016, 48, 357–368. [Google Scholar] [CrossRef]
  22. Zhou, M. Life Cycle Emissions and Lifetime Costs of Medium-duty Diesel and Alternative Fuel Trucks: A Case Study for Toronto. Master’s Thesis, University of Toronto, Toronto, ON, Canada, November 2016. [Google Scholar]
  23. Madslien, A.; Steinsland, C.; Grønland, S.E. Nasjonal Godstransportmodell. En Innføring i Bruk av Modellen; TØI-Report 1429; Institute of Transport Economics: Oslo, Norway, 2015. [Google Scholar]
  24. Grønland, S.E. Kostnadsmodeller for Transport og Logistikk—Basisår 2016; TØI-and Sitma-Report 1638; Institute of Transport Economics: Oslo, Norway, 2018. [Google Scholar]
  25. Hovi, I.B.; Pinchasik, D.R. CO2-Besparelser av Forsert Innfasing av Lastebiler Med Fornybare Fremdriftsløsninger; TØI-Report 1479; Institute of Transport Economics: Oslo, Norway, 2016. [Google Scholar]
  26. Weken, H.; Jousma, F.; Bestebreurtje, E.; Kroon, R. Electrifying freight transport in Europe. In Proceedings of the 32nd International Electric Vehicle Symposium, Lyon, France, 19–22 May 2019. [Google Scholar]
  27. Sen, B.; Ercan, T.; Tatari, O. Does a battery-electric truck make a difference? Life cycle emissions, costs, and externality analysis of alternative fuel-powered Class 8 heavy-duty trucks in the United States. J. Clean. Prod. 2017, 141, 110–121. [Google Scholar] [CrossRef]
  28. Sengupta, S.; Cohan, D.S. Fuel cycle emissions and life cycle costs of alternative fuel vehicle policy options for the City of Houston municipal fleet. Transp. Res. D Transp. Environ. 2017, 54, 160–171. [Google Scholar] [CrossRef] [Green Version]
  29. Norwegian Environment Agency. Miljøavtale Med CO2-Fond: Modellering av Kostnader og Potensial for Utslippsreduksjoner; Norwegian Environment Agency-Report M1047; Norwegian Environment Agency: Oslo, Norway, 2018.
  30. Kolbenstvedt, M.; Figenbaum, E. Competitive Electric Town Transport. Main Results from COMPETT—And Electromobility+ Project; TØI-Report 1422; Institute of Transport Economics: Oslo, Norway, 2015. [Google Scholar]
  31. Jadun, P.; McMillan, C.; Steinberg, D.; Muratori, M.; Vimmerstedt, L.; Mai, T. Electrification Futures Study: End-Use Electric Technology Cost and Performance Projections Through 2050; Laboratory-Report TP-6A20-70485 7830; National Renewable Energy: Golden, CO, USA, 2017.
  32. Satyapal, S. Fuel Cell Technologies Office Update. Presentation by the U.S. Department of Energy; 2018. Available online: https://www.hydrogen.energy.gov/pdfs/htac_dec18_01_satyapal.pdf (accessed on 3 September 2019).
  33. Uno-X. Spørsmål og Svar. Available online: https://unox.no/hydrogen/sporsmal-og-svar/hydrogen-sporsmal-og-svar#4 (accessed on 3 June 2019).
  34. Greensight. Hydrogen i Tungtransporten; Report by Greensight; Greensight: Boston, MA, USA, 2017. [Google Scholar]
  35. Rødseth, K.L.; Wangsness, P.B.; Veisten, K.; Elvik, R.; Klæboe, R.; Thune-Larsen, H.; Fridstrøm, L.; Lindstad, E.; Rialland, A.; Odolinski, K. Skadekostnader ved Transport; TØI-Report 1704; Institute of Transport Economics: Oslo, Norway, 2019; under publication. [Google Scholar]
  36. Thune-Larsen, H.; Veisten, K.; Rødseth, K.L.; Klæboe, R. Marginale Eksterne Kostnader ved Vegtrafikk med Reviderte Ulykkeskostnader; TØI-Report 1307; Institute of Transport Economics: Oslo, Norway, 2014; rev 2016. [Google Scholar]
  37. European Parliament. CO2 Emission Performance Standards for New Heavy-Duty Vehicles; Legislative resolution of 18 April 2019; European Parliament: Strasbourg, France, 2019. [Google Scholar]
  38. Transport & Environment. EU Target to Cut Truck CO2 and Boost Zero-Emission Truck Sales Must Only be the Start. Available online: https://www.transportenvironment.org/press/eu-target-cut-truck-co2-and-boost-zero-emission-truck-sales-must-only-be-start (accessed on 3 June 2019).
  39. Bloomberg New Energy Finance. Electric Vehicle Outlook. Available online: https://about.bnef.com/electric-vehicle-outlook/ (accessed on 11 September 2019).
Figure 1. Summary of the battery capacity (kWh) and charging solution (AC or DC, kW) used by the operators. The range on full charge is also shown (in red).
Wevj 11 00005 g001
Figure 2. Maximum daily mileage (km) for individual trucks in different truck categories in the sample of Statistic Norway’s truck survey. For trucks up to five years old, with engines up to 500 HP, and without trailer, except for tractors with semitrailer. Green area: potential for electrification; all-electric driving range, no daytime charging, blue area: electrification can under some circumstances be possible with current battery electric truck status. Source: Base data of Statistics Norway’s ‘survey of trucks’ for 2016 and 2017 and NPRA’s Autosys registry.
Wevj 11 00005 g002
Figure 3. Socio-economic costs for reducing CO2-emissions by one tonne, under a transition from light distribution trucks using diesel to electric propulsion. For annual mileages of 45,000 km and for multiple scenarios of production phase/technological maturities of electric trucks. Figures in EUR.
Wevj 11 00005 g003
Table 1. Overview of main cost aspects considered in the cost-comparison model. All cost comparisons exclude VAT, since firms can subtract this on incoming goods and services. Exchange rate used: 1 EUR = 9.8 NOK.
Cost CategoryMain Aspects Taken into Account
Time-dependentInvestment/capital costs (excl. subsidies); Depreciation; Residual values; Discount rate
Distance-dependentEnergy consumption & cost (base price + any levies); Road toll charges and exemptions (discounts) for zero-emission; Driving distances and mileages
Maintenance and repairGeneral maintenance; Tyre degradation; Washing, etc.
Technology-independentWage expenses; Admin and insurance costs; Annual weight fee
Table 2. Electric heavy-duty vehicle trials beginning 2017/2018 in Norway, upon which interviews were based. Source: Autosys [17] and interviews with the operators. a At the time of the interview, the operator only had experience from a test-vehicle. b Average fleet value. c Actual km/y driven at time of interview. d For a similar (existing) ICE fleet. e LIB = Lithium ion. f NaNiCl2 = Sodium nickel chloride.
Variable:ABCD aEFG
SectorDistri-butionWaste collectionWaste collectionRecyclingManufacturingWaste collectionWaste collection
Vehicle typeTruck (freight)Truck (waste)Truck (waste)Tractor (recycling)Heavy vanTruck (waste)Truck (waste)
ManufacturerMAN/EmossDennis Eagle/PVI (Renault)MAN/ Emoss/AllisonMAN/Emoss/AllisonIvecoDAF/Emoss/GeesinknorbaDAF/Emoss/Geesinknorba
Expected annual driving distance (km/y)50,000 b18,000 c80,000 d120–130,00030,00020–26,000 d16,800 d
Range, full charge (km)180140200178160120–130100–140
Number of vehicles tested121 (+1)2511
Registration year201620182018 (19)2018201820182018
Total weight (t)18.626.828.0 (50.0)40.0–45.05.612.012.0
Payload (t)5.59.718–1915–202.63.53.5
Length (m)9.09.57.87.47.27.07.0
Battery technologyLIB eLIBLIBLIBNa-NiCl2 fLIBLIB
Battery capacity (kWh)240240200 (300)30080120130
Depot charging (kW)2 × 44444444222244
Opportunity. charging (kW) 1502 × 150
Charge time (h) to 80%584.5 (to 100%)4–6 (slow)/0.3 (fast)82–83.5
Table 3. Distribution of daily mileages for trucks ≤5 years old, for different engine powers. Shares in total vehicle mileage. Source: Base data of Statistics Norway’s ‘survey of trucks’ for 2016 and 2017 and Autosys registry. Color-coding indicating good and reasonable potential for electrification with current technology (green shades), reasonable potential, some potential with extensive charging opportunities (blue), some potential when higher engine powers become available for battery-electric trucks (yellow), and less feasible in shorter term (red).
Engine Power (HP)Up to 100 km100–200 km200–300 km300–400 km400–500 km500 km and OverTotal
100–1990.1%0.1%0.0%0.0%0.0%0.0%0.2%
200–2992.5%2.2%1.1%0.6%0.2%0.2%6.8%
300–3992.8%2.8%1.1%0.7%0.2%0.2%7.7%
400–4994.7%4.4%2.9%1.0%0.6%2.2%15.7%
500–59912.4%8.3%6.6%4.1%5.3%17.6%54.2%
600–6992.1%1.1%0.9%0.6%0.8%2.7%8.2%
700+2.0%0.9%0.7%0.5%0.7%2.4%7.3%
Total26.6%19.8%13.2%7.5%7.6%25.3%100.0%
Table 4. Decomposed ownership costs for light distribution trucks. Base scenario/early stage. Figures in EUR/km. Costs are based on a period of analysis of 5 years and annual mileages of 45,000 km.
Cost ComponentDieselBiodieselBiogasFCHEBE
Base investment0.350.350.350.350.35
Investment premium-0.000.101.460.90
Wage costs (incl. social/holiday)0.930.930.930.930.93
General levies0.000.000.000.000.00
Insurance + admin0.050.050.050.050.05
Fuel/energy, excl. Levies0.140.280.250.250.05
CO2-levy0.03----
Road use levy0.09----
Premium in case of fast charging----0.02
Tyres, wash, consumables, etc.0.080.080.080.080.08
General maintenance0.070.070.070.030.03
Road toll0.140.140.14--
Total incl. wage costs1.881.911.963.162.41
Total excl. wage costs0.950.971.032.231.48
Index incl. wage costs100%101%104%168%128%
Index excl. wage costs100%103%109%236%157%
Table 5. Decomposed ownership costs for light distribution trucks. For small-scale series production with current and reduced hydrogen (fuel) prices, and for mass production. Figures in EUR/km. Costs are based on a period of analysis of 5 years and annual mileages of 45,000 km.
Cost ComponentSmall-Scale Series ProductionMass Production
DieselFCHEFCHE (Lower Fuel Price)BEFCHE (Lower Fuel Price)BE
Base investment0.350.350.350.350.350.35
Investment premium-0.770.770.400.350.17
Wage costs (incl. social/holiday)0.930.930.930.930.930.93
General levies0.000.000.000.000.000.00
Insurance + admin0.050.050.050.050.050.05
Fuel/energy, excl. Levies0.140.250.130.050.130.05
CO2-levy0.03-----
Road use levy0.09-----
Premium in case of fast charging---0.02-0.02
Tyres, wash, consumables, etc.0.080.080.080.080.080.08
General maintenance0.070.030.030.030.030.03
Road toll0.14-----
Total incl. wage costs1.882.472.341.911.921.69
Total excl. wage costs0.951.541.410.980.990.76
Index incl. wage costs100%131%125%102%102%90%
Index excl. wage costs100%163%149%104%105%80%
Table 6. Annual mileages (km) at which battery-electric vehicles (utilizing fast charging) are calculated to achieve cost-parity with other technologies. Rounded to the nearest thousand km.
Vehicle SizeFuel TechnologyEarly Market PhaseSmall-Scale Series ProductionMass Production
Light Distribution TrucksDieselUnrealistically high mileages52,000 km21,000 km
Biodiesel47,000 km19,000 km
Biogas37,000 km11,000 km
FCHEBattery-electric always cheaper
Heavy Distribution TrucksDiesel144,000 km58,000 km23,000 km
Biodiesel129,000 km52,000 km22,000 km
Biogas131,000 km40,000 km11,000 km
FCHEBattery-electric always cheaper
Tractors for SemitrailersDieselUnrealistically high mileages43,000 km19,000 km
Biodiesel39,000 km17,000 km
Biogas35,000 km10,000 km
FCHEBattery-electric always cheaper
Table 7. Socio-economic costs per vehicle under a transition from light distribution trucks using diesel to other propulsion technologies. For annual mileages of 45,000 and 20,000 km respectively, assuming the scenario for today’s early phase of technological maturity. Figures in EUR, rounded.
Fuel TechnologySocio-Economic Costs vs. Diesel Cost in EUR/Tonne CO2 ReductionSocio-Economic Costs vs. Diesel Cost in EUR/Tonne CO2 Reduction
Annual Mileage: 45,000 kmAnnual Mileage: 20,000 km
Biogas43,00034031,000550
Hydrogen353,0002760340,0005980
Battery-electric184,0001440194,0003420

