Abstract
The San Francisco Bay Area (Bay Area) leads the United States and California in the rate of electric vehicle (EV) adoption. However, EVs only represent 3% of vehicles driving on Bay Area roads. Widespread EV adoption requires that all Bay Area residents participate in the EV revolution regardless of demographics or geography. Equitable access to EVs will ensure that all Bay Area residents benefit from improved air quality, lower fuel and maintenance costs, and a better driving experience. Below, we delve into the unique EV market in the Bay Area and present information and insights from the Bay Area Air Quality Management District’s (Air District) EV programs.
1. Introduction
In addition to alternative transit modes that include walking, biking, mass transit, and shared transportation, wide-scale adoption of EVs and electrification of all types of transportation are essential to achieving local, state, and federal emissions reduction targets for greenhouse gases and criteria air pollutants. Transportation is the largest source of greenhouse gas (GHG) emissions in the Bay Area, accounting for nearly 40% of all GHG emissions [1]. Indirectly, the transportation sector generates emissions from Bay Area oil refineries that produce the fuels that power our vehicles. For this reason, the Air District has supported the development of the EV market as a means of complementing our permitting and enforcement work to reduce air emissions that harm human health.
Despite the Bay Area’s impressive EV adoption and charging installation rates (see data in the Results section below), the region must accelerate these trends to meet our goals and lead the state and the nation toward a zero-emission future. The Air District’s programs focus on moving the EV market beyond early adopters, making EVs accessible to all Bay Area residents, and raising awareness of the benefits of driving electric.
Studies have examined the maturation of and current barriers within the EV market across the United States and abroad, but this paper presents the unique characteristics of the Bay Area EV market and articulates the Air District’s identified niche in removing those barriers and accelerating EV adoption [2].
2. Materials and Methods
The first phase of the Air District’s process for accelerating EV adoption was to develop datasets on the baseline market conditions within our jurisdiction, including population, pollution sources, registered vehicles, and available charging infrastructure in the nine Bay Area counties.
Population is easily measured through the Census Bureau’s America Community Survey, which found that the Bay Area is home to approximately 7.6 million people [3]. Staff used registration data from the California Department of Motor Vehicles (DMV) to estimate that the Bay Area has roughly 5.3 million light-duty vehicles [4], with an additional 600,000 vehicles passing daily through the region from adjacent areas [5]. Additionally, three-quarters of Bay Area residents drive to work (64% drive alone and 10% carpool) and 12% take transit to work [5].
Next, Air District staff used data from the California Air Resources Board’s Mobile Source Emissions Inventory (EMFAC2014) to calculate that tailpipe emissions from light duty vehicles account for approximately 28% of greenhouse gas emissions (CO2e) and a significant portion of other pollutants (31% of carbon monoxide and 12% of nitrogen oxide) in the Bay Area [6].
The Air District analyzed a dataset from the DMV to determine the number of electric vehicles (i.e., battery electric vehicles (BEV), plug-in hybrid vehicles (PHEV) and hydrogen fuel cell electric vehicles (FCEV)) registered in the nine counties that make up our jurisdiction. This was then compared to the number of conventional light-duty vehicles registered in each Bay Area zip code to identify regions with the highest percentage of EVs vis a vis the entire vehicle fleet (see Results section below).
To assess the current EV charging infrastructure available in the Bay Area, staff used data from the Alternative Fuels Data Center [7]. These data were mapped to show the availability of public charging, or lack thereof (see Results section below). This dataset is based on self-reported information, and therefore, does not present a holistic view of all available charging. As the EV industry matures and more complete datasets become readily available, methodologies and analyses can be conducted to ensure that our plans consider nearly all charging infrastructure locations.
3. Results
3.1. Electric Vehicles in the Bay Area
When thinking about the results of our analyses, it is helpful to put them in the context of our ambitious EV adoption goals. In 2017, the Air District set a target of reaching 90% zero-emission vehicles on the road by 2050 (which is likely to be roughly 5 million vehicles). In 2018, California set a goal of 5 million zero-emission vehicles on the road by 2030. The Bay Area and California also share the goal of cutting GHG emissions to 80% below 1990 levels by 2050. Rapid growth in the EV market will be essential to achieving our GHG emission reduction goals.
Registration data from the DMV show that at the end of 2018, the Bay Area had almost 190,000 EVs, representing 3% of the region’s vehicle fleet of roughly 5.3 million cars. BEVs make up the majority of EVs registered in the Bay Area, with over 60% of the market share; PHEVs make up 39%, and FCEVs account for less than 1% (Figure 1) [8].
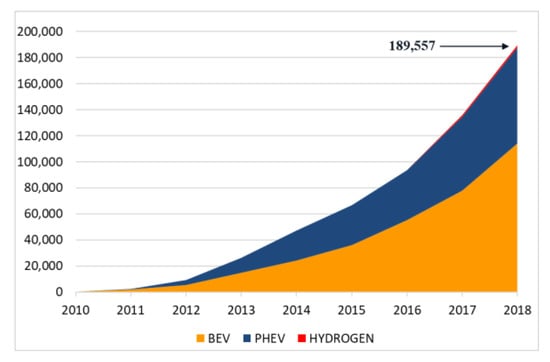
Figure 1.
Electric vehicles (EVs) (plug-in hybrid electric vehicle (PHEV), battery electric vehicle (BEV) and fuel cell electric vehicle (FCEV) in the Bay Area (DMV registration data, December 2018).
When discussing our ability to reach our future EV adoption goals, it is useful to consider year over year growth rates of the number of registered EVs. Figure 2 draws upon the same data presented in Figure 1 and includes the growth rates of overall EV registrations. In the early years of the EV market (i.e., 2010–2013), the growth rate for EV registrations was well above 100%. As is expected in a classic technology adoption cycle [9], this rate of change diminishes as the market starts to tap into the early adopters. To put this into perspective, we prepared three scenarios for future EV adoption rates. If the region maintained a growth rate of 40% a year, we would reach our goal of 5 million EVs on Bay Area roads in 2028 (22 years early). Such consistent, strong growth is unlikely, but if the growth rate suddenly dipped to 20% starting in 2020, we would reach our goal by 2036. Similarly, if the growth rate dropped to 15%, we would reach our goal in 2042. These scenarios are illustrative only and we do not anticipate such stark growth curves between now and 2050, but these do provide useful context when considering the path to reach our goals.
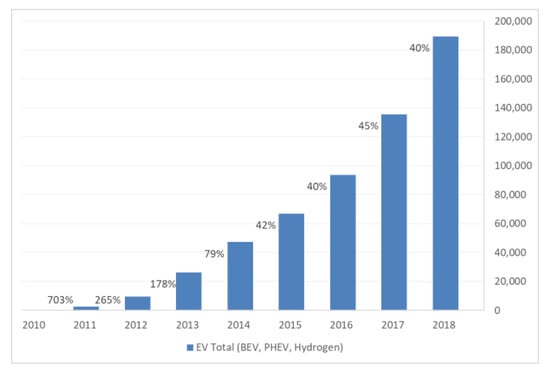
Figure 2.
Annual EV adoption growth rates in the Bay Area (DMV registration data, December 2018).
The Air District then compared the number of EVs registered in each zip code to the number of conventional light-duty vehicles, which is shown in Figure 3. These data show that there are hot spots of EV penetration in parts of the South Bay (e.g., San Mateo and Santa Clara Counties), while most of the region has low to moderate EV penetration.
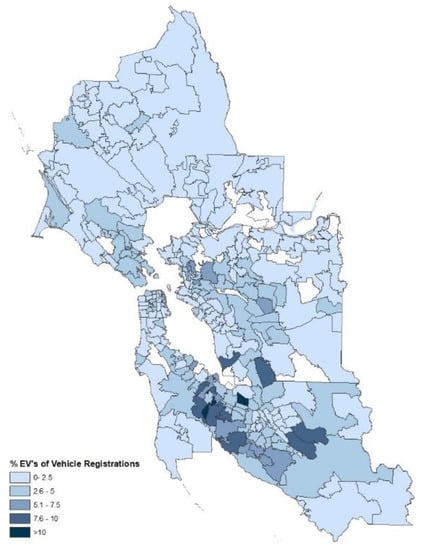
Figure 3.
EV registrations compared to traditional vehicle registrations by zip code (DMV registration data, December 2018).
3.2. EV Charging in the Bay Area
As of July 2019, there are roughly 1600 public charging locations with 7100 individual ports in the Bay Area (Figure 4) [7]. Of those publicly available ports, the vast majority are Level 2 charging ports (87%), and a smaller portion (11%) are DC Fast charging ports [7].
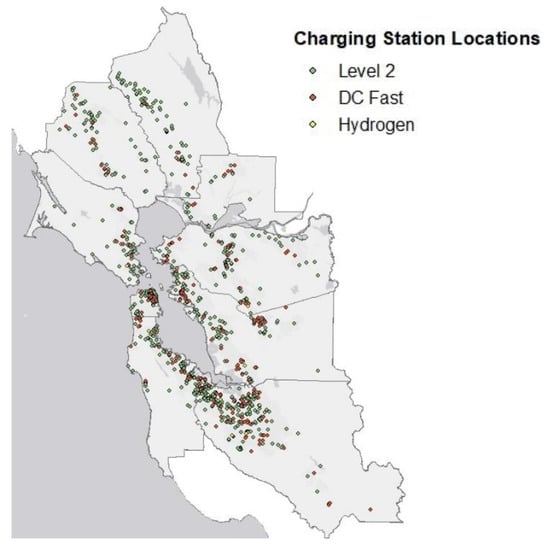
Figure 4.
Publicly accessible EV charging stations and charging ports by type in the Bay Area (Alternative Fuels Data Center, July 2019).
The Air District recognizes that additional charging stations will be needed to accommodate future growth in the EV market, especially to achieve the ambitious Bay Area goals and to accommodate a wider range of Bay Area residents. The National Renewable Energy Laboratory (NREL) and California Energy Commission (CEC) developed a model, Electric Vehicle Infrastructure Projection (EVI-Pro), which uses the results of a state-wide transportation habits survey to quantify the amount of charging infrastructure required to meet the needs of future EV drivers. This analysis attempts to account for shifting vehicle and charger technologies, user demographics, market adoption conditions, and travel and charging preferences [10].
According to EVI-Pro, the Bay Area should have 20,000 public charging ports by the end of 2019 to meet the current driver demand. This estimate is broken down by charger type and location, recommending 9100 workplace L2, 8400 public L2 and 3300 DC Fast. To stay on track with our goals, the Bay Area is estimated to need about 40,000 public charging ports by 2025, (17,000 workplace L2, 17,000 public L2 and 6000 DC Fast). Given gaps in data availability for semi-public charging at workplaces and other “gated” locations, it is difficult to state how our current charging supply compares to the EVI-Pro projection. However, using the statistics from the Alternative Fuels Data Center presented above, we are roughly thirteen thousand ports shy of meeting this goal.
Widespread charging infrastructure will be key to overcoming current and future barriers to electric vehicle adoption. An individual or household’s need for public charging infrastructure is related to home type, with drivers in single-family homes being much more likely to have home charging than those in apartments or multi-unit dwellings. Electric vehicle owners, so far, tend to live in single-family homes [10]. To extend the EV market beyond those living in single-family homes, we will have to expand charging available at multi-unit dwellings and along transportation corridors. In the Bay Area, over one-third (36%) of housing units are in multi-unit dwellings [11]. Installing charging infrastructure has been more challenging for multi-family housing, requiring away-from-home charging options for a significant portion of the Bay Area population. The need for drivers to take longer-distance trips and with a wide range of transportation patterns also requires public charging. While it is difficult to estimate how far behind we are in providing adequate charging for our current and future EV drivers, it is safe to say that we need more public charging across the Bay Area.
4. Discussion
4.1. Public Incentives to Expand from Early Adopters to Early Majority Adopters
With the first introduction of commercially available light-duty EVs in 2010, the Air District began programs to monitor the EV market and increase EV adoption in the Bay Area. Since 2010, the Air District’s Board of Directors has awarded over $19 million through incentive programs to target the identified barriers to EV adoption. The Air District’s efforts have included development and implementation of region-wide EV plans, outreach and awareness activities, and direct financial incentives. To date, the Air District has awarded projects that support more than 1500 passenger electric vehicles, 4400 publicly available Level 2 and DC fast chargers, and over 1400 residential chargers.
Moving forward, the Air District intends to target our light-duty EV programs to communities where EV adoption is quite low, specifically, low-income communities and areas with a high proportion of multi-unit dwellings. The follow two sections outline two such programs that we have started to implement with this new framing in mind.
4.1.1. Equitable Access to Electric Vehicles
The programs and policies the Air District has implemented to date have focused on getting the Bay Area EV market started. As a result of several market shifts and the incentives offered by local, regional, state and federal governments, the EV market in the Bay Area has seen a massive expansion in recent years, as demonstrated by the growth in EV sales, infrastructure, and the availability of clean vehicle options for consumers. At the same time, our EV adoption goals are ambitious: over the next 30 years, Bay Area EVs will need to grow from 3% to 90% of the region’s fleet. Using a common framework to describe the innovation adoption cycle (innovators, early adopters, early majority, late majority and laggards), we are in the early adopter phase, which tends to include users with greater financial means than the average consumer. The early majority, late majority, and laggards, which represent most consumers, include individuals with more skepticism, stronger resistance to change, or less financial fluidity. With the diversity of geographic, socioeconomic, and transportation needs here in the Bay Area, we also need to be sure that technology transitions do not leave behind or further harm specific Bay Area communities.
Equitable access to EVs ensures that all Bay Area residents can benefit from lower fuel and maintenance costs as well as an improved driving experience. This is the goal of the Air District’s new Clean Cars for All Program, which provides qualifying low-income residents up to $11,500 for scrapping an older vehicle and switching to a clean transportation option. Participants have the option to purchase or lease new and used hybrid vehicles, PHEVs, BEVs, or receive a transportation card for transit and car-sharing. The incentive funding is based on participants’ income levels and which clean transportation or vehicle option they select. The program includes stakeholder engagement and outreach to impacted communities, case managers to support participants through the application process, and partnerships with dealerships, vehicle scrappers, and community organizations around the Bay Area.
4.1.2. EV Outreach and Education
For the reasons presented above, current and future Air District outreach and education efforts will include actions that focus on influencing residents that may be more resistant or less able to participate in the EV market—shifting focus from early adopters to majority adopters. This will require a larger emphasis on education, as evidenced by the results of a recent study that found that despite a near doubling in the number of EV models in California between 2014 and 2017, fewer survey respondents were able to name an EV for sale in 2017 than in 2014 [12]. The study concluded that California consumers are not actively avoiding EVs, but that they are simply unaware of EVs.
In addition to broad outreach related to EVs, the Air District is also interested in better understanding the underlying sentiments that form key barriers to EV adoption for majority adopters. To help us in this effort, the Air District is working with a consultant to develop surveys and focus groups for consumers and businesses in the Bay Area. This market research will help us understand what policies and incentives can move the market beyond early adopters. We are focusing this work on six key sectors of the EV market: apartment residents, low-income households, fleet managers, ride hailing drivers, property owners, and dealership sales personnel. We hope to collect a representative sample of responses from around the Bay Area and summarize local and county level data to share with our partners, with the aim of guiding more strategic and targeted outreach work at all levels of government.
The market research work will help the Air District update our policies and programs to better address the economic and psychological barriers to EV adoption and infrastructure expansion. The Air District will also use the survey and focus group data to develop new, tailored outreach programs and materials, and share them with our partners (Figure 5).

Figure 5.
Flow diagram showing the process for moving from anecdotal information to data, which then informs more targeted outreach messages.
Author Contributions
Conceptualization, R.F., M.T., T.L.; methodology, K.W., D.Y. All authors have read and agreed to the published version of the manuscript.
Funding
This research received no external funding.
Acknowledgments
The authors would like to acknowledge the Bay Area EV Coordinating Council, especially Damian Breen, Ranyee Chiang, Karen Schkolnick, Linda Hui, Ken Mak and Chengfeng Wang.
Conflicts of Interest
The authors declare no conflict of interest.
References
- Bay Area Air Quality Management District. Clean Air Plan. 2017. Available online: http://www.baaqmd.gov/plans-and-climate/air-quality-plans/current-plans (accessed on 17 December 2019).
- Quantifying the Electric Vehicle Charging Infrastructure Gap across U.S. Markets; The International Council on Clean Transportation: Washington, WA, USA, 2019; Available online: https://theicct.org/publications/charging-gap-US (accessed on 17 December 2019).
- United States Census Bureau. American Community Survey, Demographic and Housing Estimates. 2017. Available online: https://data.census.gov/cedsci/table?d=ACS%205-Year%20Estimates%20Data%20Profiles&table=DP02&tid=ACSDP5Y2017.DP02&lastDisplayedRow=39 (accessed on 17 December 2019).
- California Department of Motor Vehicles. Estimated Vehicles Registered by County. 2017. Available online: https://www.dmv.ca.gov/portal/wcm/connect/add5eb07-c676-40b4-98b5-8011b059260a/est_fees_pd_by_county.pdf?MOD=AJPERES (accessed on 17 December 2019).
- California Department of Transportation. Annual Traffic Volume Reports (1992–2015). Available online: https://dot.ca.gov/programs/traffic-operations/census (accessed on 17 December 2019).
- California Air Resources Board. Mobile Source Emissions Inventory (EMFAC2017); CARB: Sacramento, CA, USA, 2017.
- U.S. Department of Energy. Alternatives Fuel Data Center. Available online: https://afdc.energy.gov/fuels/electricity_locations.html#/find/nearest?fuel=ELEC (accessed on 17 December 2019).
- California Department of Motor Vehicles. Vehicle Registration Data; California Department of Motor Vehicles: Sacramento, CA, USA, 2018.
- Rogers Everett, M. Diffusion of Innovations; Free Press: Glencoe, UK, 1962. [Google Scholar]
- California Energy Commission. California Plug-In Electric Vehicle Infrastructure Projections: 2017–2025. March 2018. Available online: https://maps.nrel.gov/cec/ (accessed on 17 December 2019).
- American Fact Finder, United States Census Bureau. January 2019. Available online: https://factfinder.census.gov/faces/nav/jsf/pages/index.xhtml (accessed on 17 December 2019).
- UC Davis. Automakers and Policymakers May Be on a Path to Electric Vehicles; Consumers Aren’t; Institute of Transportation Studies: Davis, CA, USA, 2017; Available online: https://its.ucdavis.edu/blog-post/automakers-policymakers-on-path-to-electric-vehicles-consumers-are-not/ (accessed on 17 December 2019).
© 2019 by the authors. Licensee MDPI, Basel, Switzerland. This article is an open access article distributed under the terms and conditions of the Creative Commons Attribution (CC BY) license (http://creativecommons.org/licenses/by/4.0/).