Article

Real-World Driving Cycles Adaptability of Electric Vehicles

1
China Automotive Technology&Research Center Co. Ltd., Tianjin 300401, China
2
School of Energy and Environmental Engineering, Hebei University of Technology, Tianjin 300401, China
*
Author to whom correspondence should be addressed.
World Electr. Veh. J. 2020, 11(1), 19; https://doi.org/10.3390/wevj11010019
Submission received: 28 October 2019 / Revised: 14 February 2020 / Accepted: 26 February 2020 / Published: 3 March 2020
(This article belongs to the Special Issue Propulsion Systems of EVs)

Abstract

:
Electric vehicles (EVs) include battery electric vehicles (BEVs), fuel-cell vehicles (FCVs) and fuel-cell hybrid electric vehicles (FCHEVs). The performance of vehicles is usually evaluated using standardized driving cycle tests; however, the results from standardized driving cycle tests deviate from the real-world driving cycle. In order to test the adaptability of EVs to real-world driving cycles, conditions of three typical routes in Tianjin are collected and their characteristics analyzed; then BEV and FCV models are created based on a type of FCHEV to simulate 0–100 km/h acceleration and cruising performance under a real-world driving cycle; finally, a motor bench is used to test the performance of FCHEV under the NEDC (New European Driving Cycle). After the adaptability of the three models to real-world driving cycle is compared based on the simulation and test results, it is found that FCHEV can recycle braking energy and has quick dynamic response, which can be well adapted to the real-world driving cycle.

1. Introduction

China has now become one of the largest energy consumers and importers in the world [1]. While continuous environmental pollution and the energy security crisis have attracted increasing public attention, vehicle exhaust emissions have ranked to be a major source of air pollution in some cities in China because transportation is responsible for about 1/3 of greenhouse gas emissions [2]. The proportion is same in EU (European Union), US and other regions in the world [3]. Currently, countries worldwide are taking various measures to address transportation emissions, such as promoting public transportation and inventing more energy-saving transmission technology.
New-energy vehicles represented by battery electric vehicles (BEVs) and fuel-cell electric vehicles (FCEVs) are ideal solutions to this problem. In 2017, global sales of BEVs exceeded 1 million, increasing by 54 % compared to that in 2016. By now, global ownership of EVs has reached over 5 million [4]. There are many factors contributing to the continuous increase in EV ownership. Firstly, governments in many countries have introduced relevant policies and incentives [5]. For example, the EU proposes to cut greenhouse gas emission by 60% by 2030; California offers to subsidize consumers purchasing EVs [6]; the Chinese government provides subsidies of various levels based on technological levels of EVs—the longer the mileage and the higher the energy density, the greater the subsidy [7]. Secondly, EVs powered by a ternary lithium battery or lithium iron phosphate battery feature faster dynamic response, are more environmentally friendly and more energy-saving than traditional fuel vehicles [8]. Thirdly, electric energy production today can satisfy future transportation needs. For instance, China produces most electric power resources for itself. Although there are some problems in cost and battery technology, EVs usually charge during off-peak power consumption hours at night, hence the development needs of EVs in the near future can be satisfied as long as electric power resources are reasonably allocated [9]. Therefore, vigorous promotion of application of EVs is one of the effective ways to address the energy and environmental crisis brought about by the transportation system of today.
However, large amounts of lithium, cobalt and nickel are used to produce batteries for EVs and permanent magnet motors require a lot of rare earth elements such as dysprosium, terbium, praseodymium and neodymium [10]. This has a great negative impact on sustainable development of the environment. Meanwhile, as rare earth elements are unevenly distributed worldwide, their yield is greatly affected by geopolitics and this significantly limits production of BEVs [11]. FCEVs are powered by proton exchange membrane fuel cells. Compared with other fuel cells, proton exchange membrane fuel cells have high density, great efficiency and low operating temperature, and are suitable as a power source for vehicles. Moreover, as fuel cells use hydrogen as fuel, water is the only reaction product and they produce no emission, which is the greatest advantage [12]. But a great quantity of greenhouse gas will be generated when hydrogen is produced for FCEVs and such a quantity is no less than the emission of traditional fuel vehicles. Luckily, as technologies progress, primary energy resources will no longer be the main source of electric power when electric power is to be produced by renewable energy sources including nuclear energy, biomass energy, solar energy and wind energy. By that time, greenhouse gas emissions from FCEVs will be 99.2 % lower than that of traditional fuel vehicles. Sadly, fuel cells are unable to work under heavy load for a long time and have response time, making them unsuitable for violent varying-duty operations. Also, long-time operation will seriously compromise the service life of fuel cells. In order to adapt to varying-duty operations, a FCEV is usually equipped with a hybrid power system consisting of fuel cells and power batteries. When the vehicles are accelerating or conditions change abruptly, power batteries will produce some of their energy to reduce energy supply pressure of fuel cells and thus extend their service life [13].
Every EV model has its advantages. For example, a BEV, although designed in simple way with fewer parts, has short mileage and long charging time. PHEVs have greater cruising ability thanks to their engines, but they emit greenhouse gas [14]. Fuel-cell vehicles (FCVs) and fuel-cell hybrid electric vehicles (FCHEVs) are both powered mainly by fuel cells without emission or pollution. But they cannot be promoted on a large scale due to restrictions in cost and technology.
Many Chinese and foreign scholars have studied the operating status of EVs and FCEVs via micro-simulation and macro-test. Xiaodan Xu et al. developed an EV model to simulate its energy consumption under various road conditions. Test results show that if PHEVs can account for 50% market share, energy consumption will be cut by 30% [15]. Xinkai Wu et al. collected energy consumption data of one EV driving on three different routes and analyzed the relations between its power and velocity and its accelerated velocity and road gradient to come up with a estimation model of EV power [16]. Xinmei Yuan et al. proposed a method to evaluate EV energy consumption under real driving cycles and proved the effectiveness of such a method by simulation and test data. The results showed that such method can accurately evaluate EV energy consumption under different road conditions and serve as a possible alternative mechanism to EV energy consumption evaluation [17]. John Brady et al. developed a driving cycle by real-world data from electric vehicle, over a six-month period. Real-world driving cycles are essential for EV powertrain design, battery management systems, battery range estimation and the provision of better information to EV users [18]. Marta Faria et al. monitored 40 drivers for a period of six months, The data obtained allowed for testing of the impacts of increasing the percentage of traffic shifting from peak to off-peak hours in energy consumption [19]. Shangfeng Jiang et al. included the quality of FCVs and road grade as influencing factors of an energy management strategy and used a forward-looking control strategy based on road conditions to reduce lag of fuel cells and cut fuel consumption rate [20]. Roberto Álvarez Fernández et al. studied mileage and energy consumption of EVs under various energy management strategies. The authors believed that before enough infrastructure was provided, a combination of two power modes (hydrogen and electric energy) could be an effective method to power vehicles with low risk [21]. Z. Mokrani et al. studied the fuel cell/accumulator power systems used in PHEVs and verified the effectiveness of the EV energy management and control strategy they came up with via a hybrid system simulation model based on Matlab/Simulink [22]. Morrison G, et al. estimated the costs of all BEVs and FCEVs to be created from now to 2040. The results showed that the costs of these two power systems become similar quickly from 2025 to 2030; after 2040, the cost of FCEVs will drop below that of BEVs and gain remarkable advantages in larger models and longer traveling distance [23].
Most of the above studies focused on the factors affect the energy consumption of electric vehicles, and studied the effects of speed, acceleration and gradient on electric vehicles, but did not consider the characteristics of the vehicle itself. This paper studies the performance of different types of electric vehicles under different road conditions. As the same time standard cycles cannot accurately reflect the performance of the vehicle, it is necessary to study the performance of electric vehicles to real-world driving cycles. Firstly, a BEV was used to collect three typical routes in Tianjin. Then, BEV and FCV models were established based on a certain FCHEV, and the adaptability of the BEV and FCV to three real-world cycle was simulated using AVL CRUISE. Lastly, the 100 km/h acceleration performance, cruising performance, and energy consumption of the FCHEV were tested with a motor bench. The simulation and test results of the three vehicles were comprehensively compared, and the real-world driving cycle adaptability of electric vehicles was analyzed.
BEVs and FCEVs have many different modeling methods, depending on the purposes of simulation and degree of accuracy. The forward model is more accurate and complex since it uses drivers’ instructions as input parameters and creates models for all vehicle parts (such as transmission and direct current/direct current (DC/DC)) to simulate and estimate energy consumption. Its deficiency lies in heavy calculation burden and great difficulty in micro-analysis of energy flow [24]. Reverse simulation is another way. It uses vehicle motion parameters (such as velocity and accelerated velocity) as input and simulates power required for vehicles to move forward via the efficiency diagram and power model, and hence is suitable for the micro-analysis of energy flow process [25]. In this paper, we mainly use reverse simulation to calculation FCVs and BEVs.
The paper is organized as follows. Section 2 describes the process of collecting a real-world driving cycle. Section 3 introduces the mathematical model of vehicles, fuel cell, battery and so on. Experiment and simulation results are analyzed in Section 5.

2. Real-World Driving Cycles

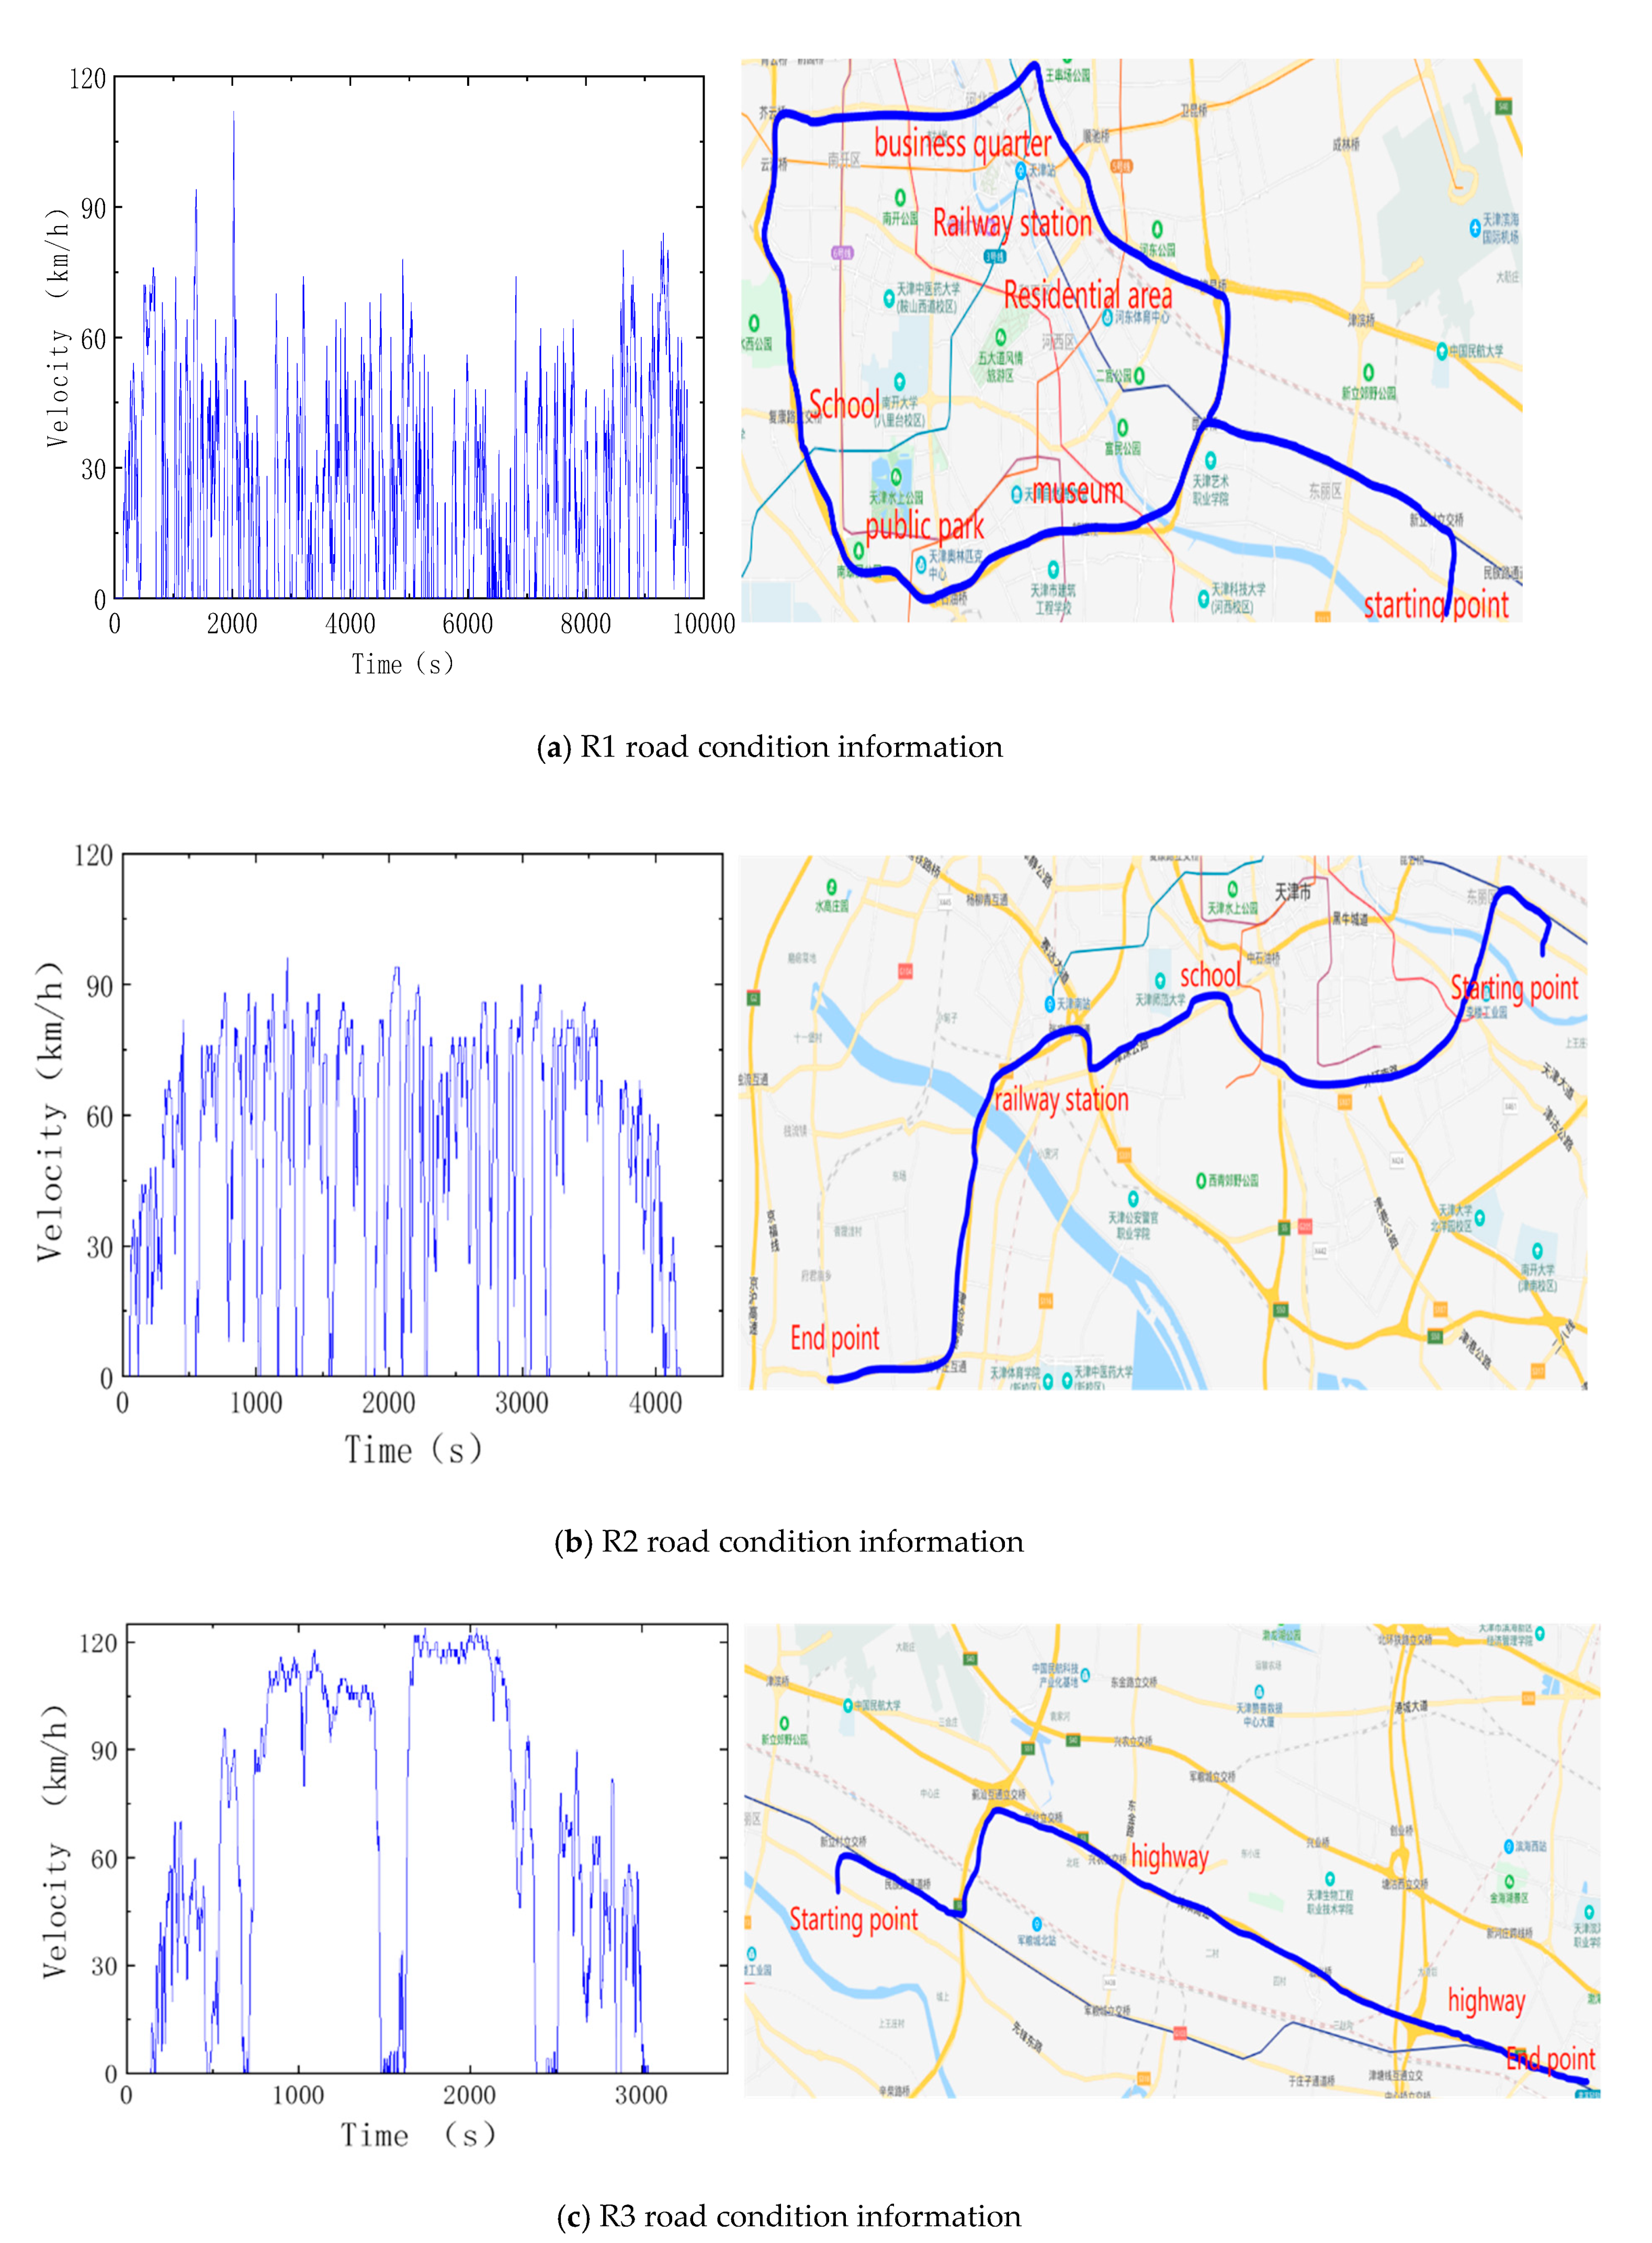
2.1. Collect Information of Real-World Driving Cycle

In order to simulate energy consumption and performance of vehicles under real-world driving cycles, an EV is used to collect information of real-world driving cycles in Tianjin in this paper. To eliminate the impact of single road condition on vehicle energy consumption, three routes are selected in Tianjin based on traffic condition and traveling pattern of local residents, covering roads of different grades and as many areas as possible (such as business districts, residential areas and suburb areas) in the entire road network. While collecting road conditions, energy consumption of the vehicle used is also tested on the routes. The first route is located in the downtown area where there are many traffic lights and junctions. Besides, highly populated places such as shopping malls, hospitals and schools are also located along this route. Information collection time is at the busy hour in the morning and this route is congested with average velocity of 22.4 km/h (hereinafter referred to as R1). The second route is located in a suburban area with a few traffic lights and junctions. The traffic is smooth with average velocity of 44.6 km/h (hereinafter referred to as R2). The third route is a high-velocity road and the test vehicle runs constantly at high velocity with average velocity of 64.6 km/h (hereinafter referred to as R3). The information of the three routes is shown in Figure 1.

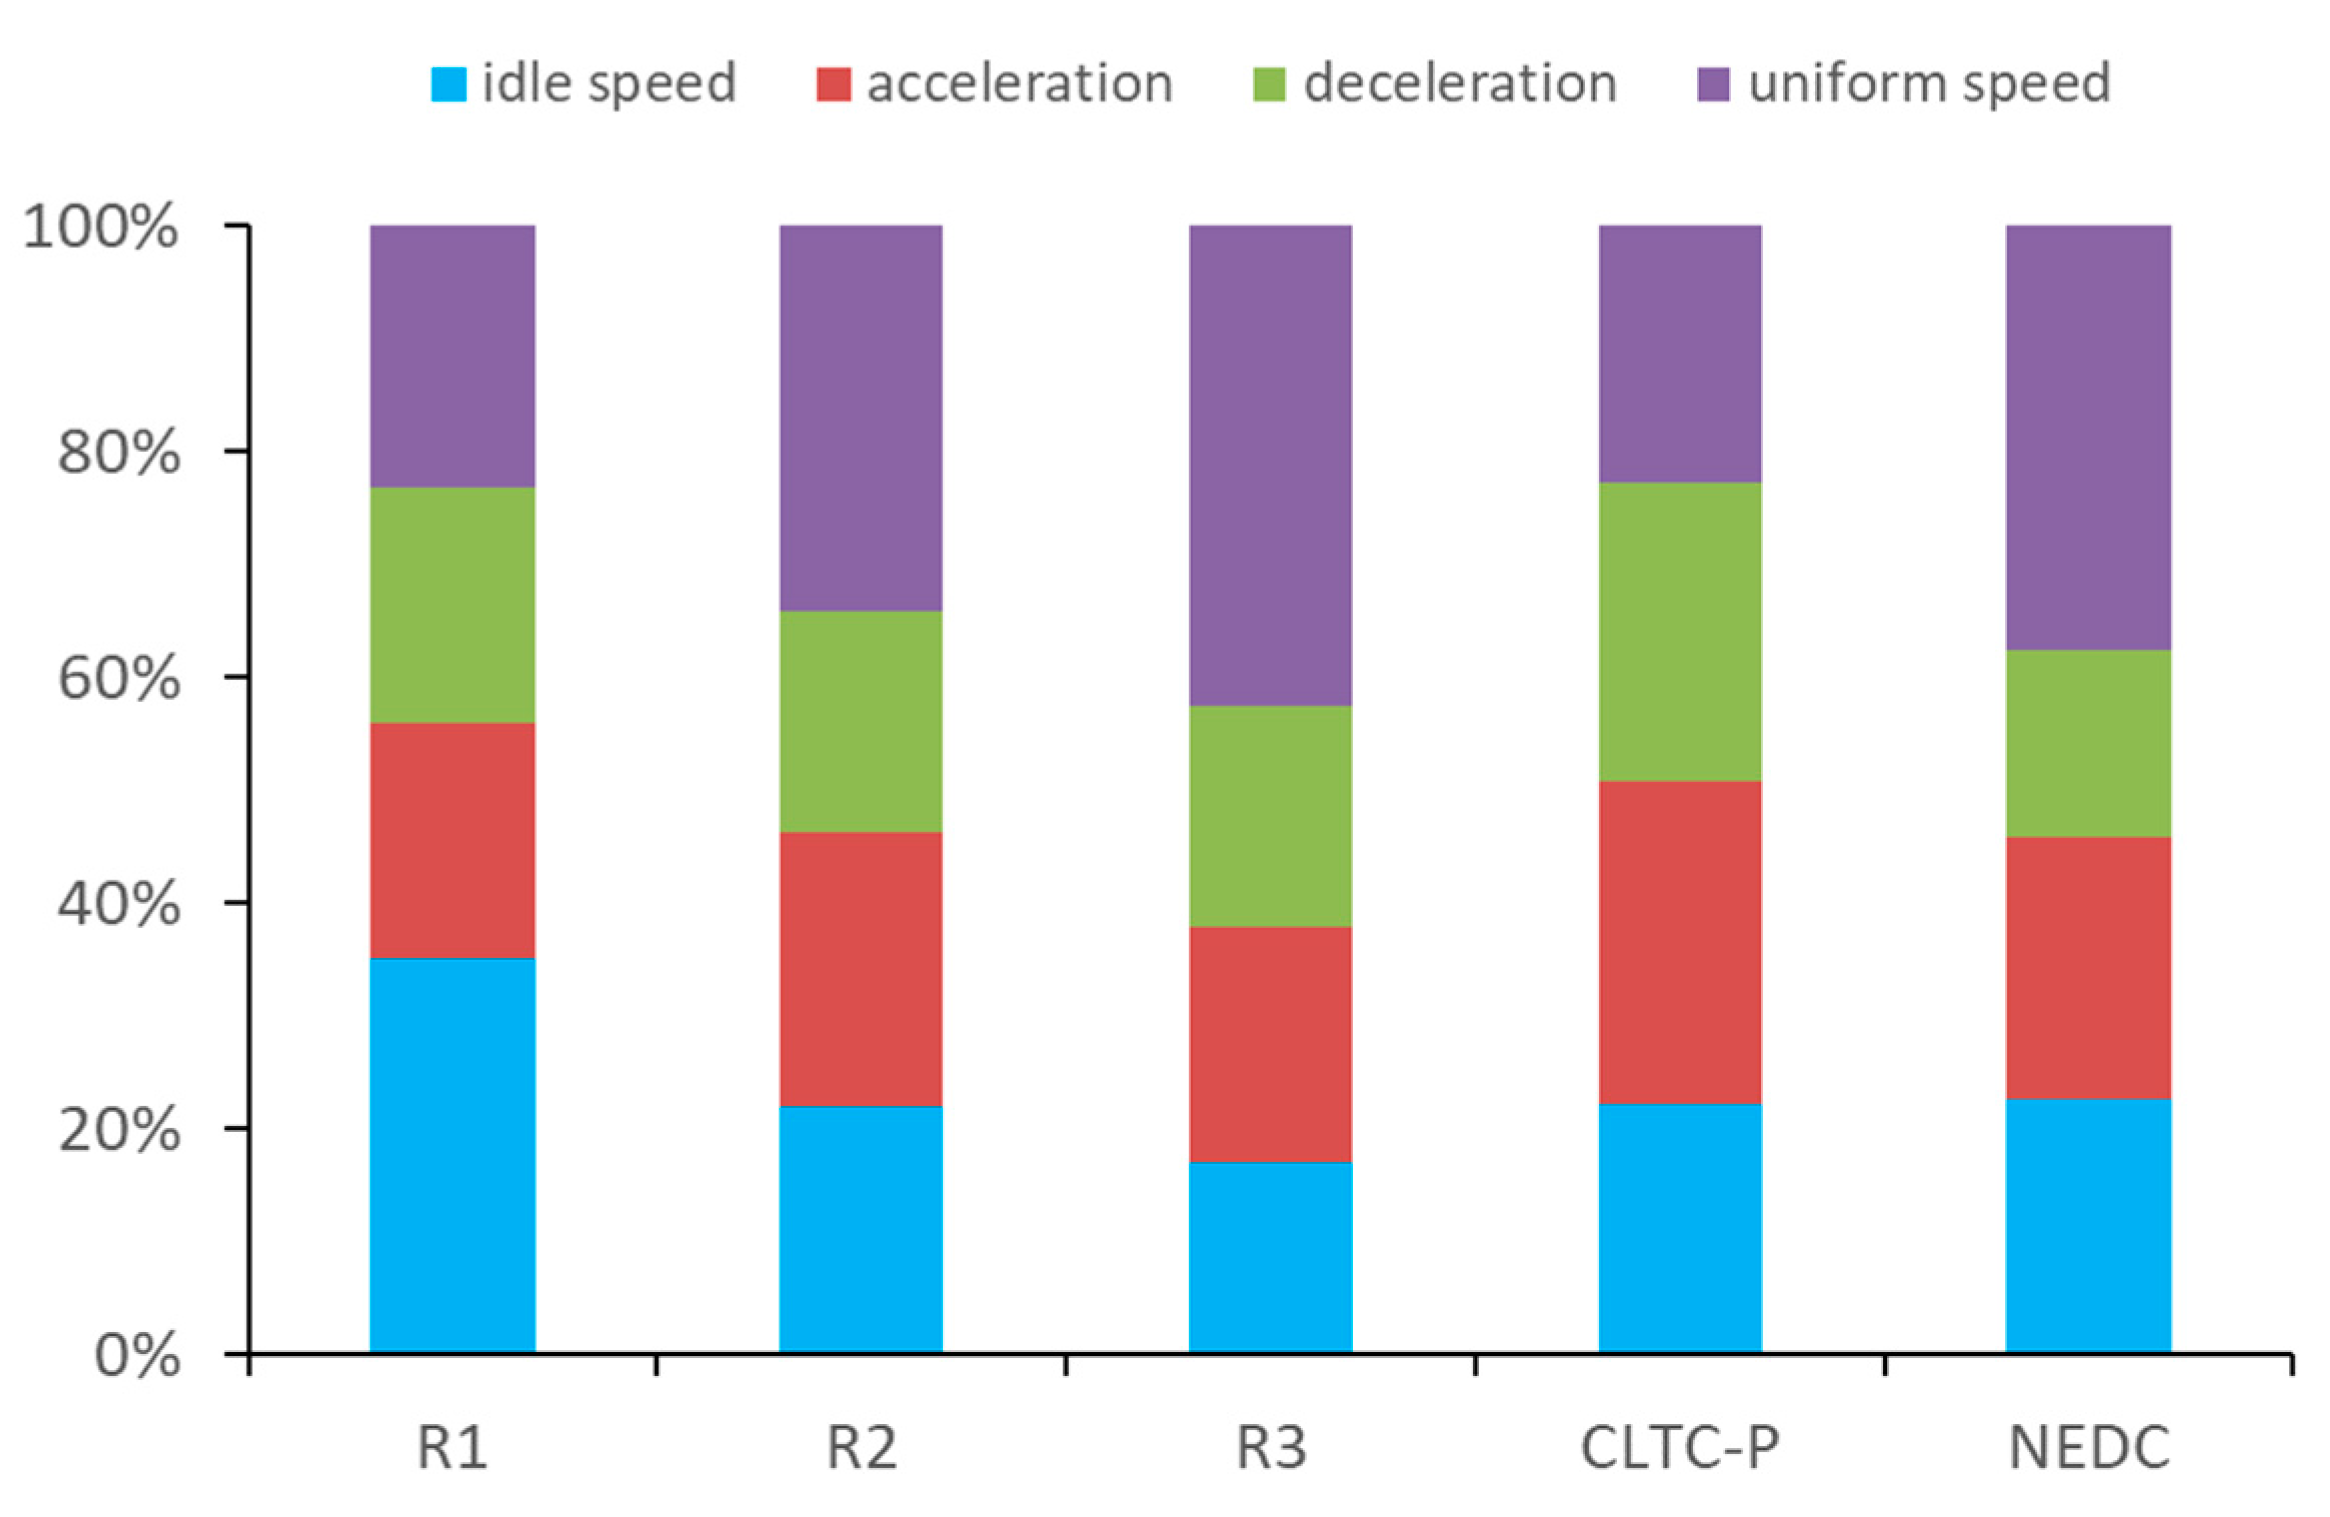
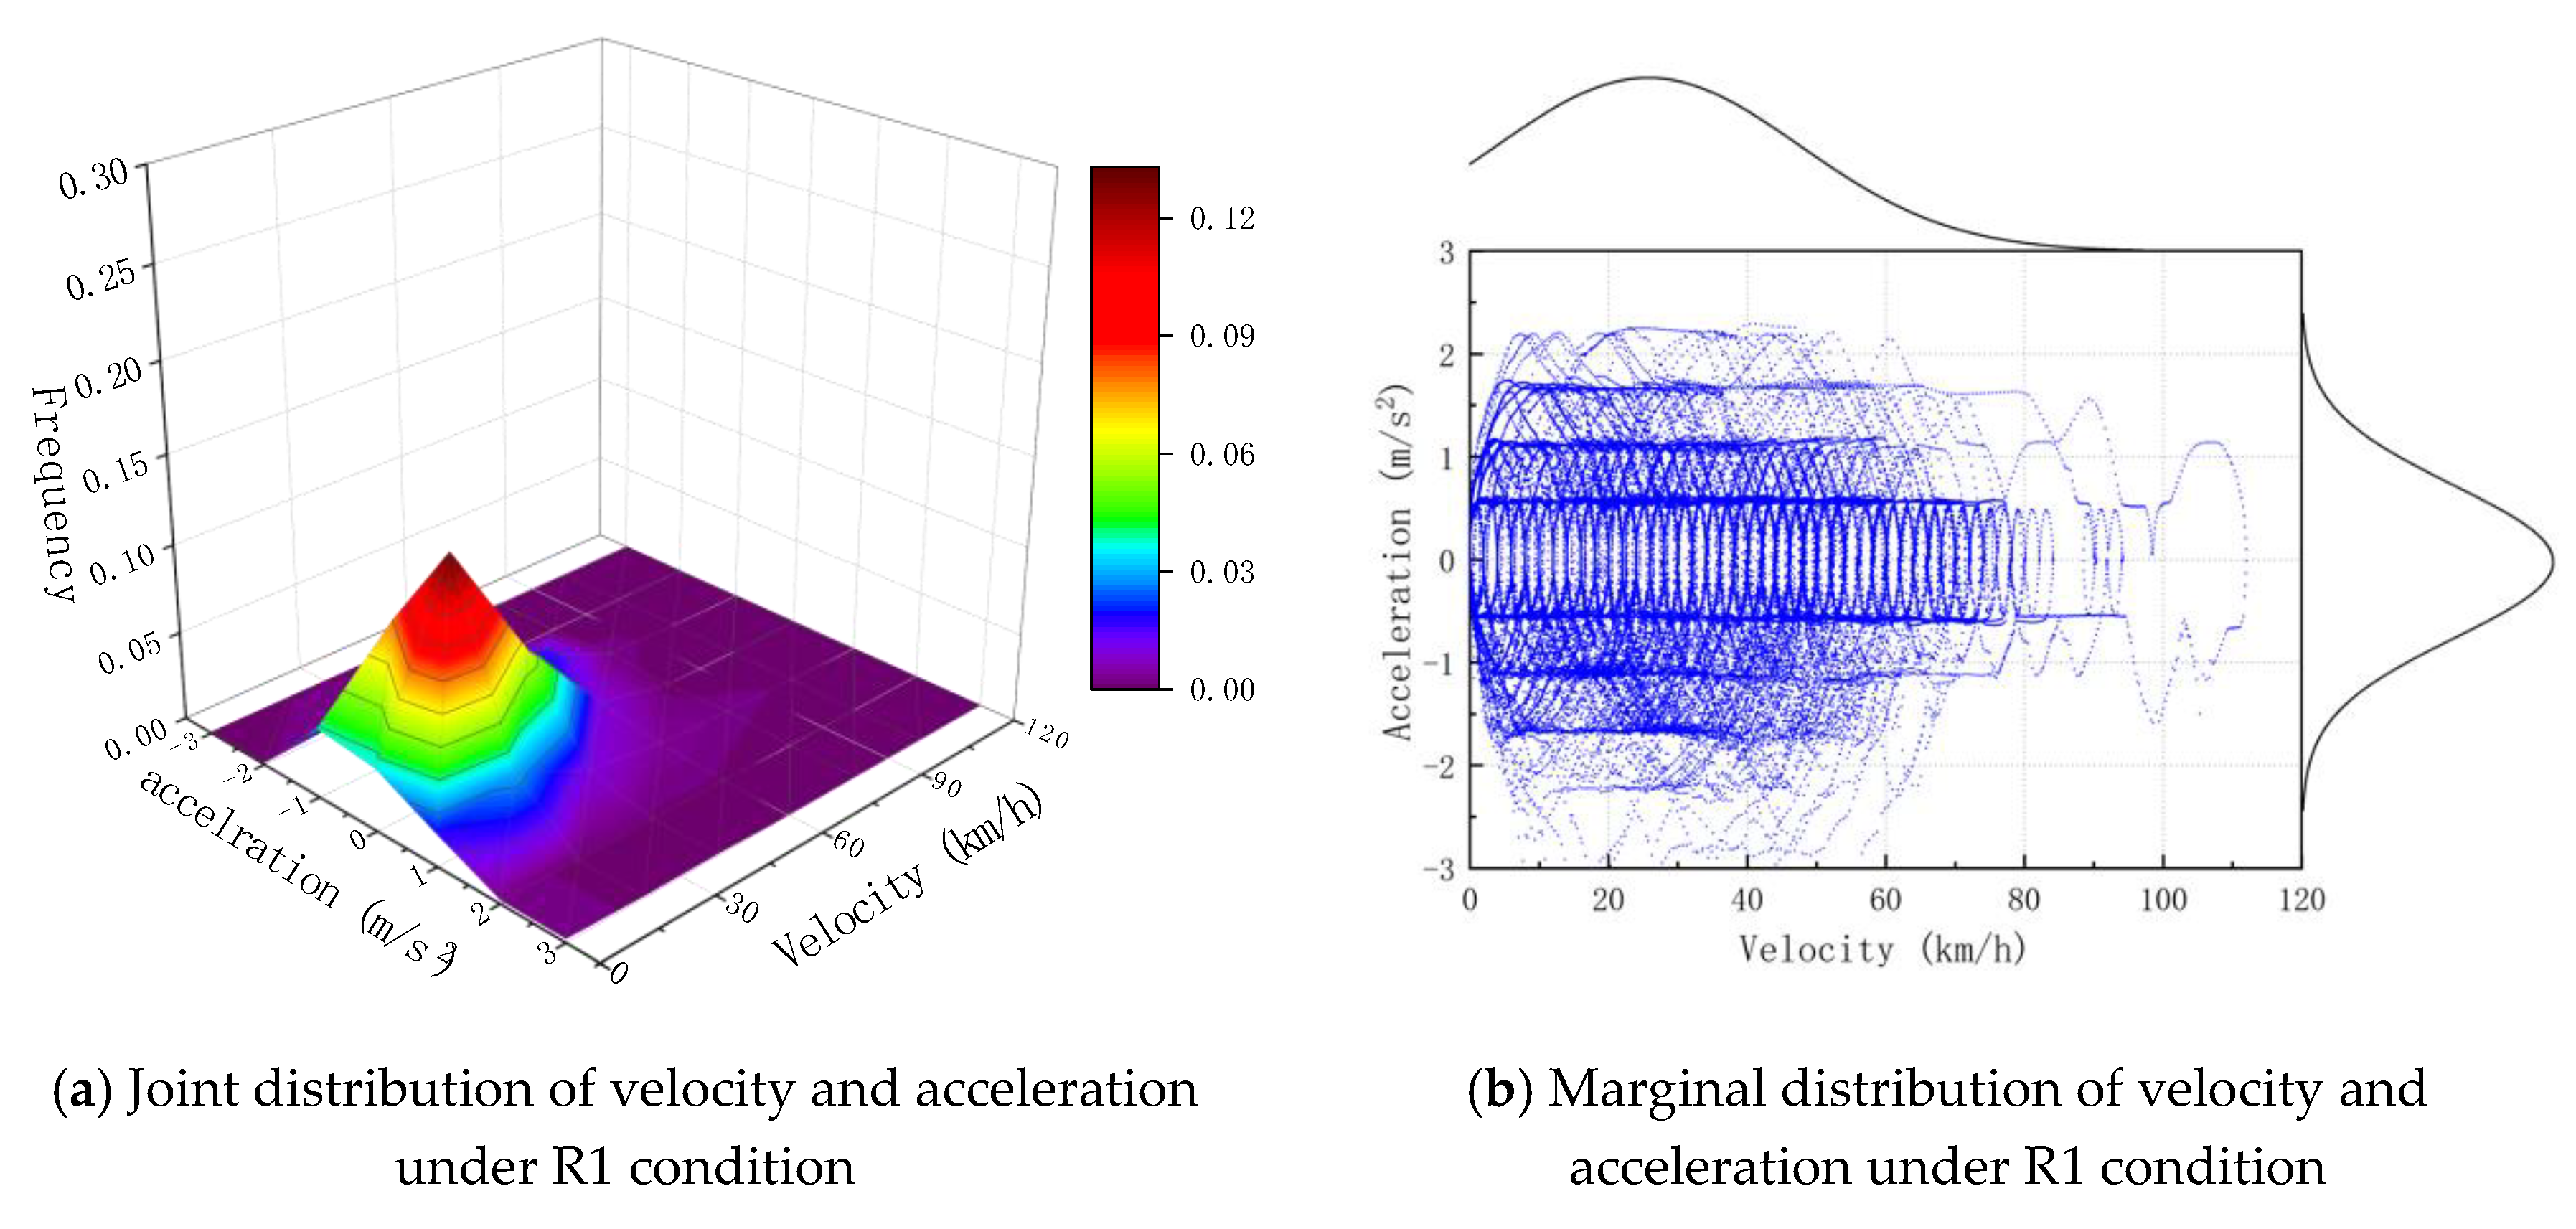
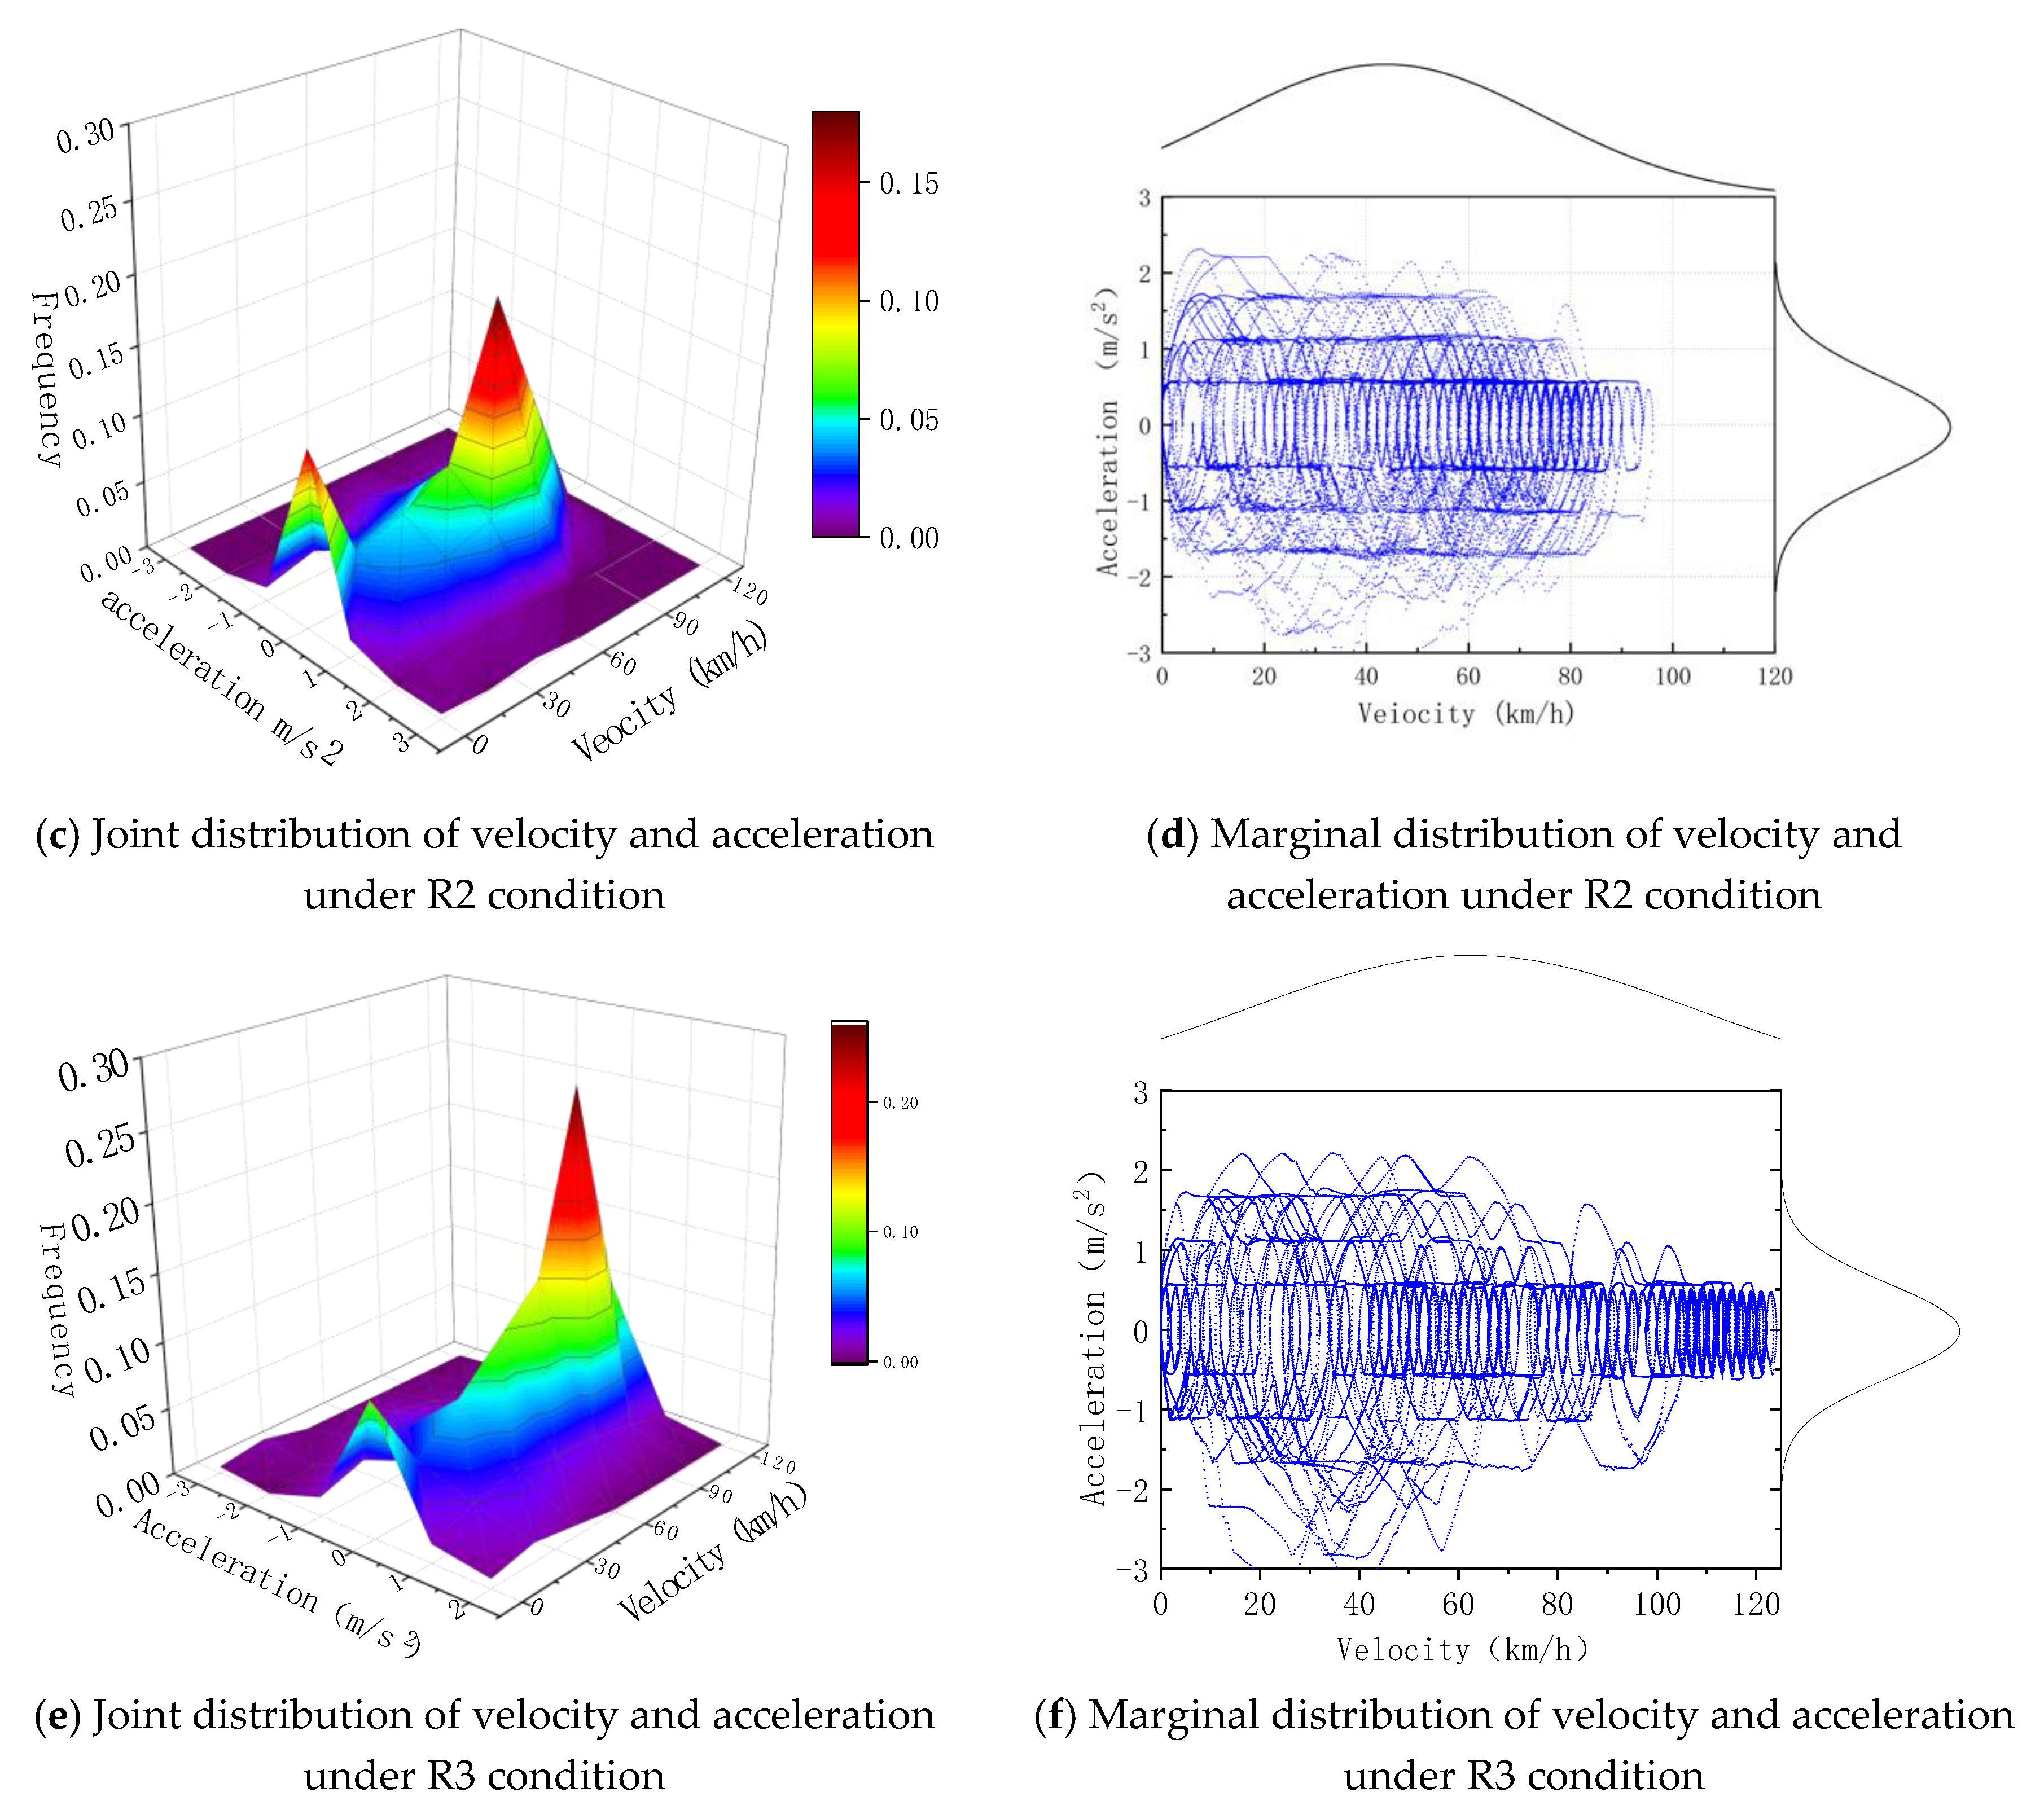
2.2. Characteristics of Real-World Driving Cycle

Characteristics of real-world driving cycles include velocity, acceleration and time. In this paper, the conditions of three routes and characteristics of CLTC-P (China light-duty vehicle test cycle-passenger car) and NEDC (New European Driving Cycle) are compared. CLTC-P is a passenger car driving cycle based on the traffic conditions in China, including three velocity ranges of high, medium and low velocity with average velocity of 28.9 km/h.
Figure 2 describes percentage of time that driving at such speed, including uniform speed, acceleration, deceleration and idle speed (when the electric motor is uncoupled from the drivetrain) in three real-world driving cycles. We can see from the picture that R1 has the highest percentage of idle speed and R3 has the highest percentage of uniform speed. R1 and R2 have similar percentage of acceleration and deceleration.
Figure 3 describes the probability distribution of velocity and acceleration under three real-world driving cycles. We can tell from Figure 3a,b that the probability is the highest for velocity range from 0 to 10 km/h and the acceleration is mainly distributed between 1–1 m/s2 under R1 condition. We can see from Figure 3e,f that the probability of velocity is the highest between 60–80 km/h and the acceleration is mainly distributed between 1–1 m/s2 under R2 condition. From Figure 3e,f we know that the probability of velocity is the highest between 110–120 km/h and the acceleration is mainly distributed between 0.5–0.5 m/s2 under R3 condition.
Through the comparative analysis of Figure 2 and Figure 3, we know that vehicles start and stop more times, acceleration and deceleration are frequent, and the velocity is low to medium under the R1 condition; the velocity is medium to high and velocity distribution is in polarization under the R2 condition; and the velocity is mainly high with high percentage of constant velocity and small change in acceleration under the R3 condition.

3. Mathematical Model of Vehicles

In order to compare difference in performance of BEV, FCV and FCHEV, simulation models of BEV and FCV are created based on a model of FCHEV made by a certain country. Such simulation models have identical parameters such as curb weight, windward area and tire radius with the FCHEV model and only differ in power systems. Therefore, consistent vehicle performance can be ensured. The basic parameters of the vehicle are shown in Table 1.

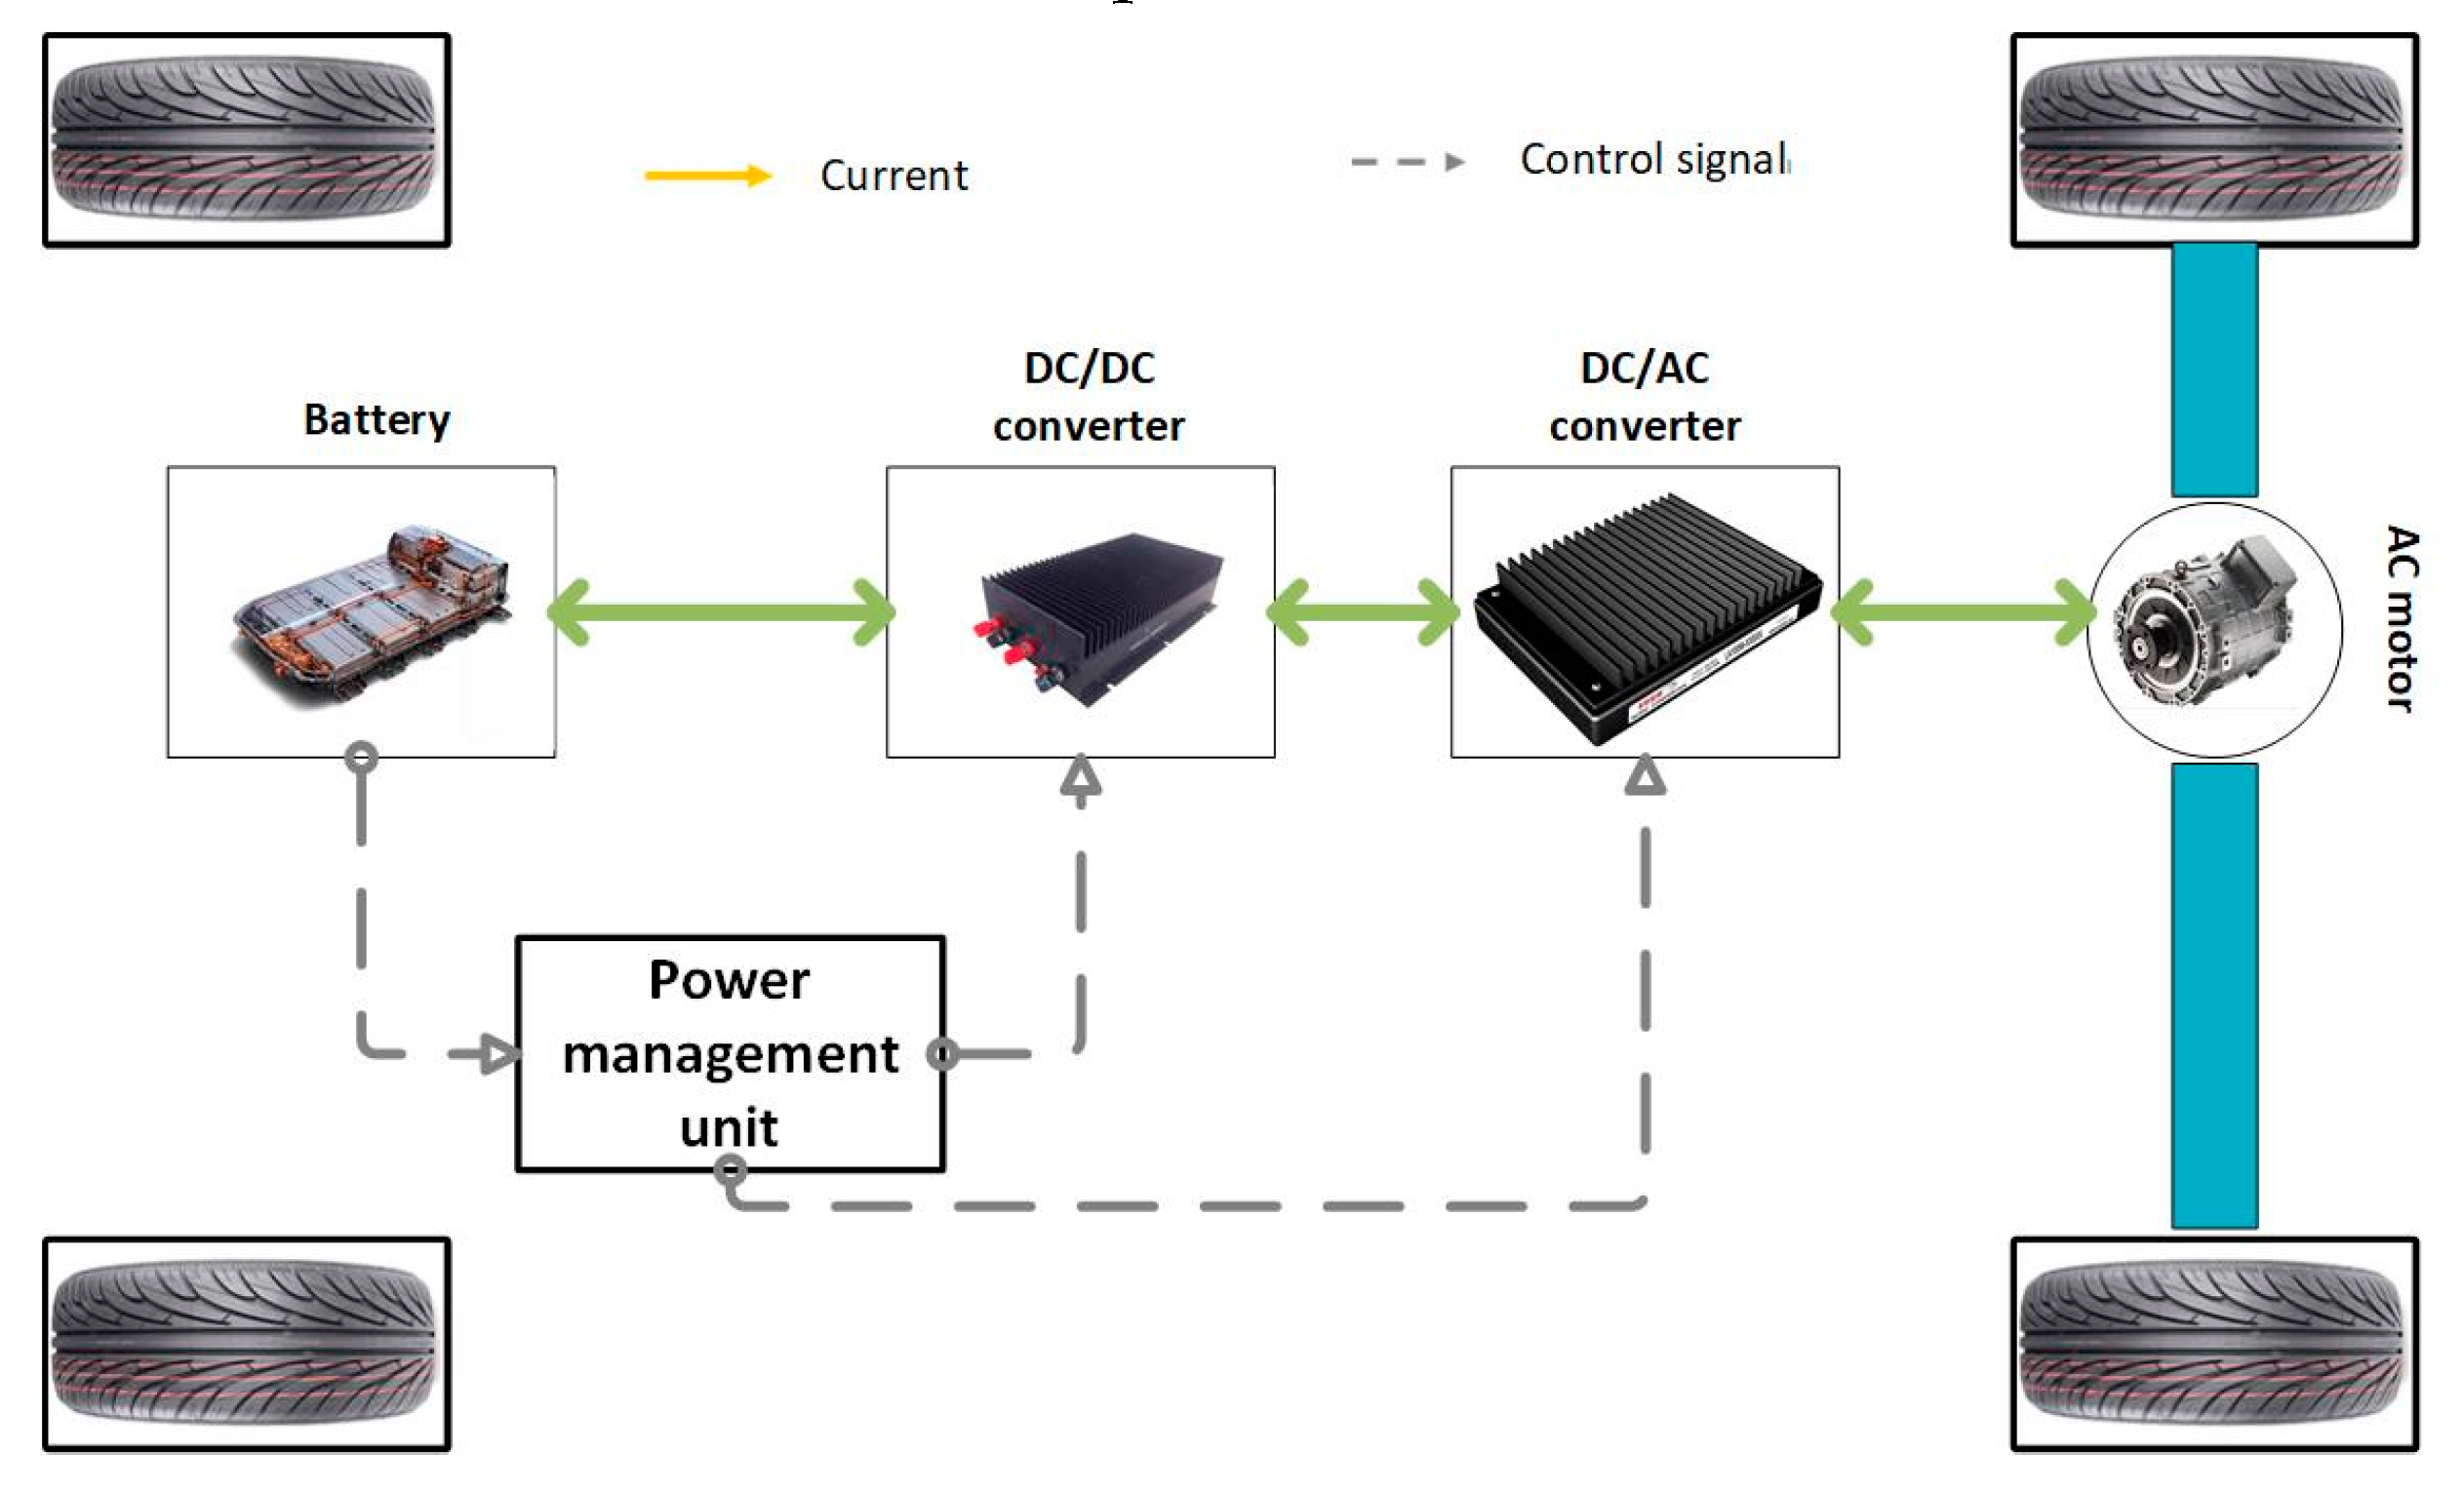
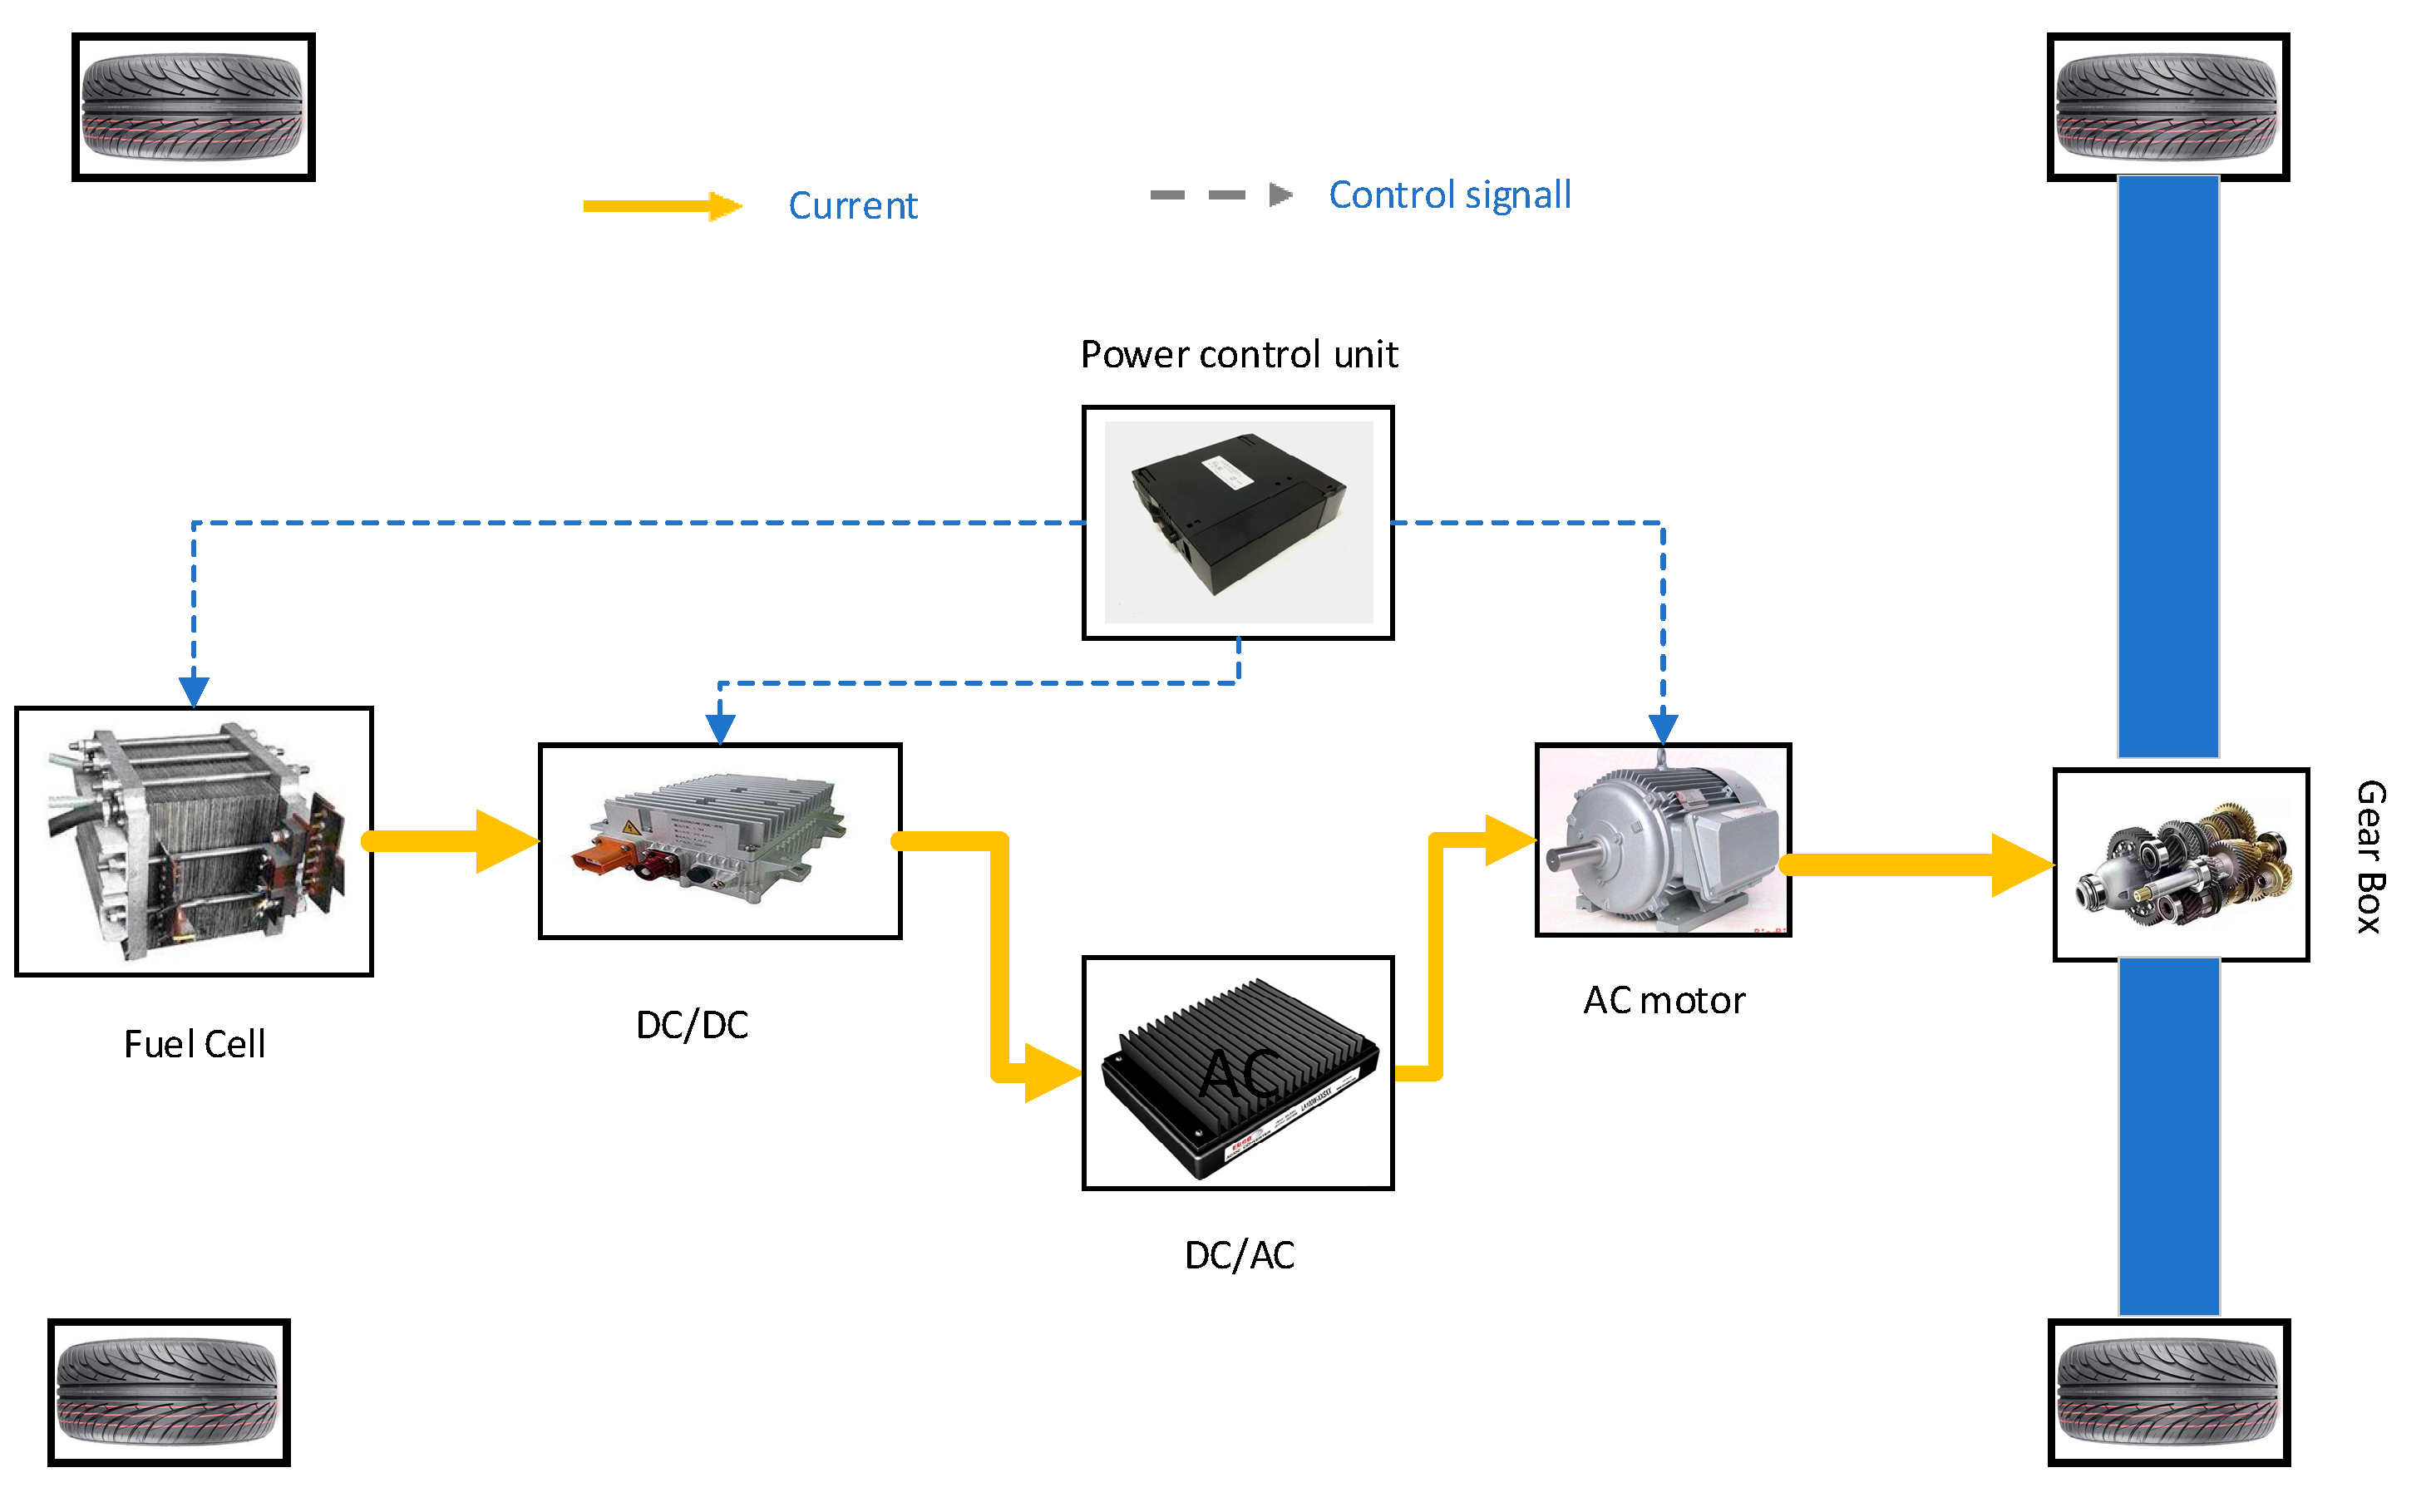
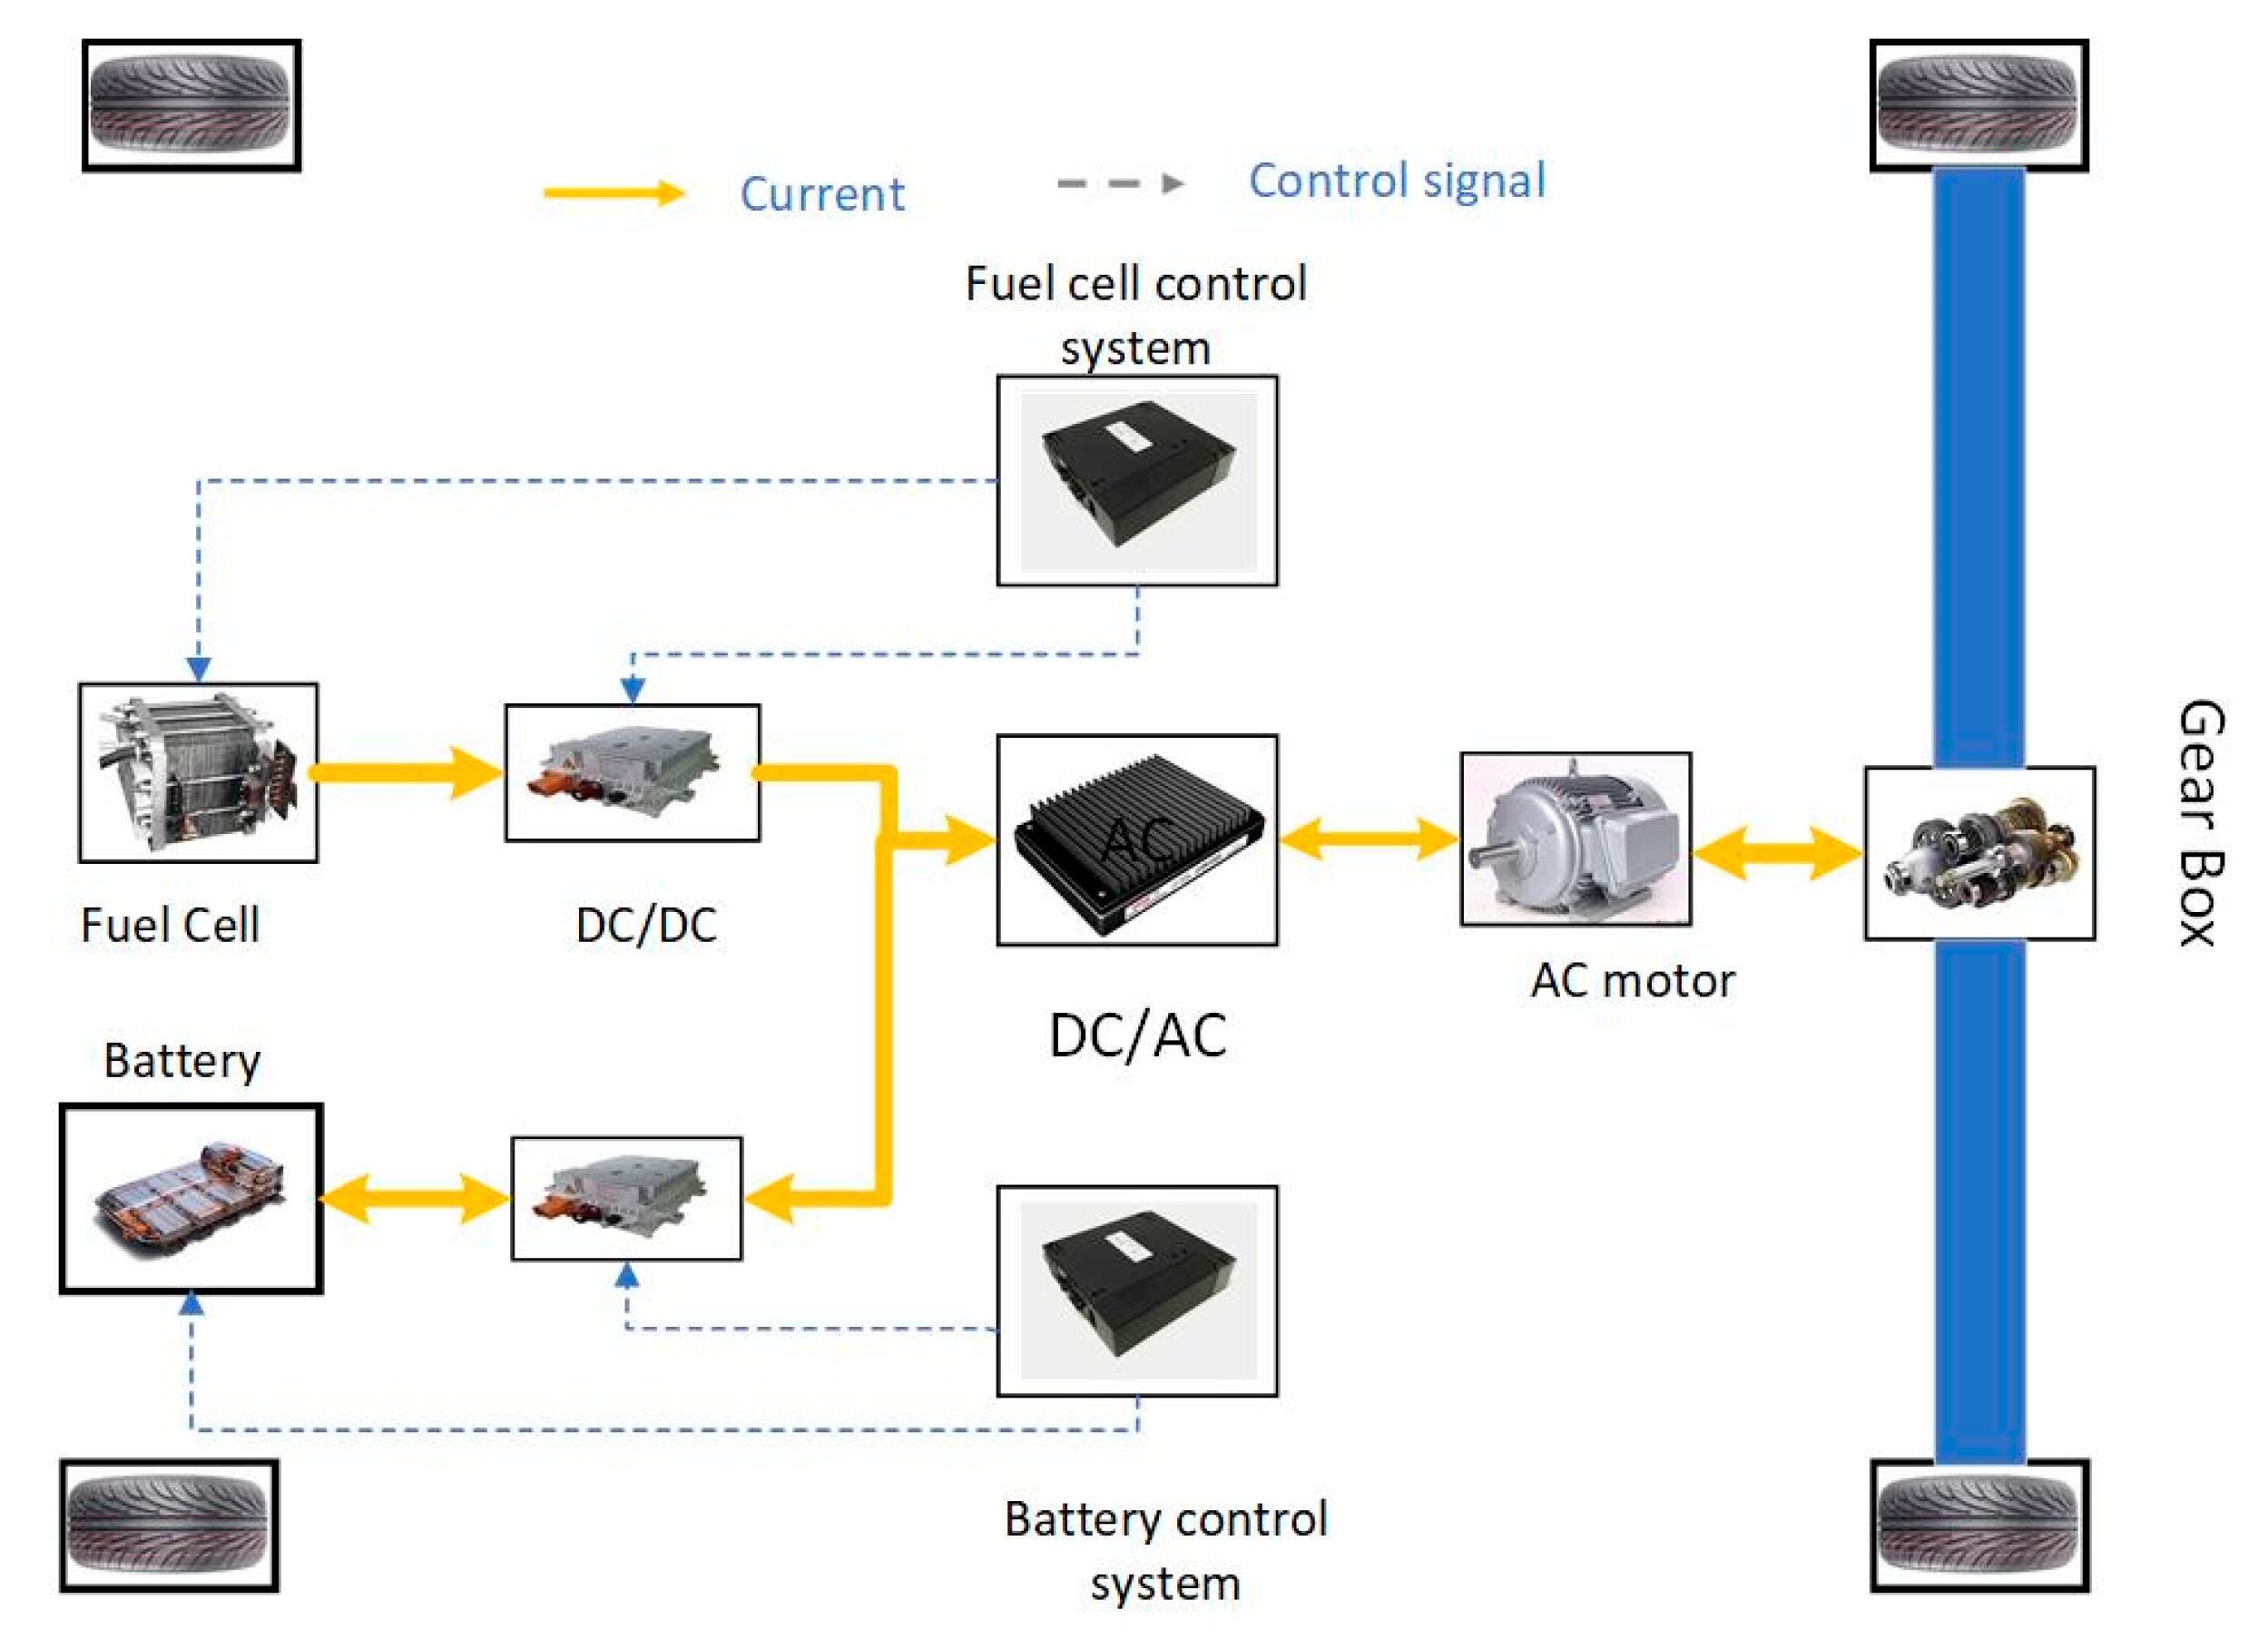
3.1. Power System Structure Model

BEVs or FCVs are subject to air, gradient and rolling resistance during driving and overcome such resistance to move forward.
F v , r e s = F α + F r + F g
In the formula above, F v , r e s is the total resistance of vehicles during driving, F α is air resistance, F r is rolling resistance and F g is gradient resistance [26].
F α = 1 2 ρ A C x v 2
F r = m v C r g c o s ( α )
F g = m v g s i n ( α )
In the three formulas above, v is the vehicle velocity, ρ is the air density, A is the front surface of vehicle, m v is the vehicle mass, g is the acceleration of gravity, C x is the drag coefficient, C r is the aerodynamic coefficient and α is the road gradient.
To sum up, vehicle wheel propulsion power P w h e e l can be calculated with the formula below [27]:
P w h e e l = v ( m v ( t ) d d t v ( t ) + F α ( t ) + F r ( t ) + F g ( t ) )
Vehicle wheel power comes from power battery and some energy loses during transmission. Thus, power P B provided by the battery should be:
P B = P w h e e l φ D C / A C × φ m o t o r
where φ D C / A C is DC/AC conversion efficiency and φ m o t o r mechanical efficiency of drive motor [28,29].

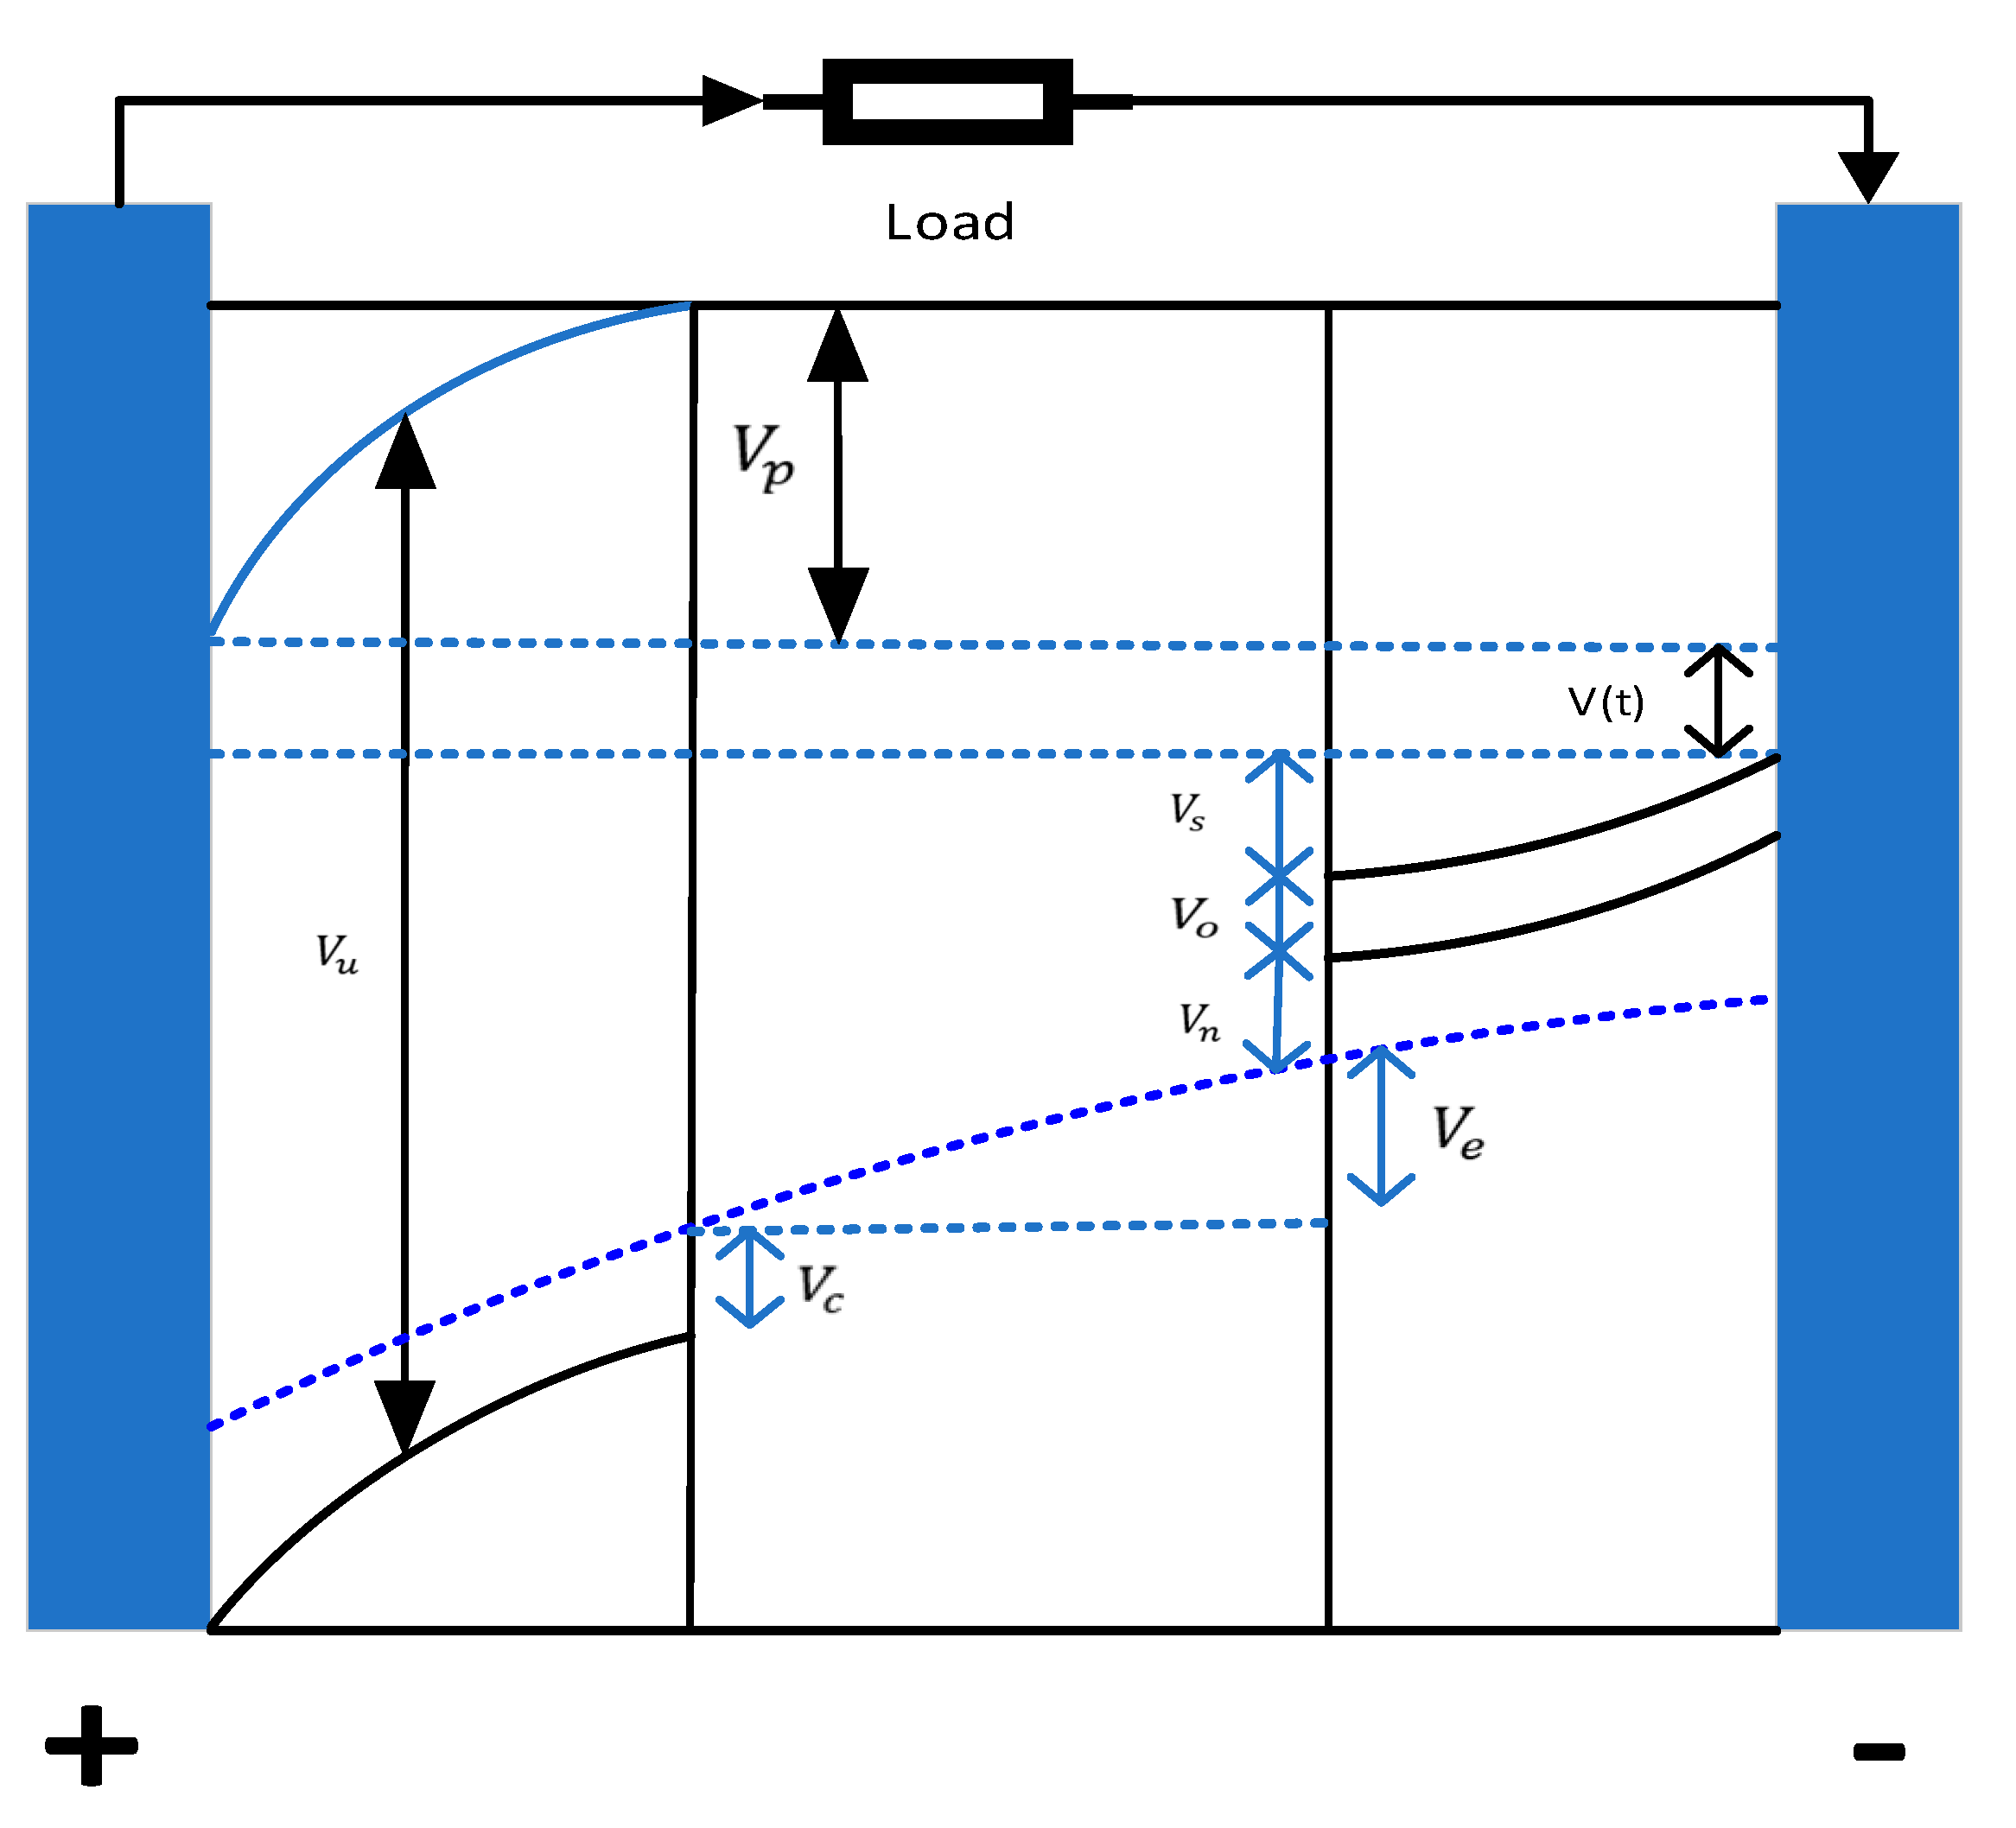
3.2. Lithium Battery Model

In this simulation, a lithium ion battery model is used for the BEV. A lithium ion battery consists of cathode, anode and electrolyte. During discharging, lithium ions (Li+) break free from the anode, spread to the cathode via electrolyte and join the cathode. The charging process is the opposite. The total voltage of the battery is the difference between cathode and anode voltages [30]. The battery model is as shown in Figure 4.
Battery voltage can be expressed by the formula below:
V ( t ) = V u V n V p V s V e V o V c
In the formula above, V u and V n are cathode and anode potentials; V o and V c are voltage drop caused by surface resistance due to charge transfer between the cathode and the anode; V p , V s and V s are voltage drop caused by intrinsic resistance of the cathode and the anode and electrolytic resistance [31,32].

3.3. Proton Exchange Membrane Fuel-Cell Model

Proton exchange membrane fuel cell is a major power source of FCVs and its voltage can be described by the formula [33] below:
E = N F C ( E r e v E a c t E o h m E c o n )
In the formula above, N F C is the number of fuel cell stack current, E r e v is thermodynamic reversible potential, E a c t is activation loss, E o h m is ohmic loss and E c o n is concentration loss.
Among them, thermodynamic reversible potential can be calculated with the formula [34] below:
E r e v = E 0 0.85 e 3 ( T T c ) + R T 2 F ln ( P o 2 P H 2 )
where E 0 is reversible nearest potential of single battery, T is battery temperature, T c is temperature correction offset, P o 2 and P H 2 are partial pressure of oxygen and hydrogen.
Activation loss can be expressed by the formula [35] below:
d E a c t d t = I F C C d l ( 1 E a c t η a c t )
where C d l is double-layer capacitance of single fuel cell.
When static activation loss is large, it can be simplified into the formula [36] below:
η a c t = R T 2 α F ln ( I F C I o )
where I o is AC density and α is symmetrical factor.
Ohmic loss can be expressed by the formula [37] below:
E o h m = I F C × R F C
where R F C is internal resistance.
Concentration loss can be calculated via the formula [38] below:
E c o n = B × ln ( 1 I F C I m a x )
where B is empirical constant and I m a x is maximum allowable current. The equation above can be used to identify relation between fuel cell voltage and current.
In fuel cells, oxygen and hydrogen react to transform chemical energy to electric energy. Energy transformation efficiency is defined as the ratio of output energy against input energy. The output energy of fuel cells is electric energy and the input energy is chemical energy. Additionally, some auxiliary equipment such as an air compressor and cooling fan are required to ensure normal and stable operation of a fuel-cell system. The ratio of energy consumed by such auxiliary equipment against total energy is referred to as auxiliary efficiency. Therefore, the efficiency of a fuel cell system can be defined as:
η F C S = η T H × η A U X = V F C 1.254 ( P F C P A U X   P F C )
where η T H is theoretical efficiency, η A U X is auxiliary efficiency and P A U X is auxiliary power.
An air compressor system and cooling system in a fuel cell are major auxiliary equipment and power required by the air compressor can be calculated according to the formula [39] below:
P c o m = C p T a i r η m e c η m o t ( ( P o u t P i n ) γ 1 γ 1 ) F c p
where P c o m is air compressor efficiency, η m e c is compressor mechanical efficiency, C p is specific heat capacity of air, T a i r is air inlet temperature, P i n and P o u t are air inlet and outlet pressures and γ is the value of air specific heat capacity.
Flow of the air compressor is determined by current output by fuel cells, as shown by the formula [40] below:
F c p = S × M a i r N c e l l × I F C 4 X O 2 × F
where S is stoichiometric ratio, M a i r is molar coefficient of air and X O 2 is molar coefficient of oxygen.
Hydrogen consumption of fuel cells is determined by output current of relevant system, as shown by the formula [41] below:
m H 2 = 0 t M H 2 N c e l l 2 F I F C ( t ) d t
where m H 2 is hydrogen mass consumption rate and M H 2 is molar mass of hydrogen.

4. Model Validation

In this paper, the performances of three vehicle models under CLTC-P are used as examples to validate the model. The models of BEV and FCV are established by AVL CRUISE, the power changes of BEV and FCV under cltc-p are simulated, and the power changes of FCHEV under CLTC-P are tested by a motor test bench. The power changes of the three models are shown in Figure 5. It can be seen from the figure that the wheel power of the vehicle changes with the change of speed. When the vehicle decelerates, the power of BEV and FCHEV will be less than 0, FCV cannot recover the energy when braking, so its wheel power is always greater than 0.
The energy consumption of the three models described in Figure 6 under CLTC-P. It can be seen from the figure that the difference between the gross energy consumption of the three models is within 5%. BEV and FCHEV can recover part of the energy, and the difference between energy recover is less than 5 %. The above results prove the reliability of the simulation model.

5. Results and Analysis

5.1. Simulation Results of Battery Electric Vehicle (BEV)

BEVs have a power system structure as shown in Figure 7 which mainly consists of a power battery, DC/DC and motor. Current input from lithium batteries flows to DC/alternating current (AC) after boosting at DC/DC and then into a three-phase AC motor for it to drive EVs to move.

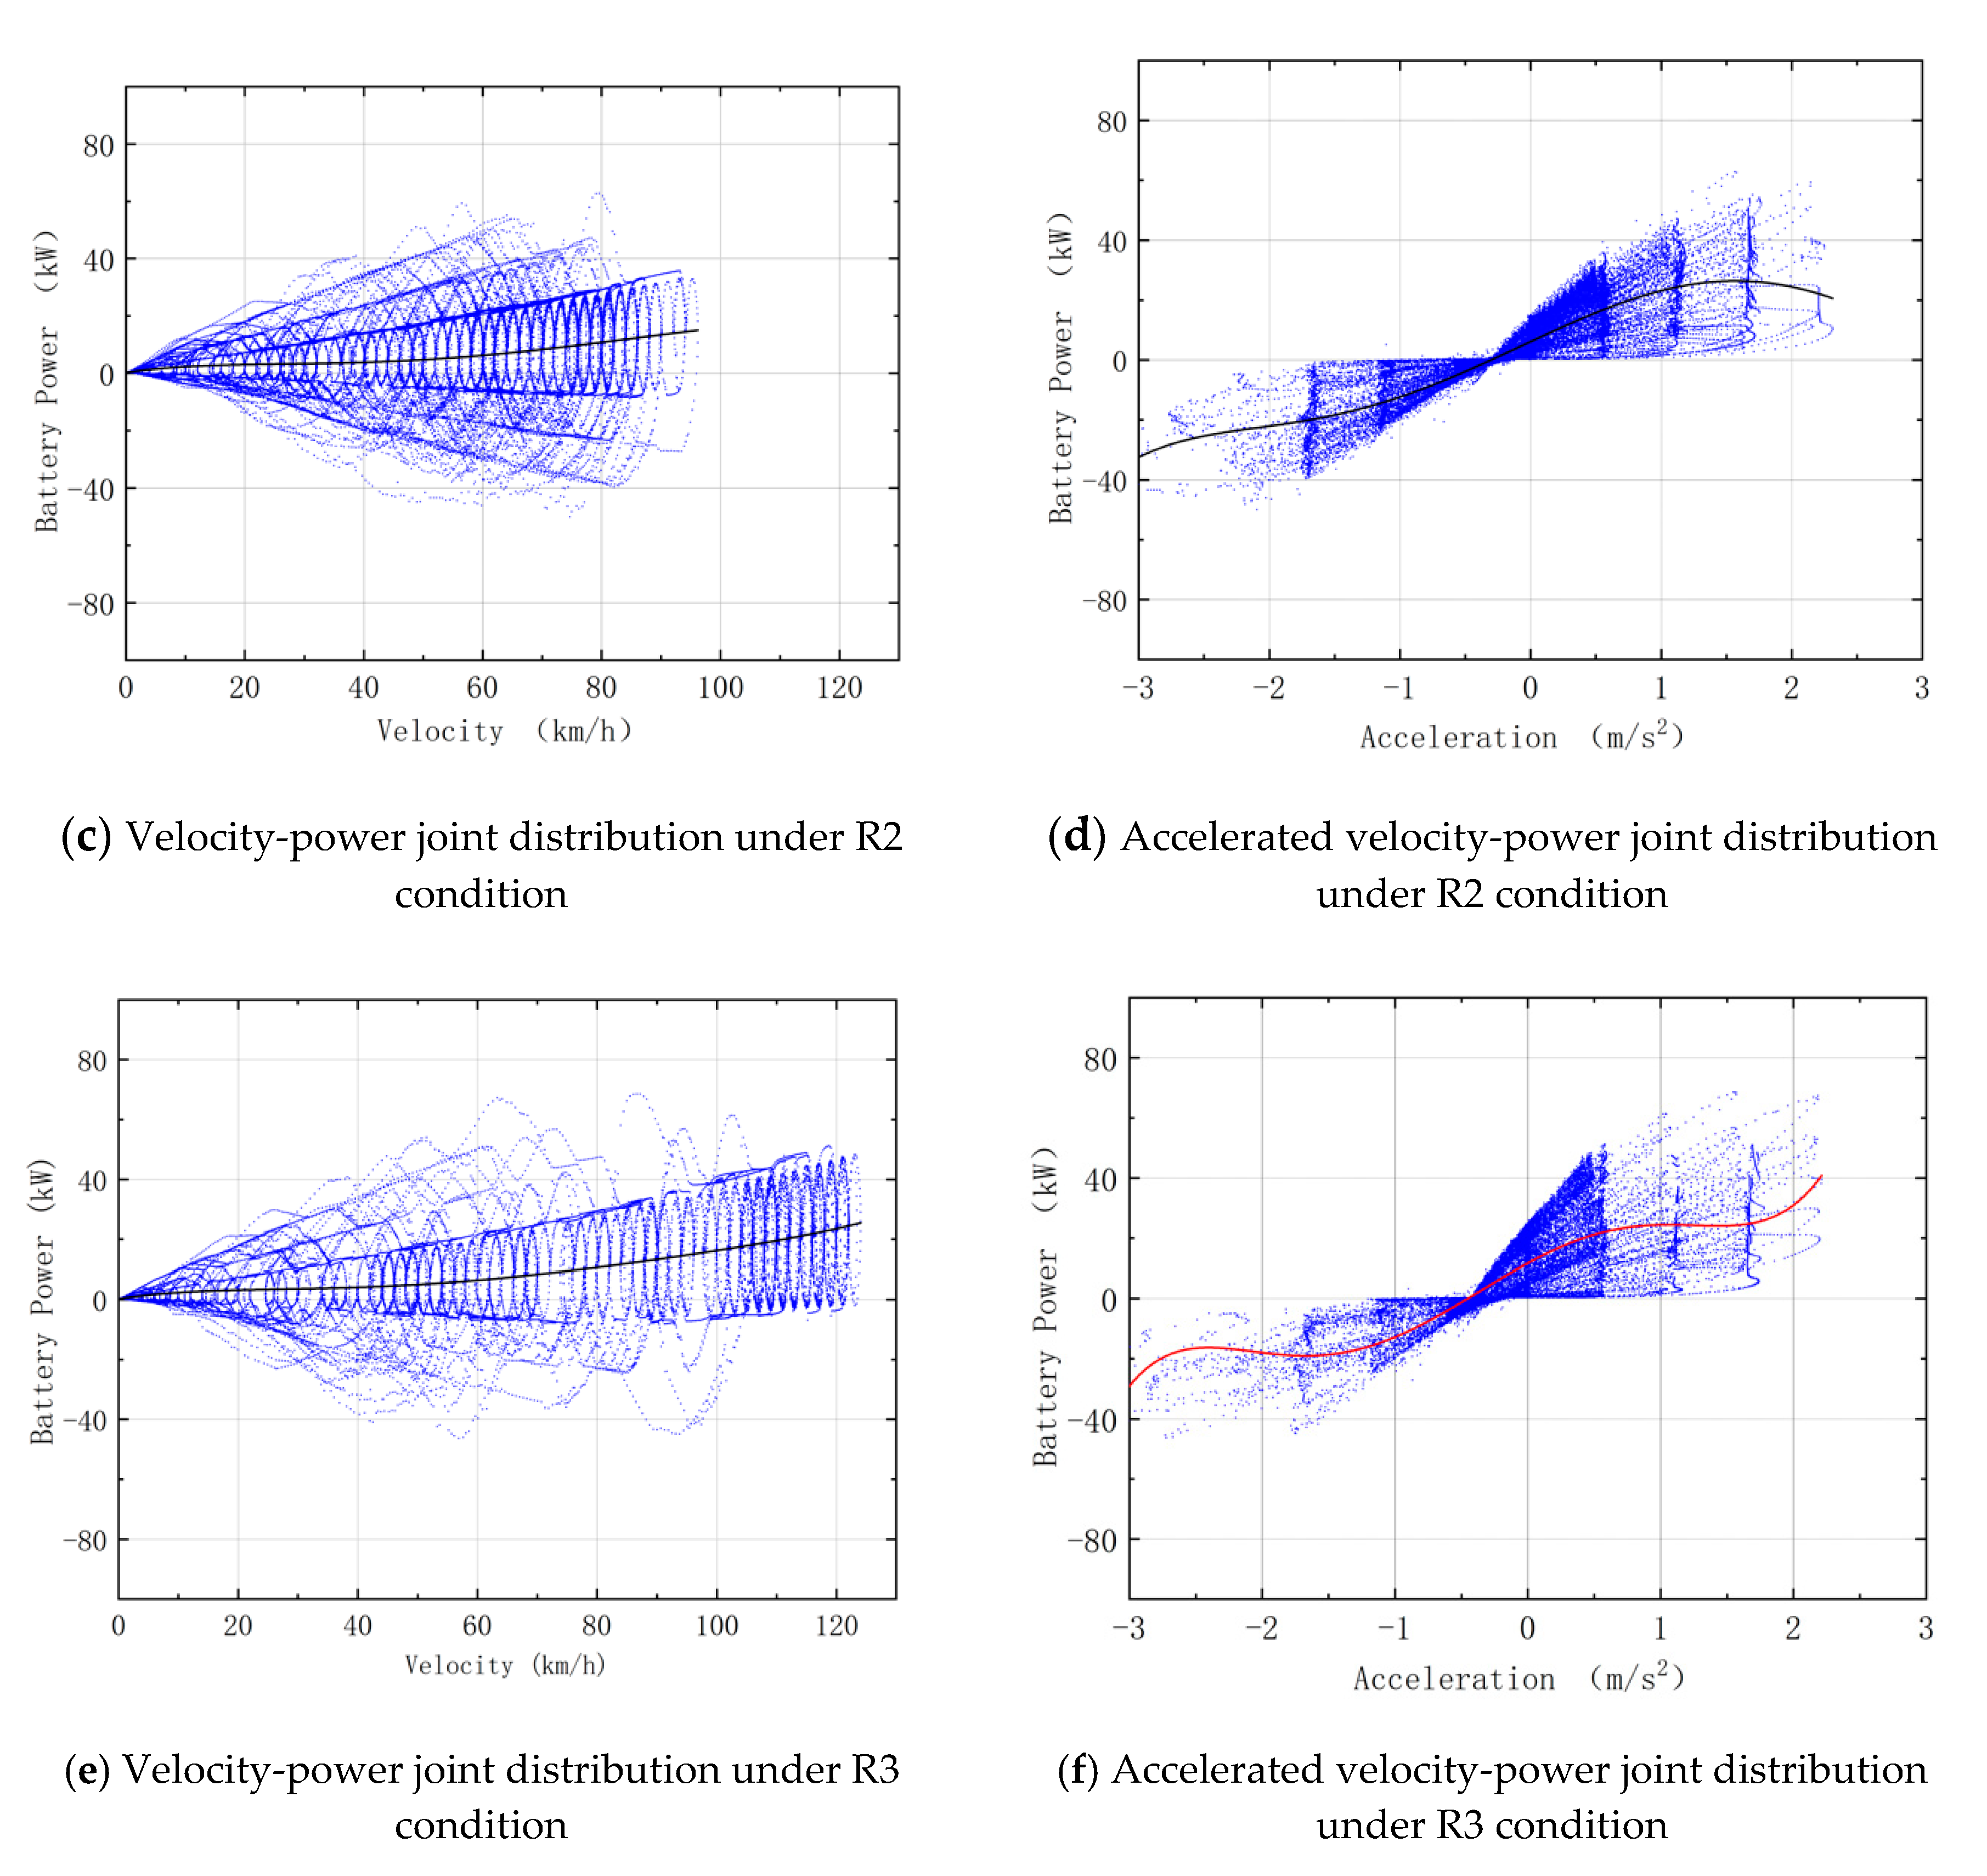
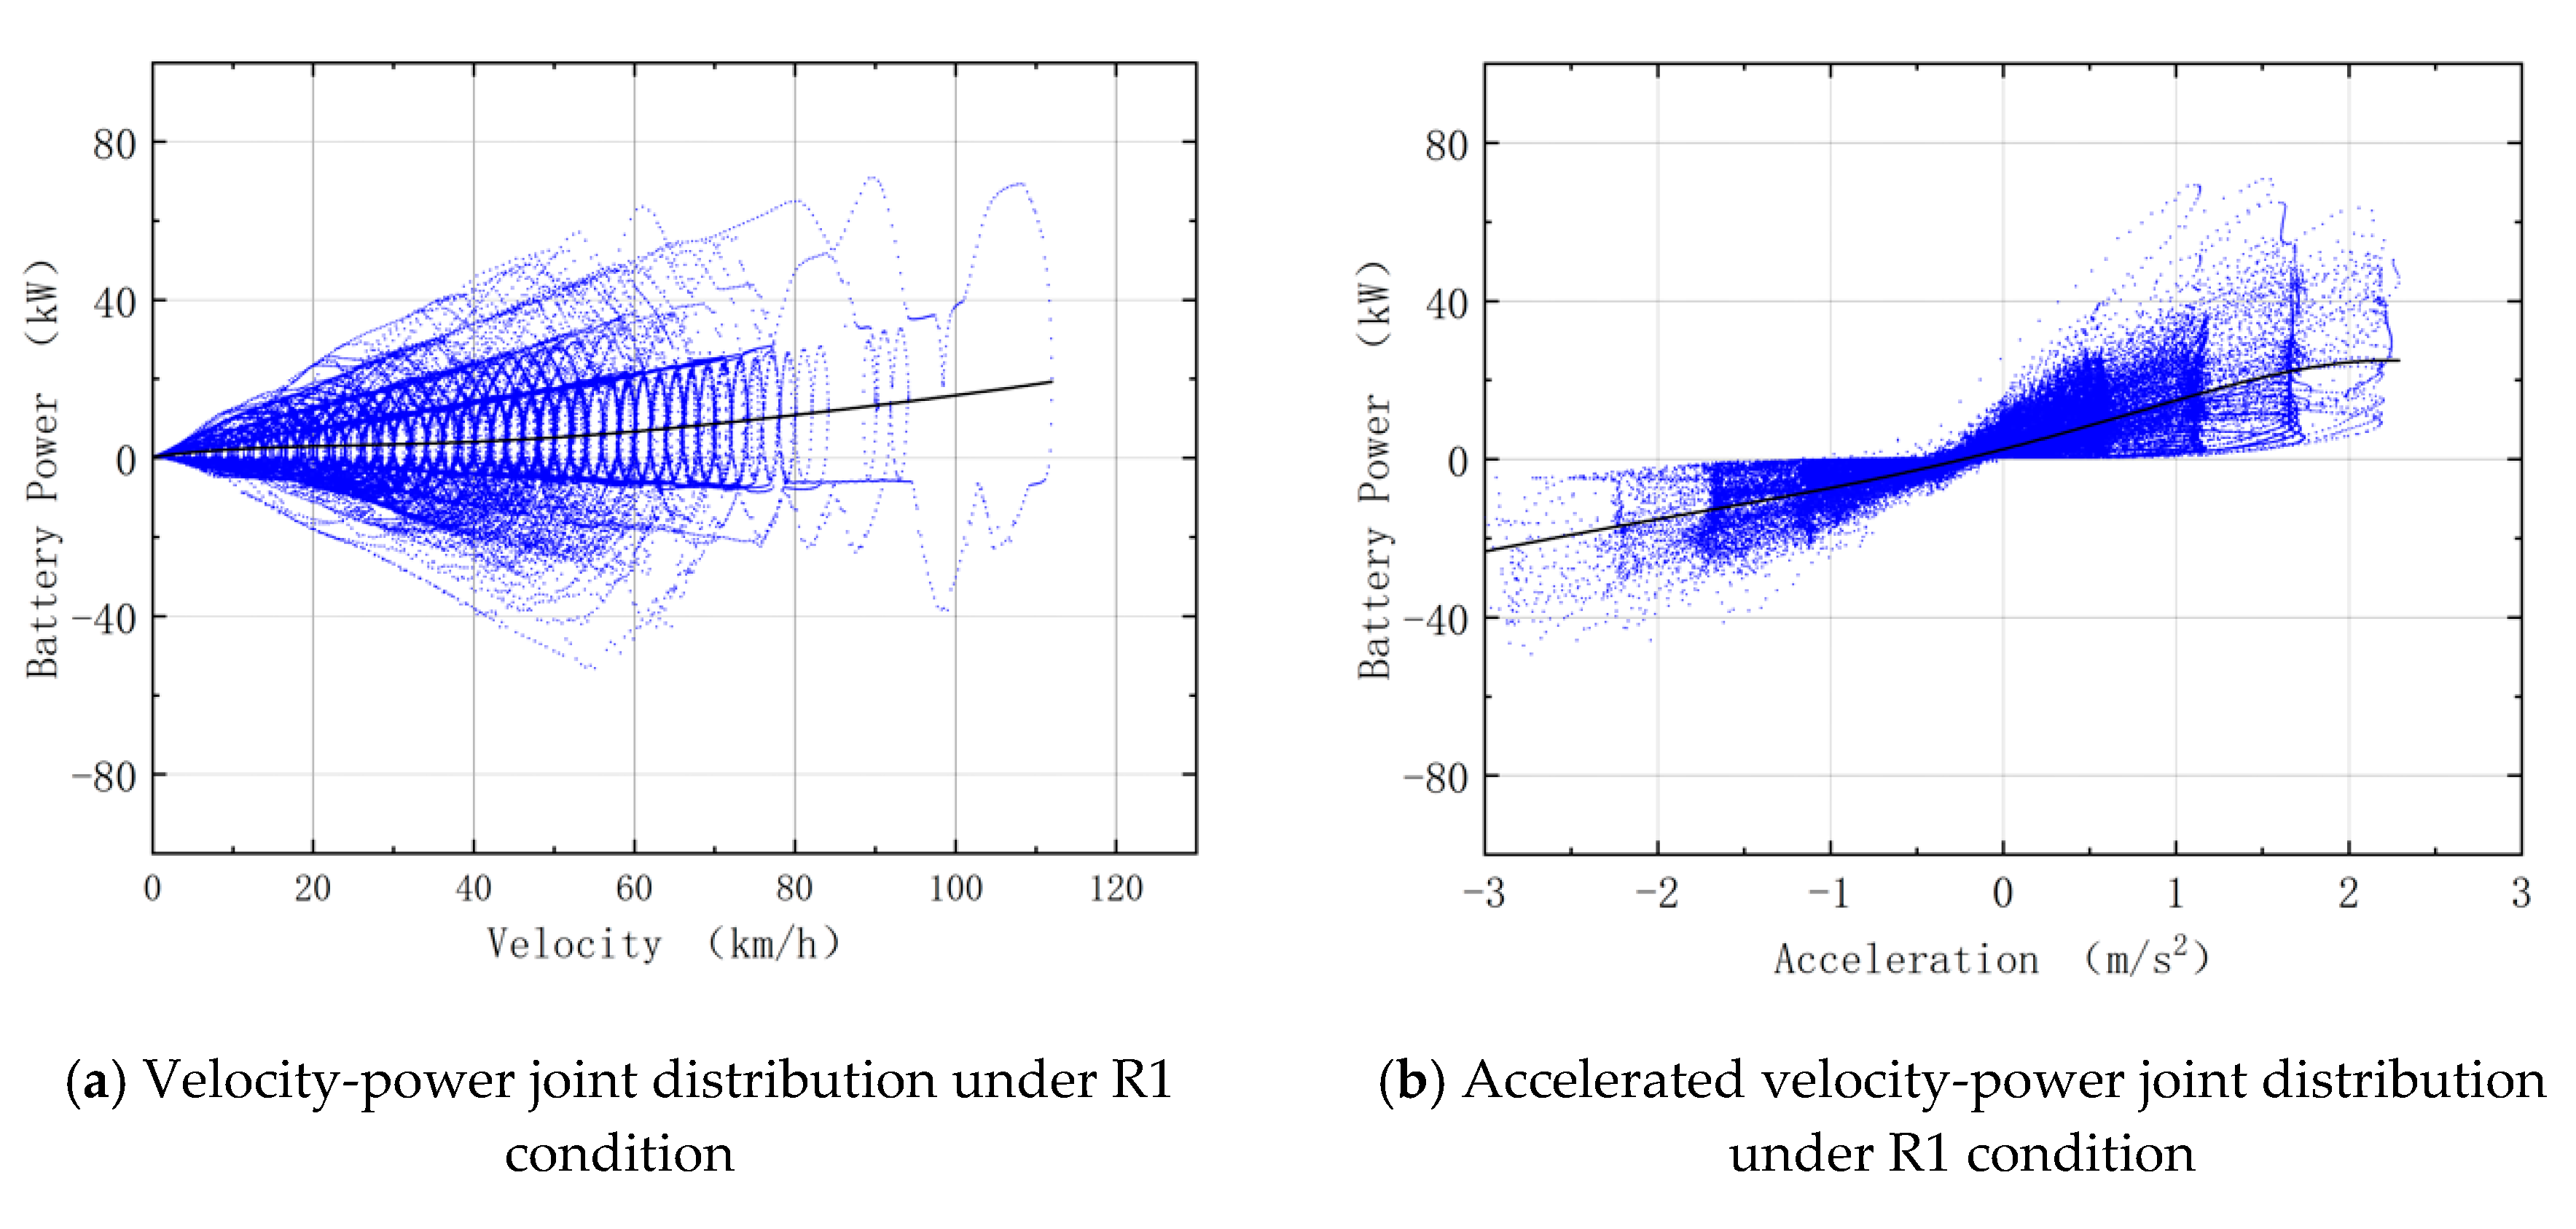
5.1.1. Joint Distribution of Velocity, Accelerated Velocity and Battery Power of BEV under Three Road Conditions

A significant advantage EVs have over traditional fuel vehicles is that the energy recycling system of the former can recover energy during deceleration. Figure 8 describes joint distribution of velocity, accelerated velocity and power of BEV under three real-world driving cycles. In this figure, a power larger than 0 indicates discharging of the vehicle; a power smaller than 0 indicates charging of its battery; an accelerated velocity larger than 0 indicates acceleration of the vehicle; an accelerated velocity smaller than 0 indicates deceleration of the vehicle. We can see from the figure that power distribution range of the vehicle increases along with the increase in velocity under these three road conditions. Under the R1 condition, the power of the vehicle falls into the range of −20–20 kw; under the R2 condition, the power of the vehicle falls into the range of −40–40 kw; under the R3 condition, the power of the vehicle falls into the range of −60–60 kw.

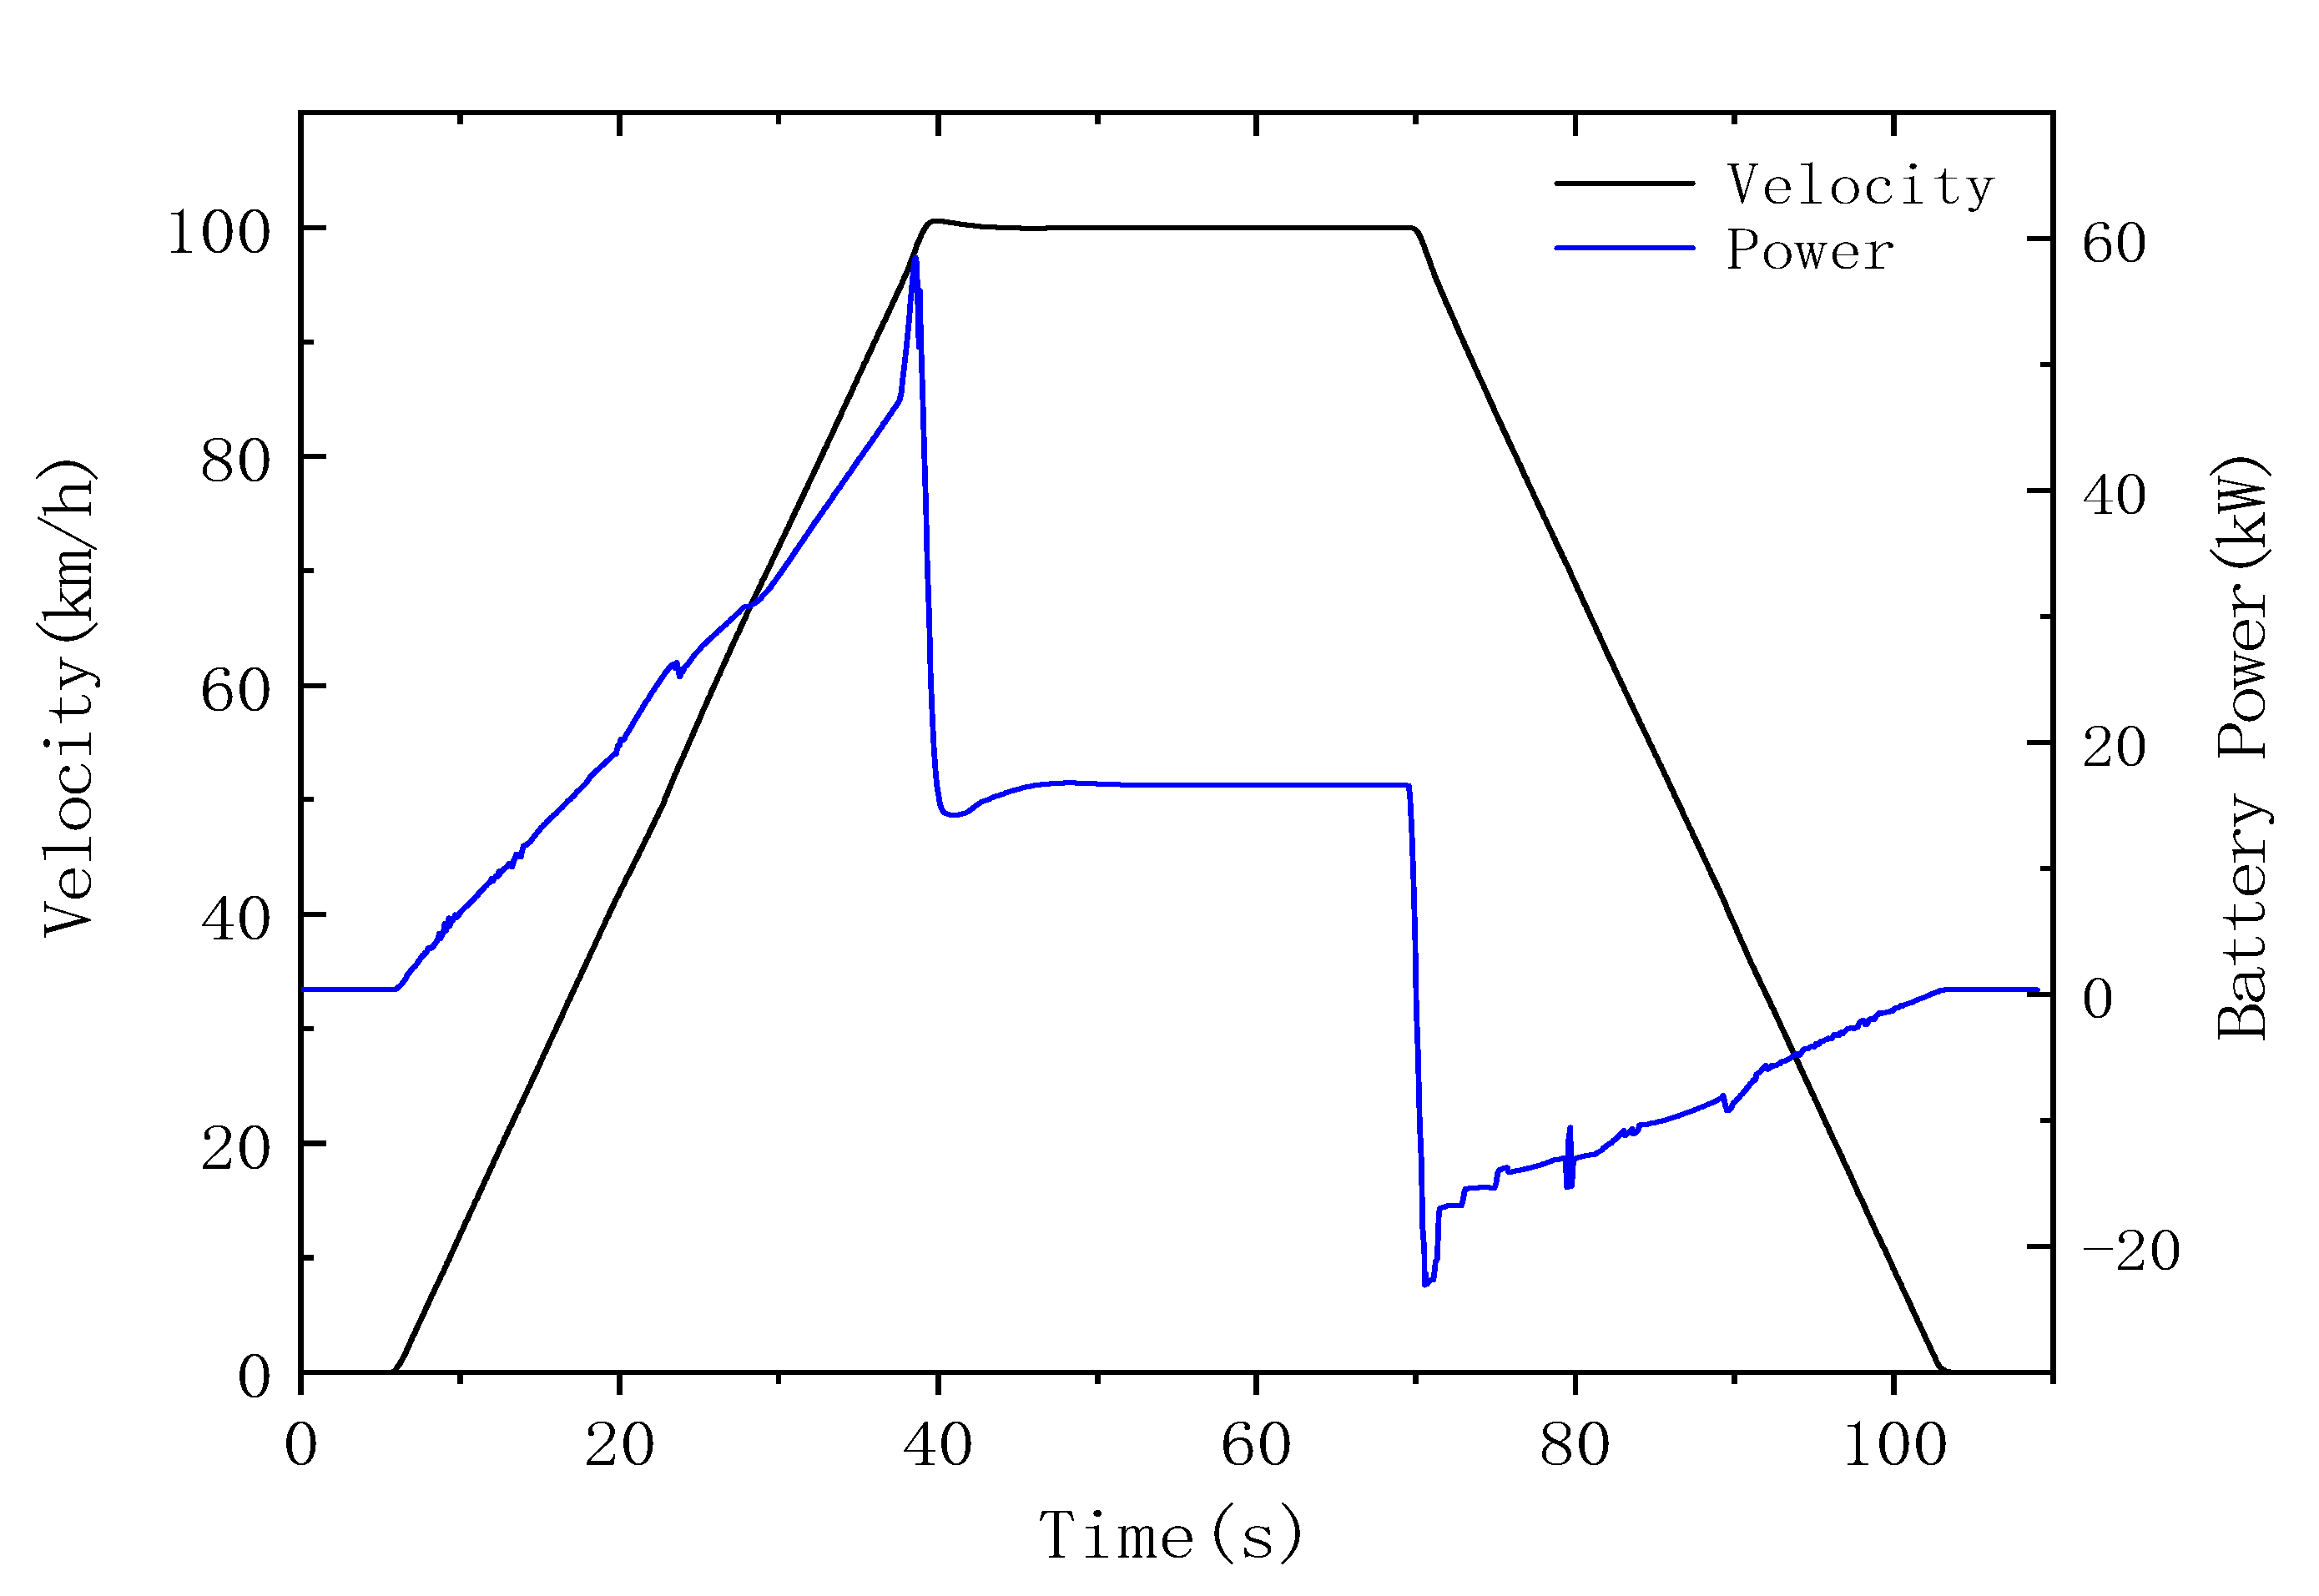
5.1.2. BEV 0–100 km/h Acceleration Performance Test

Figure 9 describes the process of BEV accelerating from 0 km/h to 100 km/h. Its battery output power keeps increasing in the process. When the velocity of the vehicle reaches steady state, battery output power quickly drops to steady state as well. When the vehicle starts decelerating, its energy recycle system charges the battery. The charging power decreases as the velocity drops until the velocity reaches 0 km/h and the charging power also reaches 0 kW.

5.1.3. BEV Cruising Performance Test

Figure 10 describes changes in output power when BEV is tested in cruising mode with a velocity from 0 to 160 km/h. We can tell from the figure that the battery output power keeps increasing during acceleration of the BEV. When its velocity reaches steady state, the battery output power reaches steady state as well. When the vehicle decelerates, its energy recycle system starts working. At such a moment, its battery power is lower than 0, until the vehicle velocity turns to 0 km/h.

5.2. Simulation Results of Fuel-Cell Vehicle (FCV)

A FCV mainly consists of a proton exchange membrane fuel cell, DC/DC and motor and its power system structure is as shown in Figure 11. The current generated by fuel cells flows to DC/AC to be converted into AC after boosting at DC/DC and then runs to three-phase AC motor to drive the vehicle forward.

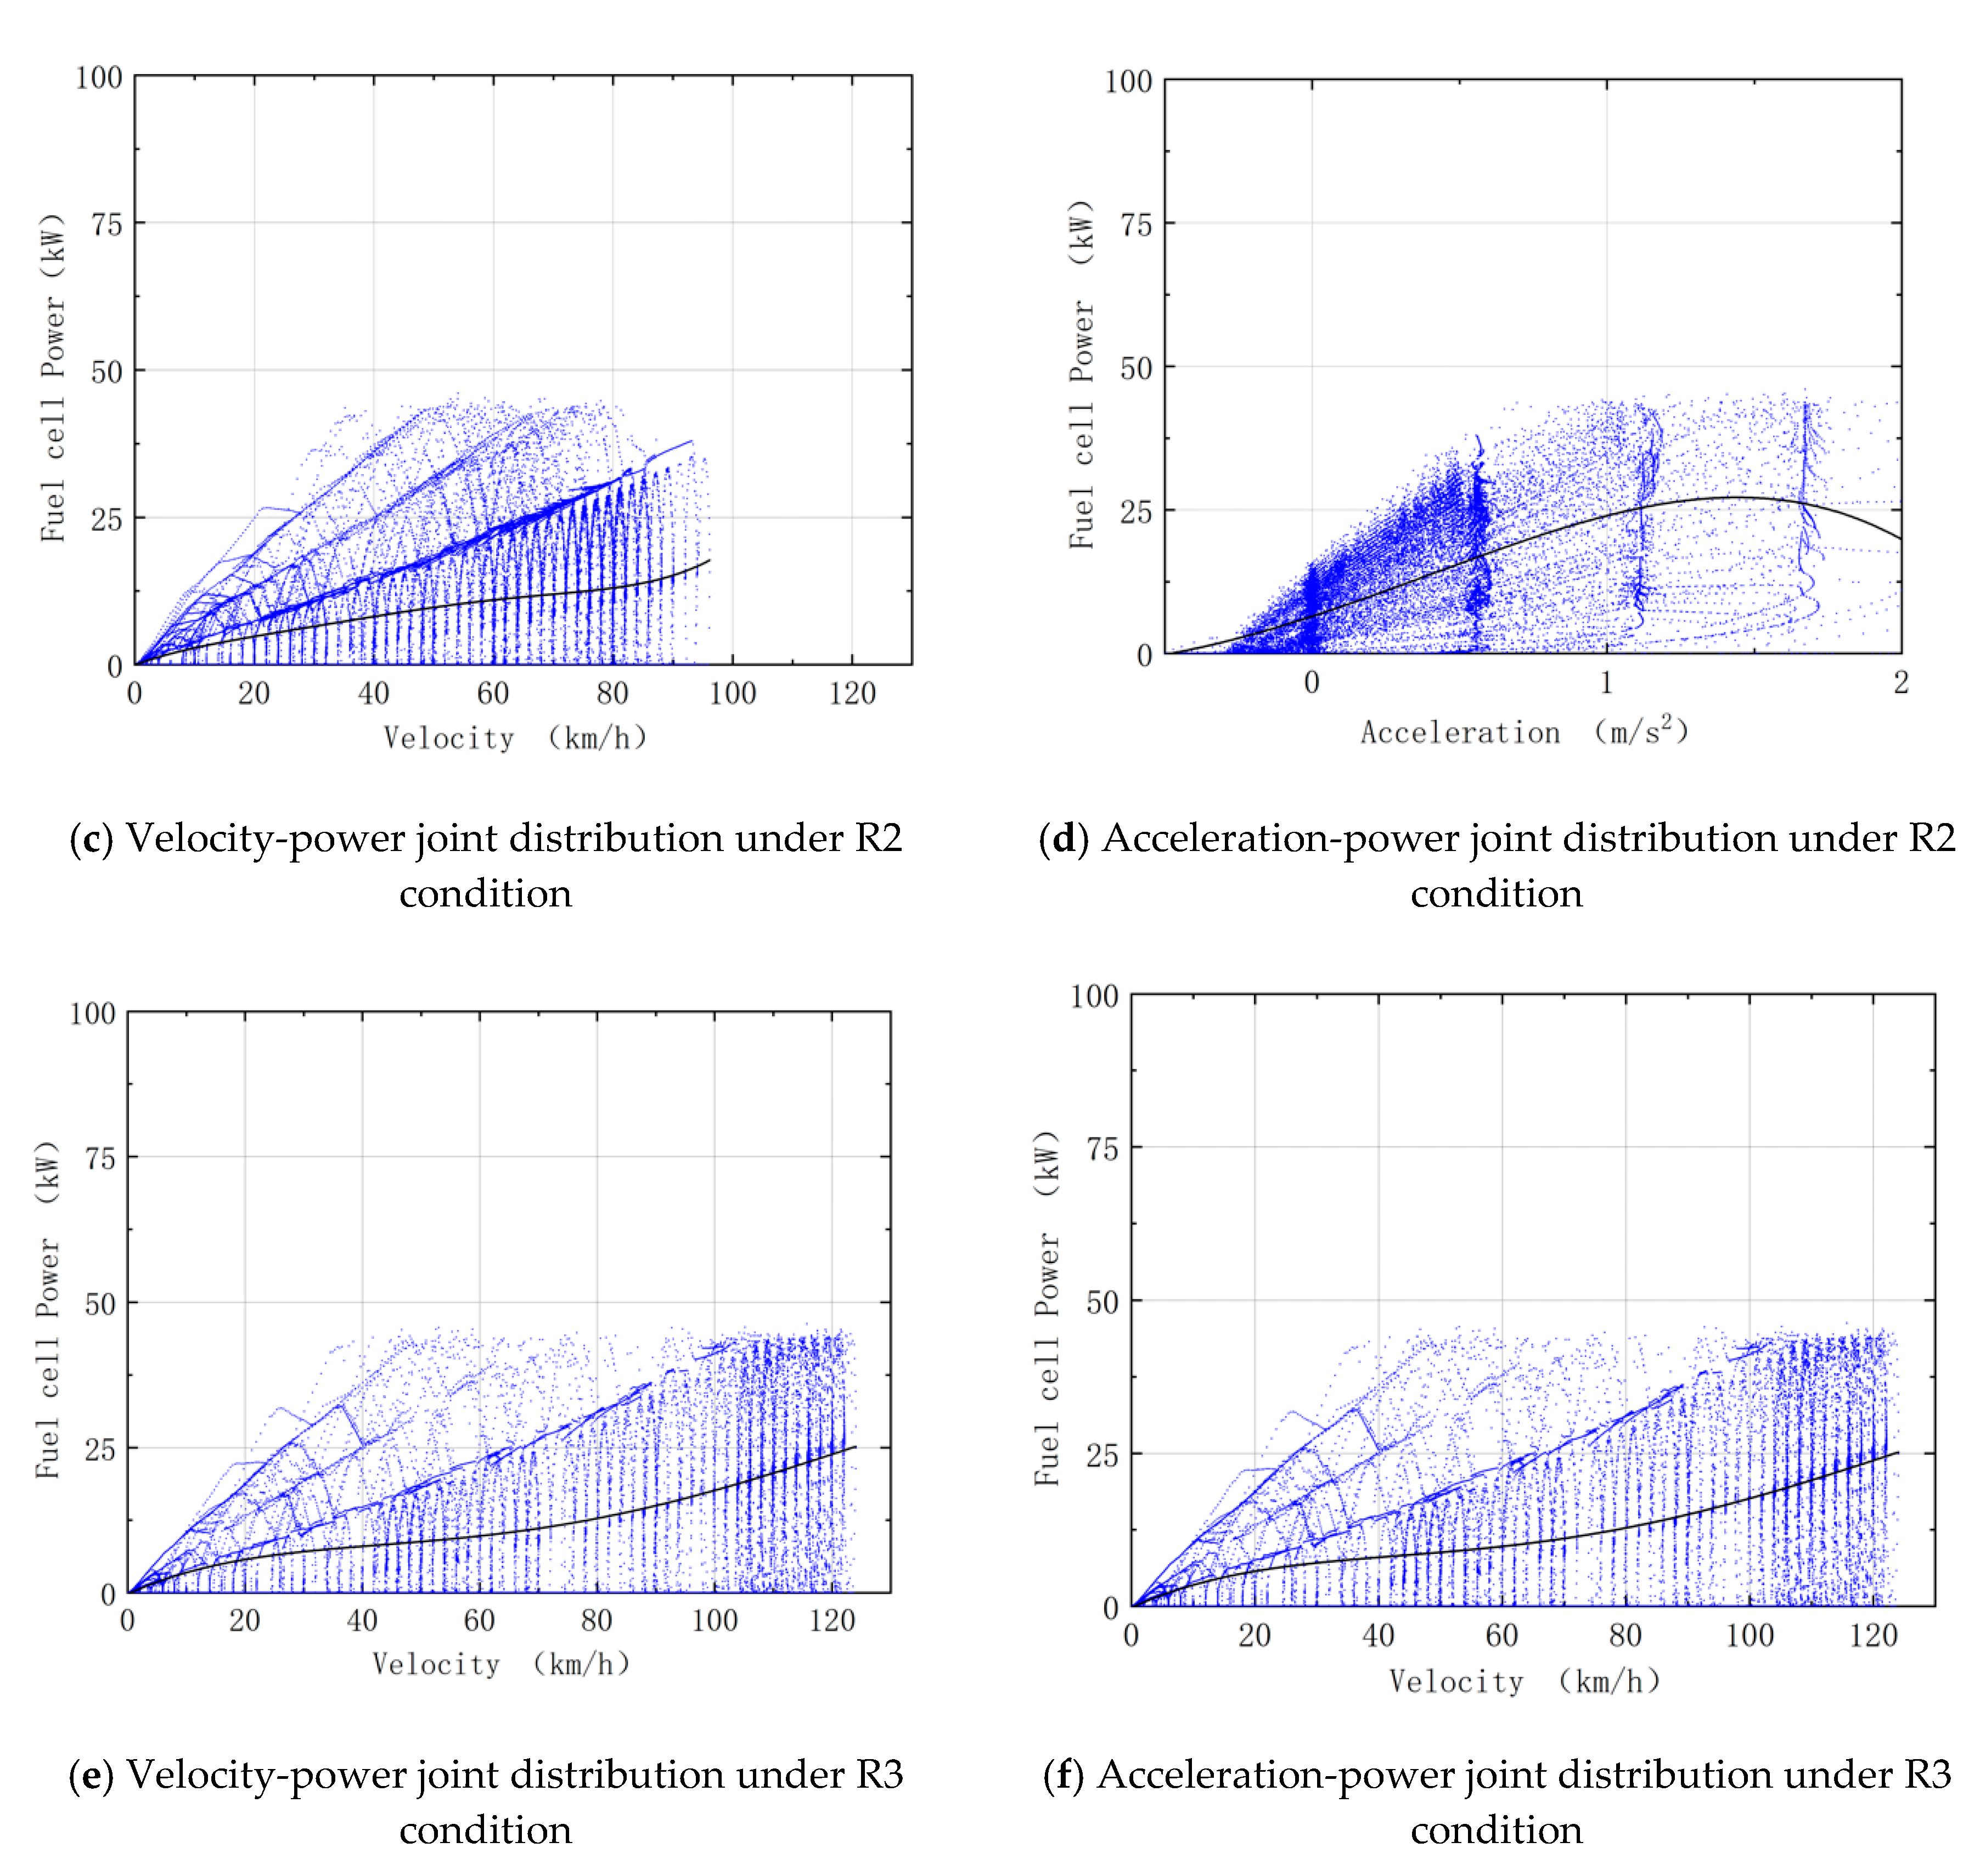
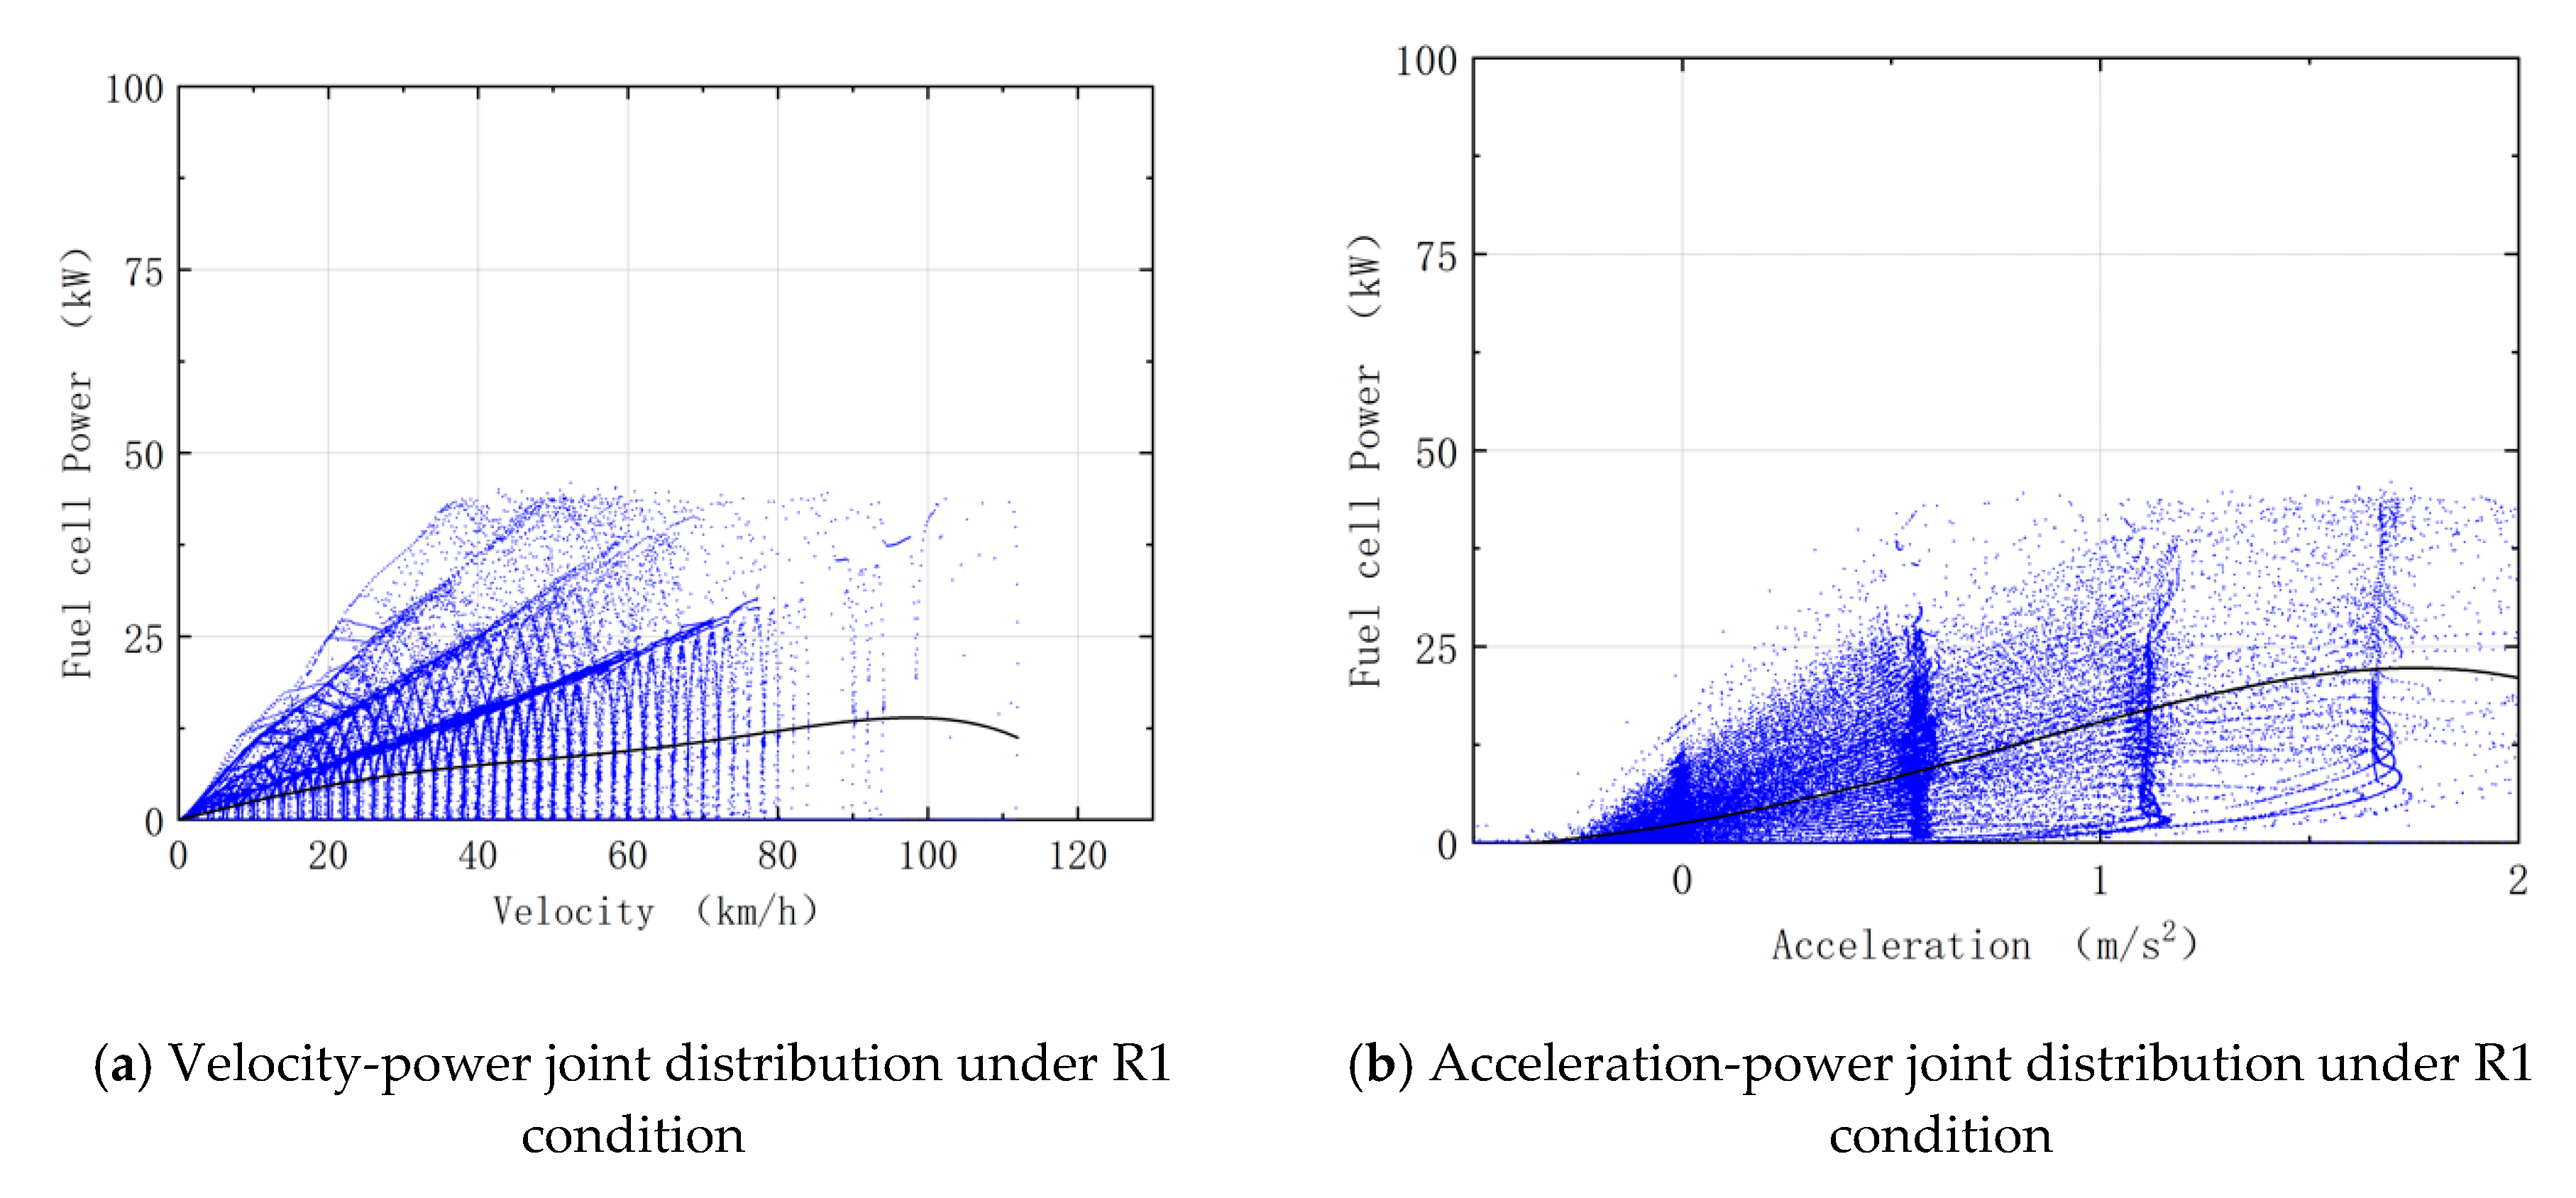
5.2.1. Joint Distribution of Velocity, Accelerated Velocity and Fuel-Cell Power of FCV under Three Road Conditions

Figure 12 describes relations between velocity, accelerated velocity and power of a fuel cell under three real-world driving cycles. Since a FCV has no energy-storing device, it has no energy recycle system and therefore, its fuel cell output power is larger than 0. We can tell from the figure that power range increases as the velocity increases. Under the R1 condition, the power mainly falls into the range of 0–30 kW; under the R2 condition, the power mainly falls into the range of 0–40 kW; under the R2 condition, the power mainly falls into the range of 0–50 kW.
After a comprehensive comparison of Figure 8 and Figure 12, we find that power distribution range of a BEV or FCV increases along with its velocity. The BEV has an energy recycle system and can recover some energy during deceleration; while the FCV has no such device and cannot recover its braking energy. Therefore, the FCV has larger energy consumption than BEV.

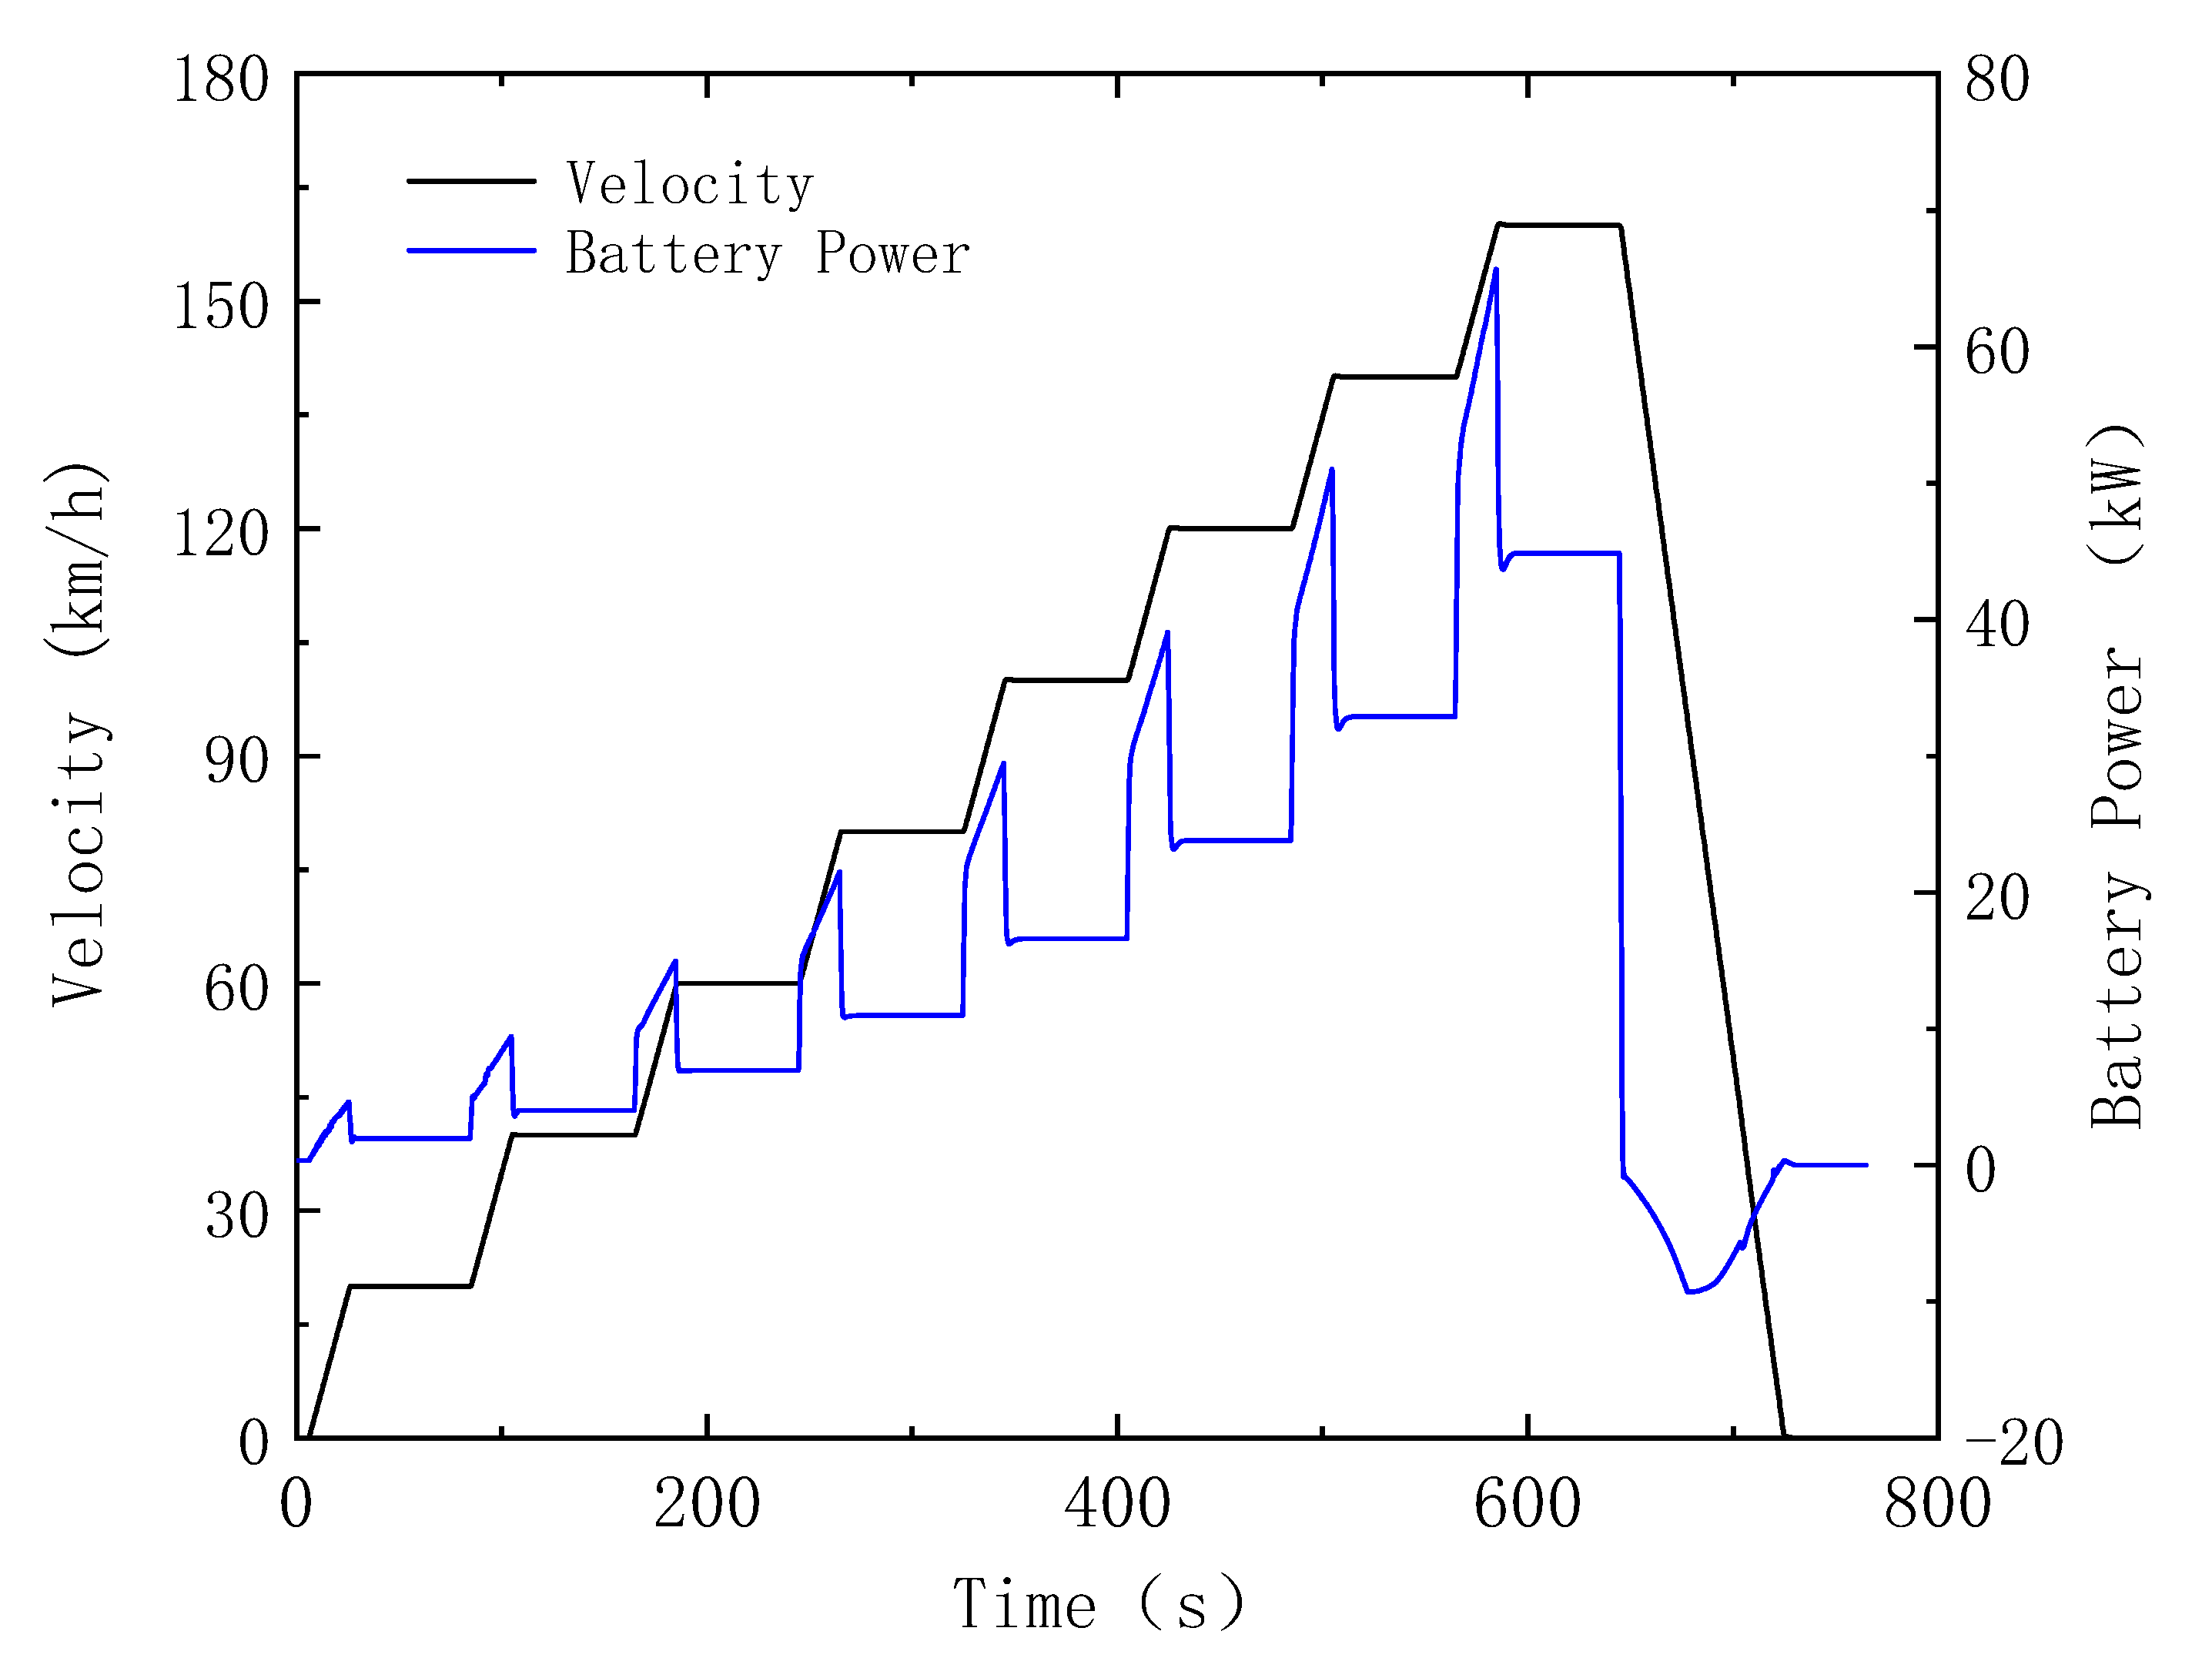
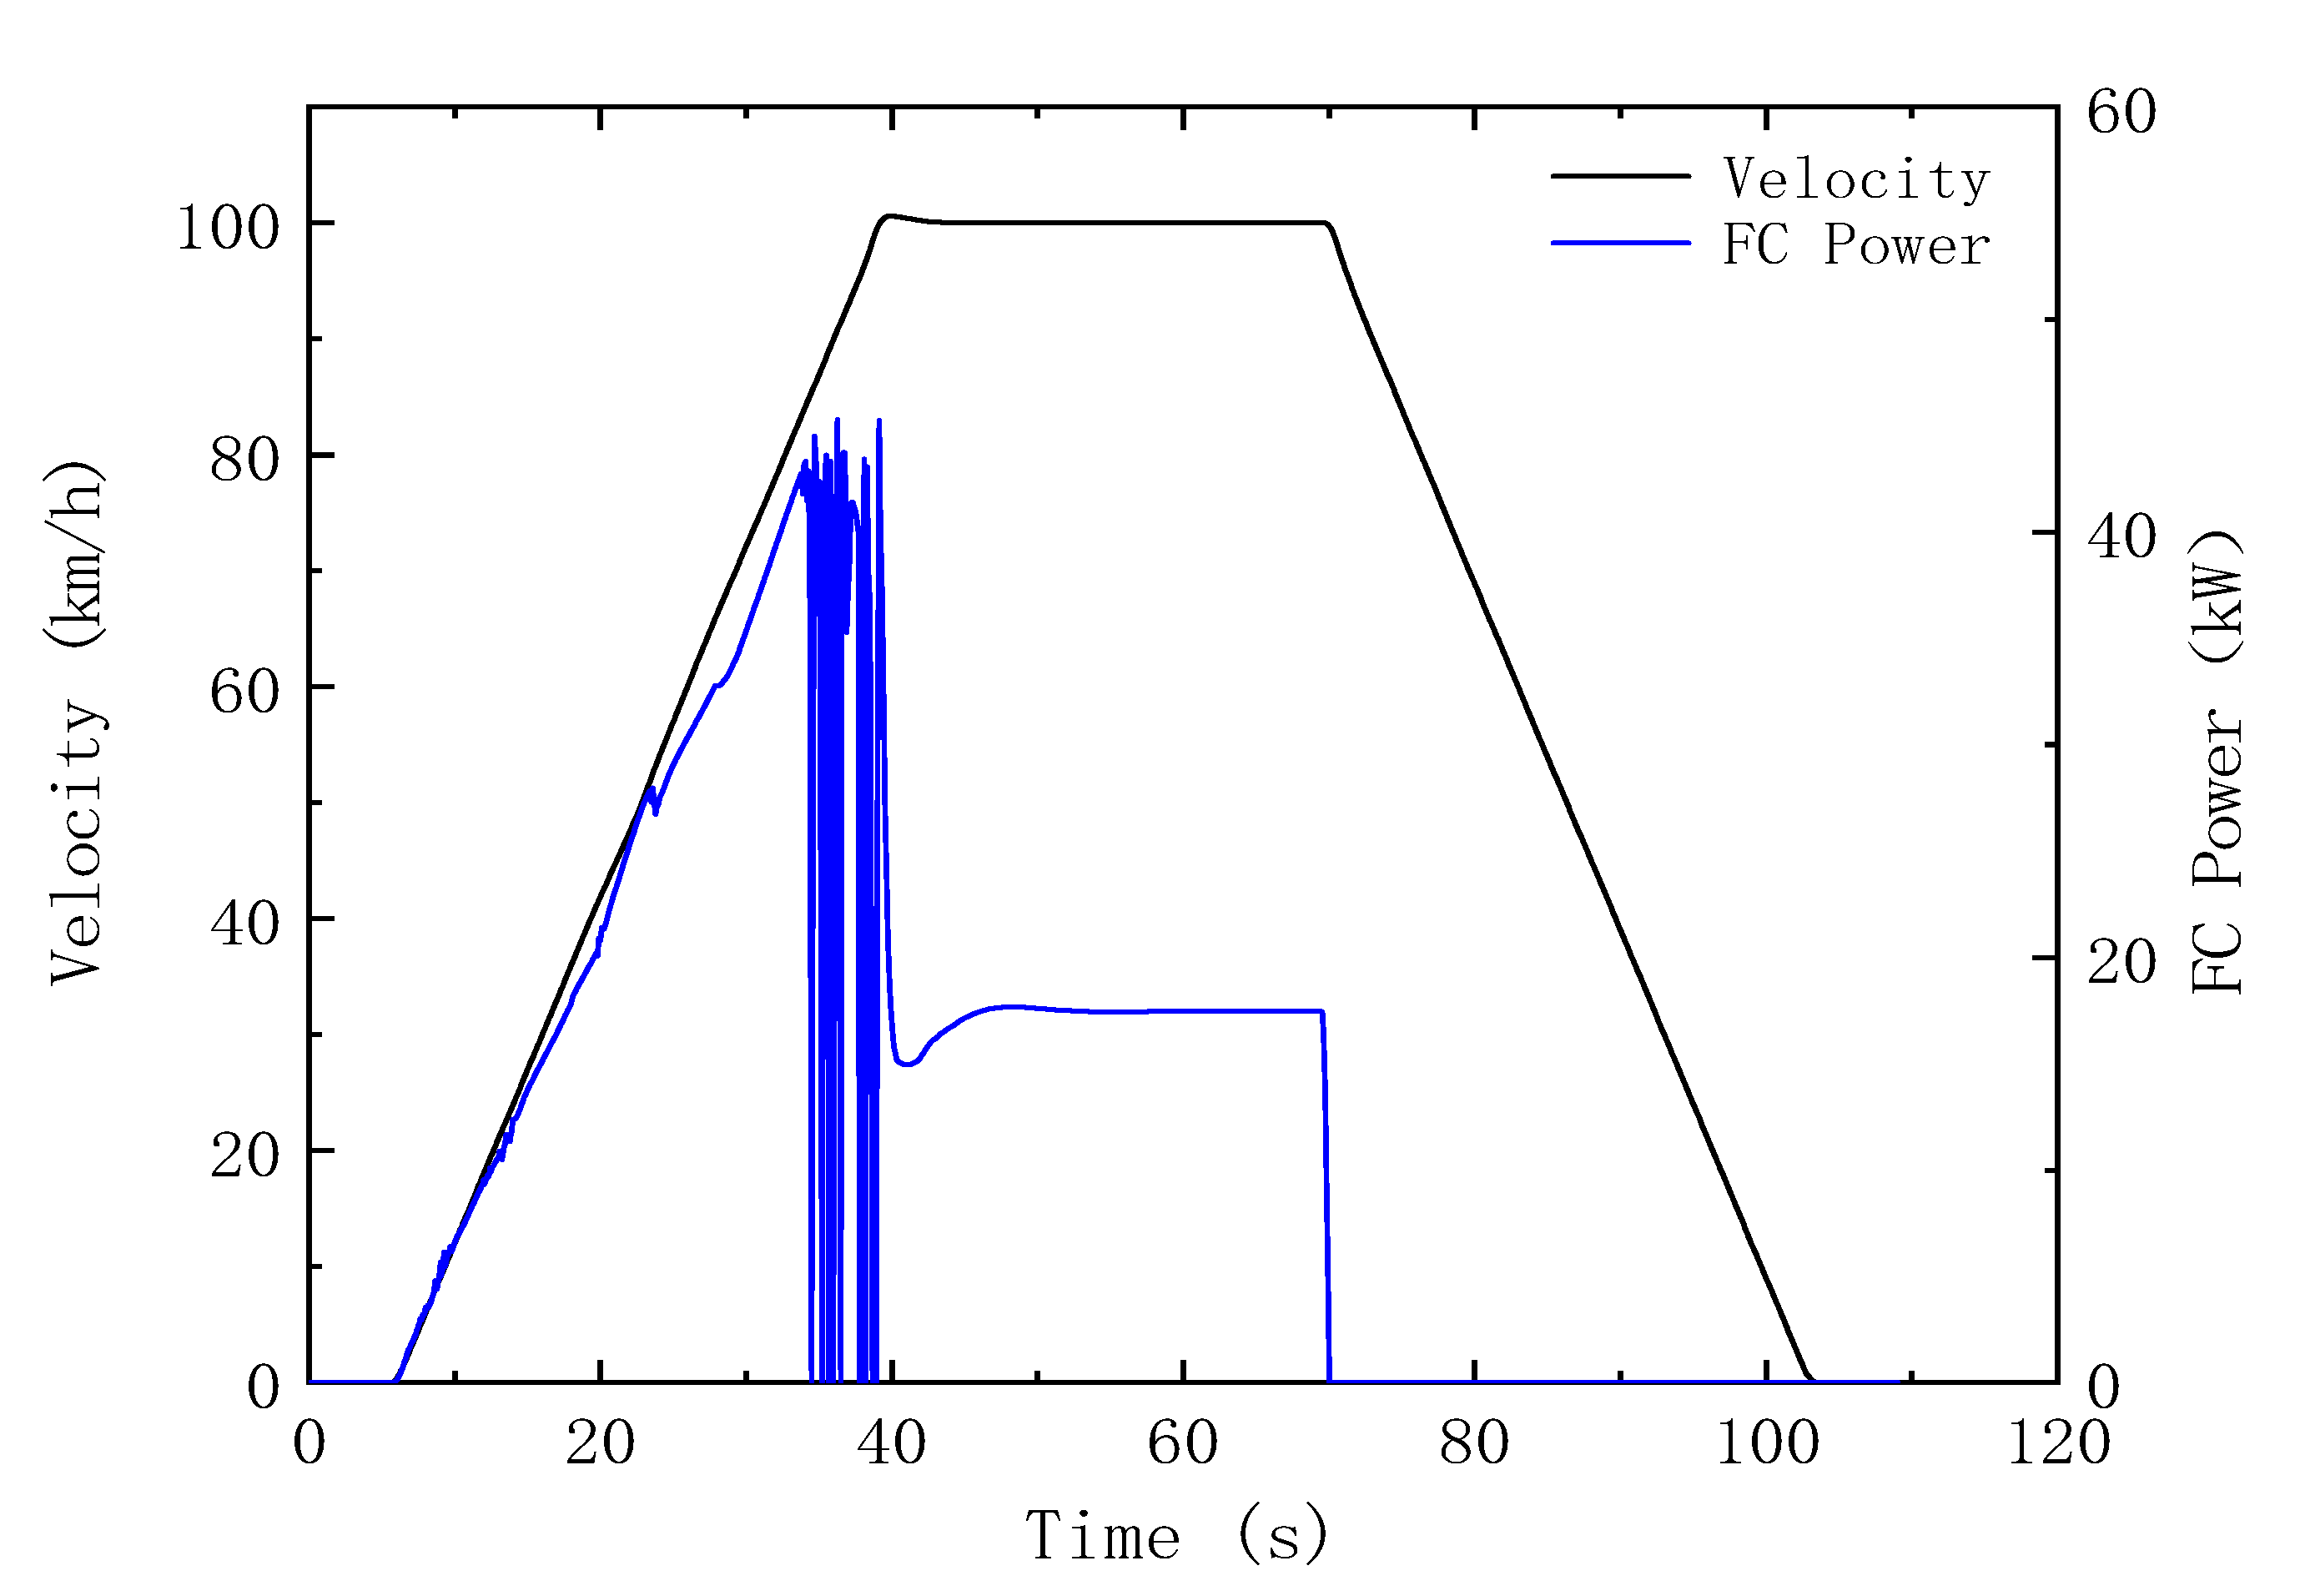
5.2.2. 0–100 km/h Acceleration Performance Test

Figure 13 describes changes in fuel cell power when FCV accelerates from 0 to 100 km/h. We can see from the figure that when the vehicle starts accelerating, fuel-cell power increases gradually; when the velocity continues to increase, fuel-cell power fluctuates. When the velocity stabilizes at 100 km/h, fuel-cell power also stabilizes. When the velocity drops, fuel-cell power drops to zero, which means no power is output.

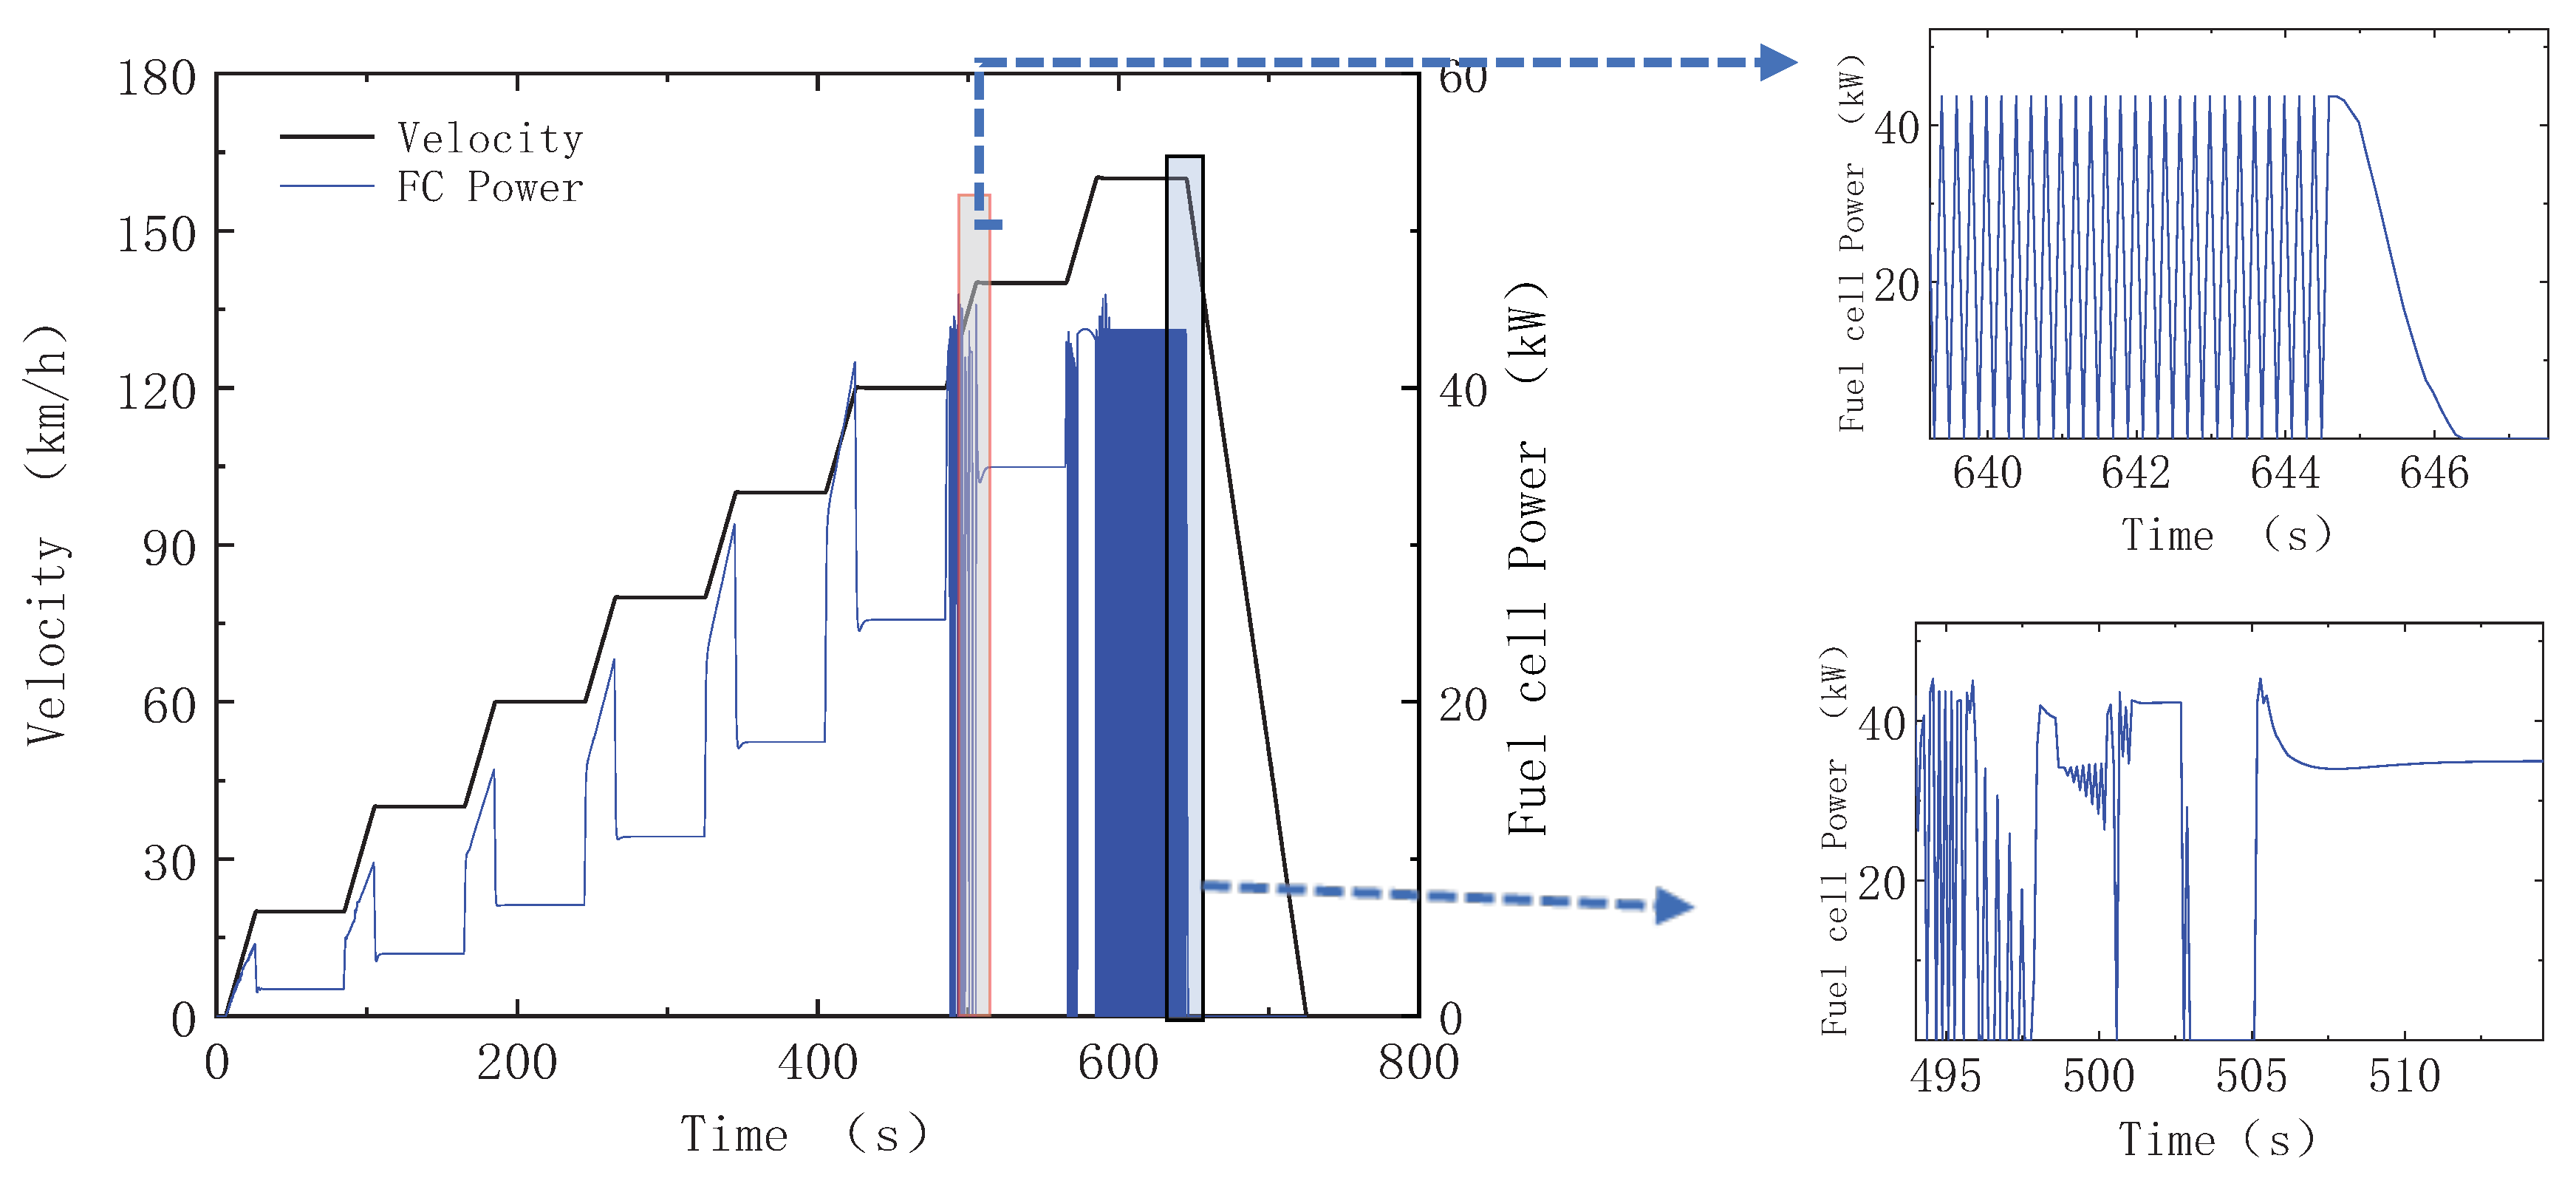
5.2.3. FCV Cruising Performance Test

Figure 14 describes changes in fuel-cell power of the FCV in cruising mode. We can see from the figure that when the vehicle starts accelerating, its fuel-cell power increases. When the vehicle accelerates from 120 km/h to 140 km/h or when its velocity reaches 160 km/h, fuel-cell power fluctuates and the fuel cell works unstably.

5.3. Test Results of Fuel-Cell Hybrid Electric Vehicle (FCHEV)

In the test, a model of a FCHEV from a certain country is used whose main structure is as shown in the Figure 15. The fuel cell is its main source of power. It outputs energy when the vehicle accelerates and recovers energy when the vehicle decelerates. This guarantees power performance and cruising ability and reduces emission to zero. Due to restrictions in test conditions, performance of the vehicle is tested under NEDC instead of R1, R2 and R3 conditions.

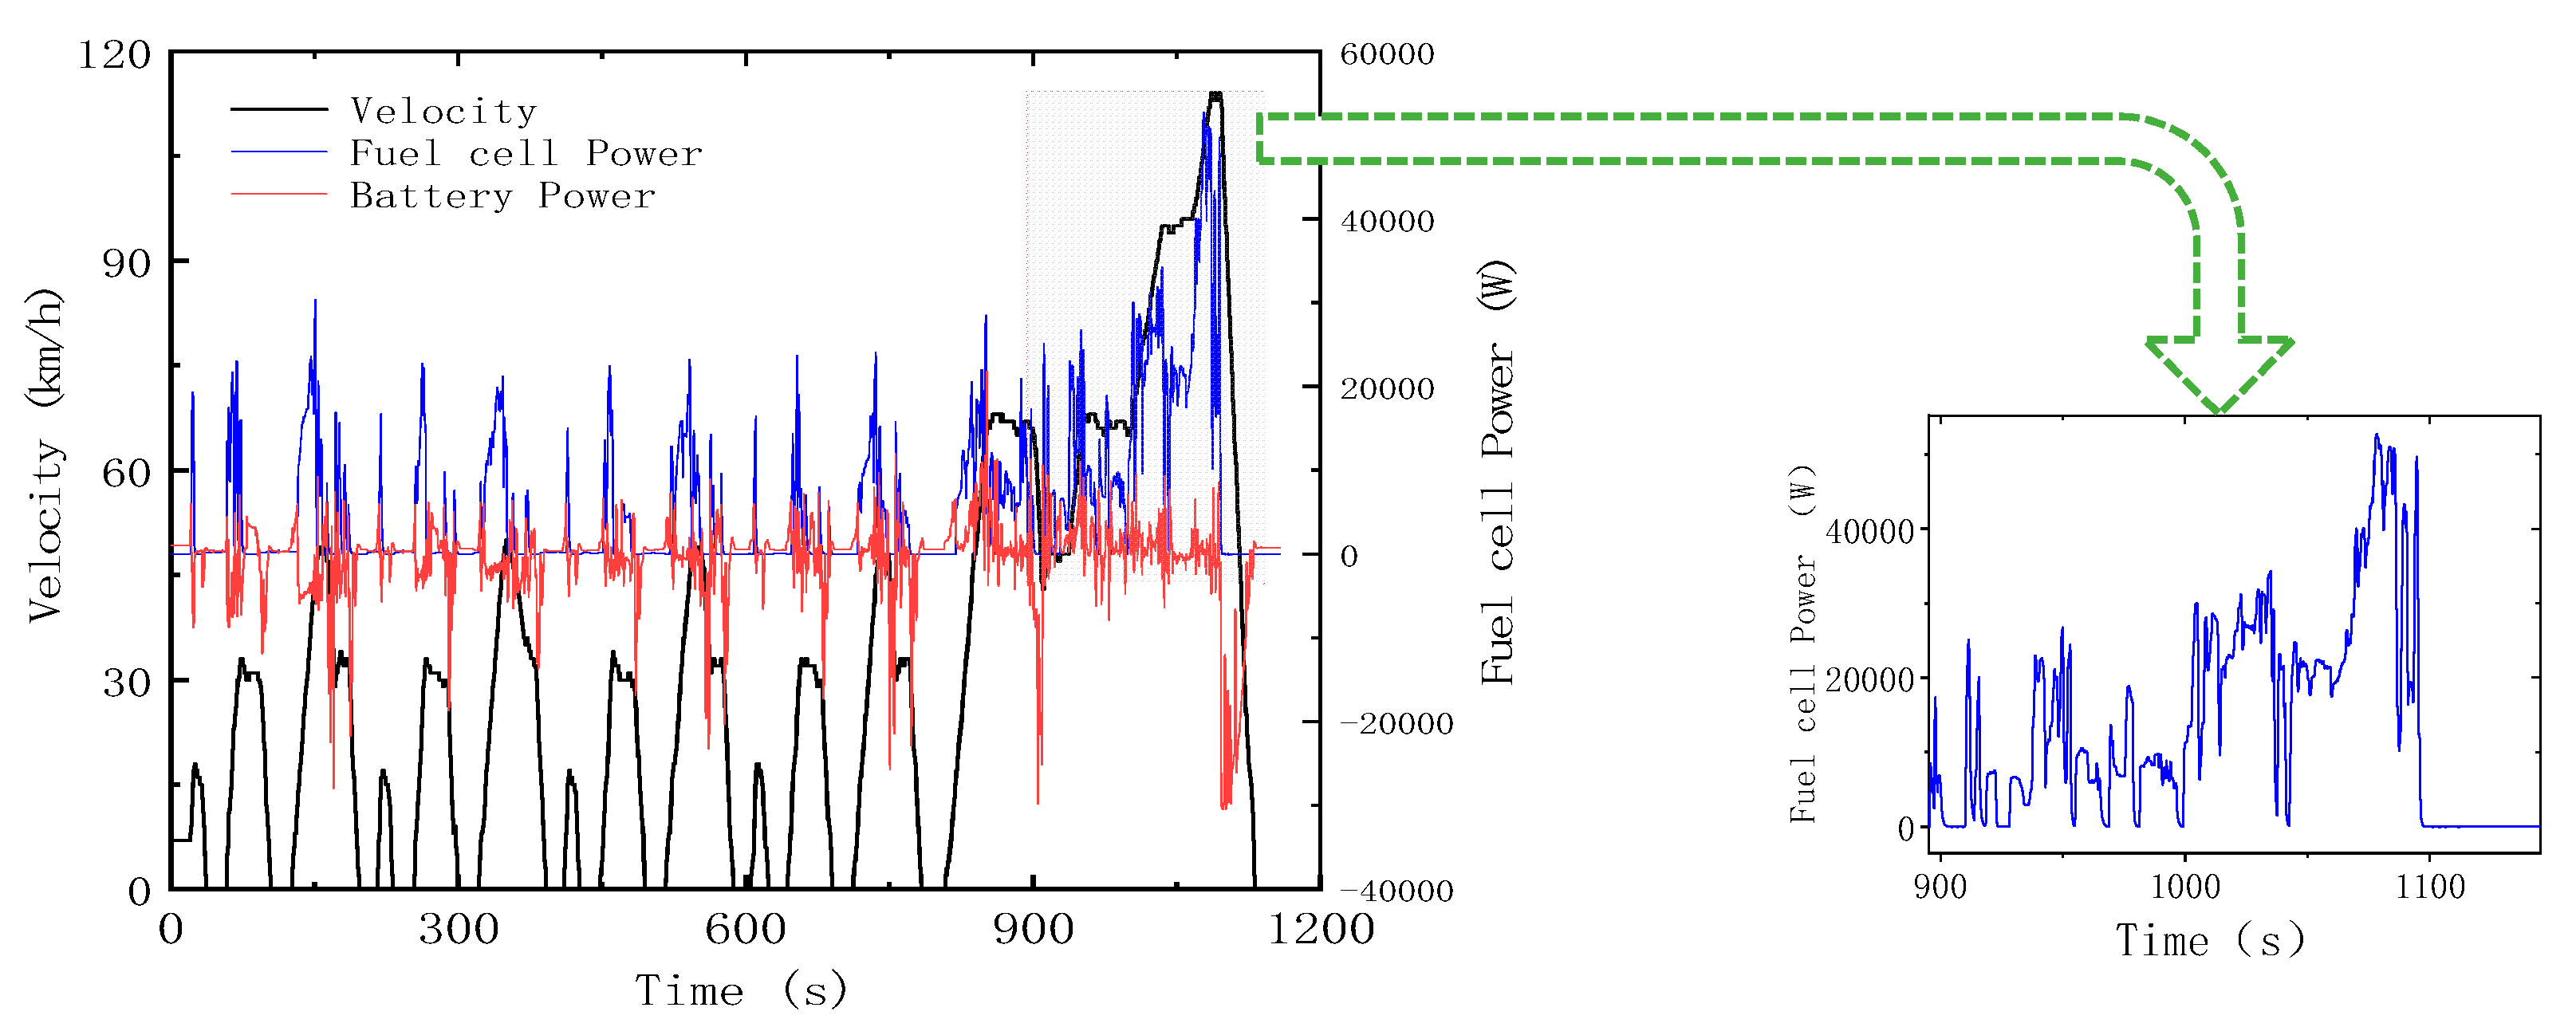
5.3.1. New European Driving Cycle (NEDC) Condition

Figure 16 describes changes in power of main components of FCHEV under NEDC. We can see from the figure that as the velocity of the vehicle increases, its fuel cell power increases; when the vehicle decelerates, its fuel cell power drops to zero. When the vehicle keeps accelerating at high velocity, its fuel-cell power fluctuates.
A comprehensive comparison of Figure 13, Figure 14 and Figure 16 reveals that, when FCV keeps accelerating or runs at high velocity, its fuel cell output power fluctuates. This is because the fuel cell is not suitable for operation under high load and long-time operation under high load will seriously compromise its service life.

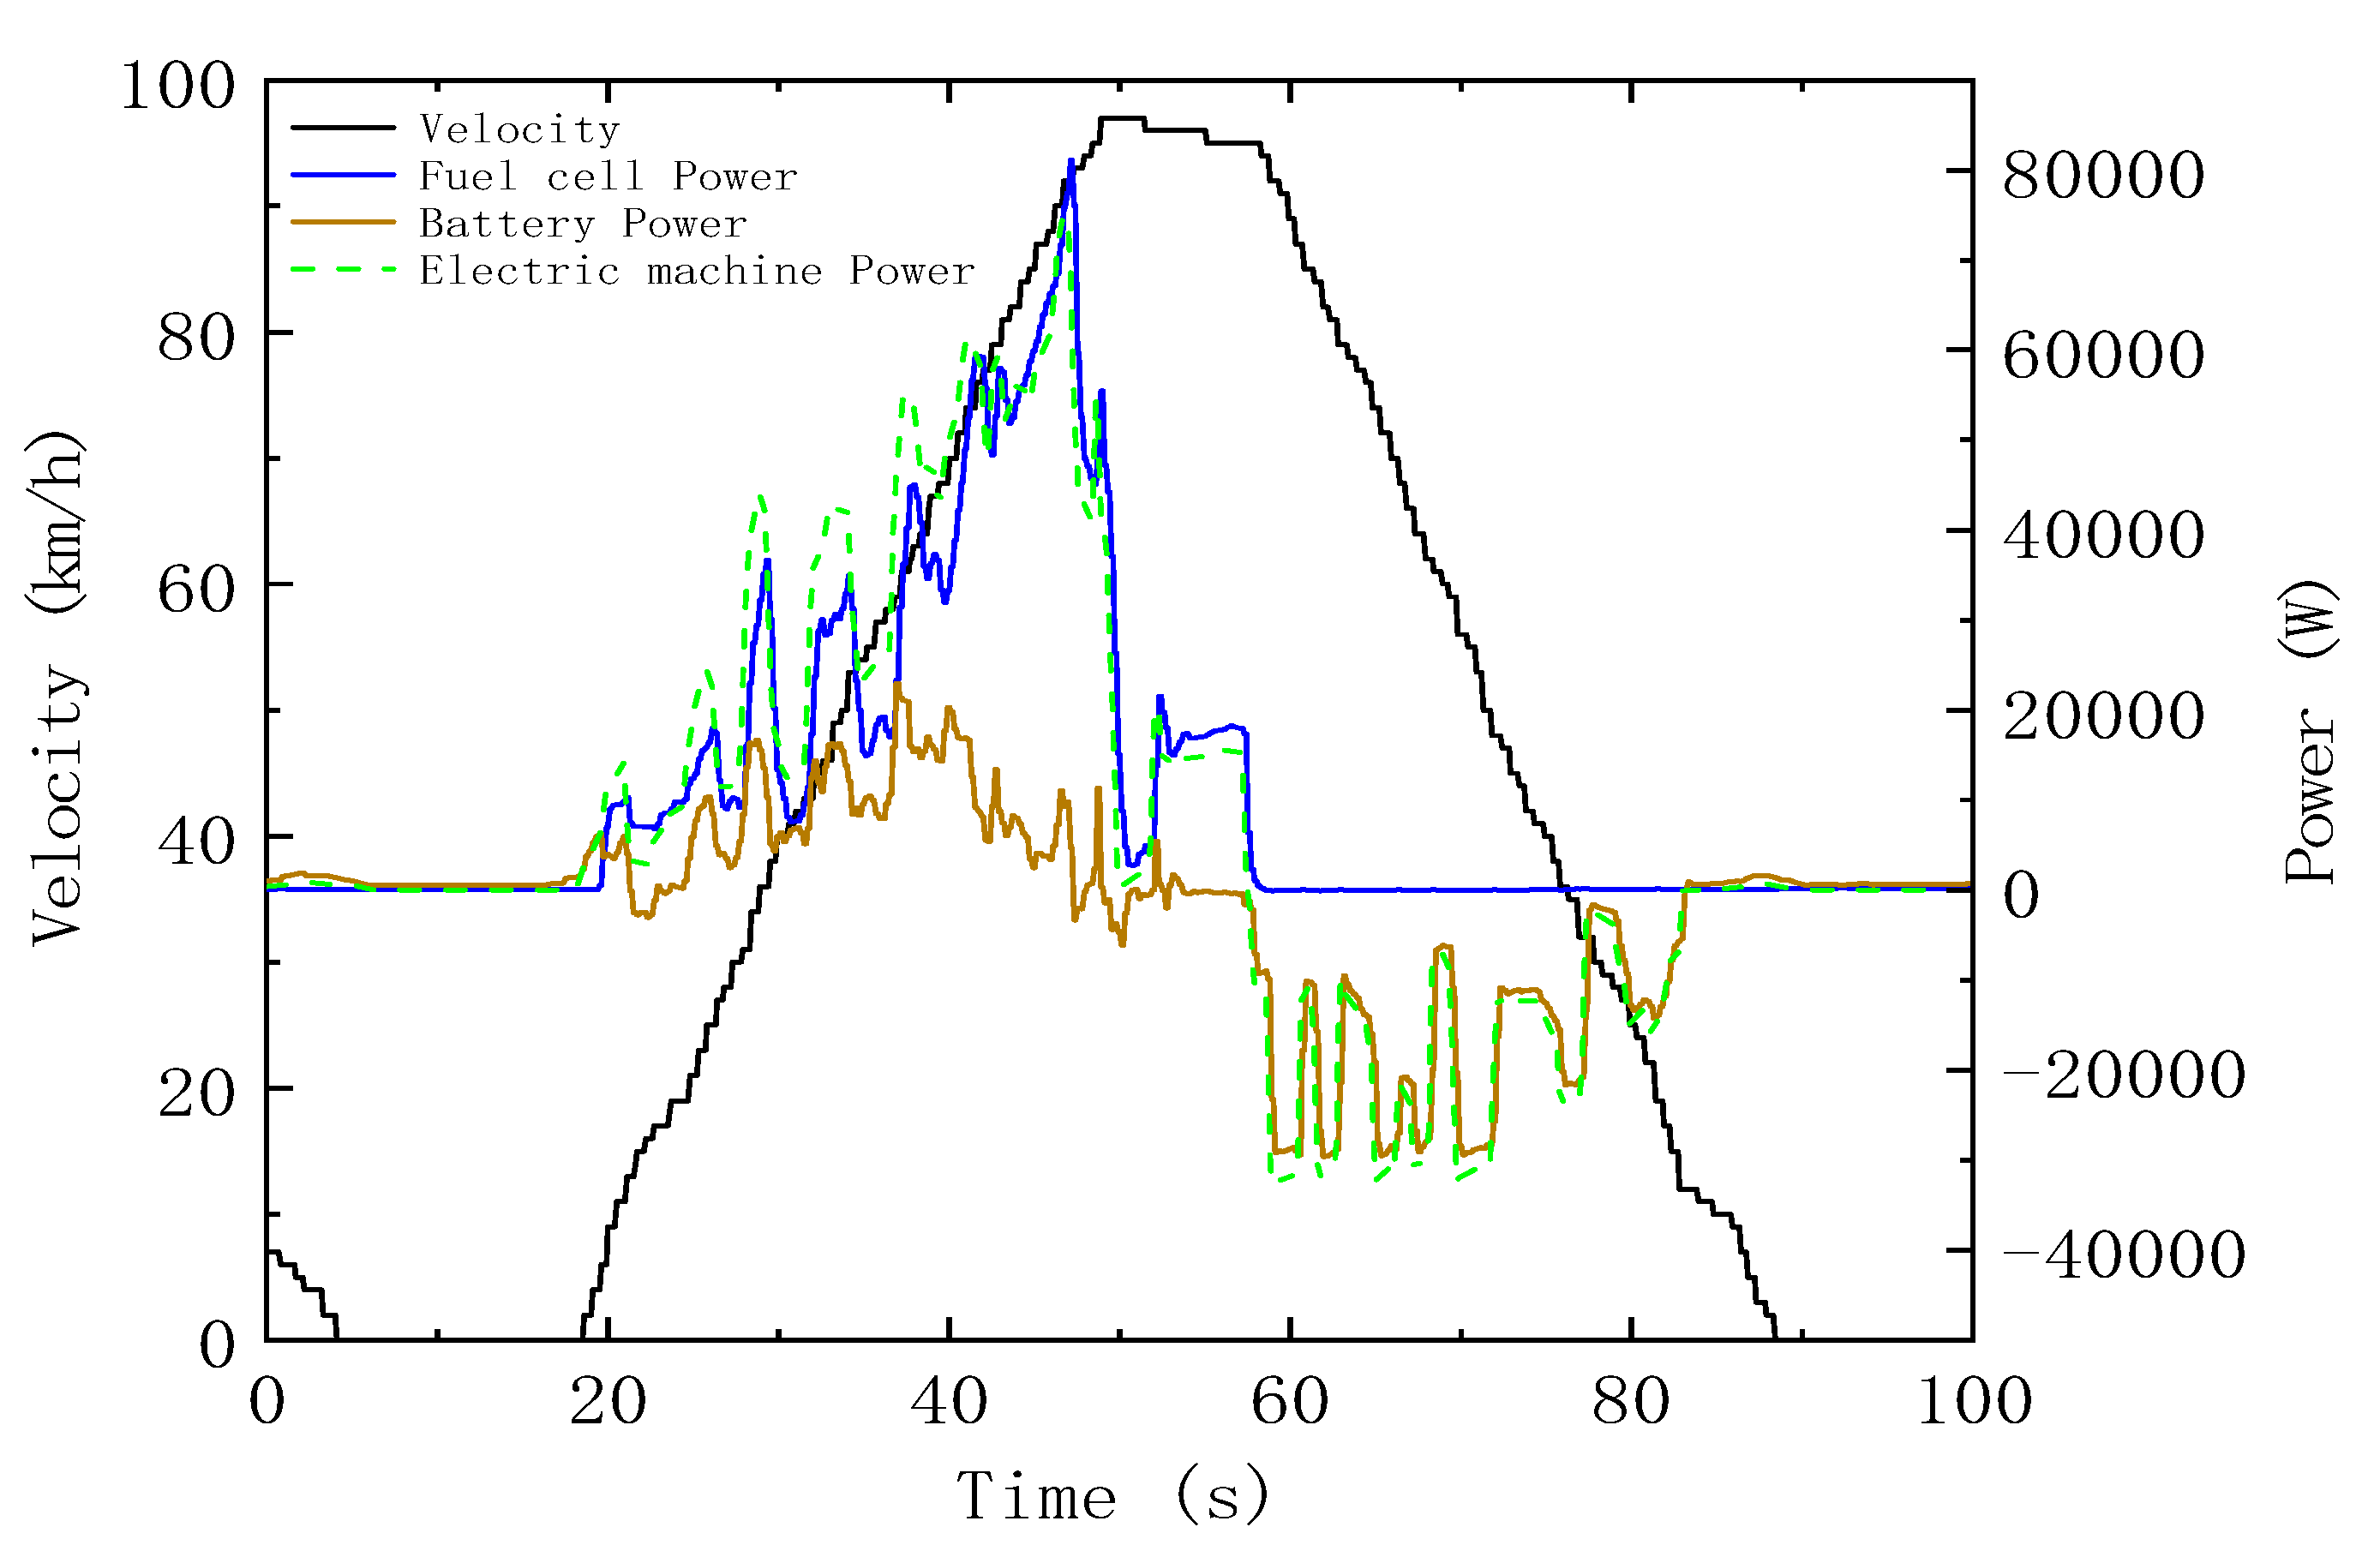
5.3.2. 0–100 km/h Acceleration Performance

Figure 17 describes changes in the power of the main components of the FCHEV when it accelerates from 0 km/h to 100 km/h. We can see from the figure that at the beginning of the acceleration, lithium battery power increases first and then fuel-cell power starts to increase, because fuel cell has some lag. During acceleration, fuel-cell power keeps increasing and the percentage of lithium battery power decreases. When velocity of the vehicle stabilizes at 100 km/h, lithium battery output power drops to zero, while fuel-cell output power stabilizes and the the fuel cell drives the vehicle forwards alone. During deceleration, fuel-cell power drops to zero, motor power is smaller than zero and basically matches with the power battery power curve. This means that the energy recycle system of the vehicle starts working. When the velocity of the vehicle drops to zero, output power of the fuel cell and lithium battery drops to zero as well.

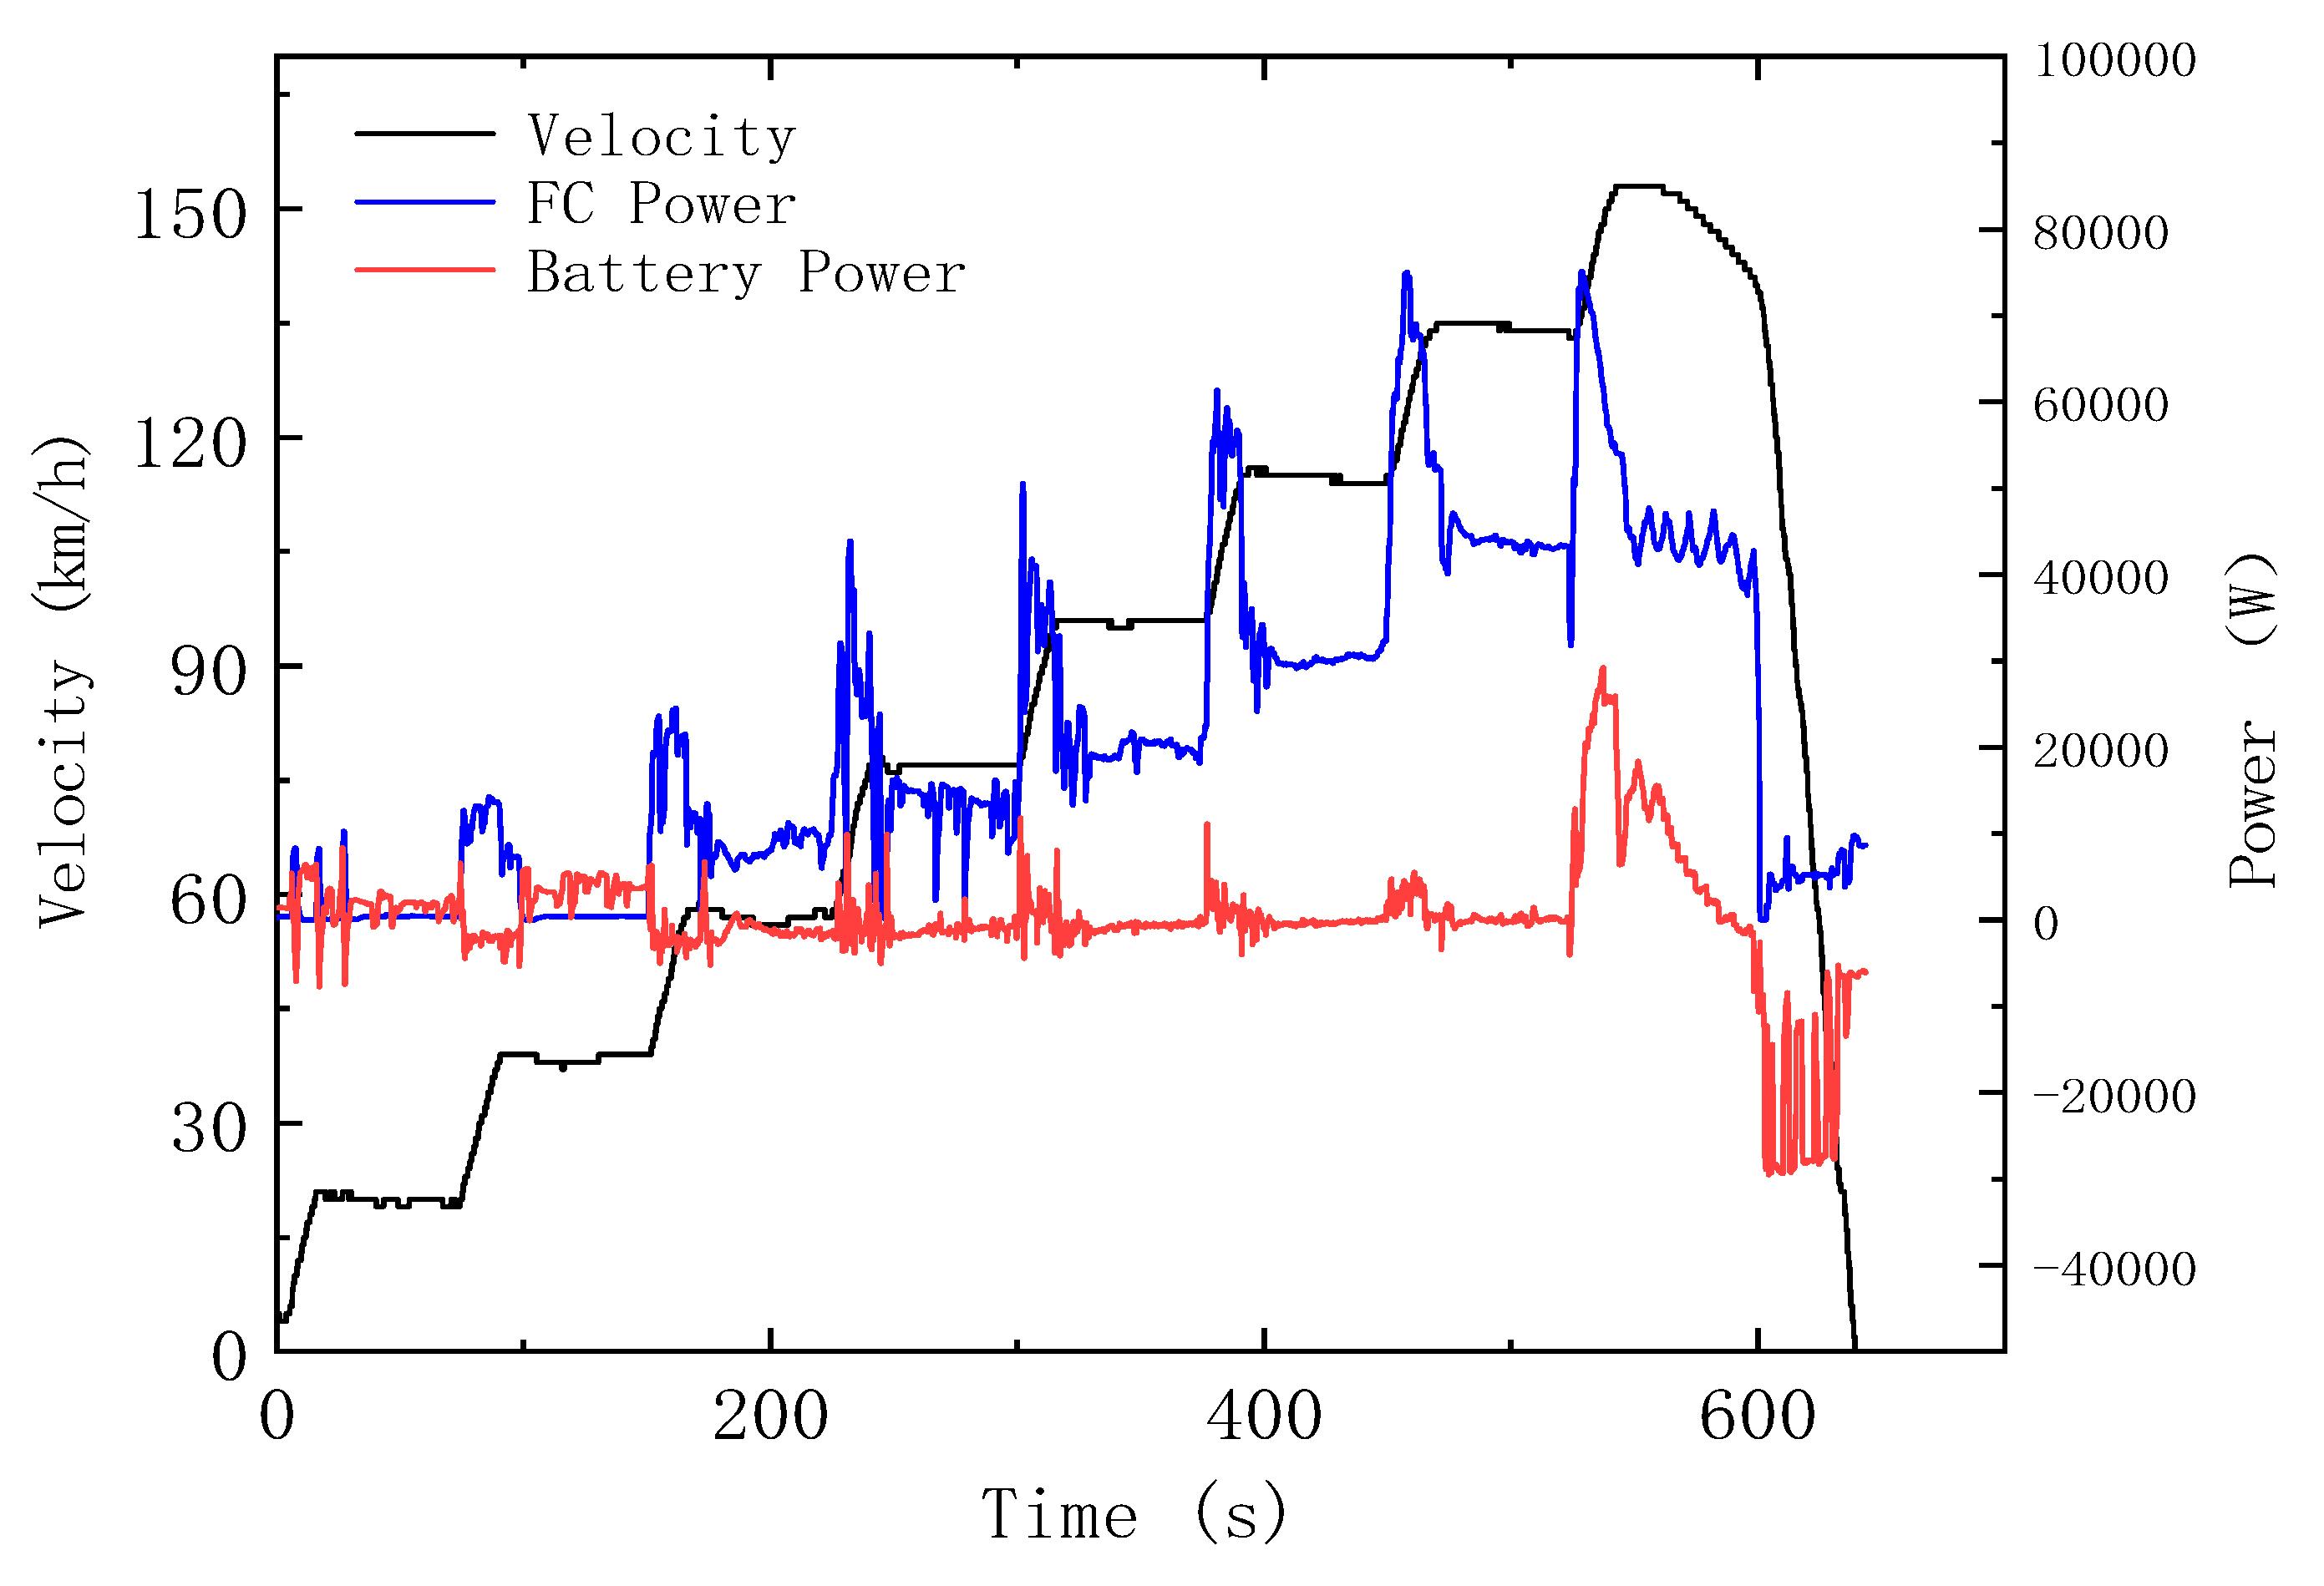
5.3.3. FCHEV Cruising Performance Test

Figure 18 describes changes in the power of main components of a FCHEV during cruising mode test. We can see from the figure that when the vehicle runs stably at 20 km/h and 40 km/h, its fuel-cell power is basically zero, which means it is the lithium battery driving the vehicle forwards. When velocity of the vehicle stabilizes at over 40 km/h, the fuel cell provides the power and lithium battery output power is basically zero. This indicates that when the vehicle runs at low velocity, its power battery provides the power; when the vehicle has great power demand, the fuel cell provides the power. During acceleration of the vehicle, both the lithium battery and fuel cell provide the power; when the velocity stabilizes, battery power is basically zero and the fuel cell provides the main power.

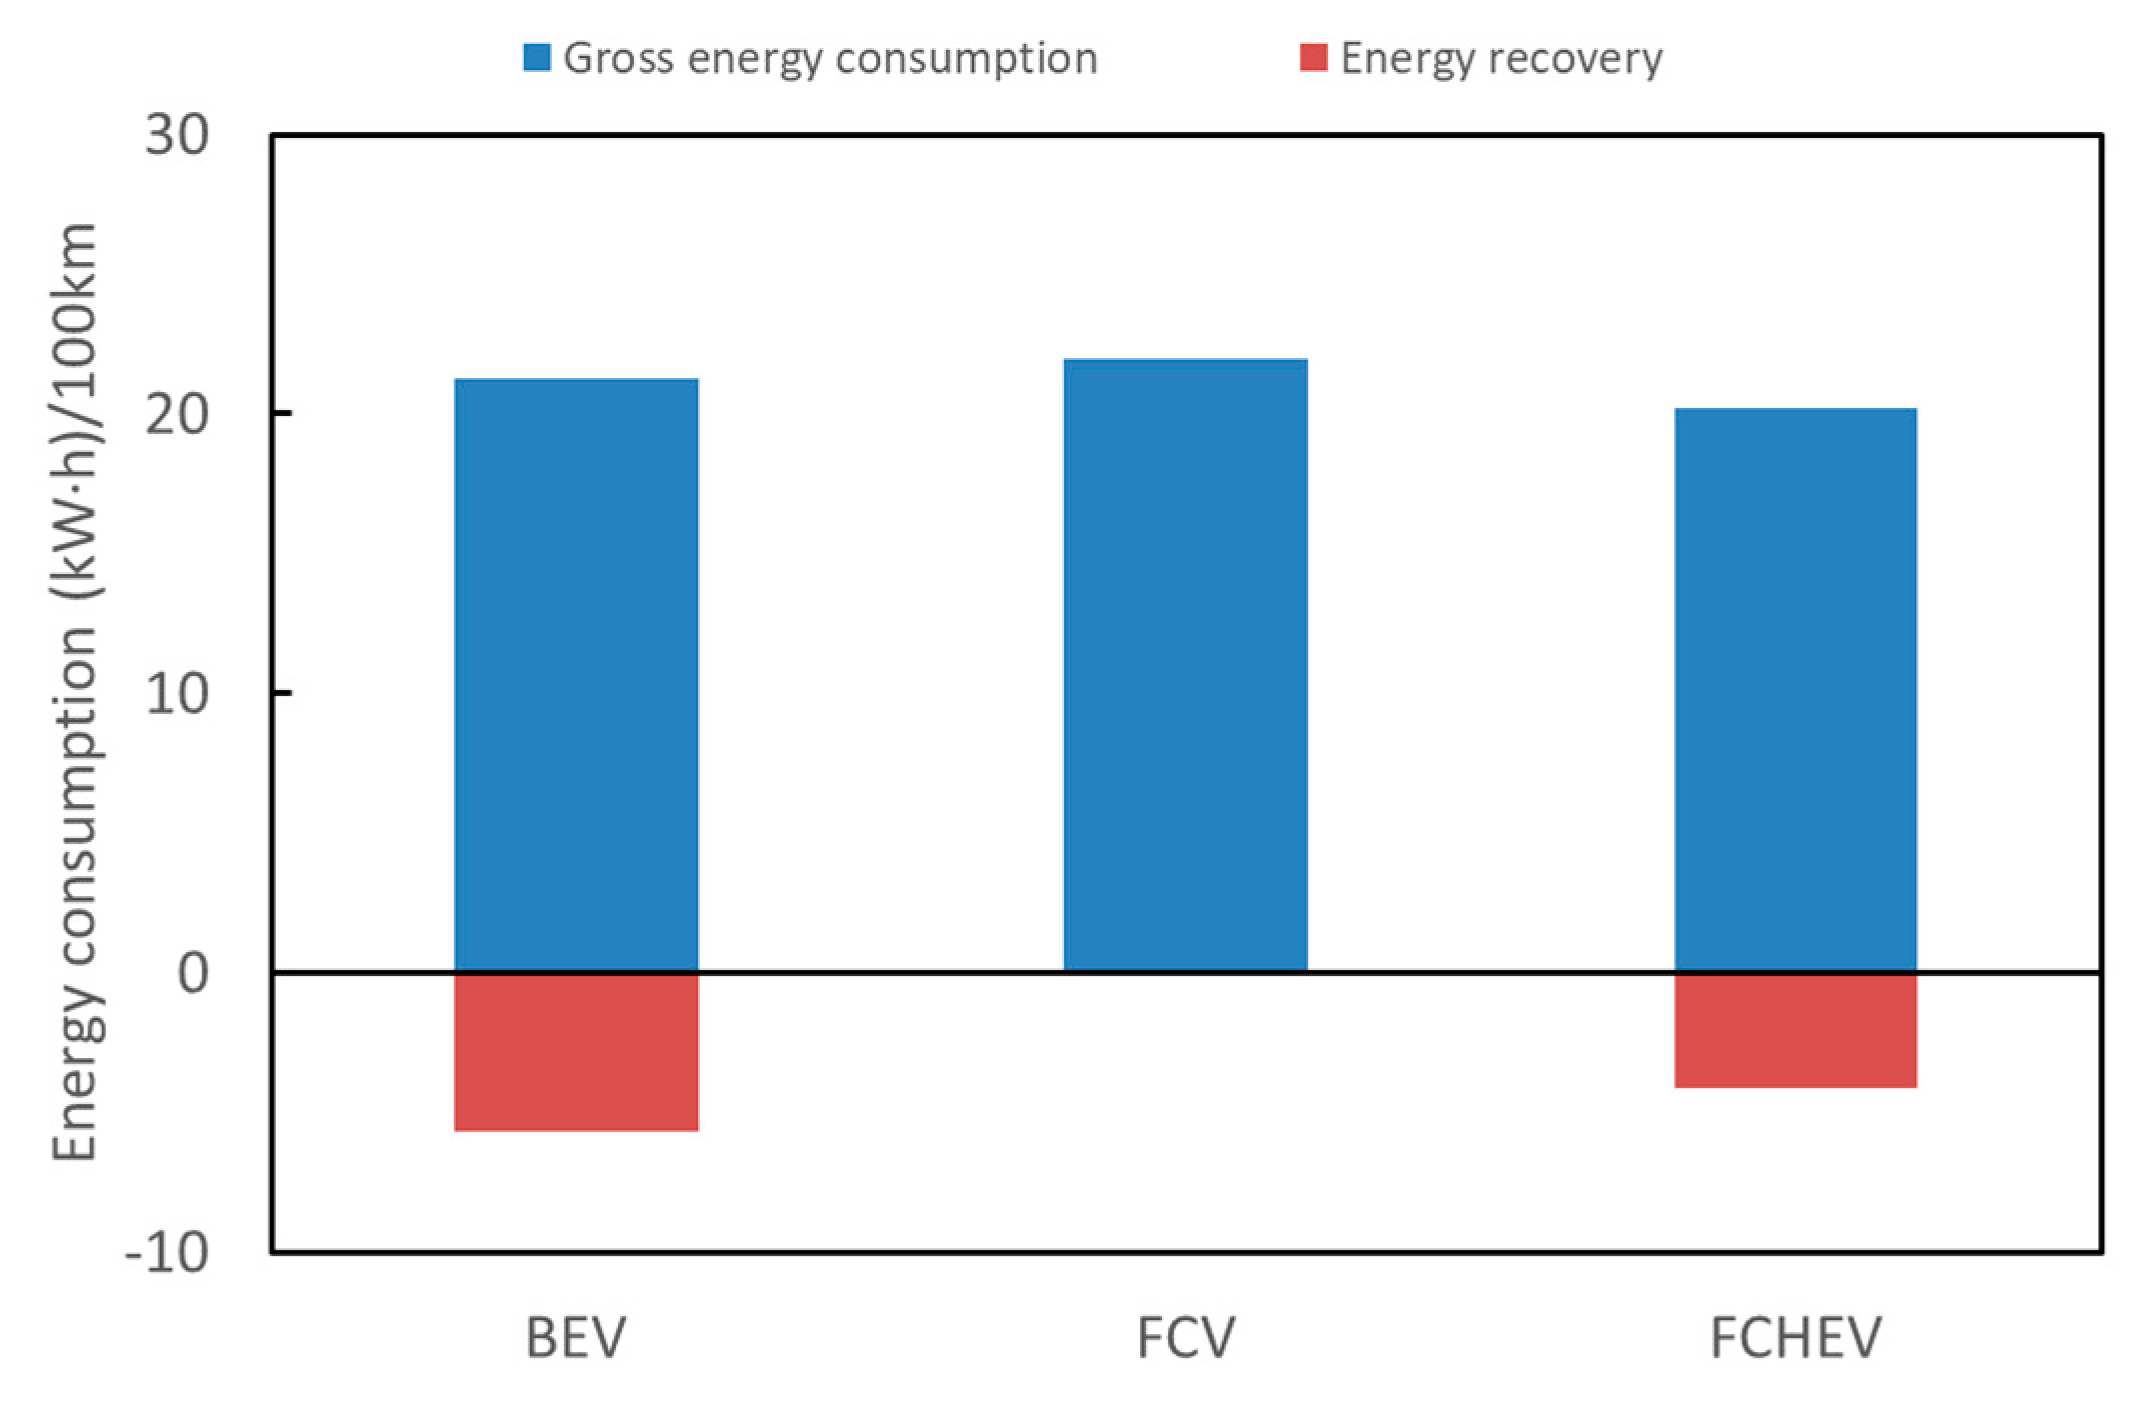
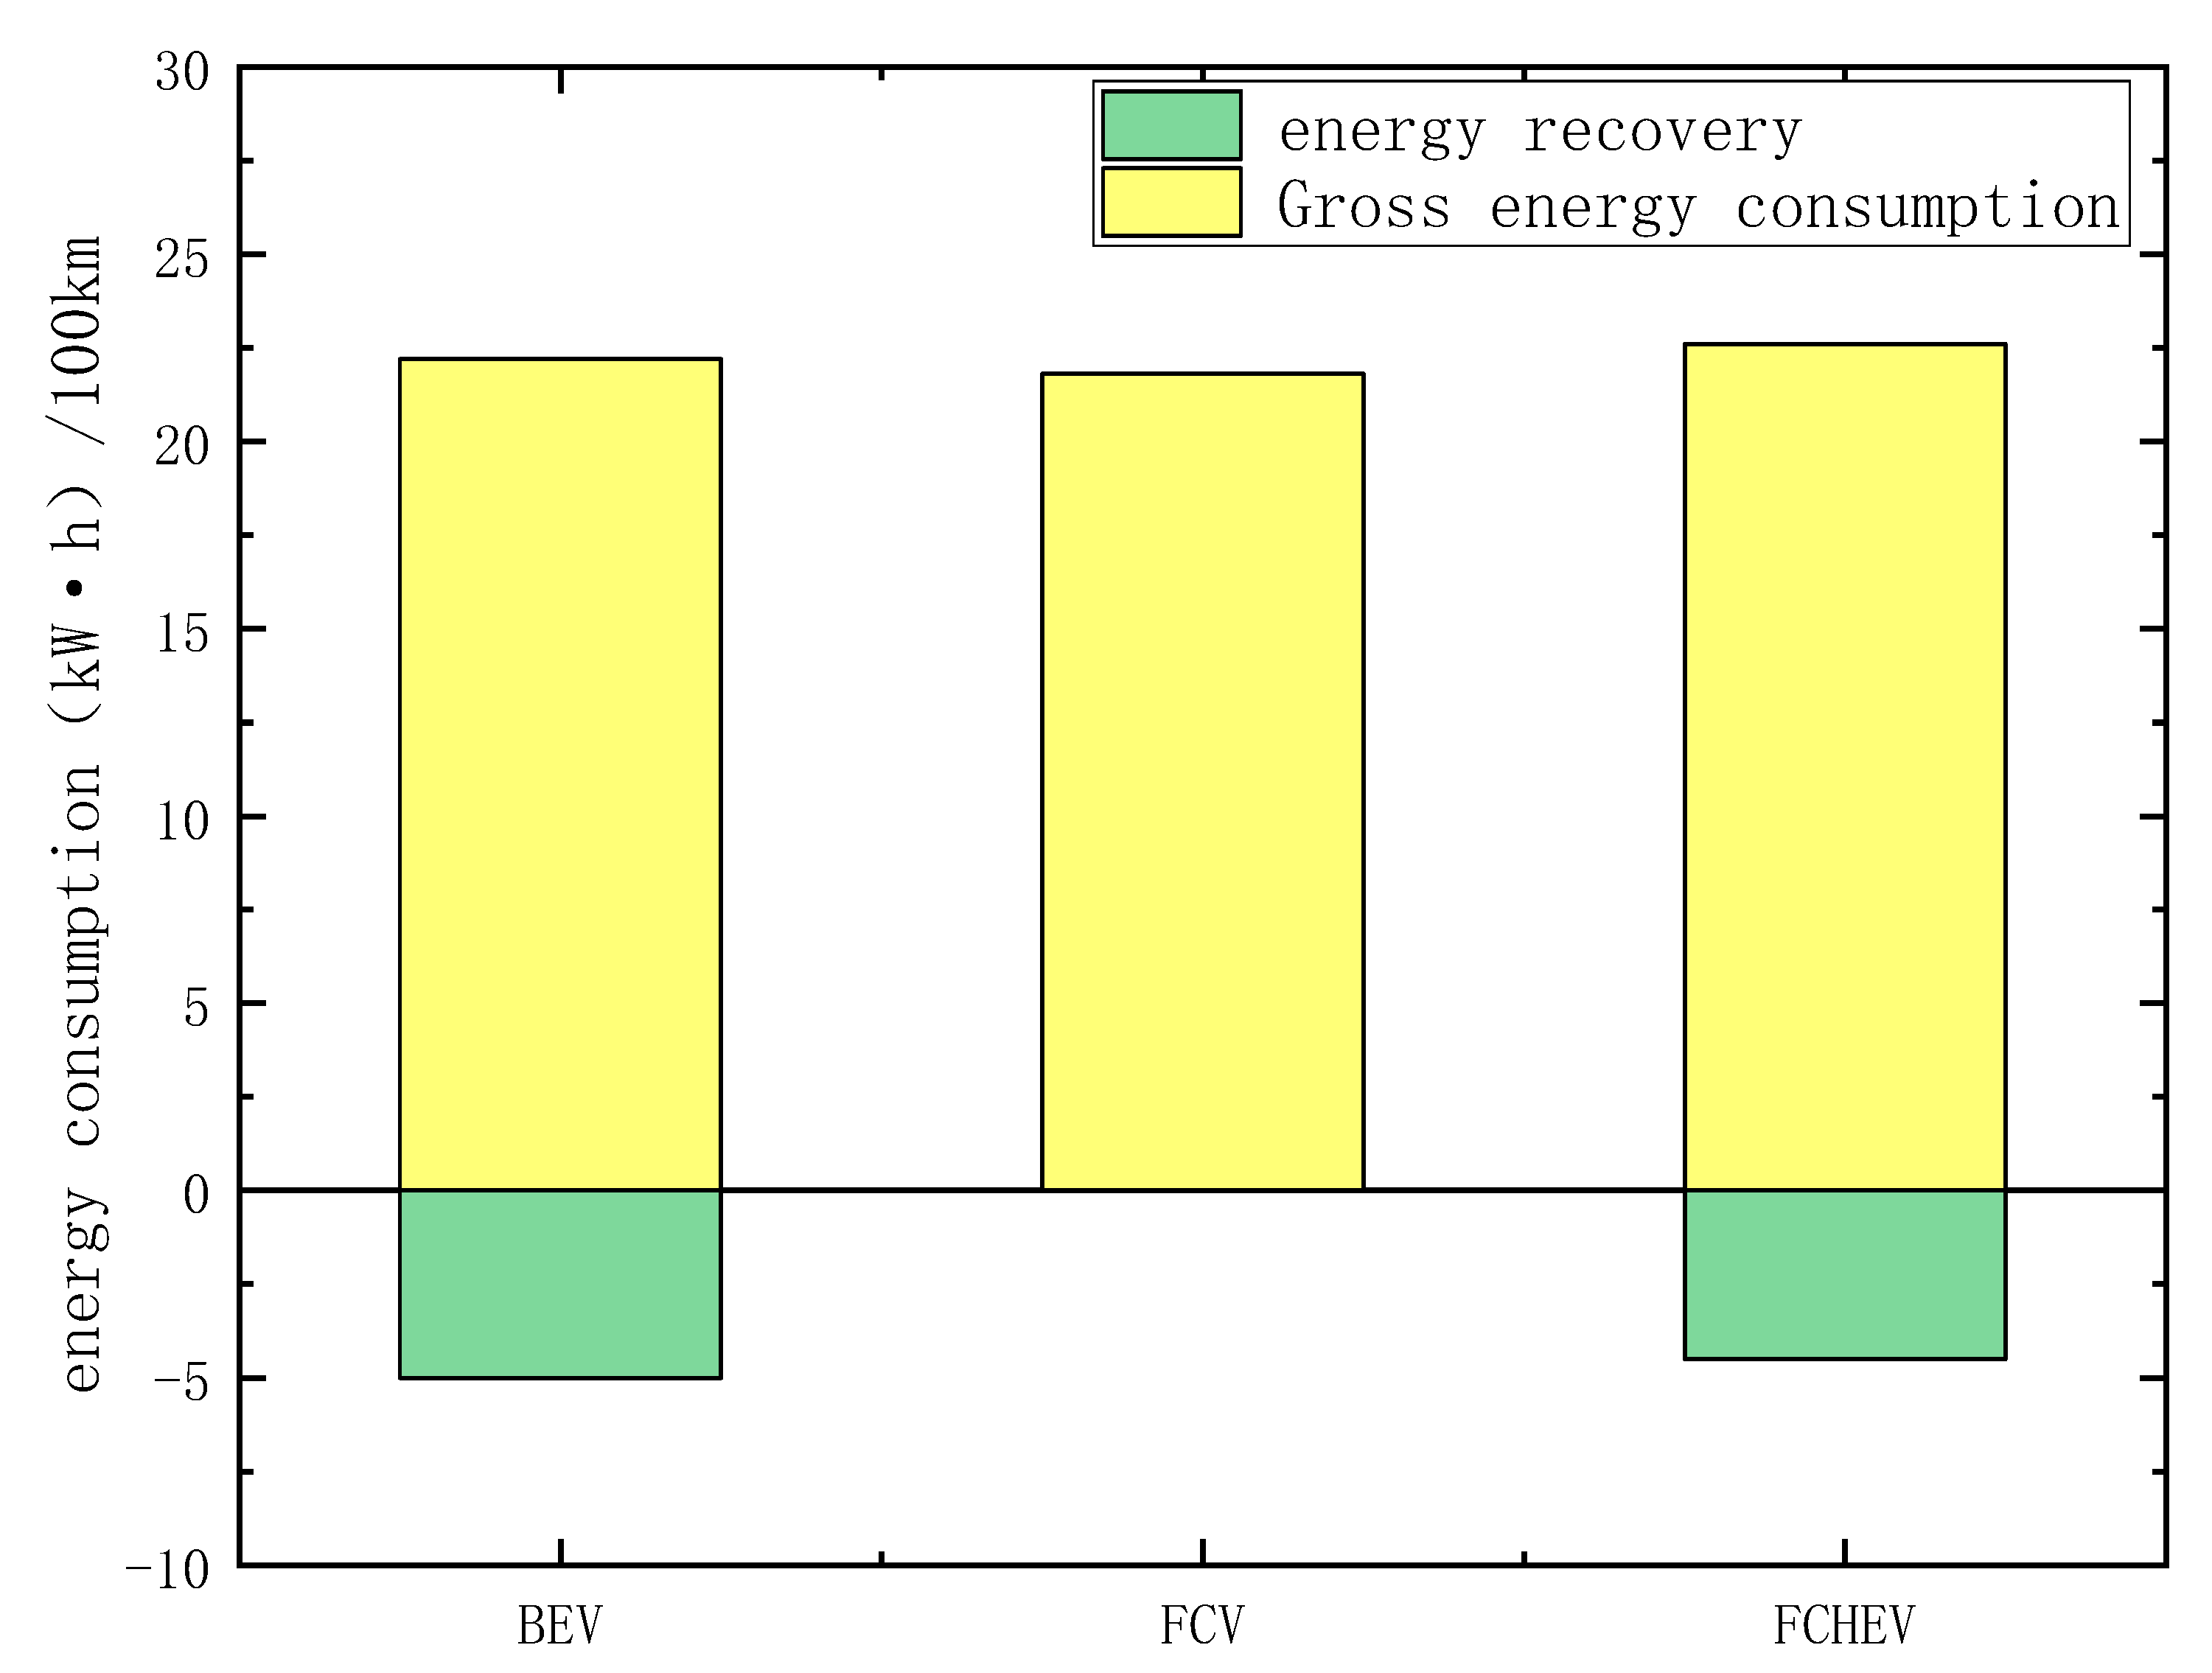
5.3.4. Energy Consumption

The energy consumption of the BEV and FCV under NEDC is simulated, compared with the energy consumption of FCHEV under NEDC. Figure 19 describes the energy consumption of the three models under NEDC. The energy consumption of the vehicle is the sum of the gross energy consumption and the energy recovery. It can be seen from the figure that the gross energy consumption of the three models is about equal, the energy recovery of the BEV accounts for 26.8% of the gross energy consumption, and the energy recovery of FCHEV accounts for 20.3% of the gross energy consumption. The FCV has no energy recovery, so the FCV has the highest energy consumption.

6. Conclusions

In this paper, conditions of three typical real roads in Tianjin are collected, including time, velocity and acceleration. Then, basic parameters of a FCHEV model from a certain country are used to build the BEV and FCV models. Later, performance of such BEV and FCV models is simulated under real-world driving cycles, 0–100 km/h acceleration condition and steady-state condition. A comprehensive comparison of BEV and FCV simulation results and FCHEV test result shows:
(1) The BEV power system has simple structure and quicker dynamic response and can recover braking energy. The recovery efficiency is different under different traffic conditions. The energy recovery efficiency is 33.4% under R1 condition, the energy recovery efficiency is 29.2% under R2 condition, and the energy recovery efficiency is 12.6% under R3 condition. However, due to restrictions such as battery capacity, the BEV is not suitable for long-distance travel.
(2) The only source of energy of the FCV is hydrogen, which is environmentally friendly without pollution and emission. But FCVs have slow dynamic response and unstable power output under high load. The output power under high load is unstable. During the 0–100 km/h acceleration performance test when the speed exceeds 80 km/h, the output power of the fuel cell starts to oscillate. During the cruising performance test, when the speed exceeds 120 km/h, the output power of fuel cell starts to oscillate.
(3) The FCHEV uses hydrogen as source of power and at the same time is equipped with a lithium battery. During acceleration, the power battery can intervene in a timely way to power the vehicle and improve dynamic response; during deceleration, power battery can timely store extra energy produced by fuel cell and reduce energy consumption. The energy recovery efficiency is 20.3% under NEDC condition. During the 0–100 km/h acceleration performance test the output power of the fuel cell does not oscillate. During the cruising performance test, when the speed exceeds 160 km/h, the output power of fuel cell starts to oscillate. The FCHEV combines the advantages of BEV and FCV and features great adaptability to real roads as well as reduced energy consumption thanks to a dual driving power of fuel cell and power battery. Therefore, it is a suitable model worth promoting.
However, a complex control strategy is required for coupling of the fuel cell and power battery due to the high cost of fuel-cell production and lack of sound infrastructure such as hydrogen refueling stations. Thus, a future study should focus on a control strategy for the FCHEV to improve adaptability to real-world cycles and lower energy consumption. In addition, we should improve the development policies, laws and regulations related to fuel cells, and pay attention to the construction of infrastructure and supporting industries.

Author Contributions

Conceptualization, Z.W. and X.Z.; methodology, Z.S., S.L.; software, Z.S.; validation, Y.Y., and X.Z.; formal analysis, Z.S.; investigation, Z.W.; resources, Z.S.; data curation, Z.S.; writing—original draft preparation, Z.S.; writing—review and editing, X.Z.; project administration, Z.W.; funding acquisition, Z.W. All authors have read and agreed to the published version of the manuscript.

Funding

The research was supported by the National Key Research and Development Program of China (Grant No. 2018YFB0105603).

Conflicts of Interest

The authors declare no conflict of interest. Zhicheng Sun, Zui Wen, Xin Zhao, Yunpeng Yang are from China Automotive Technology & Research Center Co. Ltd., the company, China Automotive Technology Research Center Co., Ltd., provided the test equipment.

References

  1. Song, Y.; Zhang, M.; Sun, R. Using a new aggregated indicator to evaluate China’s energy security. Energy Policy 2019, 132, 167–174. [Google Scholar] [CrossRef]
  2. Das, H.S.; Tan, C.W.; Yatim, A.H.M. Fuel cell hybrid electric vehicles: A review on power conditioning units and topologies. Renew. Sustain. Energy Rev. 2017, 76, 268–291. [Google Scholar] [CrossRef]
  3. Zhang, C.; Yang, F.; Ke, X.; Liu, Z.; Yuan, C. Predictive modeling of energy consumption and greenhouse gas emissions from autonomous electric vehicle operations. Appl. Energy 2019. [Google Scholar] [CrossRef]
  4. Zhili, D.; Boqiang, L.; Chunxu, G. Development path of electric vehicles in China under environmental and energy security constraints. Resour. Conserv. Recycl. 2019, 143, 17–26. [Google Scholar] [CrossRef]
  5. Li, Y.; Zhong, Z.; Zhang, K.; Zheng, T. A car-following model for electric vehicle traffic flow based on optimal energy consumption. Phys. A Stat. Mech. Its Appl. 2019. [Google Scholar] [CrossRef]
  6. Pagani, M.; Korosec, W.; Chokani, N.; Abhari, R.S. User behaviour and electric vehicle charging infrastructure: An agent-based model assessment. Appl. Energy 2019. [Google Scholar] [CrossRef]
  7. Du, J.; Ouyang, D. Progress of Chinese electric vehicles industrialization in 2015: A review. Appl. Energy 2017, 188, 529–546. [Google Scholar] [CrossRef]
  8. Berecibar, M.; Gandiaga, I.; Villarreal, I.; Omar, N.; van Mierlo, J.; Van den Bossche, P. Critical review of state of health estimation methods of Li-ion batteries for real applications. Renew. Sustain. Energy Rev. 2016, 56, 572–587. [Google Scholar] [CrossRef]
  9. Albanese, L.; Ciriminna, R.; Meneguzzo, F.; Pagliaro, M. The impact of electric vehicles on the power market. Energy Sci. Eng. 2015, 3, 300–309. [Google Scholar] [CrossRef]
  10. Ballinger, B.; Stringer, M.; Schmeda-Lopez, D.R.; Kefford, B.; Parkinson, B.; Greig, C.; Smart, S. The vulnerability of electric vehicle deployment to critical mineral supply. Appl. Energy 2019, 255, 113844. [Google Scholar] [CrossRef]
  11. Naumanen, M.; Uusitalo, T.; Huttunen-Saarivirta, E.; van der Have, R. Development strategies for heavy duty electric battery vehicles: Comparison between China, EU, Japan and USA. Resour. Conserv. Recycl. 2019. [Google Scholar] [CrossRef]
  12. Fathabadi, H. Novel fuel cell/battery/supercapacitor hybrid power source for fuel cell hybrid electric vehicles. Energy 2018, 143, 467–477. [Google Scholar] [CrossRef]
  13. Fathabadi, H. Fuel cell hybrid electric vehicle (FCHEV): Novel fuel cell/SC hybrid power generation system. Energy Convers. Manag. 2018, 156, 192–201. [Google Scholar] [CrossRef]
  14. Harvey, L.D.D. Cost and energy performance of advanced light duty vehicles: Implications for standards and subsidies. Energy Policy 2018, 114, 1–12. [Google Scholar] [CrossRef]
  15. Xu, X.; Aziz, H.M.A.; Guensler, R. A modal-based approach for estimating electric vehicle energy consumption in transportation networks. Transp. Res. Part D Transp. Environ. 2019, 75, 249–264. [Google Scholar] [CrossRef]
  16. Wu, X.; Freese, D.; Cabrera, A.; Kitch, W.A. Electric vehicles’ energy consumption measurement and estimation. Transp. Res. Part D Transp. Environ. 2015, 34, 52–67. [Google Scholar] [CrossRef]
  17. Yuan, X.; Zhang, C.; Hong, G.; Huang, X.; Li, L. Method for evaluating the real-world driving energy consumptions of electric vehicles. Energy 2017, 141, 1955–1968. [Google Scholar] [CrossRef]
  18. Brady, J.; O’Mahony, M. Development of a driving cycle to evaluate the energy economy of electric vehicles in urban areas. Appl. Energy 2016, 177, 165–178. [Google Scholar] [CrossRef]
  19. Faria, M.; Rolim, C.; Duarte, G.; Farias, T.; Baptista, P. Assessing energy consumption impacts of traffic shifts based on real-world driving data. Transp. Res. Part D Transp. Environ. 2018, 62, 489–507. [Google Scholar] [CrossRef]
  20. Jiang, S.; Wang, C.; Zhang, C.; Bai, H.; Xu, L. Adaptive estimation of road slope and vehicle mass of fuel cell vehicle. eTransportation 2019. [Google Scholar] [CrossRef]
  21. Fernández, R.Á.; Caraballo, S.C.; Cilleruelo, F.B.; Lozano, J.A. Fuel optimization strategy for hydrogen fuel cell range extender vehicles applying genetic algorithms. Renew. Sustain. Energy Rev. 2018, 81, 655–668. [Google Scholar] [CrossRef]
  22. Mokrani, Z.; Rekioua, D.; Mebarki, N.; Rekioua, T.; Bacha, S. Proposed energy management strategy in electric vehicle for recovering power excess produced by fuel cells. Int. J. Hydrogen Energy 2017, 42, 19556–19575. [Google Scholar] [CrossRef]
  23. Morrison, G.; Stevens, J.; Joseck, F. Relative economic competitiveness of light-duty battery electric and fuel cell electric vehicles. Transp. Res. Part C Emerg. Technol. 2018, 87, 183–196. [Google Scholar] [CrossRef]
  24. Carey, A.M.; Paige, G.B.; Carr, B.J.; Dogan, M. Forward modeling to investigate inversion artifacts resulting from time-lapse electrical resistivity tomography during rainfall simulations. J. Appl. Geophys. 2017, 145, 39–49. [Google Scholar] [CrossRef]
  25. Sepúlveda, F.D.; Lucay, F.; González, J.F.; Cisternas, L.A.; Gálvez, E.D. A methodology for the conceptual design of flotation circuits by combining group contribution, local/global sensitivity analysis, and reverse simulation. Int. J. Miner. Process. 2017, 164, 56–66. [Google Scholar] [CrossRef]
  26. Lekshmi, S.; Lal Priya, P.S. Mathematical modeling of Electric vehicles—A survey. Control Eng. Pract. 2019, 92, 104138. [Google Scholar]
  27. Liu, H.; Zhang, X.; Chen, Y.; Taha, M.; Xu, H. Active damping of driveline vibration in power-split hybrid vehicles based on model reference control. Control Eng. Pract. 2019. [Google Scholar] [CrossRef]
  28. Karaoğlan, M.U.; İnce, A.C.; Colpan, C.O.; Glüsen, A.; Kuralay, N.S.; Müller, M.; Stolten, D. Simulation of a hybrid vehicle powertrain having direct methanol fuel cell system through a semi-theoretical approach. Int. J. Hydrogen Energy 2019, 44, 18981–18992. [Google Scholar] [CrossRef]
  29. Zhou, X.; Qin, D.; Hu, J. Multi-objective optimization design and performance evaluation for plug-in hybrid electric vehicle powertrains. Appl. Energy 2017, 208, 1608–1625. [Google Scholar] [CrossRef]
  30. Richardson, R.R.; Osborne, M.A.; Howey, D.A. Gaussian process regression for forecasting battery state of health. J. Power Sources 2017, 357, 209–219. [Google Scholar] [CrossRef]
  31. Wilke, C.; Bensmann, A.; Martin, S.; Utz, A.; Hanke-Rauschenbach, R. Optimal design of a district energy system including supply for fuel cell electric vehicles. Appl. Energy 2018, 226, 129–144. [Google Scholar] [CrossRef]
  32. Li, H.; Ravey, A.; N’Diaye, A.; Djerdir, A. A novel equivalent consumption minimization strategy for hybrid electric vehicle powered by fuel cell, battery and supercapacitor. J. Power Sources 2018, 395, 262–270. [Google Scholar] [CrossRef]
  33. Kim, J.; Kim, M.; Kang, T.; Sohn, Y.-J.; Song, T.; Choi, K.H. Degradation modeling and operational optimization for improving the lifetime of high-temperature PEM (proton exchange membrane) fuel cells. Energy 2014, 66, 41–49. [Google Scholar] [CrossRef]
  34. Ahmadi, S.; Bathaee, S.M.T. Multi-objective genetic optimization of the fuel cell hybrid vehicle supervisory system: Fuzzy logic and operating mode control strategies. Int. J. Hydrogen Energy 2015, 40, 12512–12521. [Google Scholar] [CrossRef]
  35. Fadel, A.; Zhou, B. An experimental and analytical comparison study of power management methodologies of fuel cell–battery hybrid vehicles. J. Power Sources 2011, 196, 3271–3279. [Google Scholar] [CrossRef]
  36. Lachhab, I.; Krichen, L. An improved energy management strategy for FC/UC hybrid electric vehicles propelled by motor-wheels. Int. J. Hydrogen Energy 2014, 39, 571–581. [Google Scholar] [CrossRef]
  37. Aouzellag, H.; Ghedamsi, K.; Aouzellag, D. Energy management and fault tolerant control strategies for fuel cell/ultra-capacitor hybrid electric vehicles to enhance autonomy, efficiency and life time of the fuel cell system. Int. J. Hydrogen Energy 2015, 40, 7204–7213. [Google Scholar] [CrossRef]
  38. Li, T.; Huang, L.; Liu, H. Energy management and economic analysis for a fuel cell supercapacitor excavator. Energy 2019, 172, 840–851. [Google Scholar] [CrossRef]
  39. Hwang, J.-J.; Hu, J.-S.; Lin, C.-H. Design of a range extension strategy for power decentralized fuel cell/battery electric vehicles. Int. J. Hydrogen Energy 2015, 40, 11704–11712. [Google Scholar] [CrossRef]
  40. Wan, Y.; Guan, J.; Xu, S. Improved empirical parameters design method for centrifugal compressor in PEM fuel cell vehicle application. Int. J. Hydrogen Energy 2017, 42, 5590–5605. [Google Scholar] [CrossRef]
  41. Li, Y.; Wu, Y.; Zhang, Y.; Wang, S. A Kriging-based bi-objective constrained optimization method for fuel economy of hydrogen fuel cell vehicle. Int. J. Hydrogen Energy 2019. [Google Scholar] [CrossRef]
Figure 1. Curve of conditions of three real routes.
Wevj 11 00019 g001
Figure 2. Comparison of conditions of each route.
Wevj 11 00019 g002
Figure 3. Probability distribution of velocity and acceleration in three road conditions.
Wevj 11 00019 g003aWevj 11 00019 g003b
Figure 4. Physical model of a lithium battery.
Wevj 11 00019 g004
Figure 5. Changes in power of three models under CLTC-P (China light-duty vehicle test cycle-passenger car).
Wevj 11 00019 g005
Figure 6. Energy consumption of three models under CLTC-P.
Wevj 11 00019 g006
Figure 7. Battery electric vehicle (BEV) power system structure model.
Wevj 11 00019 g007
Figure 8. Distribution of BEV velocity and accelerated velocity under different road conditions.
Wevj 11 00019 g008aWevj 11 00019 g008b
Figure 9. Changes in battery output power of BEV under 0–100 km/h acceleration condition.
Wevj 11 00019 g009
Figure 10. Changes in battery output power of BEV in cruising mode.
Wevj 11 00019 g010
Figure 11. Fuel-cell vehicle (FCV) power system structure model.
Wevj 11 00019 g011
Figure 12. Joint distribution of velocity, acceleration and power of FCV under three real-world driving cycles.
Wevj 11 00019 g012aWevj 11 00019 g012b
Figure 13. Changes in fuel cell power during 0–100 km/h acceleration of FCV.
Wevj 11 00019 g013
Figure 14. Changes in fuel-cell power of the FCV in cruising mode.
Wevj 11 00019 g014
Figure 15. Fuel-cell hybrid electric vehicle (FCHEV) power system structure model.
Wevj 11 00019 g015
Figure 16. Changes in fuel cell and lithium battery power of FCHEV under New European Driving Cycle (NEDC).
Wevj 11 00019 g016
Figure 17. Changes in power of main components of FCHEV during 0–100 km/h acceleration.
Wevj 11 00019 g017
Figure 18. Changes in power of fuel cell and lithium battery of FCHEV in cruising mode.
Wevj 11 00019 g018
Figure 19. Energy consumption of three models under NEDC.
Wevj 11 00019 g019
Table 1. Basic parameters of fuel-cell hybrid electric vehicle (FCHEV).
ParameterValue
Overall height1537 mm
Overall width1816 mm
Overall length4890 mm
Curb weight1848 kg
Hydrogen tank volume122.4 L
Maximum power114 kW

