Electric Trolley Trucks—A Techno-Economic Assessment for Germany


Abstract
1. Motivation
2. Methods and Data
2.1. Methods
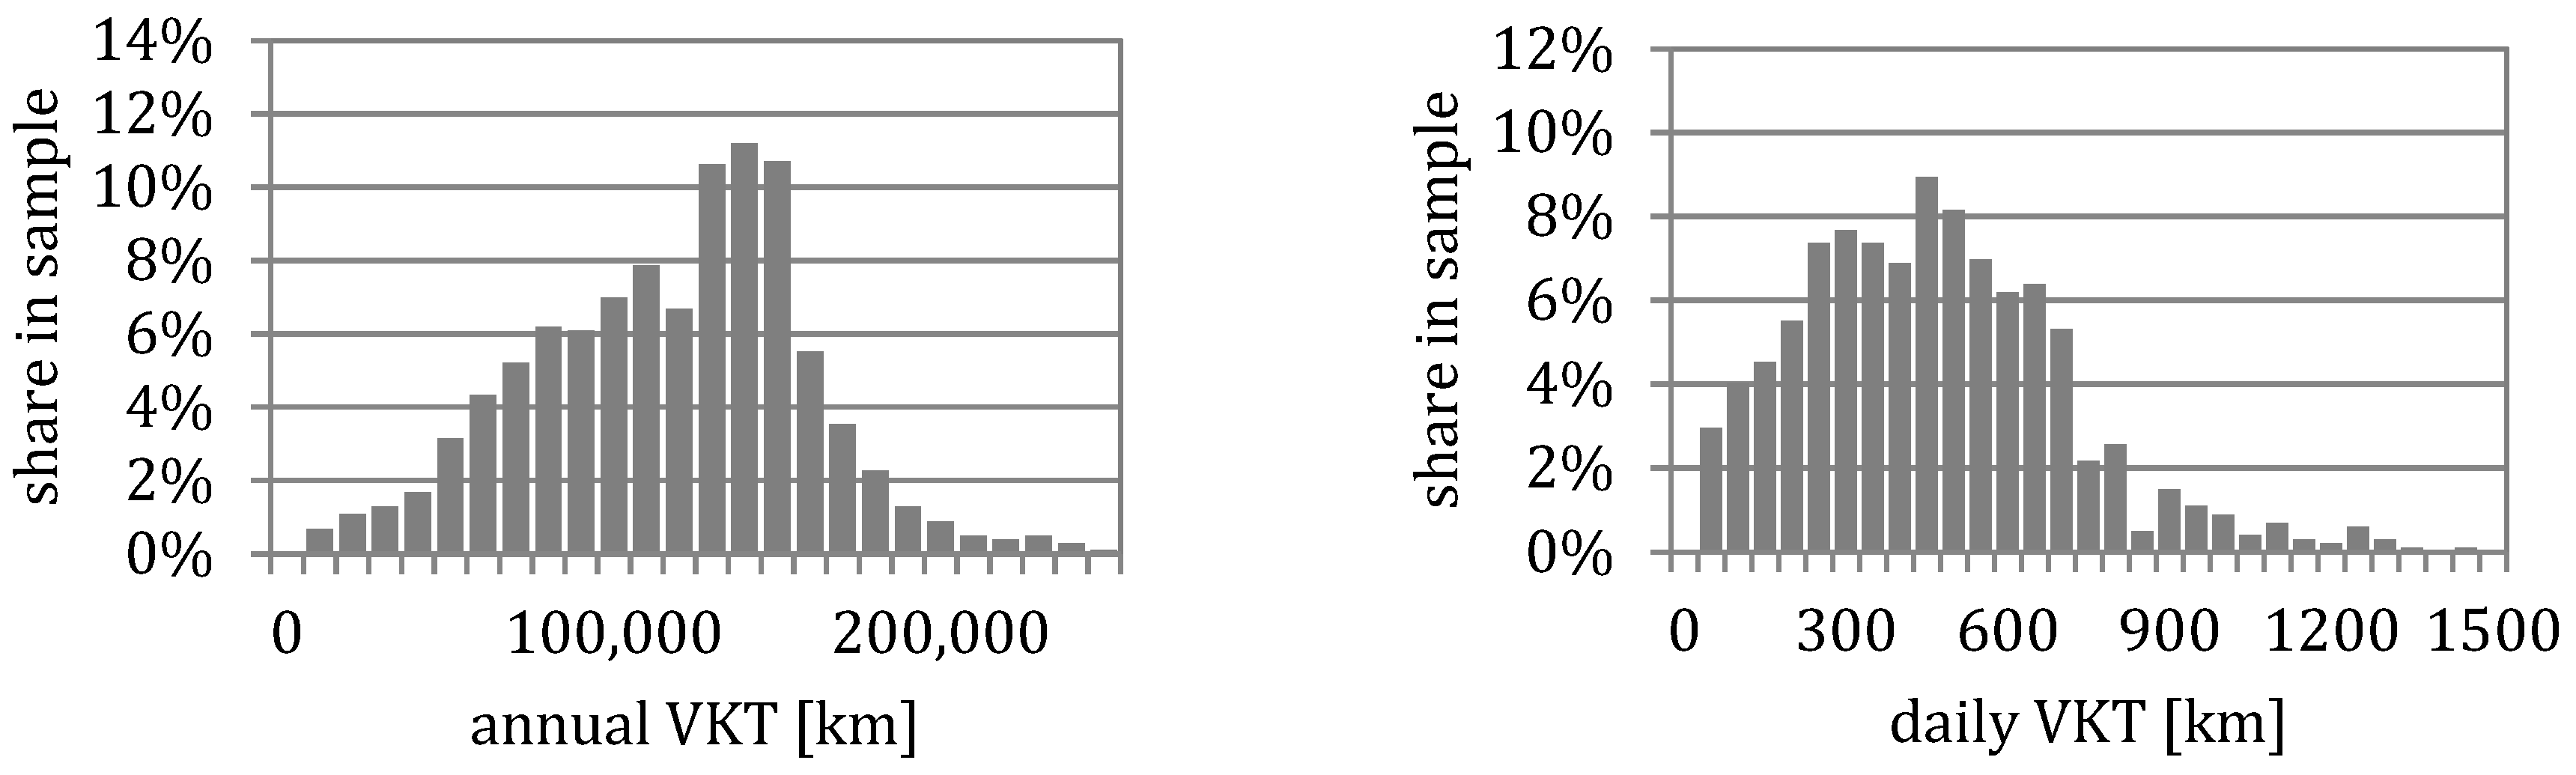
2.2. Data
2.3. Techno-Economic Assumptions
3. Results and Discussion
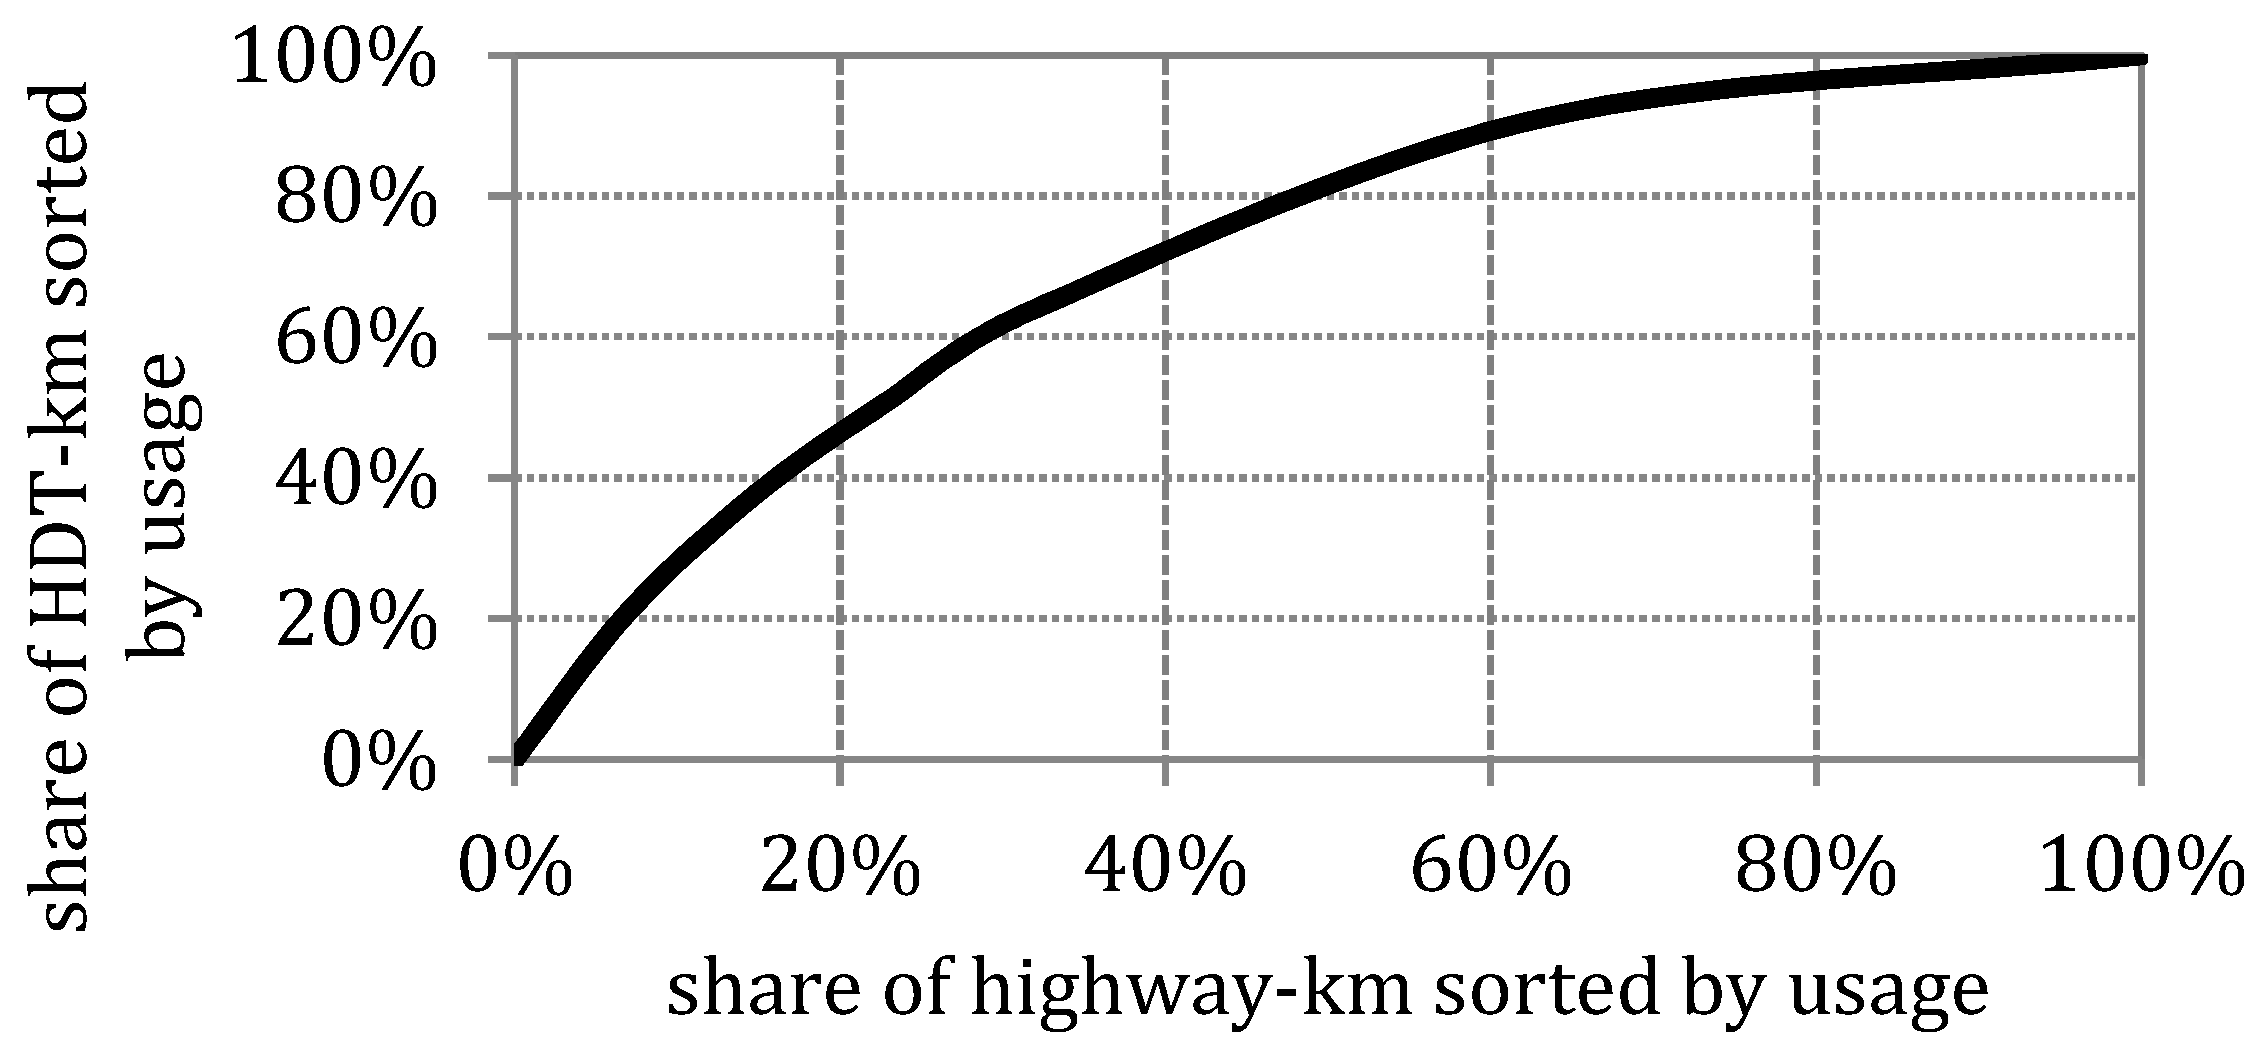
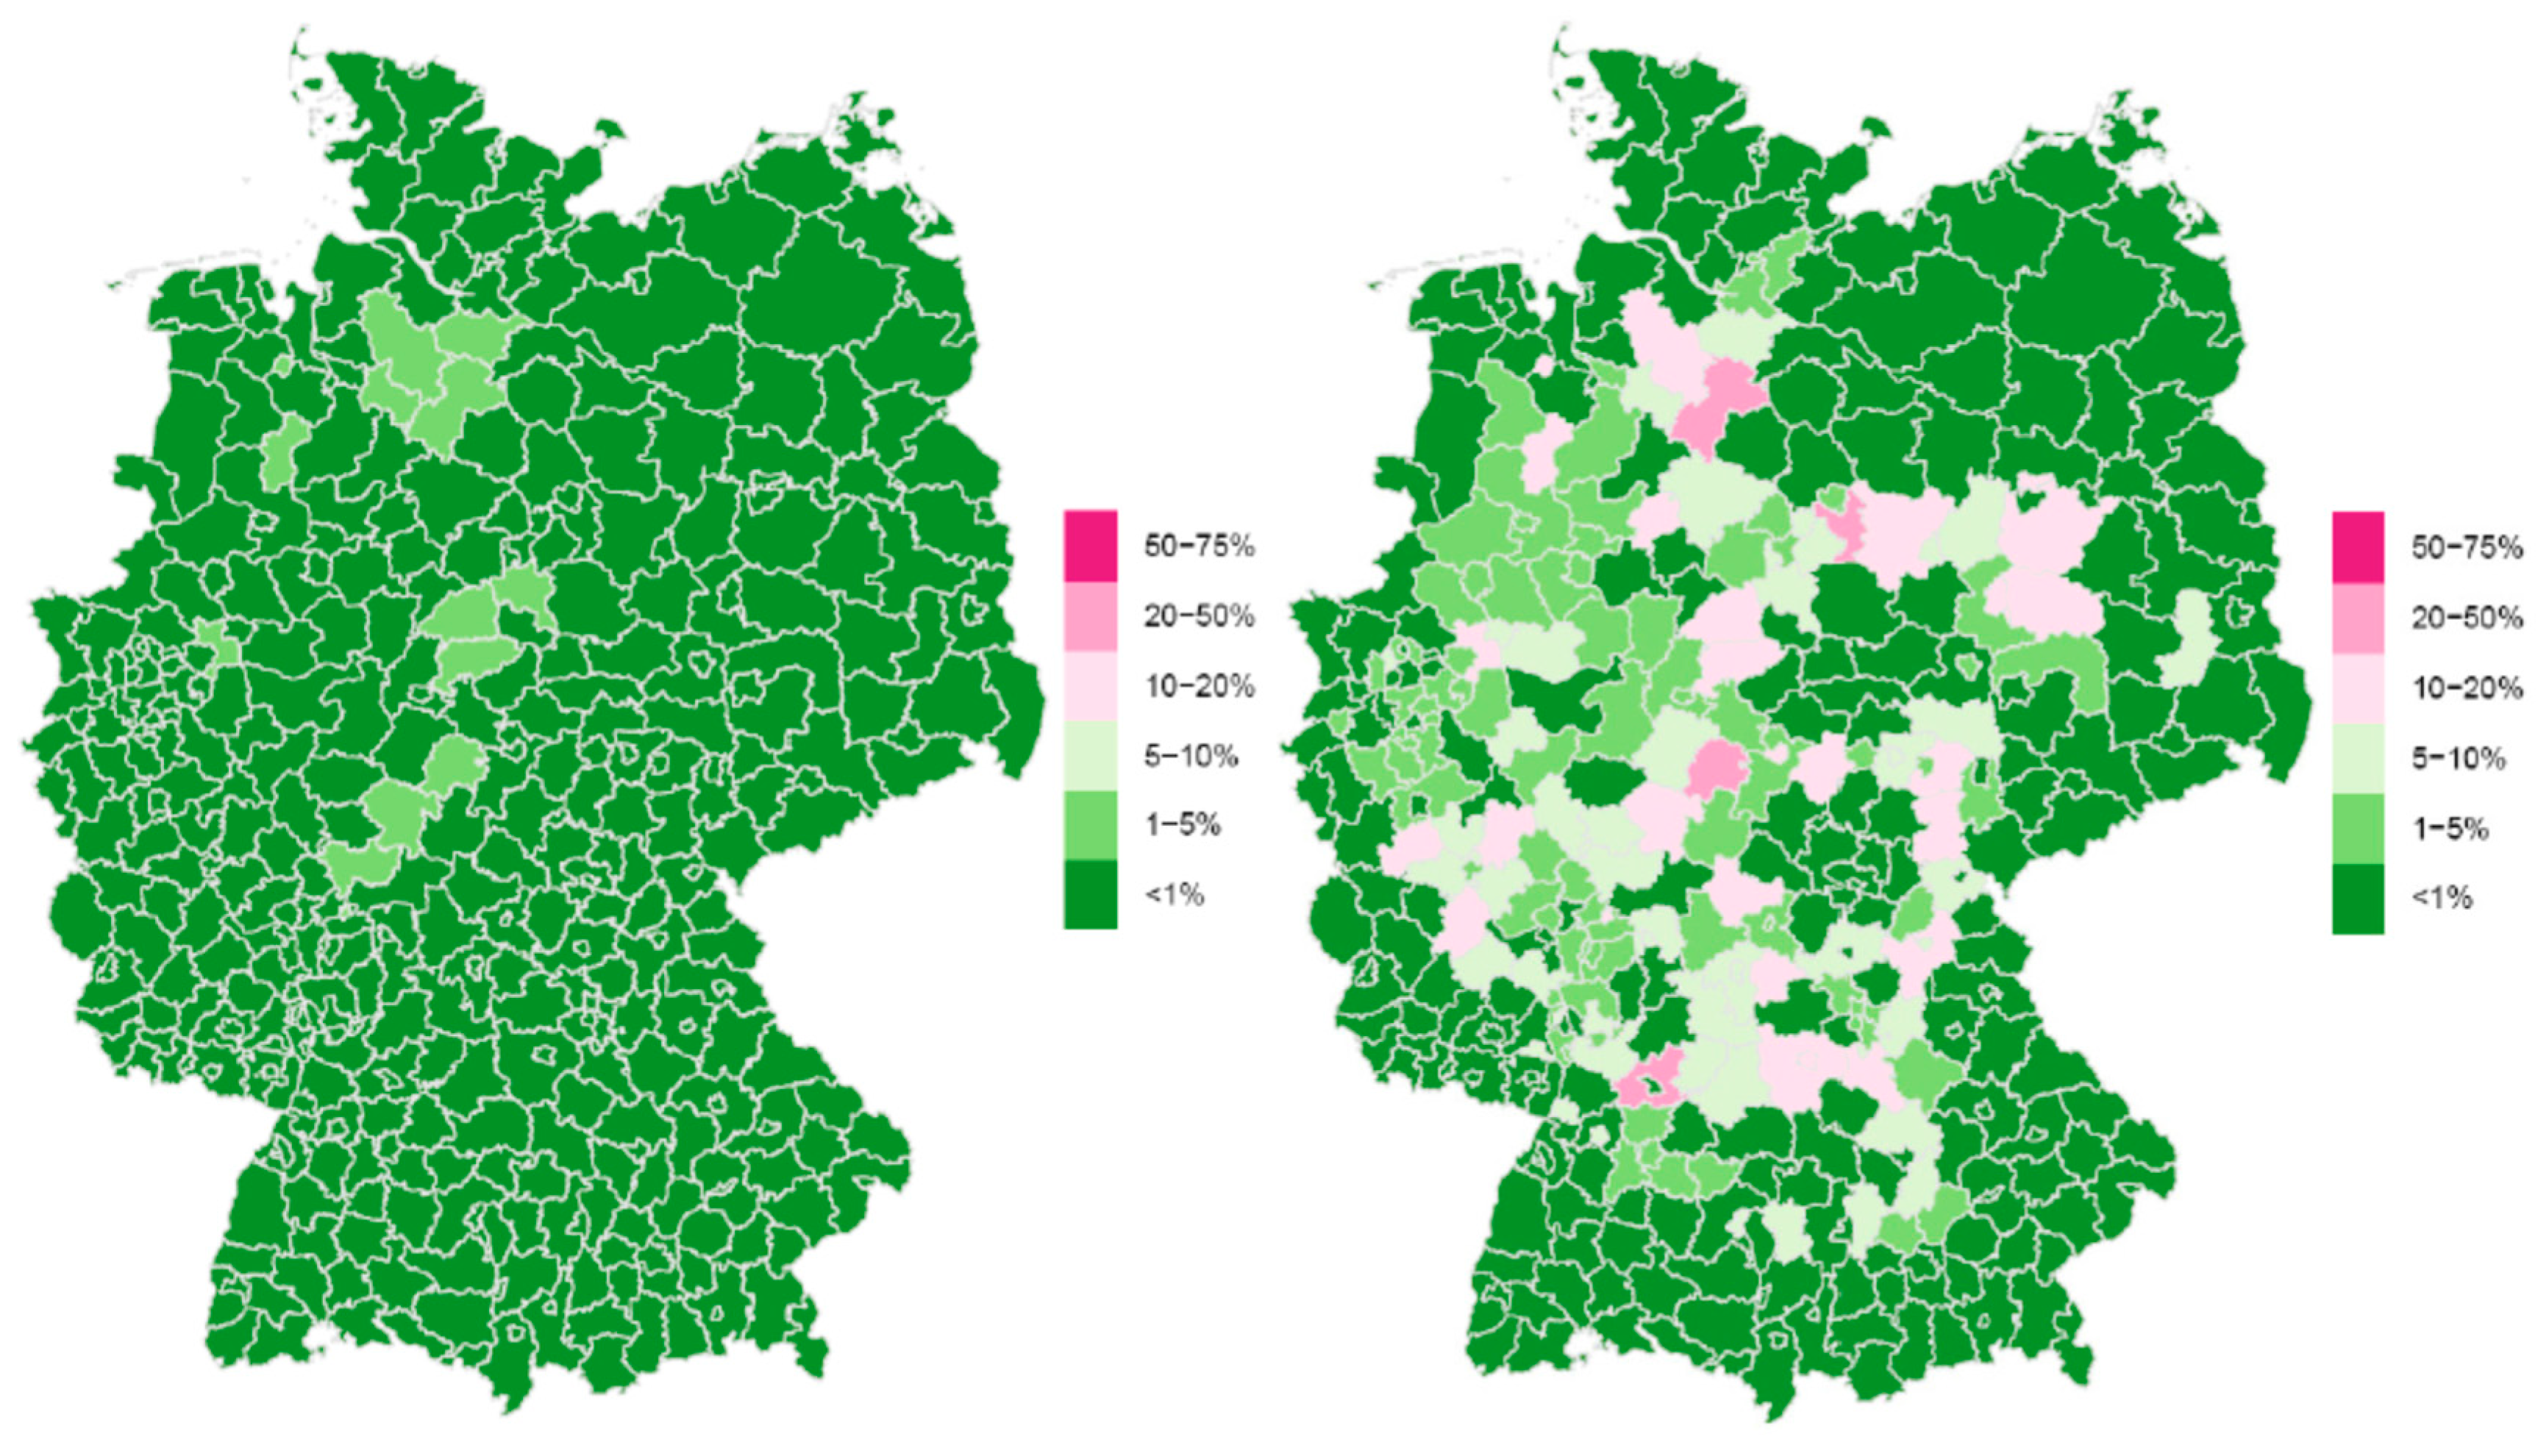
3.1. Technical Assessment and Market Introduction
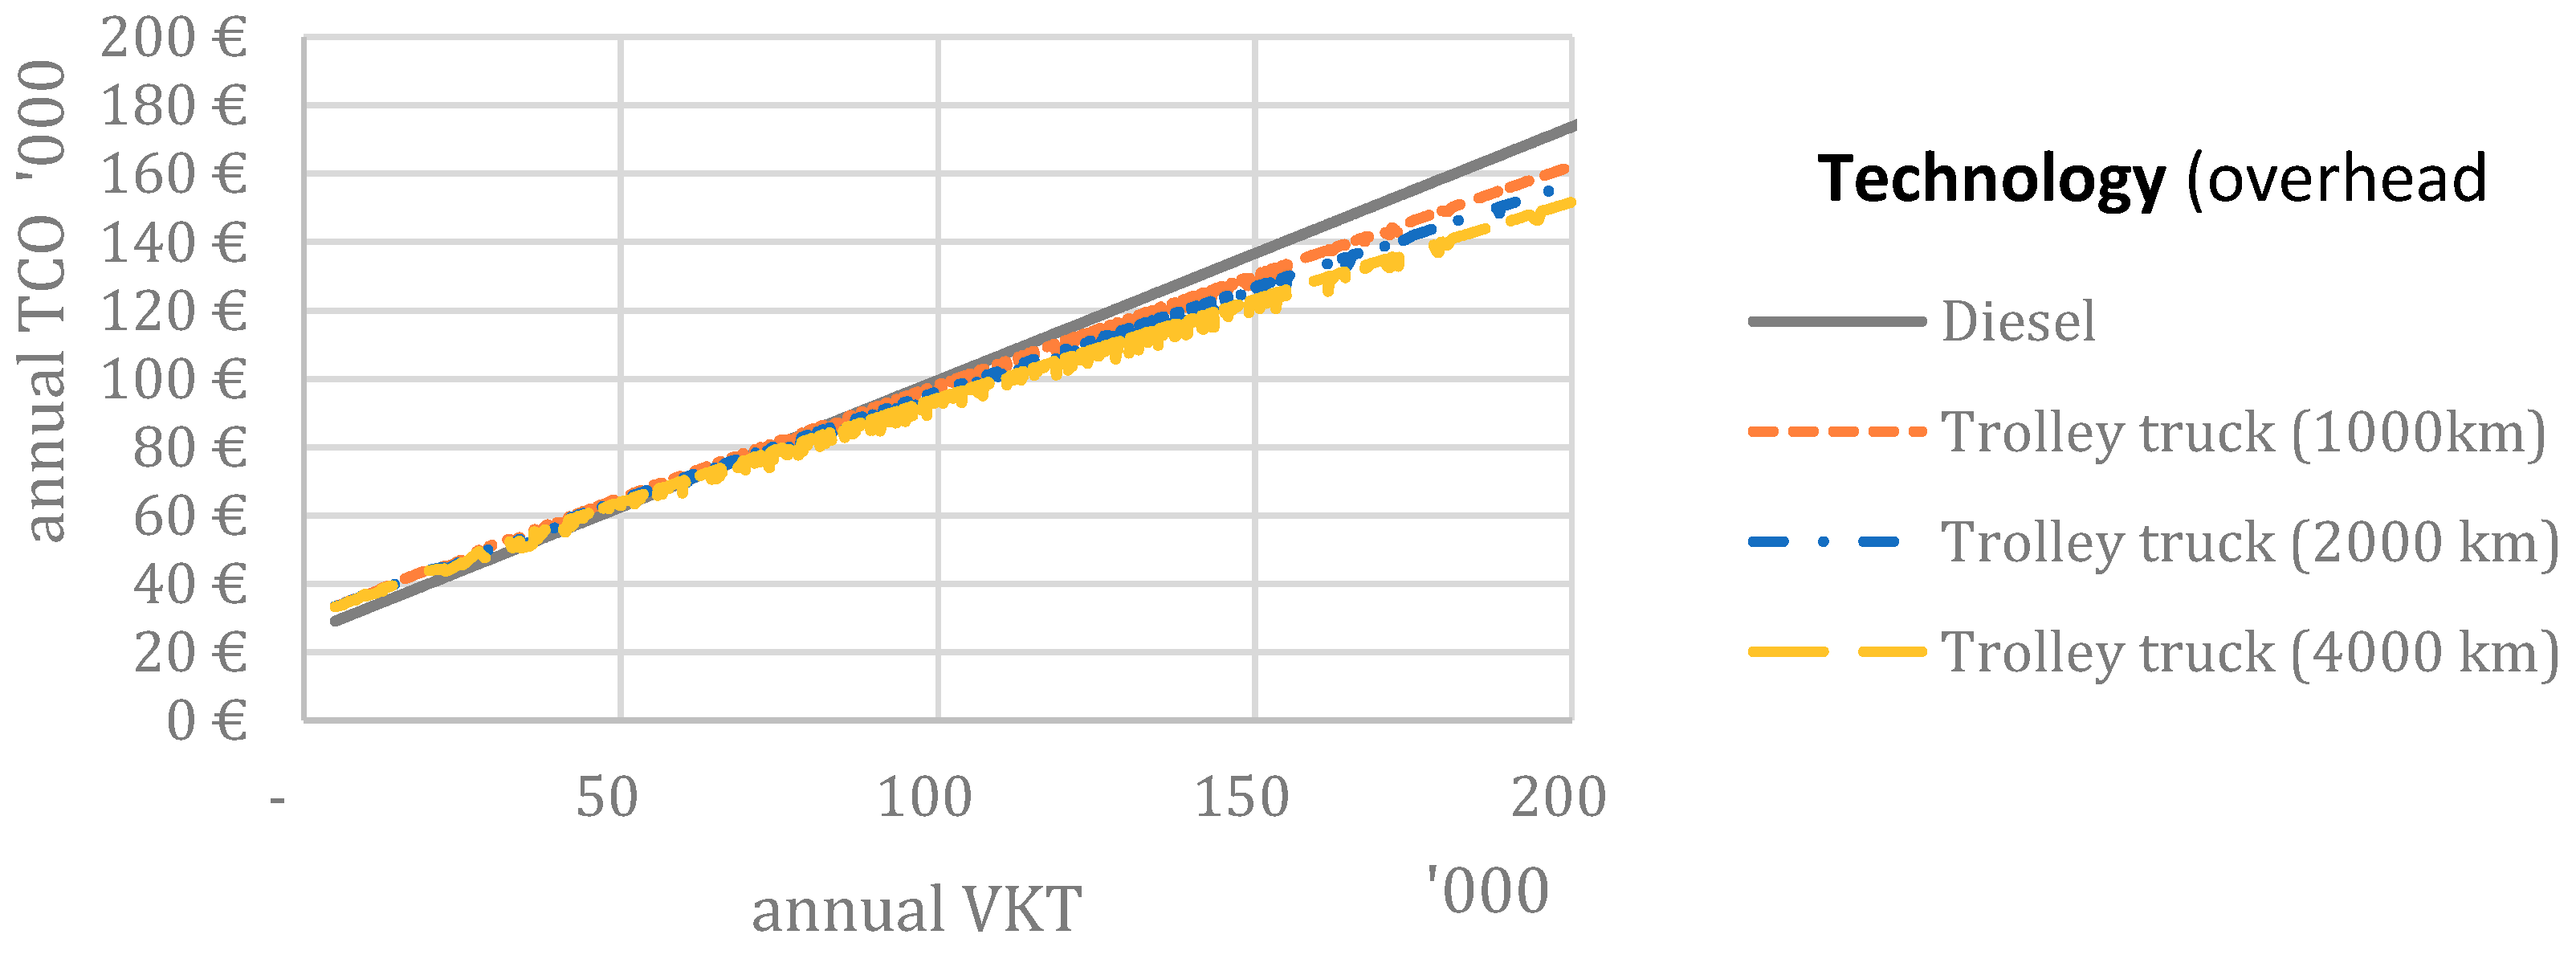
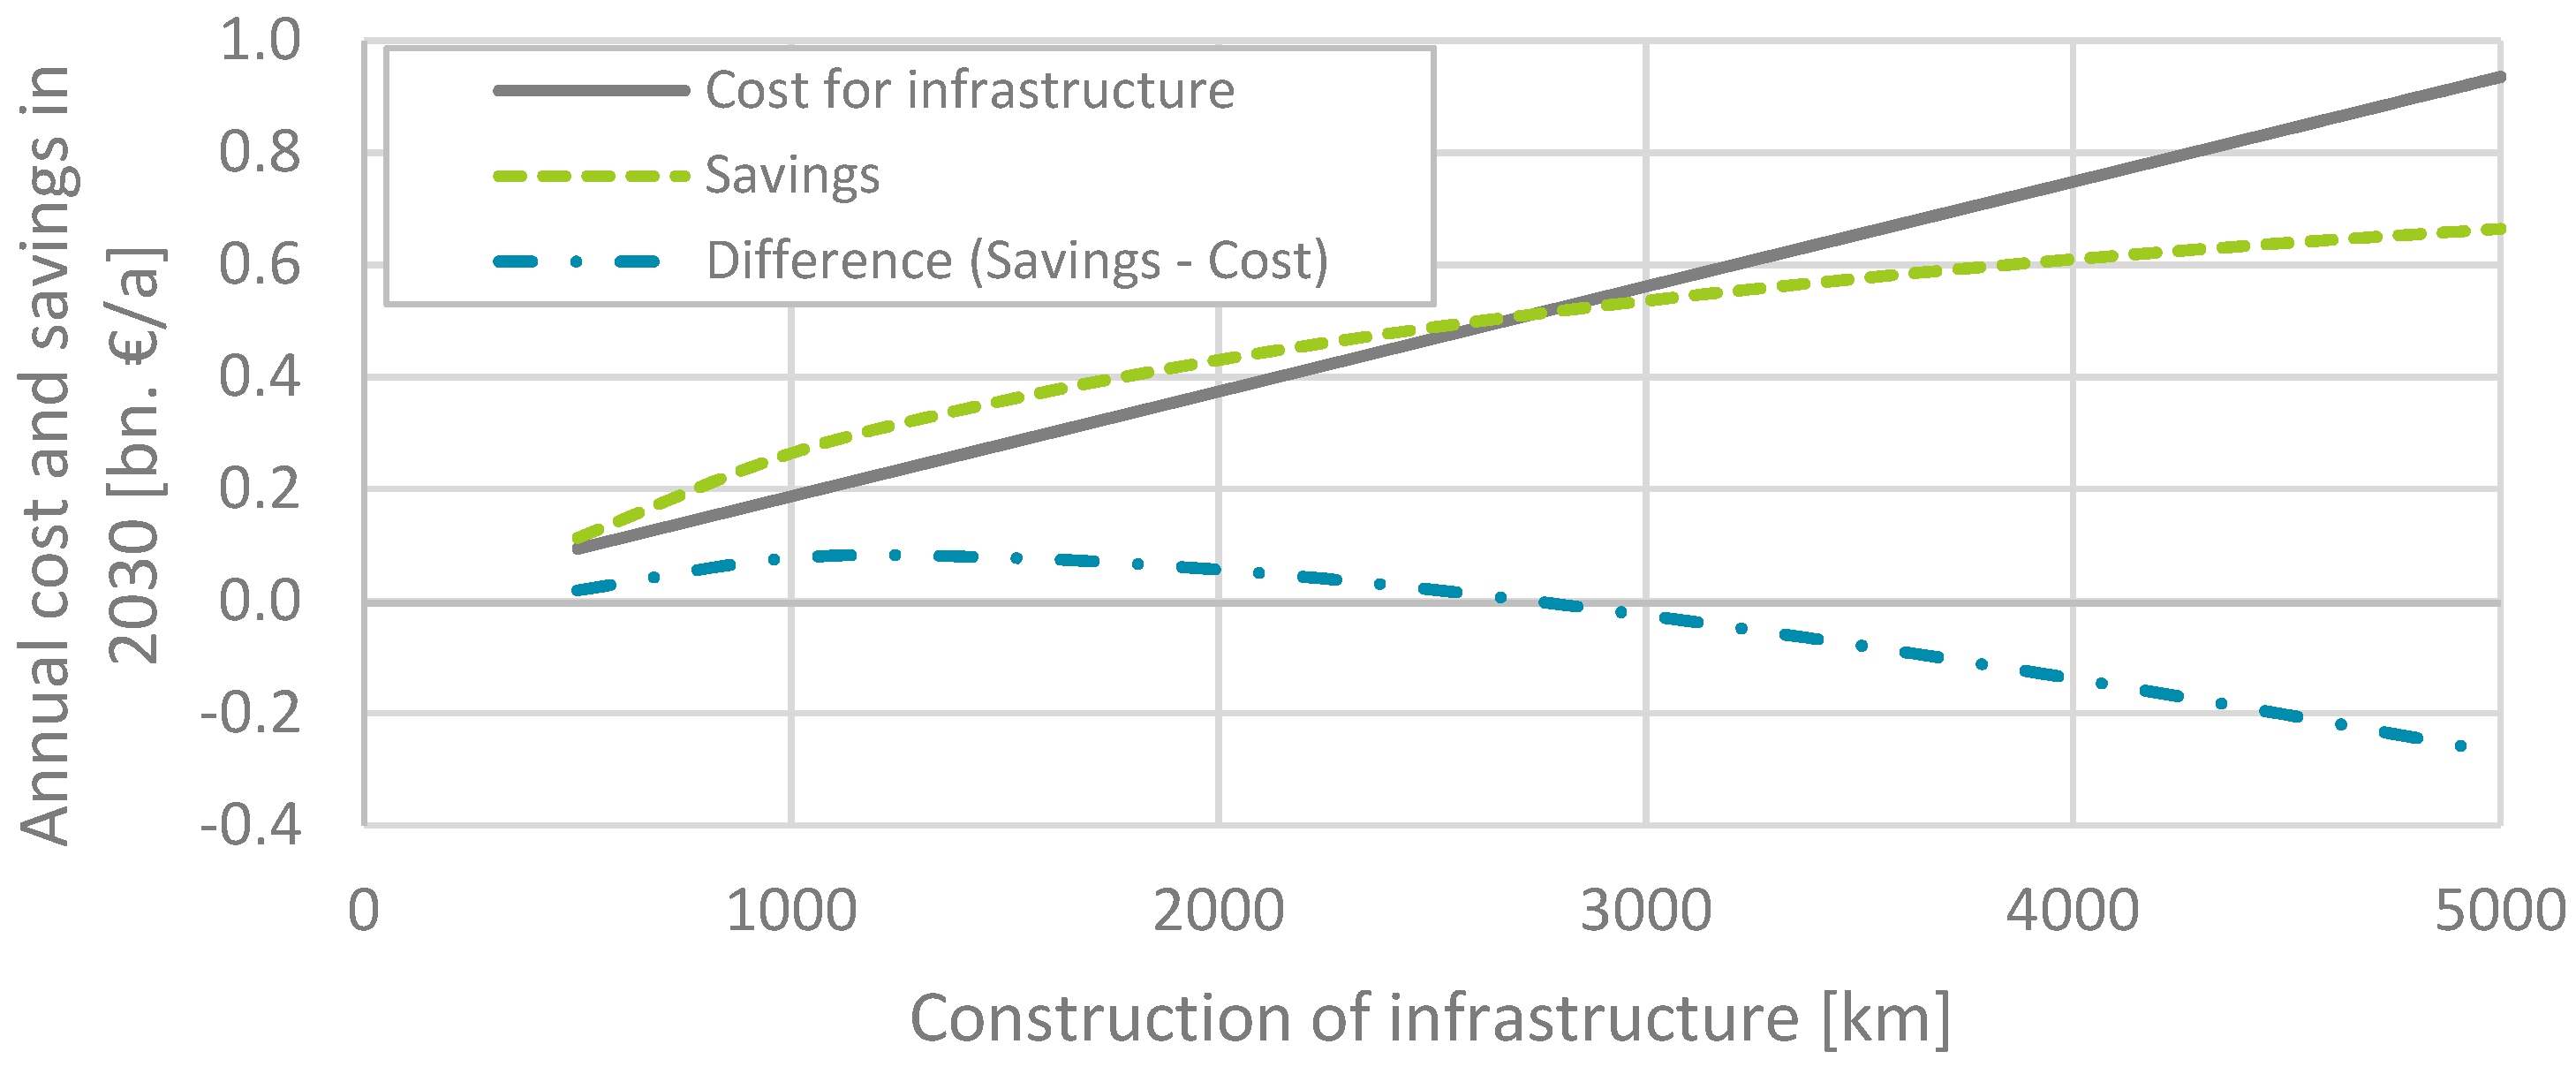
3.2. Economic Assessment and Market Potential
3.3. Greenhouse Gas Balance and Impacts on Energy Systems
4. Discussion and Aspects Neglected
4.1. Discussion of Methodology and Assumptions
4.2. Further Research
4.2.1. Infrastructure Financing
4.2.2. Gradual Market Diffusion
4.2.3. Market and User Acceptance
4.2.4. Alternative Technical Options
4.2.5. Comparison to Rail Freight
5. Summary and Conclusions
Author Contributions
Funding
Conflicts of Interest
References
- International Energy Agency (IEA). The Future of Trucks—Implications for Energy and the Environment; OECD/IEA: Paris, France, 2017. [Google Scholar]
- Blanck, R.; Kasten, P.; Hacker, F.; Mottschall, M. Treibhausgasneutraler Verkehr 2050: Ein Szenario zur zunehmenden Elektrifizie-rung und dem Einsatz stromerzeugter Kraftstoffe im Verkehr. Abschlussbericht im Auftrag des Umweltbundesamtes zum Forschungsvorhaben. In Verkehr 2050—Entwicklung von Pa-rametern und Skizzierung eines vereinfachten Energie und Emissionsszenarios; Öko-Institute.V.: Berlin, Germany, 2013. [Google Scholar]
- Wietschel, M.; Gnann, T.; Kühn, A.; Plötz, P.; Moll, C.; Speth, D.; Stütz, S.; Schellert, M.; Rüdiger, D.; Balz, W.; et al. Machbarkeitsstudie zur Ermittlung der Potentiale des Hybrid-Oberleitungs-Lkw. In Studie im Rahmen der wissenschaftlichen Beratung des BMVI zur Mobilitäts-und Kraftstoffstrategie; Bundesregierung, Fraunhofer ISI, Karlsruhe, Fraunhofer IML, Dortmund, PTV Transport Consult GmbH, Stuttgart, Karlsruhe, TU Hamburg-Harburg, Hamburg, M-Five: Karlsruhe, Germany, 2017. [Google Scholar]
- European Union (EU). 1. EU Reference Scenario 2016—EU and EU Country Results. 2017. Available online: https://data.europa.eu/euodp/de/data/dataset/energy-modelling/resource/9c3eaead-81b8-4a3d-a23d-4dd4a13f3c6e (accessed on 3 August 2017).
- Grontmij. Elektriska vägar—Elektrifiering av tunga vägtransporter; Förstudie; Grontmiij: Stockholm, Sweden, 2010. [Google Scholar]
- SRU. Umweltgutachten 2012—Verantwortung in einer begrenzten Welt; Sachverständigenrat für Umweltfragen, Erich Schmidt Verlag: Berlin, Germany, 2012. [Google Scholar]
- den Boer, E.; Aarnik, S.; Kleiner, F.; Pagenkopf, J. Zero Emissions Trucks, An Overview of State-of-the-Art Technologies and Their Potential; CE Delft: Delft, The Netherlands; German Aerospace Center: Stuttgart, Germany, 2013. [Google Scholar]
- Hey, C. Postfossil Freight Transport—Assessment of Strategy Capproaches: Truck CO2—Time to Turn up the Voltage? Potential and Challenges for Electric Road Freight, European Parliament. Presented at German Advisory Council on the Environment (SRU), Berlin, Germany, 16 February 2016. [Google Scholar]
- Jerrelind, J.; Drugge, L.; Stensson Trigell, A.; Nybacka, M. Simulation of Vehicle-Overhead Power System Interaction on Electric Roads. In Proceedings of the 13th MINI Conference on Vehicle System Dynamics, Identification and Anomalies, Budapest, Hungary, 5–7 November 2012. [Google Scholar]
- Harter, M.; Schipper, T.; Zwirello, L.; Ziroff, A.; Zwick, T. Detection of Overhead Contact Lines with a 2D-Digital-Beamforming Radar System for Automatic Guidance of Trolley Trucks. Int. J. Veh. Technol. 2013, 2013, 914351. [Google Scholar] [CrossRef]
- Mazumdar, J. Performance improvement of mining haul trucks operating on trolley systems. In Proceedings of the Industry Applications Society Annual Meeting (IAS), Orlando, FL, USA, 9–13 October 2011. [Google Scholar] [CrossRef]
- Akerman, P.; Gruenjes, H.G.; Lehmann, M. Designing and Demonstrating an Electric Road System for Efficient and Sustainable Road Freight. In Proceedings of the Transportation Research Board 96th Annual Meeting, Washington, DC, USA, 8–12 January 2017. [Google Scholar]
- Gnann, T.; Kühn, A.; Plötz, P.; Wietschel, M. How to Decarbonise Heavy Road Transport? In ECEEE Summer Study Proceedings; European Council for an Energy-Efficient Economy: Paris, France, 2017; pp. 901–909. [Google Scholar]
- Gnann, T.; Plötz, P.; Wietschel, M.; Kühn, A. What is the best alternative drive train for heavy road transport? Presented at the EVS30, International Battery, Hybrid and Fuel Cell Electric Vehicle Symposium & Exhibition, Stuttgart, Germany, 9–11 October 2017. [Google Scholar]
- Plötz, P.; Gnann, T.; Jochem, P.; Yilmaz, H.Ü.; Kaschub, T. Impact of electric trucks powered by overhead lines on the European electricity system and CO2 emissions. Energy Policy 2019, 130, 32–40. [Google Scholar] [CrossRef]
- Globisch, J.; Dütschke, E. Anwendersicht auf Elektromobilität in gewerblichen Flotten. In Ergebnisse aus den Projekten mit gewerblichen Nutzern von Elektrofahrzeugen im Rahmen des BMVBS-Vorhabens “Modellregionen für Elektromobilität 2009–2011”; Fraunhofer ISI: Karlsruhe, Germany, 2013. [Google Scholar]
- Sierzchula, W. Factors influencing fleet manager adoption of electric vehicles. Transp. Res. Part D Transp. Environ. 2014, 31, 126–134. [Google Scholar] [CrossRef]
- Plötz, P.; Gnann, T.; Wietschel, M. Modelling market diffusion of electric vehicles with real world driving data—Part I: Model structure and validation. Ecol. Econ. 2014, 107, 411–421. [Google Scholar] [CrossRef]
- WVI; IVT; DLR; KBA. Kraftfahrzeugverkehr in Deutschland 2010 (KiD2010); WVI Prof. Dr.Wermuth Verkehrsforschung und Infrastrukturplanung GmbH: Braunschweig, Germany; IVT Institut für angewandte Verkehrs-und Tourismusforschung e. V.: Heilbronn, Germany; DLR Deutsches Zentrum für Luft-und Raumfahrt—Institut für Verkehrsforschung: Berlin, Germany; KBA Kraftfahrt-Bundesamt: Flensburg, Germany, 2010. [Google Scholar]
- BASt (Bundesanstalt für Straßenwesen). Manuelle Straßenverkehrszählung 2010—Ergebnisse auf Bundesautobahnen. 2010. Available online: http://www.bast.de/DE/Verkehrstechnik/Fachthemen/v2-verkehrszaehlung/zaehl_node.html (accessed on 5 May 2019).
- BASt (Bundesanstalt für Straßenwesen). Mauttabelle 2016. Herausgegeben von der Bundesanstalt für Straßenwesen. Available online: http://www.mauttabelle.de/maut_162.html (accessed on 13 March 2017).
- Lastauto Omnibus. Lastauto Omnibus-Katalog, 1st ed.; Motorbuch: Stuttgart, Germany, 2014. [Google Scholar]
- Propfe, B.; Redelbach, M.; Santini, D.J.; Friedrich, H. Cost Analysis of Plug-in Hybrid Electric Vehicles including Maintenance & Repair Costs and Resale Values; German Aerospace Center: Stuttgart, Germany; Argonne National Laboratory, Transportation Technology R&D Center (Argonne): Los Angeles, CA, USA, 2012. [Google Scholar]
- Repenning, J.; Emele, L.; Blanck, R.; Böttcher, H.; Dehoust, G.; Förster, H.; Braungardt, S.; Eichhammer, W.; Elsland, R. Klimaschutzszenario 2050—2. Endbericht. In Studie im Auftrag des Bundesministeriums für Umwelt, Naturschutz, Bau und Reaktorsicherheit; Öko-Institut e.V., Fraunhofer ISI: Berlin, Germany, 2015. [Google Scholar]
- Kasten, P.; Mott-schall, M.; Köppel, W.; Degünther, C.; Schmied, M.; Wüthrich, P. Erarbeitung einer fachlichen Strategie zur Energieversorgung des Verkehrs bis zum Jahr 2050. In Studie im Auftrag des Umweltbundesamtes; Öko-Institut e.V., DVGW-Forschungsstelle am Engler-Bunte-Institut des Karlsruher Instituts für Technologie (KIT), INFRAS: Berlin, Germany, 2016. [Google Scholar]
- UBA. Klimaschutzbeitrag des Verkehrs bis 2050. Studie für das Bundesministerium für Umwelt, Naturschutz, Bau und Reaktorsicherheit; Durchgeführt von ifeu, INFRAS AG und LBST: Berlin, Germany, 2016. [Google Scholar]
- Plötz, P.; Funke, S.A.; Jochem, P.; Wietschel, M. CO2 Mitigation Potential of Plug-in Hybrid Electric Vehicles larger than expected. Sci. Rep. 2017, 7, 16493. [Google Scholar] [CrossRef] [PubMed]
- Yeh, S. An empirical analysis on the adoption of alternative fuel vehicles: The case of natural gas vehicles. Energy Policy 2007, 35, 5865–5875. [Google Scholar] [CrossRef]
- European Commission. White Paper Roadmap to a Single European Transport Area—Towards a Competitive and Resource Efficient Transport System; COM/2011/0144; European Commission: Brussels, Belgium, 2011. [Google Scholar]
- McKinnin, A. The Role of Government in Promoting Green Logistics. In Green Logistics—Improving the Environmental Sustainability of Logistics; McKinnon, A., Cullinane, S., Browne, M., Whiteing, A., Eds.; MPG Books Ltd.: Cornwall, UK, 2010; Chapter 17; pp. 341–360. [Google Scholar]
- Woodburn, A.; Whiteing, A. Transferring Goods to ‘Greener’ Modes. In Green Logistics—Improving the Environmental Sustainability of Logistics; McKinnon, A., Cullinane, S., Browne, M., Whiteing, A., Eds.; MPG Books Ltd.: Cornwall, UK, 2010; Chapter 6; pp. 124–139. [Google Scholar]
- van Hassel, E.; Vanelslander, T.; Doll, C. The Assessment of Different Future Freight Transport Scenarios for Europe and the North Rhine-Westphalia Region; Working Paper 7 to the Study LowCarb RFC—European Rail Freight Corridors Going Carbon Neutral, supported by Stiftung Mercator (Essen); University of Antwerp, Fraunhofer ISI: Karlsruhe, Germany, 2018. [Google Scholar]
- Doll, C.; Köhler, J.; Schade, W.; Mader, S.; van Hassel, E.; Vanelslander, T.; Sieber, N. European Freight Scenarios and Impacts; Summary Report 2 to the Study LowCarb RFC—European Rail Freight Corridors Going Carbon Neutral, supported by Stiftung Mercator (Essen); Fraunhofer ISI: Karlsruhe, Germany, 2018. [Google Scholar]


| Attribute | Unit | Diesel | Trolley Truck (Diesel) | Trolley Truck (Battery) |
|---|---|---|---|---|
| Investment | EUR | 128,673 | 152,000 | 189,300 |
| Consumption | kWh/km | 2.46 | 2.46/1.60 | 1.60 |
| O&M | EUR/km | 0.143 | 0.135 | 0.107 |
| Range | km | 2300 | 2300 | 100 (electric) |
| Battery capacity | kWh | 0 | 0 | 200 |
| CO2 emission (TtW) | kgCO2/kWh | 0.324 | 0.196 | 0.196 |
| Parameters (All Prices w/o VAT in EUR2016) | Unit | Value 2030 |
|---|---|---|
| Battery price | EUR/kWh | 186 |
| Battery life-time | Full cycles | 5000 |
| Diesel price | EUR/l | 1.53 |
| Diesel price | EUR/kWh | 0.15 |
| Electricity price, industrial | EUR/kWh | 0.16 |
| Average CO2 emissions of German power plants | t CO2/MWh | 0.192 |
© 2019 by the authors. Licensee MDPI, Basel, Switzerland. This article is an open access article distributed under the terms and conditions of the Creative Commons Attribution (CC BY) license (http://creativecommons.org/licenses/by/4.0/).
Share and Cite
Wietschel, M.; Gnann, T.; Plötz, P.; Doll, C. Electric Trolley Trucks—A Techno-Economic Assessment for Germany. World Electr. Veh. J. 2019, 10, 86. https://doi.org/10.3390/wevj10040086
Wietschel M, Gnann T, Plötz P, Doll C. Electric Trolley Trucks—A Techno-Economic Assessment for Germany. World Electric Vehicle Journal. 2019; 10(4):86. https://doi.org/10.3390/wevj10040086
Chicago/Turabian StyleWietschel, Martin, Till Gnann, Patrick Plötz, and Claus Doll. 2019. "Electric Trolley Trucks—A Techno-Economic Assessment for Germany" World Electric Vehicle Journal 10, no. 4: 86. https://doi.org/10.3390/wevj10040086
APA StyleWietschel, M., Gnann, T., Plötz, P., & Doll, C. (2019). Electric Trolley Trucks—A Techno-Economic Assessment for Germany. World Electric Vehicle Journal, 10(4), 86. https://doi.org/10.3390/wevj10040086