1. Introduction
Alternative powertrains are the key to meeting future emission targets [
1]. In addition to the pure battery electric vehicle (BEV), many other technologies are traded as the powertrains of the future. Among others, vehicles with fuel cells and high pressure hydrogen tanks (FCEV) or vehicles with a constant power supply while driving, for example through inductive power transfer (IPTEV), are promising developments. Decision-makers from politics and industry are now faced with the question of which alternative powertrain technology should ideally be promoted through targeted investments. The reduction of traffic-related emissions and the costs of individual mobility are only some of the decisive parameters. Since alternative powertrain technologies require cost-intensive investments in public infrastructure, their implementation can only succeed on the basis of systematically prepared and evaluated information and with the involvement of all interest groups.
A wide variety of papers deal with the comparison of powertrain technologies, as shown later in
Section 2.2. However, only a few studies exist that integrate an electrified road (E|ROAD) infrastructure into such a comparison. With this technology, electrical energy is transferred into the vehicle in motion by wireless charging. The isolated evaluation of the expenditures for the implementation of an E|ROAD is addressed in current studies. In [
2,
3], the E|ROAD infrastructure is examined in detail with regard to its ecological influences using an extensive life cycle analysis. So far, comparisons to other alternative powertrain technologies are mainly known with an economic focus. In this context, [
4,
5] investigate the effects of an E|ROAD on freight traffic in North America and summarize that far-reaching cost advantages can be achieved compared to battery-operated trucks. However, there are hardly any studies known that evaluate the available alternative powertrain technologies holistically against each other. The present paper aims at such a holistic comparison.
The basic structure of the comparative methodology has already been presented and described in [
6]. The aim of this study is to extend the existing framework to include a consideration of the criticality of raw materials similar to the work shown in [
7]. Since the focus of the study is on long-distance mobility, only relevant infrastructure expenses for long-distance mobility are to be included. Therefore, an approach is presented and validated to calculate traffic performance-dependent infrastructure investments. This approach is applied to separate the infrastructure for long-distance mobility from the entire infrastructure expenses for a powertrain technology. Furthermore, the technical implementation of the extensive data framework for the KPI calculation is shown.
2. Existing Approaches to Technology Assessment of Alternative Powertrains and Need for Action
2.1. Overview of Alternative Powertrain Technologies
The technological comparison methodology in this work is applied to BEV, IPTEV, and FCEV powertrains. The relevant basics of the technologies are briefly described below.
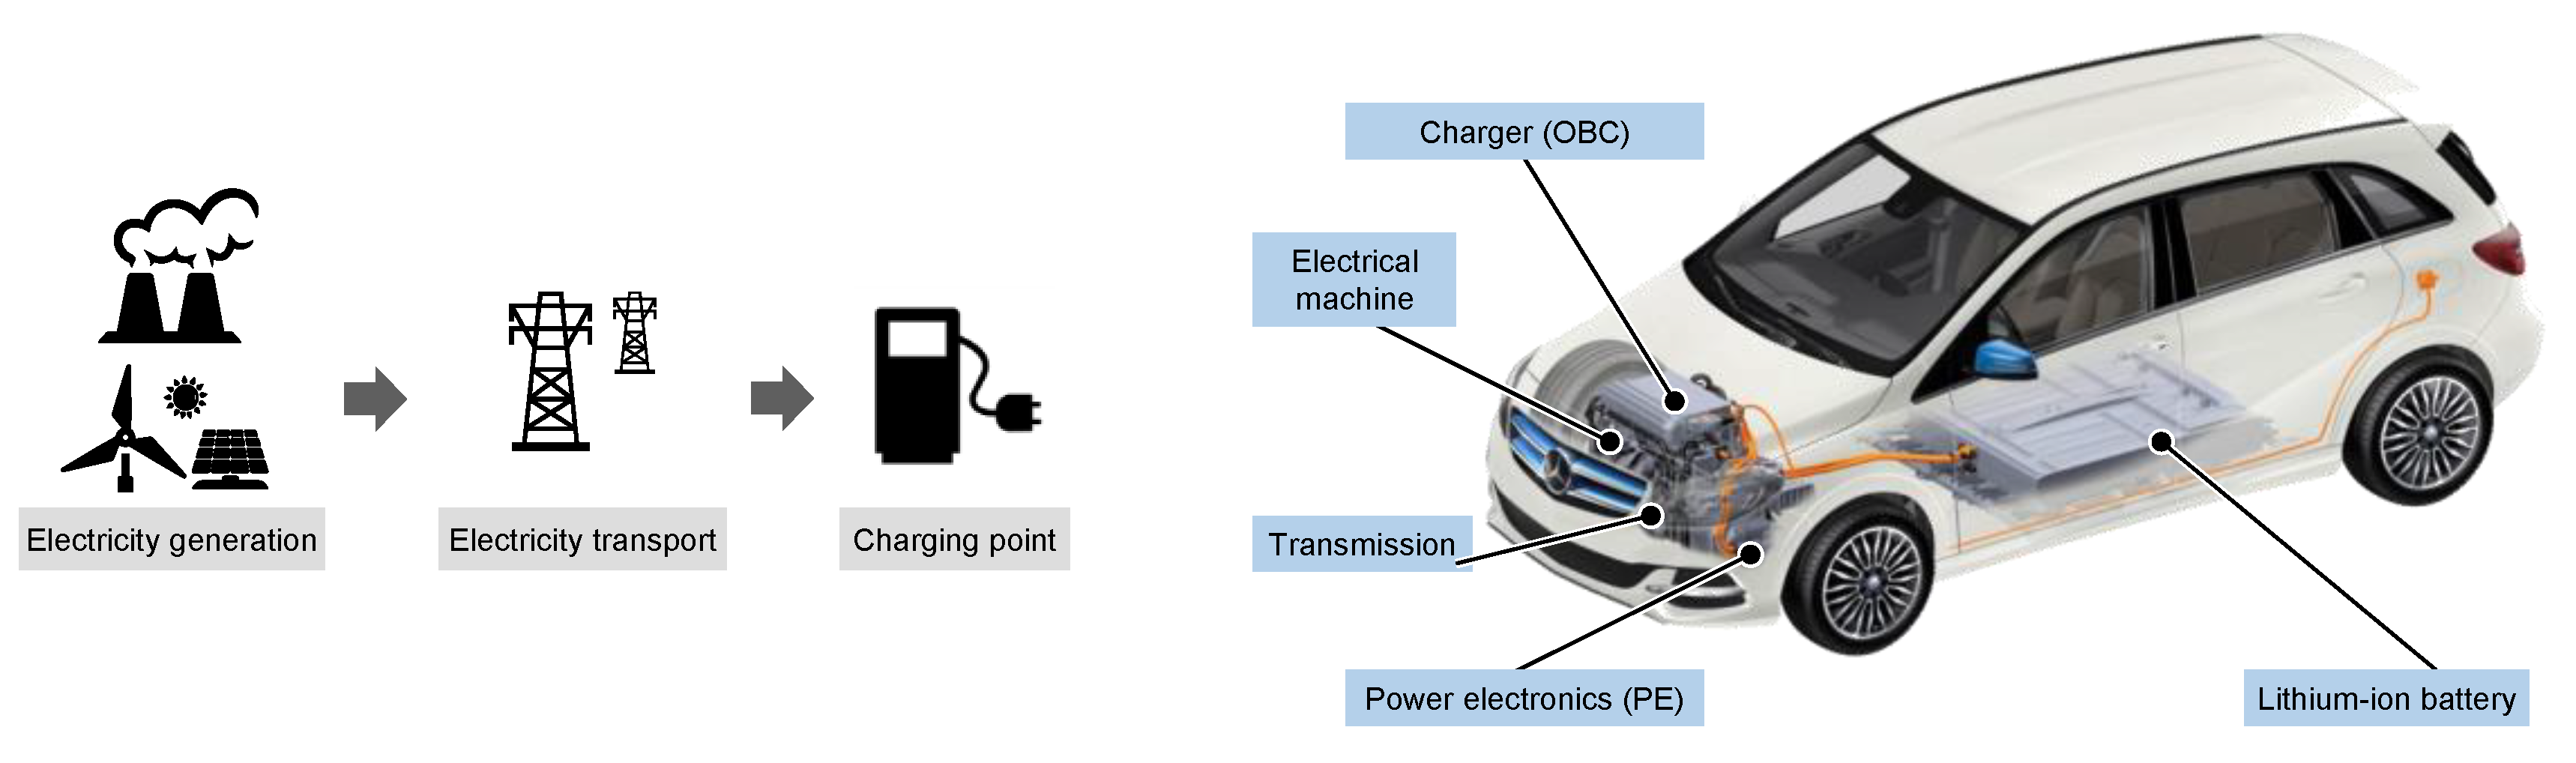
Figure 1 gives an overview of the infrastructure and vehicle components of the BEV. Relevant components are the battery system, the onboard charger (OBC), the electrical machine, assuming a permanent magnet synchronous motor (PMSM), and a transmission as well as the power electronics (PE). The components described are also used within the IPTEV and FCEV powertrains, although a lower dimensioned energy storage is used.
Regarding the individual components considered, the BEV represents the highest degree of technological development at the time of this study. However, extensive research efforts are still underway, particularly in energy storage technology. For the complete roll-out of the BEV vehicle concept, a comprehensive charging infrastructure has to be installed. Moreover, for the operation of the BEV powertrain, the energy supply path must be taken into account. Electrical energy is provided by the electricity generation and made available at the charging point via the grid infrastructure.
For IPTEV, the electrical energy required for long-distance mobility is constantly provided by an E|ROAD while driving. The onboard battery is therefore smaller than that of BEV vehicles, being otherwise equal to that in
Figure 1. With a high degree of expansion of the E|ROAD infrastructure, the driving range is practically unlimited [
8]. The implementation of the IPTEV concept requires additional infrastructure- and vehicle-related adaptations and investments compared to a BEV [
8]. Essential components are summarized in
Figure 2.
As this paper will show, the inductive power transfer is expected to reduce overall efficiency compared to BEV. However, due to the lower vehicle mass caused by the smaller vehicle battery, the energy demand is reduced. However, due to the lower vehicle mass caused by the smaller vehicle battery, the energy demand is reduced. With regard to total cost of ownership (TCO) calculations, the high infrastructure expenditures for the expansion of the E|ROAD are particularly significant. The roads have to be equipped with charging pads that consist of magnetic field-generating coils, corresponding power electronics and a connection to the power grid [
8]. The electrical energy is provided by the energy generation and the grid infrastructure.
The basic idea of an E|ROAD can be implemented by further technological alternatives. In addition to inductive energy transmission, the vehicle can also be powered by conductive energy transmission, either by a contact from above through overhead lines or from below via conductors in the road. For instance, the eROAD Arlanda technology transfers energy from a rail in the road to the vehicle, using a movable arm on the vehicle side [
9]. The Siemens eHighway applies the technologically well-engineered pantograph technology to trucking [
10]. Both technologies are currently under intensive investigation.
The FCEV has similar vehicle components to the BEV. The vehicle’s battery, in turn, is small in size, and the necessary energy is provided by an onboard fuel cell. The supply paths of the FCEV technology are manifold. To achieve comparability to the given powertrain configurations, the supply path via electricity generation, grid infrastructure, central electrolysis, H2 compression, and fueling are being assumed as shown in
Figure 3.
2.2. Existing Studies Comparing Powertrain Technologies
The state of the art for methodical comparisons of powertrain technologies cannot be conclusively assessed. Some relevant studies are characterized in the following. Li et al. [
12] compared the conventional combustion engine technology (ICE) with BEV and FCEV. The assessment is based on the total energy requirement and the generated level of greenhouse gas emissions. The development of the energy mix in China until 2050 is taken into account. In addition, Pollet et al. [
13] addressed hybrid electric vehicles (HEV) and evaluated powertrains with regard to vehicle costs and technical parameters, such as energy density, achievable energy efficiency, and safety aspects. Regarding individual vehicle components, a technology roadmap addresses future technological improvements. The effects on the infrastructure are also considered. Wietschel et al. [
14] evaluated the profitability with regard to acquisition costs as well as maintenance; servicing, energy efficiency; and greenhouse gas emissions of ICE, HEV, BEV, and FCEV. The powertrains are analyzed at different times of comparison to address varying framework conditions. Different vehicle sizes and segments complement the analysis.
Table A1 summarizes the selected studies on the evaluation of alternative powertrain technologies. As can be seen, different criteria for technology assessment are used in the studies under consideration. In addition to technical factors such as solution specific drive power, economic parameters etc., the acquisition and maintenance costs of the vehicle can be included in the comparison. Other studies include ecological parameters such as greenhouse gas (GHG) emissions.
Although individual criteria and assumptions are defined in the various publications, there is the common feature that not only vehicle side aspects have to be examined but also the associated infrastructure. This is widely realized by applying well-to-wheel (WTW) analysis. Furthermore, the identified studies focus on the presented powertrain technologies BEV and FCEV and include various types of hybridization, like HEV, plug in hybrid electric vehicles (PHEV) or range-extended electric vehicles (REEX). A small number of studies include the IPTEV powertrain into examination. However, [
4,
5] investigated the effects of an E|ROAD on freight traffic in North America and came to the conclusion that far-reaching cost advantages can be achieved compared to battery-operated trucks.
2.3. Existing Studies Assessing Powertrain Technology Dependent Raw Material Criticality
Not many studies are known that evaluate the resource criticality of alternative powertrain technologies. For instance, [
15] considered the raw materials lithium (Li), cobalt (Co), nickel (Ni), graphite (Gra), and platinum (Pt) and calculated their global demand for a scenario of global warming by 2 °C by 2100 and a distribution of the proportions of the powertrain alternatives. The segments considered are passenger cars, trucks, buses, motorcycles, and pedelecs. The study comes to the conclusion that the sharp rise in demand for lithium does not lead to a long-term physical shortage of raw material due to the large reserves and resources. The same conclusion is drawn for cobalt, whose increase in demand is mainly caused by electric mobility. This statement also applies to the other raw materials nickel, graphite, and platinum, which are used much more widely. However, temporary shortages for various reasons are by no means unrealistic. In the case of lithium and cobalt, the increased demand requires the development of new production sites as well as the establishment of further recycling structures, which so far only exist for cobalt to an acceptable level. The well-developed nickel production and the substitutability of graphite by synthetic graphite make a temporary shortage of these two raw materials unlikely.
A more holistic approach is to include the raw materials and energy for vehicle production and disposal as well as the energy for vehicle use into the scope of a study [
16]. It is determined that the higher material requirements of BEV and various hybrid electric vehicle topologies (xEV) approximate the lower material requirements of the conventional ICE over the observation period up to 2050. In the case of electric vehicles, not only the battery but also the power electronics are declared to be decisive, which is why the additional demand falls mainly on lithium and gold as well as the non-critical metals steel and copper (Cu). A decisive role is also assigned to the use phase in the current state of technology. By 2050, the environmental balance of the xEV can be improved and the material requirements of the utilization phase reduced by a high proportion of regenerative energy generation. The production phase of the life cycle of the vehicles will then be even more important for the material requirements.
In contrast to the other studies, [
17] assumes that one powertrain technology covers the mobility demand completely. The maximum requirement of a raw material is deduced from this assumption. Just for the FCEV scenario, however, approximately 50% FCEV and 50% BEV are taken into account. In addition to mobile applications in cars, trucks and buses, stationary systems are also considered separately. Due to the extreme consideration and the diverse scenario selection, the results of the study are not suitable for a direct comparison with other results.
2.4. Need for Further Research
A limitation of previous studies is the focus on single technological aspects. For example, prior publications focus on the ecological effects of a powertrain concept without considering other factors like economic efficiency [
12,
18]. Furthermore, it is not possible to combine the core statements from several studies to develop a holistic statement since the study’s specific results are based on different assumptions and are therefore incompatible.
Different phases of technological development complicate comparisons further. For example, conventional powertrains are the result of a development and improvement process over 150 years, reaching the physical limits more and more. In contrast, there is still considerable technological and economic optimization potential for today’s BEV, especially with regard to the installed energy storage. Thus, when interpreting existing technology assessments, it must be taken into account that the applied key figures only allow limited conclusions on the best possible powertrain due to deviating conditions and development stages.
A further limitation results from the context of the considered vehicle concepts or the data basis for determining any comparative values. Existing models or reference vehicles are frequently used to compare different powertrains [
13]. This approach makes it possible to depict the current state of the art and draw conclusions on current market conditions. However, due to manufacturer-specific adaptations, the available vehicle models may show significant differences with regard to the parameters under investigation. Consequently, the specification of currently available vehicle models as reference models is not expedient if a long-term conclusion on technologies is to be drawn. Instead, the objective and unbiased consideration of different technologies requires the derivation of key figures that are as neutral as possible, and thus, manufacturer-independent.
Another restriction is a consistent consideration of infrastructure specifics. In the case of energy efficiency and ultimately absolute energy demand, most investigations rely on WTW analyses [
12,
18]. In the case of infrastructure expenditure, there is no uniform procedure for taking into account the resource demand and the costs for necessary infrastructure components across all powertrain technologies.
3. Basic Assumptions and System Boundaries
In order to ensure a holistic investigation, a comprehensive KPI system has to be defined. This requires, among others, general assumptions, the definition of framework conditions, and the identification of suitable KPIs from a technical, ecological and economic point of view.
3.1. Scope and Basic Assumptions
The comparative methodology enables the evaluation of alternative powertrain technologies. The scope of the study is defined as follows:
The focus is on individual long-distance mobility. Thereby, exclusively highway traffic is considered.
For the life cycle analysis, the system boundaries are selected in such a way that vehicle, infrastructure and energy supply are taken into account. The provision of raw materials, production, maintenance, and recycling are recorded.
The reference vehicle represents a passenger car from the compact car class.
As the economic area, Germany is selected in terms of energy prices, highway infrastructure or traffic performance. However, government influences like levies or taxes are separated by adjusted energy prices.
The points in time for the evaluation of the technology comparison are the current state of the art and the assessable technological potential. The framework conditions of +30 years are used to assess the technological potential.
3.2. Base Vehicle Configuration
The base vehicle defines vehicle-specific assumptions, independent of the assessed powertrain. For calculation, mass and costs as well as raw material requirements therefore only result from the configuration of the base vehicle with powertrain components, which are presented in
Section 2.1. The technological parameters of the components are summarized in
Table S3. The parameters of the base vehicle and the configured BEV are shown in
Table 1. To validate the BEV configuration in this work, its parameters are compared with BEVs currently available on the market.
3.3. System Boundaries of Life Cycle Analysis
In order to compare powertrain technologies against each other, the system boundaries of the viewing area must be defined. A common concept is the life cycle approach. Long-term ecological effects, such as carbon footprints, are recorded by a life cycle analyses (LCA). The current state of this research is based only on an LCA-based indicator, the LCA resource demand, which relates the materials required to implement a powertrain alternative to the available resources of this material on earth. Required materials are recorded according to the different life cycle phases as shown in
Figure 4.
In [
2], the life cycle of an IPTEV is analyzed and the necessity is determined to consider an infrastructure life cycle in addition to the vehicle life cycle. This structure is adopted and adapted in detail to determine the materials required.
Figure 4 shows the different life cycles. Only the filled components are taken into account at the current status of the work. In summary, a WTW life cycle to model the energy supply, a life cycle to consider the vehicle equipment, and a life cycle to consider the infrastructure are included in the analysis.
The WTW life cycle initially includes the extraction of energy resources. The generation of electrical energy comprises a combination of necessary resources such as coal (ID 1011 “resource_energy_per_energy”), gas and oil. A network infrastructure consisting of distribution and medium-voltage networks is required to transport electric energy to the infrastructure component. Relevant raw materials are shown in
Table S3. In the case of the BEV, the electrical energy is finally transferred to the vehicle via the technology specific infrastructure from the charging point.
In this paper, the vehicle life cycle comprises the raw materials, the materials for providing the production energy and the recycling of the vehicle materials. The relevant data is presented in
Table S3.
The infrastructure life cycle includes the materials necessary to build the infrastructure and material recycling at the end of the life cycle. Literature does not yet allow a consistent estimation of the energy requirements for the construction of the respective infrastructures and their maintenance, which is why these are not assessed for raw material criticality.
3.4. Traffic Performance Dependent Infrastructure Design
As shown, the life cycle of the infrastructure is to be included in the calculation of key figures. In order to focus on long-distance mobility, only the long-distance-relevant infrastructure share must be assessed for each technology (BEV: charging point; IPTEV: E|ROAD; FCEV: H2 charging station). In this paper, a procedure for calculating the necessary infrastructure via traffic performance is presented. Highway infrastructure is defined on the basis of a design hour of the design traffic intensity. This represents the 50th hour with the highest load on the respective motorway section [
22].
The design methodology is presented in three main steps: Measurement of the traffic performance in the design hour, determination of the average power demand in the design hour, and validation of the design methodology using the calculated instances to fit the power demand.
Table 2 describes the procedure.
The average traffic performance of the vehicle fleet on motorways is calculated from the sum of the documented vehicles per hour and road segment in both directions multiplied by the length of the road segments. The parameter is given as “design driving performance”. Each powertrain technology has an alternating power demand from the infrastructure. In the case of the BEV, the parameter represents the tank to wheel (TTW) efficiency added by the losses of the charging procedure (Infrastructure_tW efficiency). Using average charging powers for DC fast charging, the necessary instances to fit the power demand are measured. For the BEV technology, this results in a necessary number of 90,660 fast charging points at an average of 10 charging points per charging station. For long-distance mobility, this order of magnitude can be confirmed on the basis of the literature [
23,
24].
The traffic performance-based infrastructure design is used to calculate costs and resource demands for various infrastructures relevant for the operation of alternative powertrains.
Table 3 calculates costs and raw material investments for the charging infrastructure of the BEV consisting of charging points and a transformer. The specific raw material demand and costs per power are calculated using a reference charging point with 150 kW. By multiplying the specific costs and raw material demands with the calculated power demand of the BEV vehicle fleet in
Table 2 (13.6 GW), the total material demand and costs are estimated.
The same procedure is used for the assessment of the other infrastructures. For the E|ROAD, the relevant components are a transformer, power electronics, parallel cabling for grid connection, and coils in the road infrastructure. Since a complete electrification of the vehicle fleet is assumed here, the assumption of equipping all lanes of the motorway infrastructure with inductive charging coils is consistent. To calculate the copper demand of the coils, the demand per lane is used first. According to [
2], about 3550 kg/km per road direction is to be assumed. Over the average number of lanes of 2.29 in Germany [
25], the copper demand per km results in 8139 kg. For Germanys highway infrastructure, 12,996 km are to be electrified in both directions of travel which corresponds to a copper demand of 2.1×10
5 t for charging coils [
32]. Power-dependent specific requirements for power electronics and transformers must be multiplied by the power requirement of the fleet when calculating the E|ROAD. This corresponds to 15.9 GW in the state of the art. The investment costs for the electrification of all lanes based on [
5] and scaling of the lanes result in a requirement of 84.2 B€. The relevant calculation steps are as shown in
Table A2.
4. Data Management, Calculation Methods and Technical Implementation
4.1. Implementation Architecture
Data management of the general conditions, associated calculation methods and the presentation of the calculation results according to the target group are structured, changeable and extendable to be implemented. The selected architecture is shown in
Figure 5.
All framework conditions for the calculation of key figures are stored in a relational database. The different types of framework conditions as well as the definition of individual data sets and the structure of the relational database are summarized in
Section 4.2.
The database is accessed via a tool implemented in Python 3 to calculate the key figures. The calculation logics are described in the following
Section 4.3. An essential advantage of object-oriented programming in Python is the description of general calculation logics, which can be further specified for selected technologies by the principle of inheritance.
The calculation results of the KPIs are presented and interpreted in
Section 5. The presentation of the results can, for example, take place via a web server and thus a complete server-side implementation of the calculation tool can be realized.
4.2. Definition of the Data Structure
The framework conditions summarize the data for the calculation of KPIs. They are structured in general data, location-specific data and technological data. In doing so, all parameters that are neither technology- nor location-dependent are defined as general data. Among other things, the parameters of the base vehicle, e.g., mass or performance, are listed in the general data as well as the globally assumed raw material resources (
Table S1).
In particular, location-specific framework conditions summarize definitions of the local energy mix and the associated energy costs as well as traffic performances and the size of the vehicle fleet. Furthermore, the energy raw materials for the provision of electrical energy must be taken into account. For the German energy mix, e.g., the use of hard coal per kilowatt hour of electrical energy generated is assessed. Energy prices are adjusted for the share of political influence through levies, taxes or guaranteed market-unusual returns. Related data are also part of the location-specific framework conditions. A summary is presented in
Table S2.
All technological framework conditions are subdivided into infrastructure and powertrain components and are assigned to the various powertrains for the key figure evaluation. For the battery component, for example, parameters such as capacity, energy efficiency, energy density, resource requirements, and recycling rates as well as production energy demands and costs per storage capacity are taken into account. A summary of the technological parameters is given in the
Table S3.
The entire framework data are subdivided according to data type and the respective thematic reference. For the data type separation, the following nomenclature is introduced, which assigns a fixed ID_param, a parameter name, a unit, and a unique symbol to each data type.
Figure 6 shows the defined data schema using the example of an ID_param 0040, defining the energy density of a powertrain component.
The unique ID_param has four digits. The first digit determines the dimension of the parameter, which can vary between performance, ecological, economical or other parameters. Within the dimensions, the individual parameters are numbered consecutively to achieve a logical sequence in terms of content. The ID_param allows to flexibly extend the framework by additional parameter types.
The database schema is visualized in an Entity Relationship Diagram (
Figure A1) and is shortly described in the following: The above mentioned parameters (e.g., nominal_power) are assigned concrete values according to the thematic reference (e.g., 85 kW). The values differ depending on whether the state of the art or the technological potential is assessed. Each value is derived from a literature reference. Technological framework conditions (e.g., energy_density) are structured according to its components (e.g., Battery). Each component can be installed in different powertrains (e.g., BEV).
4.3. Calculation of Key Performance Indicators
Based on the above defined framework conditions, the definition and calculation of powertrain-related indicators with regard to performance, ecological and economic aspects is presented in the following.
4.3.1. Power-to-Weight-Ratio
The power-to-weight ratio is calculated from peak power output
Pp,bv divided by vehicle mass
m. The vehicle mass is given by the base vehicle mass
mbv, the mass of the powertrain, and the payload
mload.
The mass of the powertrain is given by the multiplication of all power or energy densities of the powertrain components with the nominal vehicle power
Pbv respectively the design power of the individual component or the design capacity of the energy storage
Ei. Using the assumptions in
Table 1, the power-to-weight ratio for the state of the art BEV is 91 W/kg.
4.3.2. Absolute Well-to-Wheel Efficiency
The absolute WTW efficiency of the powertrain can initially be divided into infrastructure (well-to-tank (WTT)) and vehicle (tank-to-wheel (TTW)) components and describes the efficiency chain from energy supply to the vehicle wheel. Therefore, each loss-generating component of the technological solution is evaluated in terms of achievable energetic efficiency
ηi.
Figure 7 describes the loss shares of each component in relation to the initial energy amount for the state of the art and the technological potential. The WTW efficiency index of a powertrain solution is therefore the remaining energy after passing through all loss-bearing components.
Since all considered powertrains demand electrical energy, the efficiency of the provision of the energy source “electricity” is not taken into account. For the state-of-the-art BEV, losses in energy transport on the infrastructure side therefore amount to 6% of the output energy quantity and in the charging unit at an efficiency of 85%. On the vehicle side, there are charging and discharging losses, heat losses in the power electronics, as well as losses in the electrical machine and the mechanical components of the powertrain. In the case of the BEV, this amounts to the remaining 60% of initial energy for the state of the art.
4.3.3. Well-to-Wheel Efficiency
If the defined technological efficiencies are related to the energy requirement at the vehicle wheel, the WTW efficiency is obtained. The calculation of the energy demand to overcome the driving resistances, rolling resistance, air resistance, gradient resistance and acceleration resistance on the basis of driving cycles is shown in [
6]. This results in the total work to be performed
Wacc and the potentially usable deceleration work
Wdec, which results from the deceleration phases in the driving cycle. The energetic efficiency to which recuperation takes place is generally lower than the usual TtW efficiency and is referred to as
ηTtW*. The energy required for vehicle operation at the energy supply level takes into account the infrastructure- and vehicle-specific efficiencies
ηWtT and
ηTtW according to:
4.3.4. Well-to-Wheel Greenhouse Gas Emission
For exclusively domestic electricity generation-based powertrain designs, a multiplication of the WTW efficiency
EWtW by the GHG emission factor
(GHG/E)local of the domestic electricity generation provides the calculation of WTW GHG emissions. Since there is no life cycle consideration, this calculation cannot be taken as a GHG footprint.
4.3.5. Life Cycle Analysis of Resource Demand
The powertrain-specific raw material demand is designed according to the life cycle definition in
Section 3.3. The KPI is calculated using the resources required to produce the powertrain components, the base vehicle
Rveh,pro as well as the infrastructure
Rinf,pro. The raw materials required to provide the energy for the production of the powertrain components
Eveh,pro and for vehicle operation (
EWtW)(
LCbv)(
milbv) are also taken into account. The KPI is then calculated by referring the resource demand to the globally available resources
Ra per driven kilometer (
LCbv)(
milbv):
The resource demand initially results from the raw materials for the production of powertrain components
Rveh,pro and associated infrastructure
Rinf,pro. For the vehicle, the raw materials result from the resources per power (
R/
P)
i or the resources per storage capacity (
R/
E)
i of each powertrain component multiplied by the respective power of the base vehicle
Pbv or the design storage capacity
Ei of component
i. The resource requirement of the base vehicle
Rbv is also taken into account. The resource requirements are reduced by the average recycling rate of the raw materials
xR,rec.
Similarly, the resource demands of the infrastructure components per vehicle result from the multiplication of the power-related resource demands per infrastructure component (
R/
P)
i with the average power demand of the vehicle against the infrastructure
PItW as calculated above and reduced by the recycling rate of the raw materials
xR,rec. For length-related infrastructure demands (
R/
L)
i, the individual length of the component is multiplied to result in the total infrastructure demand. The material demand for the infrastructure production is allocated over the vehicle life cycle:
Furthermore, the necessary energy raw materials for the generation of the electrical energy for the production of the powertrain have to be included over lifetime. The energy requirements for the production of the infrastructure components are not taken into account. The energy demands result from the energy demands per power (
E/
P)
i or the energy demands per storage capacity (
E/
E)
i for each powertrain component
i and the base vehicle
Ebv. To determine the key figure, the production energy demands are multiplied by the resources per energy of the global energy mix (
R/
E)
global.
4.3.6. Life-Cycle Analysis of Resource Range
The theoretical resource range of the critical raw material
RrLCA can be calculated for the most critical raw material determined for a powertrain alternative by multiplying it by the annually produced vehicles
nveh, which run through the life cycle and cover (
LCbv)(
milbv) kilometers:
4.3.7. Adjusted Total Cost of Ownership
The key figure adjusted total cost of ownership
aTCO is defined to illustrate economic effects of the alternative powertrains. The input variables, in particular the energy costs for the calculation, are adjusted for political influences on the energy prices in order to present the technological effects as undistorted as possible. The
aTCO consist of one-off costs
Cone-off and running costs
Crunning and are divided by the mileage of the vehicle (
LCbv)(
milbv):
The one-off costs result from the sum of the costs per powertrain component (
C/
P)
i or (
C/
E)
i multiplied by the base vehicle power
Pbv or the energy storage capacity of the component
Ei, the costs of the base vehicle
Cbv and the expected resale value which is included in the calculation via a factor
xresale. The costs of the powertrain-specific infrastructure
Cin are also taken into account:
The costs of powertrain-specific infrastructures are calculated in the same way as the raw material requirements for the infrastructure and are allocated over the vehicle lifetime:
However, only the infrastructure interface to the vehicle (charging point, E|ROAD, hydrogen filling station) not the energy supply path is taken into account since it is already included in the TCO calculation via the energy costs. The running costs
Crunning result from the energy costs per powertrain component. The energy costs are calculated from average energy prices (
C/
E) multiplied by the politically uninfluenced cost share
xc,adj. For this investigation, influences of maintenance, repair or insurance costs are not taken into account, as those cost components are not expected to differ over the alternative powertrains.
5. Results and Discussion
The following
Table 4 shows the defined KPIs for the described powertrain technologies. Each technology is examined with regard to the state of the art and the technological potential.
The KPI power-to-weight ratio is given in W/kg. Since all powertrains are designed for the peak power definition of the base vehicle, this ratio differs in terms of powertrain mass. A minimum powertrain mass and thus a high power-to-weight ratio should be aimed at in order to optimize the moving vehicle mass and thus the energy demand. The BEV, which is suitable for long distances, has the worst power-to-weight ratio with a large traction battery weighing around 560 kg. Since the energy storage of the IPTEV is smaller at 12 kWh and no fuel cell or tank system has to be carried, the IPTEV consistently has the most favorable power-to-weight ratio.
The absolute WTW efficiency evaluates the efficiency of the infrastructure and the vehicle powertrain. The aim is to achieve a high overall efficiency of the technology. In accordance with the technologies described and the associated infrastructure paths, the IPTEV has an additional loss-bearing component compared to the BEV due to the inductive energy transfer and therefore a lower overall efficiency. With the FCEV, the available electrical energy is first converted into hydrogen by stationary electrolysis and then converted back into electrical energy in the vehicle. Both steps contribute to the less optimal overall efficiency.
The WTW efficiency can finally be determined from the simulated energy demand of the vehicle as a function of the powertrain mass and the described overall efficiency of the technology. Although the IPTEV has a lower efficiency than the BEV, the lower powertrain mass leads to a lower overall energy requirement in the technological potential. Due to the unfavorable efficiency of the FCEV, the related efficiency of the FCEV is also out of favor.
Since the energy used in the powertrains is electrical energy and every powertrain under consideration is emission-free locally, the existing GHG emissions, i.e., the WTW GHG emission, result from the GHG emission factor of the energy supply multiplied by the operating energy demand. The rankings of the powertrain technologies therefore correspond to the rankings of the related WTW efficiency.
With regard to the life cycle analysis of the resource demand, the KPI LCA resource demand results from the relation of the resource requirements to the globally available raw material resources. Critical raw materials, in particular, are the electrode raw materials of the traction battery, which is installed in various configurations in all powertrains. Graphite is the most widely used anode material in Li–Ion batteries. Recycled graphite is not recovered for use in batteries, so there is no recycling rate. Instead of natural graphite, synthetic graphite can be used, which is why graphite is not listed in the evaluation table. Lithium is therefore the most critical raw material for the production of a traction battery, despite the high recycling rates that can be achieved. Dysprosium (Dy) is used in the permanent magnets of PMSM machines and is also recyclable. 0.78 kg of cobalt is due after the deduction of secondary raw material recovery for a 75 kWh traction battery of a BEV in the state of the art. Cobalt is therefore the third most critical raw material of BEV technology. Nickel is an increasingly relevant component of the cathode material composition of traction batteries and can be recycled in this application. The high copper demand for the E|ROAD infrastructure is distributed among the vehicle fleet and recycling is taken into account, leaving just under 1 kg of additional copper requirement per vehicle. Therefore, copper is only the third critical raw material for the IPTEV powertrain. Platinum is used in the catalysts of the fuel cell and is very scarce. Some substitutes are already available.
Soft coal (BCo) and natural gas (Gas) are part of the local energy mix and are identified as critical resources for IPTEV and FCEV due to the energy demand of the vehicle technologies. In vehicle operation, the state of the art FCEV obtains 108 MWh over its life cycle. With a share of 0.24 kg/kWh of soft coal in the German energy mix, it is critical with a raw material requirement of around 26 t over the vehicle life cycle compared to the available resources of 14.5×10⁷ t.
The most critical characteristic of the LCA resource demand key figure is used to calculate the LCA resource range. The ranking of the two key figures across the technologies is therefore the same. Accordingly, the resource range of the lithium limits the technologies BEV and IPTEV. For the calculated key figure, it is assumed that the existing materials are used exclusively for the production of the specific vehicles and infrastructures. However, range considerations of resources are to be understood as snapshots of a dynamically developing system with various influencing variables.
Mainly due to the large traction battery, the BEV cannot compete with the other powertrains regarding resource criticality. The IPTEV stands out as the most resource-efficient powertrain in terms of state-of-the-art technology and technological potential. The high copper requirement for infrastructure expansion is not significant due to the high recycling rate of copper in coil applications and the allocation of the total copper demand over the vehicle fleet.
With regard to the adjusted TCO, the IPTEV can also prevail. The size is made up of the loss in value of the vehicle, the infrastructure costs per vehicle and the ongoing energy costs. Over the 10-year mileage analysis, the loss in value has the highest proportion across all powertrain technologies. Energy costs and loss of value are consistently highest for the FCEV. The IPTEV has to bear the maximum infrastructure costs over all technologies, but can compensate this due to the lowest loss in value and the low energy costs compared to the other technologies.
6. Conclusions and Outlook
This paper compares the alternative powertrains BEV, IPTEV and FCEV in their application for long-distance mobility. The proposed KPI framework is applied to a passenger car in the economic area Germany. The results show that the IPTEV with an E|ROAD infrastructure offers massive ecological and economic advantages over BEV or FCEV. Although the inductive energy transfer results in additional losses compared to a conductively charged BEV, these can be compensated by the lower vehicle weight and an expected optimized system efficiency in the technological potential. Thus, the IPTEV performs better than an FCEV or a BEV in terms of both energy consumption and GHG emissions during vehicle operation. With regard to the demand for critical resources, it can be summarized that an IPTEV has lower demand for critical electrode materials due to a smaller traction battery. The high copper demand for the electrified highway infrastructure is spread over the entire vehicle fleet and the assumed infrastructure lifetime to an additional demand of less than 2 kg per vehicle. The high recycling rates of copper also play an important role here. An initial analysis of the economic effects already shows that the high costs of setting up an E|ROAD infrastructure are quickly amortized through lower vehicle and energy costs.
The basic structure of the technology comparison could be fixed to the current state of research. In future work, the following limitations are going to be addressed: As shown above, not all phases of the life cycle have yet been comprehensively included in the analysis. A GHG footprint of a powertrain technology can only be determined on the basis of the complete life cycle analysis. The TCO cost analysis must also be supplemented by further components, such as infrastructure and vehicle maintenance, repairs, etc. In general, no uncertainties have been recorded so far. Especially technological conditions such as the energy density of a traction battery cannot be predicted in detail, which is why the sensitivities to the various input conditions have to be assessed in further research. Therefore, this analysis represents a first step in the evaluation of alternative powertrain technologies under consideration of E|ROAD solutions.


