Abstract
A single energy storage technology will deliver either high power or high energy density. In high cycle applications like 48 V mild hybrid electric vehicles, lithium-ion batteries or supercapacitors have to be oversized to meet power, energy and cycle life requirements. However, a passive hybrid energy storage system is able to meet those challenges, but its performance depends on several factors. In this study, simulations and experimental investigations show how the design and operation conditions influence the performance of a passive hybridized system. In a comparative study for 48 V systems, consequences on performance are discussed.
1. Introduction
Considering the requirements of an energy storage system (ESS) for current generations of 48 V mild hybrid electric vehicle (MHEV) (Gen1: 11 kW; ~320 Wh) [1], a high power to energy (P/E) ratio and a high cycle lifetime is mandatory. Future generations (Gen3: 25 kW; 1–5 kWh) of MHEVs will require a different P/E ratio in order to enable pure electric driving within cities (FHEV = full hybrid electric vehicle) [2]. Lithium-ion batteries (LIB) in form of high-energy (HE) or high-power (HP) cells and even supercapacitors (SC) as a single system cannot satisfy all requirements in terms of P/E ratio and cycle life without oversizing and/or overstraining the system. Therefore, a hybrid energy storage system (HESS) and specifically a passive HESS is a suitable approach for pulse load profiles, which appear in MHEVs and even in FHEVs.
Passive HESS show higher efficiencies and less complexity than other HESS solutions [3]. However, their performance is mainly determined by the technology matching in terms of voltage characteristics and ohmic resistance ratio whereas new degrees of freedom arise on system level. Different LIB technologies and even more so conventional electrochemical double layer capacitors (EDLC) exhibit quite different characteristics in ohmic resistances and voltages. New capacitor technologies like Lithium-carbon capacitors (LIC) [4,5,6] arise that fill the gap in power and energy density between LIB and SC technologies and bring new flexibilities in the design of passive HESS.
This study shows by experimental and model-based investigations how the design of a passive HESS and its operation condition influence power and energy density. Advantages over battery-only ESSs are discussed in a comparative study by analyzing two virtual 48 V MHEV scenarios.
2. Fundamentals
2.1. Pulse Current Load and Operating Voltage
Factors that have an impact on the performance of a HESS within pulse load profiles have already been discussed in previous papers. Besides the setup and the capacity ratio of the LIB or the SC [6,7], also the characteristic of the pulse load profile and its impact were part of the discussion [8,9].
The character of a pulse load profile can be described by its period (T) and the pulse duration (PD), in which the load current (Iload) is active. In Figure 1a a given current versus time Iload (t) is presented schematically for two different periods (T1 and T2) as well as for two different pulse durations (PD1 and PD2). Using Equation (1) the pulse profile can be characterized by its duty cycle (D), which describes the relationship between the period T and the pulse duration PD.
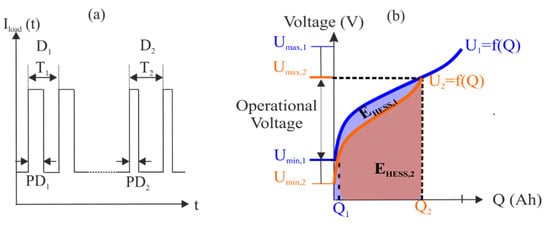
Figure 1.
(a) Schematic of pulse load profile with two different characteristics in pulse duration (PD) and period T resulting in two different duty cycles D; (b) representation of upper and lower cut-off voltages (Umax and Umin) on the operating voltage range of a passive hybrid energy storage system (HESS) and usable energy of each component.
The individual voltage limits of two hybridized energy storage technologies determine the permissible voltage operating range. The upper cut-off voltage (Umax) or the lower cut-off voltage (Umin), whichever is violated first, determines the actual operating range of the HESS. The usable energy of a HESS (EHESS, total) is limited to the difference of the available capacities Q1 and Q2, which depend on the upper (Umax) and lower cut-off voltage (Umin) of the HESS (see Figure 1b).
The usable energy of a HESS EHESS,total is the sum of the usable energies of each energy storage EHESS,1 and EHESS,2, which can be calculated by the integration of the voltage curve U1 and U2 by the capacity within the limits Q1 and Q2 (see Equation (2)).
2.2. Characterization of Energy Storage System (ESS) during Pulse Load Profiles
Energy and power density are typical dimensions to describe the characteristics of an ESS. The energy density (eESS) defines which energy can be extracted per mass (mESS) of the ESS. In [10], it is proposed to integrate time-varying voltage U (t) and load current Iload (t) only during active pulses (g = 1) and to neglect U (t) and Iload (t) during pulse off times (g = 0). To characterize the power density pESS, eESS is divided by the product of total time τ and κ, whereby κ is the fraction of τ in which the current pulse is active. The energy density eESS and the power density pESS can be calculated by Equations (3) and (4):
The P/E ratio is given in (1 h−1) and describes the ratio between power and energy density of an ESS and it is also used to specify the requirements of P/E ratio for applications. Depending on the degree of electrification of an xHEV, the P/E Ratio can hold a value of 3 h−1 until 40 h−1 [11].
3. Modeling
It is one objective of this study to derive a universal cell model (CM) for a variety of LIB and SC technologies along with a standardized parameter determination, which simplifies the design processes for HESSs. Besides commercial LIBs, such as lithium-ion phosphate (LFP) and lithium-ion cobalt oxide (LCO), conventional EDLC technologies, and two different types of LIC technologies are also investigated in this study.
There are two general concepts that use both LIB and SC materials for the electrodes, either as a serial or parallel connection. The composition of the electrodes differs between the two concepts. In serial connection, one electrode consists of battery material and the other one holds EDLC material and forms a serial hybrid capacitor (SHC). A parallel hybrid capacitor (PHC) consists of so-called bi-material electrodes which are containing EDLC and battery material [12].
3.1. Cell Model (CM)
The Thevenin model is used as the cell model which is a common method to describe the electrical behavior of LIBs [13,14]. Considering state of the art modeling of EDLCs, the Thevenin model is similar to the “classical model” for EDLCs [15] but extended by a voltage source.
The model consists of a voltage source to represent the open circuit voltage (Uocv), the ohmic resistance (Rinter) which describes the ohmic losses due to electrolyte and electrodes and one RC-circuit (with RRC and CRC) to take diffusion processes within electrochemical energy storage devices into account. The terminal voltage (Ucell) can be calculated by Equation (5), considering the dynamics of URC between two-time samples (Δt) in Equation (6).
3.2. Single Cell Characteristics and Parameter Determination
Rinter is determined by the RDC pulse method [16] in which the pulse duration PD is varied depending on the cell technology. Using Ohm’s law, Rinter can be calculated from the resulting change in voltage caused by the applied current. This procedure is performed for a state of charge (SOC) of 10% to 90% in 10% steps in discharge (DIS) direction and will be used as a look-up table within the simulation tool. For LIBs, the pulse is performed for 20 s and for all SC technologies, Rinter given in the datasheets are reached by a 2 s pulse.
The parameterization procedure of UOCV is slightly different between cell technologies. For LIB and LICPHC, UOCV is measured in a 2.5% SOC interval starting from 100% SOC and a relaxation time of 20 min, after each point interval is reached. In case of EDLC and LICSHC, UOCV is measured by a continuous 1 C charge starting at Umin until Umax. Measured parameters for modeling UOCV and Rinter characteristics are given in Figure 2. RRC and CRC are determined by using Matlab® Optimization Toolbox (The MathWorks, Inc., Natick, MA, USA) in which a nonlinear Levenberg–Marquardt algorithm is used to fit the parameters RRC and CRC in the least square sense to minimize modeled and measured error of Ucell.
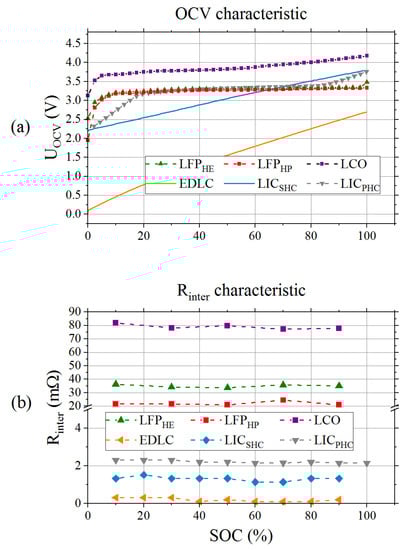
Figure 2.
Measured parameter for cells under study; (a) measured open circuit voltage (OCV) characteristics for lithium-ion batteries (LIB) and supercapacitors (SC); (b) Rinter characteristics for OCV and SC technology with RDC pulse measurement.
Besides the high-energy versions of LIBs (LFPHE and LCO), also a high-power oriented LFP cell (LFPHP) is parameterized for the virtual concept study. To analyze energy and power density, each cell is charged by a 1 C constant-current–constant-voltage (CCCV) regime until the upper cut-off voltage Umax and a cut-off current of C/20 are reached. Afterwards, each cell is discharged with a pulse load profile with a duty cycle D of 0.5 at pulse duration PD set to 10 s until the lower cut-off voltage Umin is reached. In general, power densities consider mainly maximum allowed C-Rates in DIS direction, which for most LIBs are higher than in charge (CHG) direction. One of the most crucial design constraints in ESS design of MHEVs are the high peak currents in CHG direction (~230 A for 11 kW at 48 V). Hence, for power and energy density measurement, the highest allowed C-Rates for CHG direction are applied. The experiments are performed at room temperature (approximately 25 °C), but due to the applied load, cells heated up. The maximum cell temperature has been achieved by LICPHC with approximately 36.6 °C at 150 A. The maximum temperatures for the other cells have been in a range between 25.2 °C and 33.6 °C. Measured energy and power density for all cells under study are presented in Table 1 along with further technical data.

Table 1.
Technical data of cells under study including measured energy/power densities and capacities.
3.3. From Cell Model (CM) to System Model (SM)
In a battery pack many cells are connected in a hierarchal manner by serial and/or parallel connection (xSyP) to meet the voltage, power and/or energy requirements of the application. To derive a system model (SM) from a cell model, the parameters of the cell model are scaled up according to the configuration (xSyP) to emulate the time dependent voltage and resistance characteristics of the system (see Equation (7)). The indices (LIB, SC) imply the considered technology. This method is quite accurate as long as no intrinsic cell imbalances are assumed [17]. Calmer’s rule is applied to solve Equation (7) for ILIB, and according to Kirchhoff’s current law, the current of the SC bank ISC can be calculated from the difference between ILIB and Iload given in Equation (8).
As the currents in Equations (7) and (8) are calculated on the system level, the changing SOC must be considered within the cell model. The SOC is calculated by Equation (9) in which the integral of the current I is divided by the product of the nominal capacity (CN) and the number of cells P that are connected in parallel.
An overview of the algorithm containing upscaling the cell model parameters of the used electrical circuit model (ECM) in Figure 3a along with the calculation of load distribution and a drawback to parameter dynamics is given in Figure 3b.
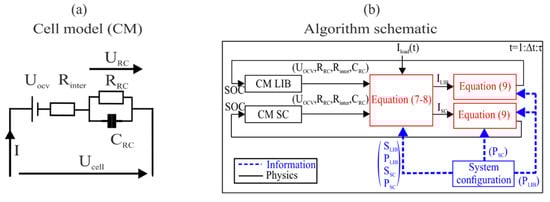
Figure 3.
Schematics of the cell model (a) and the algorithm for system modeling (b).
4. Analysis
The analysis of passive HESS is conducted by experimental and model-based approaches. Within experimental investigations, LIB and SC technologies are hybridized on cell level (C2C) and a 48 V system level (S2S). In focus are the energy and power density depending on technology matching, the system layout, and the impact of pulse load characteristics. To derive further findings of practical applicability of HESS, model-based analysis of nowadays (Gen1) and future-oriented (Gen3) MHEV applications are conducted.
4.1. Experimental Study of Energy Density and Power Density Enhancement
The determination of energy and power density of HESSs on C2C and S2S level is conducted in the same way as for the single cells (PD: 10 s; D: 0.5). Besides that, for S2S study, pulse duration PD and duty cycle D are changed according to the pulse duration and the duty cycle occurrence in application-oriented load profiles. For evaluating power density, only results, in which ILIB is not exceeding its maximum allowed C-Rate counterpart, are taken into account. For the calculation of energy and power density Equations (3) and (4) are applied, whereas for S2S analysis only the cumulated mass of the used cells is considered to calculate mESS.
4.1.1. Cell to Cell Analysis (C2C)
A Basytec HPS Battery Tester (BaSyTec GmbH, Asselfingen, Germany) is used for the C2C experiments to provide Iload (PD: 10 s; D: 0.5) and to measure the terminal voltage of the HESS UHESS. An Agilent Keysight 3872A (Agilent Technologies, Inc., Santa Clara, CA, USA) measures the voltage drop over a shunt resistance (1 mΩ) to identify ILIB and ISC. With Ohm´s law, ILIB can be determined directly. Using Equation (8), ISC can be calculated by using measurement data of ILIB and Iload with a time resolution of 1 s. As HESS, LFPHE and LCO are connected to all SC technologies under study. In the case of the EDLC, two EDLC have to be connected in serial to gain the voltage ranges of LIBs. The schematics of the test bench and data acquisition are presented in Figure 4a.
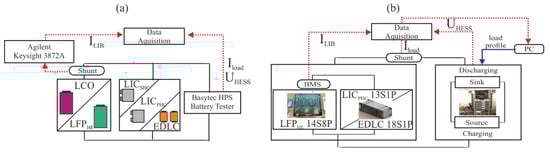
Figure 4.
(a) Setup and schematic of cell to cell analysis (C2C) campaign with data acquisition; (b) setup and schematic of system to system analysis (S2S) campaign using energy storage system (ESS) of Table 2.
4.1.2. System to System Analysis (S2S)
For investigations on a S2S level, sinks and loads are used (cumulated max. 120 A CHG/DIS), whose load profiles can be controlled by a PC. The test bench principle is presented in Figure 4b and as for the C2C investigation, a shunt resistance (1 mΩ) is used to determine Iload in a time resolution of 0.2 s. In comparison to the C2C level, a battery management system (BMS) is necessary to satisfy safety requirements of the used 48 V ESS, which is also providing data like ILIB for the evaluation and calculating ISC according to Equation (7).
In application-oriented profiles, like HEV life cycle test in Figure 5a, a variety of pulse durations and duty cycles can be found. Therefore, conspicuous peak powers, like 11 kW peak power, are investigated in terms of its pulse duration and duty cycle. For 11 kW peaks, an average pulse duration of 2 s at an average duty cycle of 0.03 occurs. Besides 2 and 10 s pulse durations, also 5 s is as pulse duration considered, hence following instructions of [1], ESS for MHEV applications should enable maximum power for 5 s.
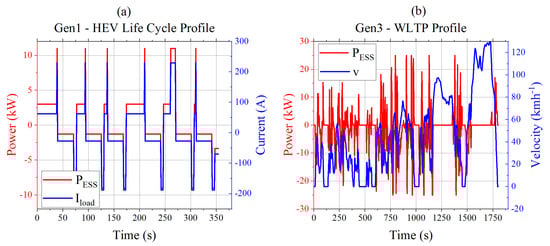
Figure 5.
Profiles of virtual concept study; (a) power and current for hybrid electric vehicles (HEV) Life Cycle Profile proposed by United States Advanced Battery Consortium (USABC) for nowadays Gen1 mild hybrid electric vehicle (MHEV); (b) velocity profile of worldwide harmonised light vehicles test procedure (WLTP) and computed ESS power to emulate future Gen3 MHEV with inner-city driving mode.
The 48 V systems of LFPHE and LICPHC are built as prototypes. For the 48 V EDLC system, a commercially available product is used. Energy and power densities are identified by the abovementioned regime and are presented in Table 2 along with measured capacities for a 1 A DIS after a 1 C CCCV CHG regime. Data acquisition, control, and analysis are accomplished using LabVIEW® (National Instruments Corporation, Austin, TX, USA). Four HEA-PSI91000-030U3 (HEIDEN electronics GmbH, Pürgen, Germany) are used as sink and four HEA-ELR91500-030 (HEIDEN electronics GmbH, Pürgen, Germany) are used as load. Data acquisition hardware components include one Q.gat_IP controller (Gantner Instruments Test & Measurement GmbH, Darmstadt, Germany), Q.bloxx_A107 (Gantner Instruments Test & Measurement GmbH, Darmstadt, Germany) with four universal analog input channels, and Q.bloxx_A127 (Gantner Instruments Test & Measurement GmbH, Darmstadt, Germany) with four voltage input channels.
Table 2.
Technical data of 48 V energy storage system (ESS) under study.
4.2. Model Validation and Virtual Concept Study
4.2.1. Model Validation
The model is validated by using the normalized-root-mean-square error (NRMSE) method. Firstly, simulated and measured voltages Ucell of the cell model during dynamic load profiles are validated. Secondly, the model accuracy in terms of ILIB, ISC and terminal voltage UHESS of each HESS within C2C campaign for a constant load followed by a pulse load profile is investigated. At last ILIB, ISC and the terminal voltage on S2S level UHESS are also validated by experiments of the S2S campaign. Calculated errors of ILIB and ISC are normalized to the range of maximum measured current in CHG and DIS of each. Voltage errors are normalized to the arithmetic mean value of measured terminal voltages UHESS or Ucell respectively. Finally, NRMSE of SC and LIB are summarized as overall model accuracy by calculating arithmetic mean errors of current and voltage for each validation campaign.
4.2.2. Virtual Concept Study for Two Mild Hybrid Electric Vehicle (MHEV) Scenarios (Gen1–Gen3)
In the virtual concept study, the performance of HESS and commercial ESS using high-power or high-energy should be compared within realistic scenarios. The first study shall represent nowadays requirements for MHEV ESS. These are start-stop, regenerative braking, and acceleration tasks. For this simulation, the load profile of Figure 5a from the United States Advanced Battery Consortium (USABC) is used. The second study represents future tasks of MHEV, which involve additionally pure electric inner city driving. Thus, the given acceleration (a) and velocity (v) profiles of the worldwide harmonised light vehicles test procedure (WLTP) are converted into a power profile (Pv) by Equation (10) and using parameters of Table 3.
Table 3.
Parameters for load profile computation for Gen3 emulation.
The Energy Management System (EMS) controls how a MHEV splits the power supply to the combustion engine (CE) and/or the ESS (see Equation (11)). Thus, a first-order approach is assumed following the regime described in Table 4 to emulate PESS which is plotted along with v in Figure 5b. The input parameter Iload (t) of the model is computed by PESS (t)/48 V.
Table 4.
Energy Management System (EMS) for mild hybrid electric vehicle (MHEV) application of Gen 3.
The model-based investigation is divided into several studies, which are comparing weight and volume of a HESS and its competitive ESS as well as the charge throughput QTP and the root mean square of the current IRMS of a single cell within a HESS and its competitive ESS.
As a unit for comparison the performance index (Θ) shall be introduced, which should emphasize the differences in dimensions (weight and volume) and also in terms of the stress of a LIB cell within both systems. Herein the relative deviation of the considered value of the hybrid system (XHESS) to the value of the battery-only system (XESS) is calculated by Equation (12). Positive values of the performance index Θ emphasis advantages of the HESS over the ESS and negative values correspond to the contrary statement.
The number of serial cells is determined by the system voltage of 48 V whereas the number of parallel cells is dictated by the maximum C-Rate for each technology and the maximum peak of Iload. In general, those LIBs are not typical representatives of commonly used LIBs in automotive applications. However, the principal objective of this study is to determine if there are possible configurations of HESS with high energy cells that can compete with high power ESS. Another objective is to determine how existing ESS can be improved by a passive hybridization and which technology match suits best.
A number of virtual HESS and ESS are set up according to the following tables. Table 5 and Table 6 are containing the setups of several HESS by using different supercapacitor technologies within the Gen1 and Gen3 scenarios for LCO and LFPHE hybrid systems, which compete with battery-only systems ESS consisting of the same LIB equivalent technology. Two types of hybrid systems are set up which focus on design criteria like weight and volume. The index HESSmin indicates hybrid systems, which are the lightest in their technology match whereas HESSv shall label systems, which have approximately the same volume as its battery-only counterpart. Table 7 contains setups of HESS systems for Gen1 and Gen3 scenarios, which are competing against energy storage systems setup of the presented LFPHP high power cell.
Table 5.
Technical data of virtual LFPHE (H)ESS concept study within Gen1 and Gen3 scenarios.
Table 6.
Technical data of virtual LCO (H)ESS concept study within Gen1 and Gen3 scenarios.
Table 7.
Technical data of virtual (H)ESS concept study within Gen1 and Gen3 scenarios versus LFPHP.
Besides the analysis of operational behavior, it shall also be part of the discussion, whether the analyzed hybrid systems meet power to energy and energy density targets of Gen1 and Gen3 applications. Therefore, requirements in terms of weight, maximum power, and energy are summarized, and energy density, as well as P/E ratio, is calculated with respect to these values. Maximum weight and power for Gen1 applications are already given in [1]. As Gen3 applications are still in development and technical guidelines like for Gen1 are missing, maximum power value is taken from industry goals [2]. As 48 V MHEV for Gen3 applications should be able to fulfill tasks of nowadays FHEV applications, target values for the maximum weight are taken from USABC goals for HEV battery [11]. The energy consumption within inner city driving is for an electric car approximately 0.17 kWhkm−1 [18], hence a range for the installed energy was chosen to allow driving distances within cities of 6 until approximately 30 km. Target specifications for Gen1 and Gen3 applications are listed in Table 8.
Table 8.
Target specification for 48 V mild hybrid electric vehicles in Gen1 and Gen3 application.
5. Results
5.1. Experimental Results
The measured load current Iload and LIB current ILIB for all C2C systems under study are presented in Figure 6 along with the measured temperature of the LIB. Generally it can be seen that during discharge pulses the battery current ILIB is in comparision to the charging phases tremendously reduced. The degree of current distribution between the LIB and the SC differs between the hybrid systems. As an example, it can be seen in Figure 6d that in the LCO-LICPHC system the LCO cell is barely stressed during pulse discharging and constant charging periods in which the LICPHC cell takes most of Iload. In comparision to that, in almost all hybrid systems using EDLC the LIB takes almost the complete load Iload during charging and approximately the half of the current load Iload during pulse discharging periods. During pulse discharging the temperature of the LIB is approx 25 °C and rises to a maximum of approx 30 °C during constant charging periods.
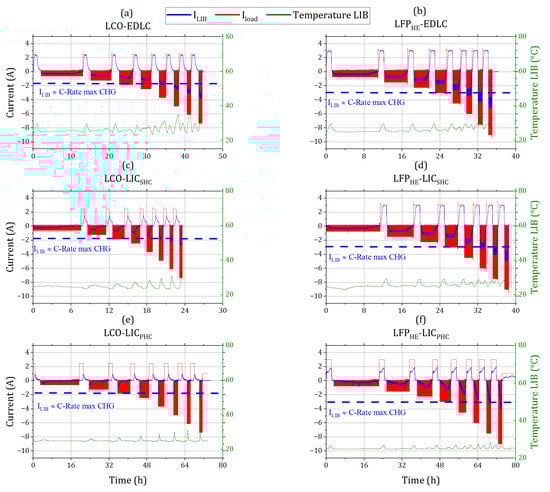
Figure 6.
Load profile Iload, LIB current ILIB and recorded LIB temperature during energy and power density characterization for hybrid systems on C2C level. The load of the supercapacitor results in the difference of ILIB and the load Iload. For the power density, only ILIB values which are not exceeding the current equivalent of the max C-Rate in higher than in charge (CHG) direction are considered.
Energy density and power density of HESS spread for a pulse duration PD of 10 s with duty cycle D of 0.5 from 9.5 up to 55.4 Whkg−1 and 9.7 to 65.8 Wkg−1 on C2C level (see Figure 7a). Highest energy and power density values are achieved by HESS existing of LFPHE and LICPHC (55.4 Whkg−1; 65.8 Wkg−1). Considering LCO HESS, using LICPHC are leading to the highest eESS for LCO HESS as well.
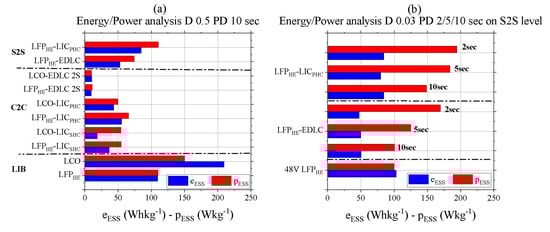
Figure 7.
(a) Energy and power density analysis for C2C and S2S campaign at PD 10 s and D of 0.5; (b) energy and power density analysis for S2S campaign at constant D of 0.03 and load pulses of 2, 5, and 10 s PD.
In the comparison of LFPHE-EDLC HESS on C2C to S2S level, it can be seen that power and energy density increase by more than a factor of 5. In the case of LFPHE-LICPHC HESS, the factor of increasing power and energy density is approximately 1.5 and with 84.5 Whkg−1 and 110 Wkg−1 highest values of energy and power density of all HESS are achieved for 10 sec pulse duration at a duty cycle of 0.5.
Changing the pulse duration PD from 10 to 2 s at a duty cycle D of 0.03, power density increases for both HESS in S2S campaign by maintaining constant energy density at the same time (see Figure 7b). Power densities at 2 s pulse duration are for LFPHE-EDLC HESS 169 Wkg−1 and for LFPHE-LICPHC HESS 194 Wkg−1, whereas for LFPHE-LICPHC HESS the difference in power density between 5 s and 2 s pulse duration is only approximately 10 Wkg−1. Compared to 48 V LFP ESS, it is an increase in power density up to a factor of 1.9 by a reduction of energy density up to 14%. Maximum temperature, which arised within the LFPHE 48 V system has been 34.8 °C at the test pulse test procedure with 10 s PD and 0.5 D regime.
5.2. Model Validation
Exemplary profiles of the validation campaign for the cell and the system model on a C2C and S2S level are given in Figure 8. The average overall accuracy of the model for each campaign, and the number of considered errors is presented in Table 9. Voltage error increases from 1.95% for the cell model CM up to 3.44% for S2S analysis. The model error of the electrical current shows a similar trend. Herein, the mean error increases from C2C analysis to S2S analysis from 6.33% to 7.42%.
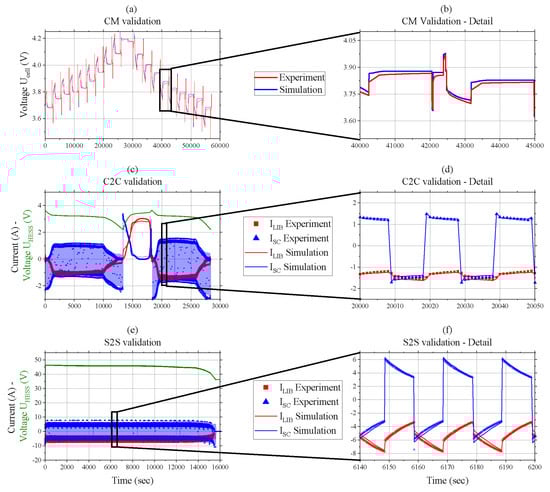
Figure 8.
Measured and simulated currents and terminal voltage profiles; (a,b) measured and simulated voltage behavior of lithium-ion cobalt oxide (LCO); (c,d) modeled and measured current profile of LFPHE-LICSHC HESS of C2C campaign along with system voltage UHESS; (e,f) modeled and measured current profile of LFPHE-EDLC hybrid of S2S campaign along with measured terminal voltage UHESS.
Table 9.
Average overall model accuracy for cell model (CM), cell to cell analysis (C2C), and system to system analysis (S2S) analysis given as normalized-root-mean-square error (NRMSE).
5.3. Results of the Virtual Concept Study
The analysis of the performance index Θ within the Gen1 scenario is presented in Figure 9, whereas Figure 9a,b is presenting LFPHE and LCO hybrid systems with minimized system dimensions (HESSmin), and Figure 9c,d is showing the results of the performance index for systems that have approximately the same volume (HESSv) as their competitor battery-only system. It is shown in Figure 9a,b that by using LIC technology a reduction of up to 60% in weight and volume is possible for both LIB technologies under study. However, the single cell stress within the LIB bank is up to 60% higher than in the competitive battery-only system. An exception is hybrid systems using the parallel LIC technology. Herein, approximately same stress levels are achieved as in the battery-only system.
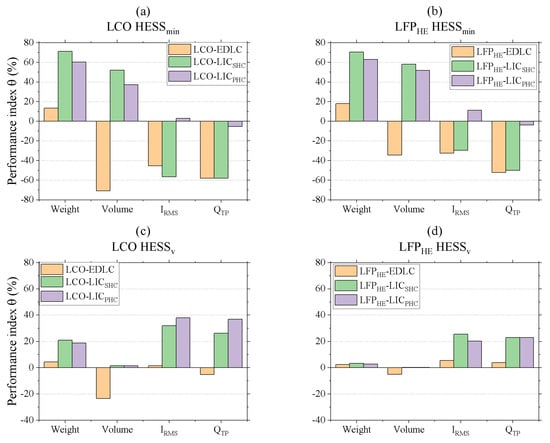
Figure 9.
Performance index comparison of hybrid systems using different LB and SC technologies and design criteria for Gen1 applications versus battery-only systems using same LIB technology; (a,b) performance index of lightest hybrid systems; (c,d) performance index of volume equivalent hybrid systems.
The hybrid systems using LCO as LIB bank are slightly more stressed than hybrid systems using LFPHE. Using the classical EDLC technology for a hybrid system leads to a reduction in weight but the required volume is up 70% higher (in case of LCO-EDLC) than for its counterpart. Increasing the hybrid system to the approximately same volume as its battery-only counterpart leads generally to a reduction of the single cell stress within the LIB bank.
The highest reductions are achieved for LCO-LICSHC and LCO-LICPHC hybrid systems with more than 30% in charge throughput QTP and current stress IRMS. In the case of the LFPHE hybrid systems, using the serial or even the parallel LIC, a reduction of up to 20% is possible. A hybrid system made up of EDLCs with approximately the same volume of its battery counterpart and without overstraining the LIB-bank is only possible by using LFPHE.
Figure 10 presents the results of the Gen3 scenario analysis. Moreover, here a tremendous reduction of the system dimensions in weight and volume can be achieved compared to the battery-only system. In Figure 10a,b it can be seen that LFPHE hybrid systems and LCO hybrid systems achieve a weight and volume reduction from 20% up to 60% depending on the used supercapacitor technology.
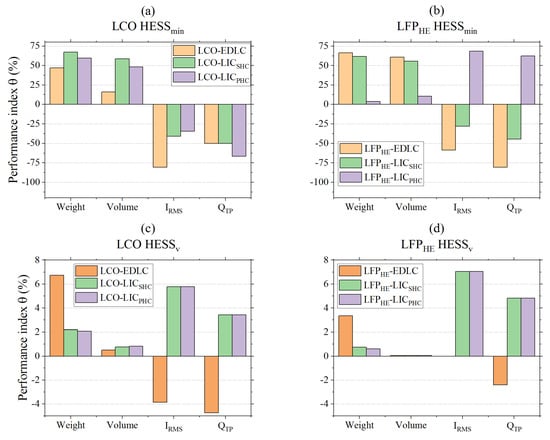
Figure 10.
Performance index comparison of hybrid systems using different LIB and SC technologies and design criteria for Gen3 applications versus battery-only systems with same LIB technology; (a,b) performance index of lightest hybrid systems; (c,d) performance index of volume equivalent hybrid systems.
Moreover, here the small system size leads to an increase in single cell stress compared to the battery-only system. The current is for all hybrid systems between 30% and 80% higher than their battery-only counterpart. The charge throughput QTP within the LCO hybrid systems is 50% to 70% higher than in the LCO battery systems and is quite similar for the LCO-EDLC and LCO-LICSHC hybrid. Within the LFPHE hybrid systems, the single cells get approximately up to more than 100% stressed than in the LFPHE battery system.
Moreover, the Gen3 scenario hybrid systems with approximately the same volume as their battery-only counterpart tend to a reduction of charge throughput QTP and root mean square current IRMS. In the case of the LCO hybrids, the single cells within the LCO bank are exposed to the same charge throughput as in the LCO battery system. Simultaneously the root mean square current IRMS is reduced up to 6% using serial or even parallel LIC. In case of using EDLC, the root mean square current is for a cell within the LCO bank 4% higher than in the LCO battery system.
The LFPHE hybrid systems tend to similar results as LCO hybrid systems within this scenario. The only differences are that besides the root mean square current, also the charge throughput QTP is reduced up to 4% by using LIC. Using EDLC leads to an increased charge throughput of 2%.
The results of the comparison of hybrid systems using high energy cells versus high power systems within Gen1 applications are presented in Figure 11a. Generally, the single cell stress is in both hybrid systems reduced up to 60% less than in the competitive LFPHP system, but only the LCO-LICSHC hybrid meets the requirements to not exceed the system dimension of the LFPHP system.
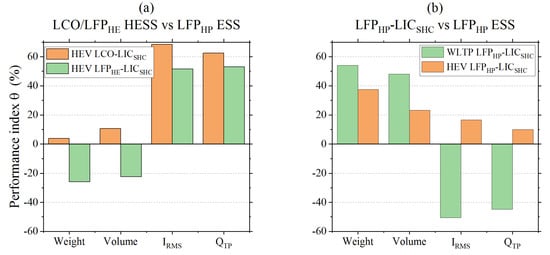
Figure 11.
(a) Performance index for hybrid systems using high energy cells versus battery-only systems with LFPHP high power cells within Gen1 application; (b) comparison of hybrid systems using LFPHP-LICSHC setup versus battery-only LFPHP system within Gen1 and Gen3 application.
Figure 11a shows the performance index of a LFPHP-LICSHC hybrid system within Gen1 and Gen3 applications versus a LFPHP system. Moreover, here it can be seen that even for Gen1 and Gen3, a reduction of the system dimension is possible. Depending on the scenario, weight and volume are reduced between 20% and 50%. In Gen1, the single cell stress is reduced up to 20% whereas for Gen3 scenario the single battery cell is up to 50% more strained than in the competitive LFPHP system.
Finally, the hybrid systems and the battery-only systems shall be classified concerning their gravimetric energy density P/E ratio. The results are given in Figure 12, which also highlights the target areas for Gen1 and Gen3 values.
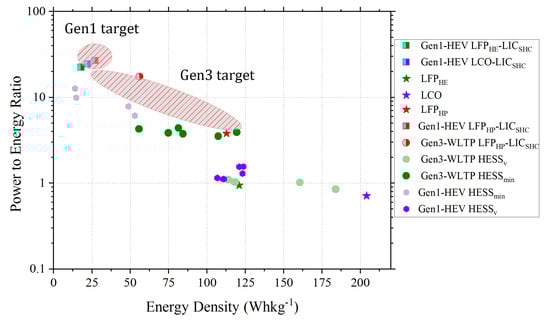
At first sight, hybrid systems, which are designed to achieve the same volume (HESSv) as their battery-only counterpart, diverge to areas where their battery-only counterpart is located. Those systems achieve approximately the same P/E ratio as the LIB technology that is used, but simultaneously, a lack in energy density compared to its single LIB-ion technology occurs. In case of using LCO as LIB bank, the energy density is up to 40% reduced compared to the corresponding LCO battery-only system. Considering LFPHE battery-only and HESS systems, energy density is less than 10% reduced.
However, minimized hybrid systems (HESSmin) are lifting the P/E ratio of the single LIB technology into the desired target areas. The high energy cells of this study LFPHE and LCO are able to fulfill partially Gen1 conditions concerning P/E ratio and energy density by a passive hybridization with a serial LIC. Furthermore, it should be emphasized that hybrid systems using LFPHP-LICSHC fulfill the target areas of Gen1 and Gen3 applications.
6. Discussion
Experimental and model-based investigations have shown that passive HESS can be a suitable approach for present and future generations of MHEV. However, several factors that influence the performance of a HESS have to be considered. The experimental campaign highlighted the influence of the HESS setup on its performance. Besides the influence of technology matching on cell level, improvements in power and energy density of the same composition up to a factor 5 on system level are possible. Furthermore, the characteristic of the pulse load profile influences the performance of a HESS. Shorter pulse lengths are leading to higher power densities. In general, a hybridization of LIB with LIC technologies leads to better performances than the other HESS. In comparison to HESS using EDLC, the energy density is improved by similar voltage levels of LIB and LIC combined with an improved energy density of LIC over EDLC. Power density is improved, hence LIC are able, due to their higher amount of energy density, to get charged/discharged for a longer period of time until the LIB has to take most part of the load. With this, higher current loads are possible without overstraining the LIB.
Within the experiment the best performance is shown by the 48 V LFPHE-LICPHC HESS. In comparison to the LFP battery-only system, an increase in power density up to a factor of 1.9 can be achieved. This comes with the drawback of a loss in energy density by 14%.
The model-based campaign has proven that the used approach of a universal model for the different technologies is quite accurate on cell and system level. It is clear that the model error increases from cell to system level as the number of external factors increase due to the increased complexity from ESS to a single cell. Still, the maximum error of 7% within eight different HESS setups using five different technologies is quite satisfying when taken the high dynamics in current and voltage into account that exist within a passive HESS under pulse current load. Moreover, most model errors arise in low SOC area (<10%) in which high voltage dynamics occur.
The virtual concept study shows for both scenarios that the HESS approach is quite suitable for MHEV applications. The system dimensions can be minimized up to 60% and even HESS using high-energy cells can compete with high power systems in Gen1 applications. Nevertheless, the system layout and technology matching have an extreme influence on the P/E ratio and energy density. A hybridization can shift P/E ratio and energy density values into areas which are suitable for desired applications which cannot be met by a technology on its own.
It has been shown that HESS with approximately the same dimensions as its LIB counterpart have also a quite similar P/E and energy density characteristics but less battery stress, whereas minimized HESS have to endure higher battery stress, which is still within data sheet limitations. Impacts on aging shall be analyzed in future studies along with standardized layout criteria for optimal HESS design.
7. Conclusions
In this work, passive hybrid energy storage systems were investigated on cell and system level for different lithium-ion and supercapacitor technologies within pulse load applications. The hybrid energy storage system performance was influenced by the technology match and also by the characteristics of the pulse profile. In addition, a universal model and its parameterization for lithium-ion and supercapacitor technologies were presented and its validity on cell and system modeling was proven. A virtual concept study for two generations of mild hybrid electric vehicles was shown. In general, passive hybrid energy storage systems show a better power to energy ratio along with less necessary weight and volume than competitive battery-only energy storage systems, especially in high dynamic profiles. For pure electric driving scenarios, passive hybrid energy storage systems still show a better power to energy ratio, but lithium-ion batteries have to endure a higher charge throughput than their competitive battery-only energy storage systems. Impacts on aging behavior shall be part of further studies as well as a proposal of a design process for hybrid energy storage systems.
Author Contributions
Conceptualization, methodology, software, formal analysis, investigation, writing—original draft preparation, T.G.; writing—review and editing, supervision, M.D.
Funding
This research received no external funding.
Acknowledgments
The authors thank Anna Smith and her research group from Institute for Applied Materials at Karlsruhe Institute of Technology for supplying cell data and also the necessary test environment and equipment. We also would like to thank Manuel Baena and Alexis Kalk from Institute of Electrical Engineering at Karlsruhe Institute of Technology for their support in developing and assembling the 48 V prototypes and their BMS.
Conflicts of Interest
The authors declare no conflict of interest.
References
- The Idaho National Laboratory. U.S. Department of Energy Vehicle Technologies Program Battery Test Manual for 48 Volt Mild Hybrid Electric Vehicles. 2017. Available online: https://inldigitallibrary.inl.gov/sites/sti/sti/7364006.pdf (accessed on 5 June 2019).
- Degenhart, E. Powertrain Review Powertrain Strategy 2020 +. Available online: https://www.continental-corporation.com/resource/blob/33902/50729be3c974864761524b7de1a8f625/2017-04-25-presentatione-powertrain-strategy-data.pdf (accessed on 10 October 2018).
- Chuan, Y.; Mi, C.; Zhang, M. Comparative study of a passive hybrid energy storage system using lithium ion battery and ultracapacitor. World Electr. Veh. J. 2012, 5, 83–90. [Google Scholar] [CrossRef]
- Naoi, K.; Ishimoto, S.; Miyamoto, J.; Naoi, W. Second generation ‘nanohybrid supercapacitor’: Evolution of capacitive energy storage devices. Energy Environ. Sci. 2012, 5, 9363–9373. [Google Scholar] [CrossRef]
- Dubal, D.P.; Ayyad, O.; Ruiz, V.; Gómez-Romero, P. Hybrid energy storage: The merging of battery and supercapacitor chemistries. Chem. Soc. Rev. 2015, 44, 1777–1790. [Google Scholar] [CrossRef] [PubMed]
- Cericola, D.; Kötz, R. Hybridization of rechargeable batteries and electrochemical capacitors: Principles and limits. Electrochim. Acta 2012, 72, 1–17. [Google Scholar] [CrossRef]
- Cericola, D.; Ruch, P.W.; Kötz, R.; Novák, P.; Wokaun, A. Simulation of a supercapacitor/Li-ion battery hybrid for pulsed applications. J. Power Sources 2010, 195, 2731–2736. [Google Scholar] [CrossRef]
- Kuperman, A.; Aharon, I. Battery-ultracapacitor hybrids for pulsed current loads: A review. Renew. Sustain. Energy Rev. 2011, 15, 981–992. [Google Scholar] [CrossRef]
- Dougal, R.A.; Liu, S.; White, R.E. Power and life extension of battery-ultracapacitor hybrids. IEEE Trans. Components Packag. Technol. 2002, 25, 120–131. [Google Scholar] [CrossRef]
- Holland, C.E.; Weidner, J.W.; Dougal, R.A.; White, R.E. Experimental characterization of hybrid power systems under pulse current loads. J. Power Sources 2002, 109, 32–37. [Google Scholar] [CrossRef]
- Warner, J. The Handbook of Lithium-Ion Battery Pack Design; Elsevier Science: Amsterdam, The Netherlands, 2015. [Google Scholar]
- Budde-Meiwes, H.; Drillkens, J.; Lunz, B.; Muennix, J.; Rothgang, S.; Kowal, J.; Sauer, D.U. A review of current automotive battery technology and future prospects. Proc. Inst. Mech. Eng. Part D J. Automob. Eng. 2013, 227, 761–776. [Google Scholar] [CrossRef]
- Mousavi, G.S.M.; Nikdel, M. Various battery models for various simulation studies and applications. Renew. Sustain. Energy Rev. 2014, 32, 477–485. [Google Scholar] [CrossRef]
- Seaman, A.; Dao, T.S.; McPhee, J. A survey of mathematics-based equivalent-circuit and electrochemical battery models for hybrid and electric vehicle simulation. J. Power Sources 2014, 256, 410–423. [Google Scholar] [CrossRef]
- Zhang, L.; Wang, Z.; Hu, X.; Sun, F.; Dorrell, D.G. A comparative study of equivalent circuit models of ultracapacitors for electric vehicles. J. Power Sources 2015, 274, 899–906. [Google Scholar] [CrossRef]
- Schweiger, H.-G.; Obeidi, O.; Komesker, O.; Raschke, A.; Schiemann, M.; Zehner, C.; Gehnen, M.; Keller, M.; Birke, P. Comparison of several methods for determining the internal resistance of lithium ion cells. Sensors (Basel) 2010, 10, 5604–5625. [Google Scholar] [CrossRef] [PubMed]
- Dubarry, M.; Vuillaume, N.; Liaw, B.Y. From single cell model to battery pack simulation for Li-ion batteries. J. Power Sources 2009, 186, 500–507. [Google Scholar] [CrossRef]
- Wu, X.; Freese, D.; Cabrera, A.; Kitch, W.A. Electric vehicles energy consumption measurement and estimation. Transp. Res. Part. D Transp. Environ. 2015, 34, 52–67. [Google Scholar] [CrossRef]
© 2019 by the authors. Licensee MDPI, Basel, Switzerland. This article is an open access article distributed under the terms and conditions of the Creative Commons Attribution (CC BY) license (http://creativecommons.org/licenses/by/4.0/).