Article

The Effect of Reducing Electric Car Purchase Incentives in the European Union †

by
Jonatan J. Gómez Vilchez
* and
Christian Thiel
European Commission, Joint Research Centre (JRC), 21027 Ispra, Italy
*
Author to whom correspondence should be addressed.
This paper is an adaptation of the paper presented at the 32nd International Electric Vehicles Symposium and Exhibition, Lyon, France 19–22 May 2019.
World Electr. Veh. J. 2019, 10(4), 64; https://doi.org/10.3390/wevj10040064
Submission received: 12 September 2019 / Revised: 9 October 2019 / Accepted: 10 October 2019 / Published: 16 October 2019

Abstract

:
The importance of electric car purchase incentives is starting to be questioned. The objective of this paper is to explore the potential effect of reducing or removing electric car purchase public subsidies in the European Union. To this end, the system dynamics Powertrain Technology Transition Market Agent Model is used. The size and timing of purchase incentives for this technology in European countries are investigated under eight scenarios and sensitivity analysis performed. The simulations suggest that, in the short-run, the electric car market share is higher when the subsidies remain in place. In the medium-run, a purchase subsidy scheme granting €3000 for plug-in hybrid electric cars and €4000 for battery electric cars over the period 2020–2024 yields the fastest electric car market uptake of all the scenarios considered. We conclude that, though the current evolution of the battery price is favorable, electric car purchase subsidies remain an effective policy measure to support electro-mobility in the next years.

1. Introduction

Over 3 million electric cars were circulating on the world’s roads by the end of 2017, of which ca. 22% were in the European Union (EU28) [1,2]. The trend of this powertrain technology in the major car markets is upwards. This is leading to a reduction in the demand for oil-based fuels, lower tank-to-wheel CO2 emissions and air pollution as well as to an increase in demand for automotive lithium-ion batteries and electricity.
In the EU, three major drivers for growth in electric car registrations are the CO2 regulation for cars [3,4], deployment of recharging infrastructure [5] and financial or other incentives [6]. Financial incentives generally comprise registration and circulation tax reductions or exceptions as well as purchase subsidies for new electric cars. Two examples illustrate how important this policy measure is for the electric car market.
Figure 1 shows the dynamic behavior of electric cars sales in Denmark and of plug-in hybrid electric cars sales in the Netherlands between 2014 and 2018. The area shaded in grey represents the authorities’ decision to either reduce or remove financial incentives targeting these powertrains. In the case of Denmark, the area reflects the government’s decision to remove the registration tax exemption for electric cars. These cars paid 20% of the full registration tax in 2016 and 40% in 2017 [7]. As can be seen, electric car (both battery electric vehicles (BEVs) and plug-in hybrid electric vehicles (PHEVs)) sales significantly decreased, after a period of growth, once electric car buyers faced the reality of having to pay for part of the registration tax. Interestingly, the market reaction was less strong when the tax climbed up from 20% to 40% in 2017 than when it went up from 0% to 20% in 2016. The concept of ‘Torschlusspanik’ or ‘door-shut-panic’ [8] perhaps explains this. Between 2017 and 2018, electric car sales are on a recovery pathway. It remains to be seen whether this can be attributed to the prospect of a re-introduction of tax incentives [9].
With regards to the Netherlands, annual sales of PHEVs reached a peak in 2015, with over 40,000 registrations [2]. Later, following the introduction of a special ‘belasting van personenauto’s en motorrijwielen’ (BPM) tax for this powertrain in January 2017 after years of exemptions [7], this market basically collapsed (see also Figure 1 and the thorough analysis provided by [10]).
Table 1 shows the level of purchase subsidies offered for the acquisition of new electric cars in selected EU countries over the period 2013–2018. Though no purchase subsidies were available to Danish and Dutch car buyers during this period, car registration and circulation taxes in these countries are high, particularly when compared to other EU Member States [11]. Thus the aforementioned registration and circulation tax reductions and exemptions for electric cars in these countries could be interpreted as equivalent to purchase subsidies.
In this paper, we focus on purchase subsidies in the car market. It can be argued that, for the modeling purpose of quantifying economic benefits for consumers, registration, circulation and purchase incentives can be perceived by prospective buyers as fundamentally the same, provided that the amount of benefit accrued remains at the same level. In the context of a growing number of electric vehicles being deployed worldwide and decreasing battery prices [12], the importance of electric car purchase incentives is starting to be questioned. This paper contributes to the discussion by quantifying through simulation changes in the structure of electric car purchase incentives in the EU. Given the experiences of the Danish and Dutch markets, the size and timing of incentives for this technology in EU countries are investigated. The objective of this work is to explore the potential effect of reducing or removing electric car purchase subsidies on future annual electric car sales in the EU. In total, eight purchase incentive scenarios are constructed. As a result, the effect of these policy measures on the market evolution of BEVs and PHEVs until 2025 is simulated.
The structure of this paper is as follows: after the introduction, Section 2 describes the developed model; Section 3 shows the key assumptions and scenarios constructed; the model-based results and sensitivity analysis are reported in Section 4; in Section 5 conclusions are drawn and the limitations of the modeling exercise highlighted.

2. Simulation Model

The powertrain technology transition market agent model (PTTMAM) was used to analyze the effect of altering purchase incentives. PTTMAM is a simulation model that helps understand policy options and market trends with a particular focus on electro-mobility. The model covers the EU light-duty vehicle road transport sector up to 2050. The model’s system of equations was solved via numerical integration. The type of integration chosen for this analysis was Euler and the time step was 0.25.
PTTMAM is grounded in system dynamics, the modeling approach developed by Jay W. Forrester that emphasizes a system’s feedback structure and its resulting dynamic behavior [13,14]. PTTMAM captures the interactions of four major stakeholders in the system: users, manufacturers, authorities and infrastructure providers. In the model, each of these market agents acts based on their own decision rules:
  • Users evaluate, respond to respond to marketing and policies, purchase, use and dispose vehicles;
  • Manufacturers invest in capacity and research and development (R&D), produce and price vehicles;
  • Infrastructure providers invest, build, operate and decommission refueling/recharging stations;
  • Authorities introduce policy measures, monitoring policy and regulation.
Figure 2 provides a high-level overview of the major modules of the model as well as through which main variables they are linked. PTTMAM is a large model and is documented in [15]. According to this source, the model “contains over 1500 separate parameters. This leads to around 700,000 once subscripts are accounted for, with over 1000 data input points” (p. 14). Therefore, it is not possible for reasons of space to explain each module in detail here. PTTMAM is freely available at [16] and further details can also be found in [17,18].
Of particular interest to this work is the ‘User cost’ module. As can be seen in Figure 2, total cost of ownership values generated in this module affect powertrain utility and, in turn, market shares. The market share of each powertrain is determined by combined utility, expressed in Equation (1) (see [15]):
Combined utilityc,u,p,s = ∑g ((∑a (attribute valuec,p,s,a ∗ attribute importancec,a,g,u) ∗ WtCc,g,p ∗ financial attractivenessc,u,p,s) ∗ demographic breakdownc,g),
where: a = age; c = country; g = geography (urban, non-urban); p = powertrain; s = vehicle size; u = user type (private, fleet, public) and WtC = willingness-to-consider.
The term ‘financial attractiveness’ captures monetary variables such as the vehicle price and running costs: fixed (e.g., depreciation) and variable (e.g., fuel costs). As can be seen from the equation, other terms reflect non-monetary concepts. Further details on ‘willingness to consider’ (WtC) and attributes, which comprise environment, performance, reliability, safety, convenience, popularity and choice of vehicle models, can be found in [15]. Furthermore, the impact of purchase subsidies is represented in PTTMAM by the concept of ‘demand kick’, which can affect the derived market shares (for details, see [10,19]). Thus as can be seen, both monetary and non-monetary factors (an example is provided in Section 3.1.3) impact powertrain choice in PTTMAM.
When a purchase subsidy for electric cars is introduced in the model (see the ‘financial incentives’ arrow connecting the ‘Taxes, subsidies, penalties’ and ‘Powertrain utility’ modules), it reduces the vehicle price, which increases the powertrain relative financial attractiveness. Moreover, monetary incentives help early adopters to buy an electric car. This occurs in PTTMAM via the demand kick (see [10]). The vehicle price also contributes to the effectiveness of marketing and in turn to social exposure, which influences WtC. Since this study centers on the vehicle price, two of the factors that influence this variable are described in the next section.

3. Assumptions and Scenarios

3.1. Main Model Assumptions

As indicated in the previous section, it was not possible to describe in this paper all the model assumptions. Nonetheless, the key ones (for their relevance to the model results reported in Section 4) will be outlined in the next sub-sections.

3.1.1. CO2 Emission Standards

In the model, CO2 emissions performance standards affect the uptake of zero emission vehicles through forecasted emission penalties that manufacturers try to avoid by investing in R&D with the view of reducing the cost of key zero emission vehicle components and making these vehicles more attractive. In case emission penalties apply for high emission powertrains, a premium on the vehicle price for such technologies alters the utility ratio and makes again zero emission cars more attractive (relative to conventional cars). Due to this, the regulation on CO2 targets is an important policy input. In this work, the following values (see Table 2) hold throughout the modeling exercise.

3.1.2. Battery Price

Equation (2) shows the formulation of the learning curve that affects the cost and price evolution of the battery:
Costbattery = Base costbattery ∗ (cumulative manufacturebattery/minimum production)log2(1−ε),
where ε = 0.1 (i.e., 10% fractional reduction for batteries).
The simulated behavior of the battery price in PTTMAM (assuming on average a 40 kWh battery capacity) can be seen in Figure 3, compared to historical data and trajectories. Since the values reported by [20,21,22] reflect cost, a 10% mark-up is assumed to derive the battery price. For those sources reporting values in dollars, an exchange rate equal to 1.2 dollars/euro was applied.
As can be seen, the simulated battery price tended to be slightly higher than historical data suggests and the Strategic Energy Technology Plan ambitions for 2022 (see Table b in [22]) and lower than the 2025 price trajectory of 110 €/kWh estimated by [21] under their ‘moderate’ and ‘high’ scenarios. By 2040, battery prices are assumed to reach ca. 50 €/kWh.

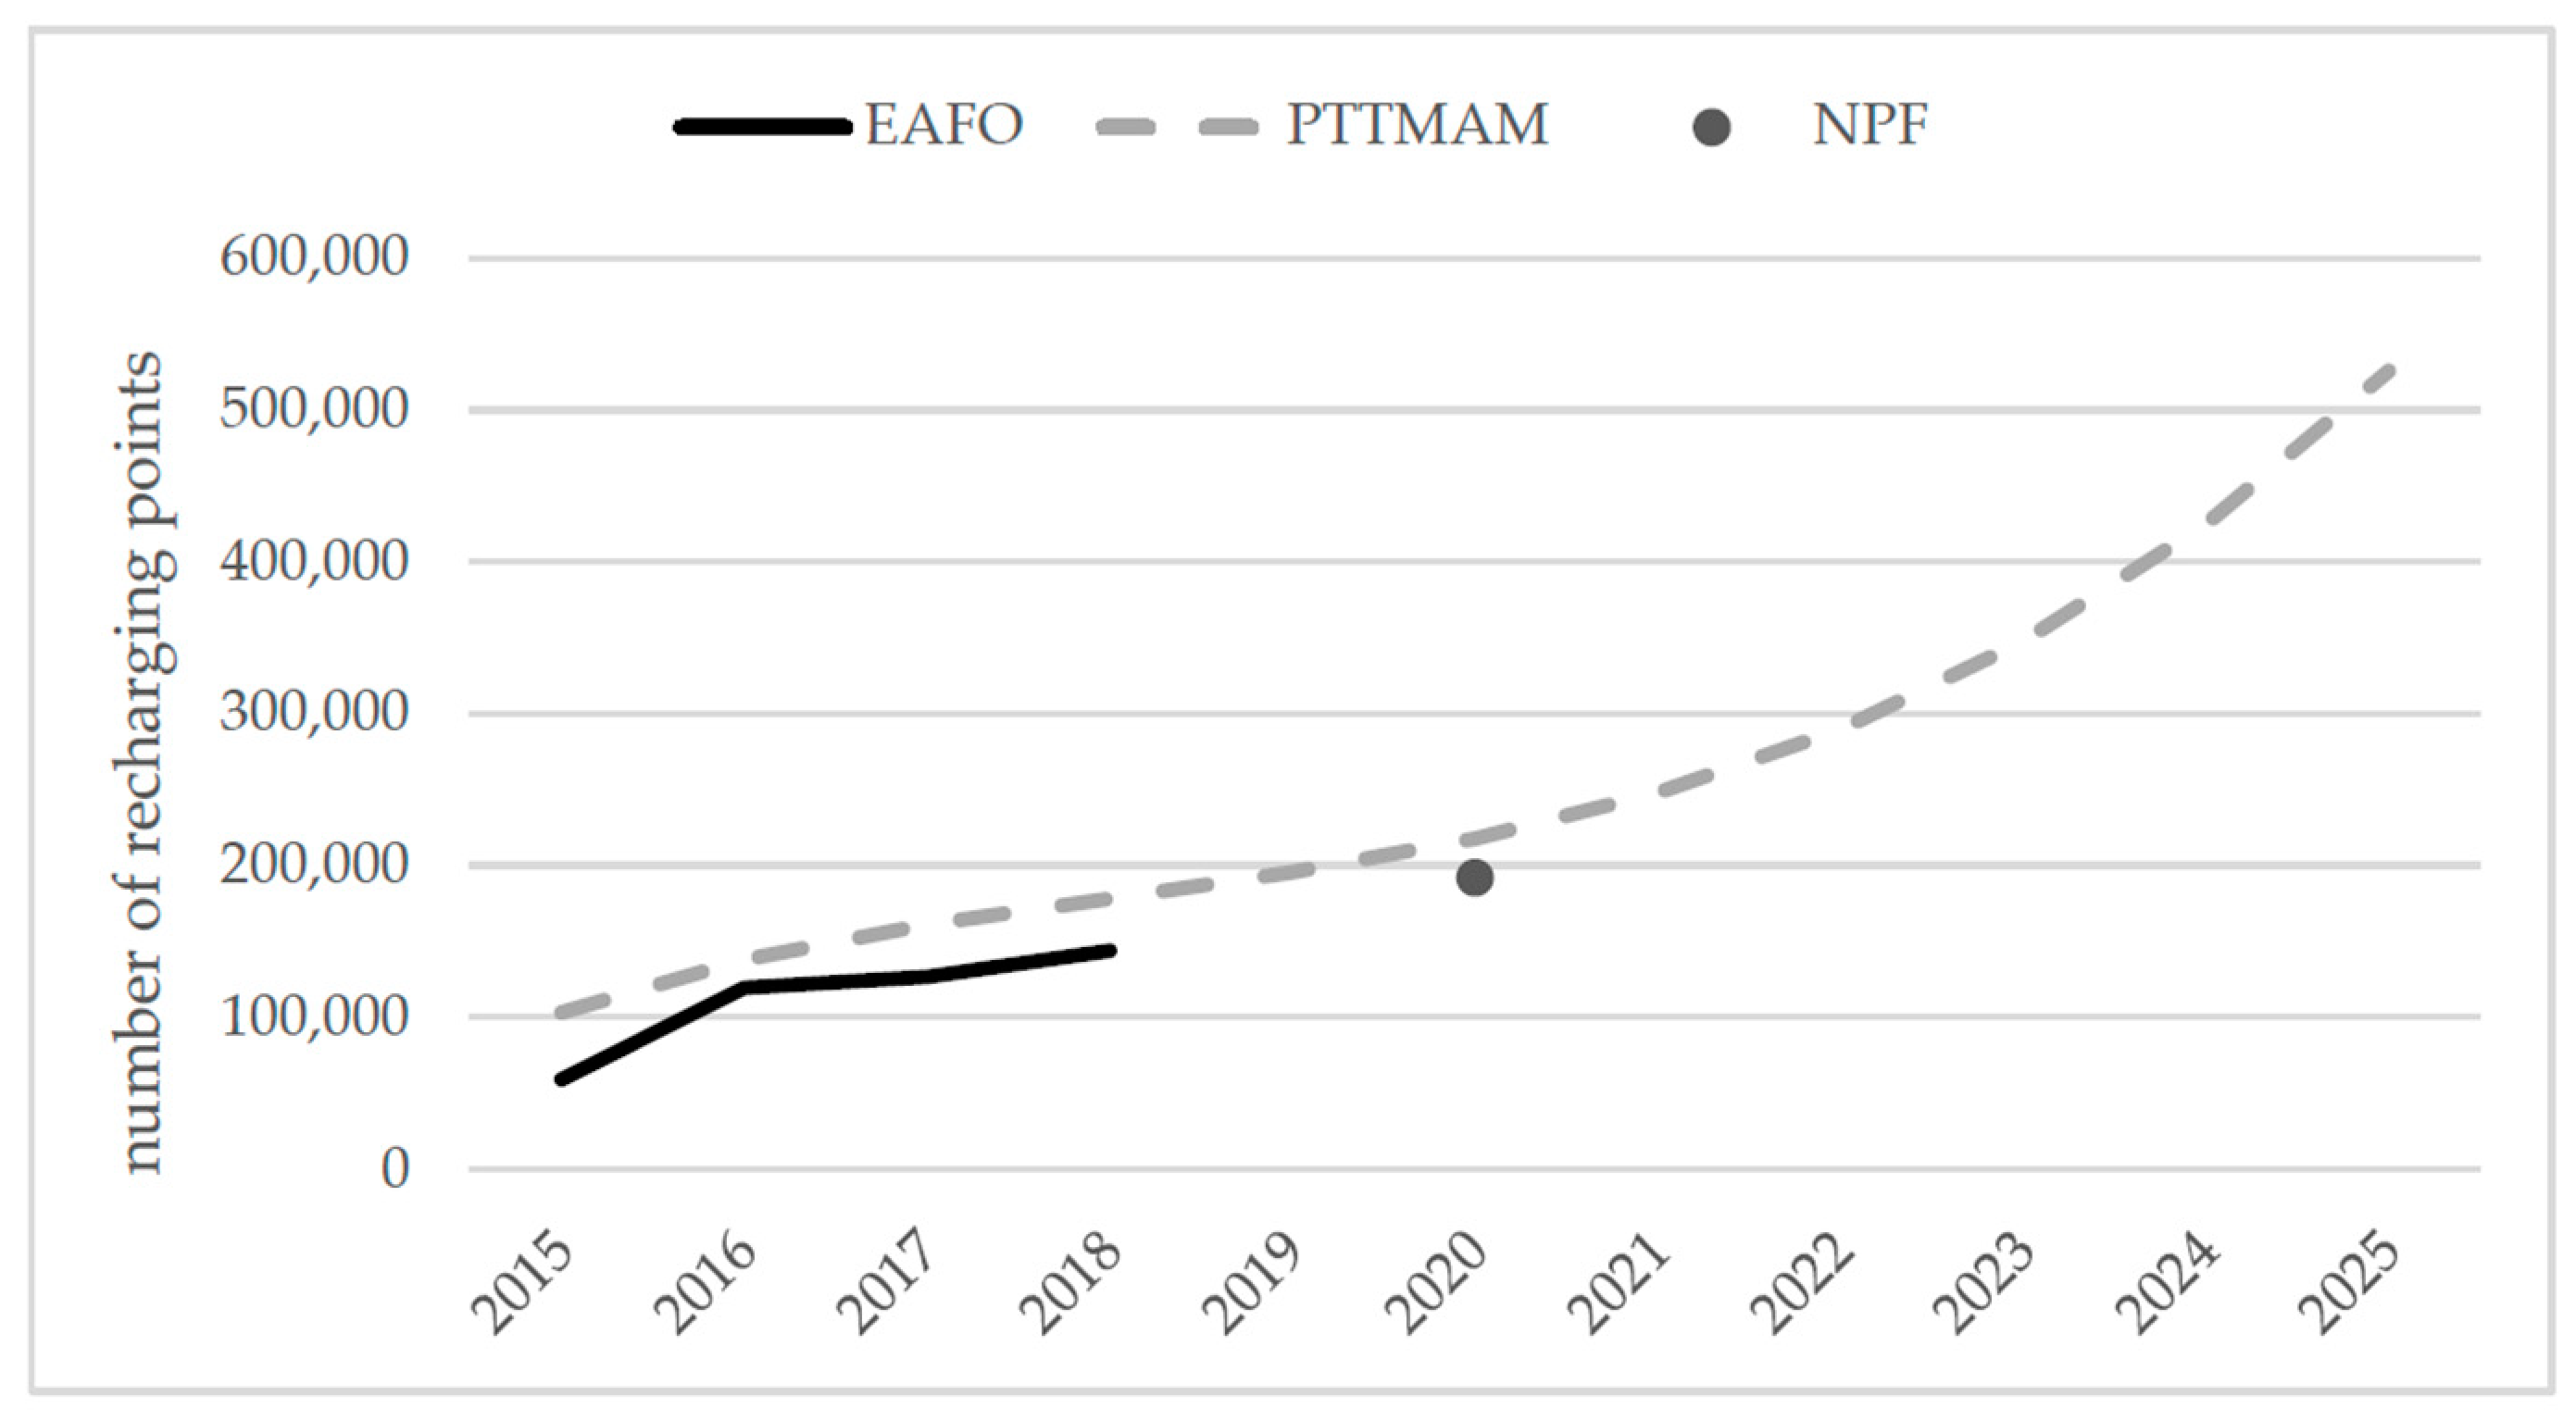
3.1.3. Public Recharging Infrastructure Deployment

Despite the main focus of the paper being on economic incentives, recharging infrastructure deployment continues to be considered an important factor shaping the electro-mobility market. In PTTMAM, recharging infrastructure affects combined utility via WtC and the convenience attribute (recall Equation (1)). Figure 4 shows the simulated evolution of public recharging points in the EU28 until 2025, compared to both historical data and Member States plans for 2020. The latter is based on the assessment of the national policy frameworks (NPFs) notified to the European Commission and reported in [23] (since Spain and Sweden did not communicate targets and the Dutch target is deemed to be low vis-à-vis the current situation, the 2018 values from [2] were assumed for these countries). By 2025, the total (normal and fast) number of public recharging points simulated in the EU28 by 2025 reached half a million, of which the vast majority corresponded to normal recharging points. As a reference, 115,729 petrol stations were in operation in the EU in 2016 [24]. Assuming that the average service stations operates six petrol fuel dispensers, that figure would still be below the number of petrol refueling points available in the EU.

3.2. Construction of Purchase Incentive Scenarios

The scenarios investigated in this paper were constructed by considering different values (size and timing) of electric car purchase subsidies in the EU. We considered two periods of analysis: short-term (2019–2020) and medium-term (2020–2025). For the former, the model variable ‘authorities vehicle subsidy proportion’ was utilized. This variable, expressed percentage terms, reflects the proportion of the price differential between the electric car and the conventional car. A size of 10% means that 10% of that price differential was covered by the subsidy. Below Table 3 shows the combination of values adopted, leading to six different scenarios. Whereas the subsidy was in place in both 2019 and 2020 in S1–S3, it was removed in 2020 in S4–S6. The level of subsidy varied by type of electric car, car size, year and country (e.g., the average EU value in 2019 for a medium-sized petrol PHEV was €900 under S1 and €2700 under S3).
Concerning the medium-run, purchase subsidies amounting to €3000 for PHEVs and €4000 for BEVs were introduced in 2020 and ambitiously sustained until the end of 2024 under a seventh scenario (S7). Given the expectation that the cost parity between internal combustion engine and electric vehicles would be achieved within this period, the rationale for simulating such a long-lasting subsidy derives from the possible need to continue to nudge car buyers for a while, so that the disutility resulting from non-cost market barriers (e.g., longer recharging time) could be offset.
In addition, an eighth scenario (S0), which captured a market situation in which there were no purchase subsidies, was simulated. The results are shown in the next section.

4. Model-Based Results

4.1. Data Fit at the Country Level

Though PTTMAM is an exploratory rather than a predictive tool and the focus of this paper was on the EU, it was appropriate to gauge the validity of the model results at the country level. For this purpose, the model fit to historical data (2012–2018) for the two Member States examined in Section 1 is shown in Figure 5. As can be seen, PTTMAM provided a reasonable fit for both countries in 2012 and 2018. For Denmark (DK), the simulated behavior of annual electric car sales was higher than the evidence suggests but captured the 2015 peak in sales. In the case of the Netherlands (NL), the model was capable of generating only a drastically softened version of the ‘peak and valley’ behavior displayed by the historical series (particularly for 2015) and missed the 2017 low point. For a detailed modeling exercise replicating the Dutch electric car market with PTTMAM, see [19].
It is worth stressing that attempts at validating the model by (over-)emphasizing the empirical fit may be misleading, for the market is expected to be subjected to radical alterations over the next years. For instance, it has been suggested by [25] that the embryonic state of the alternative fuel vehicle market renders the calibration of these types of simulation models to historical data challenging. This caveat notwithstanding, the results of the different scenarios are shown in the next section.

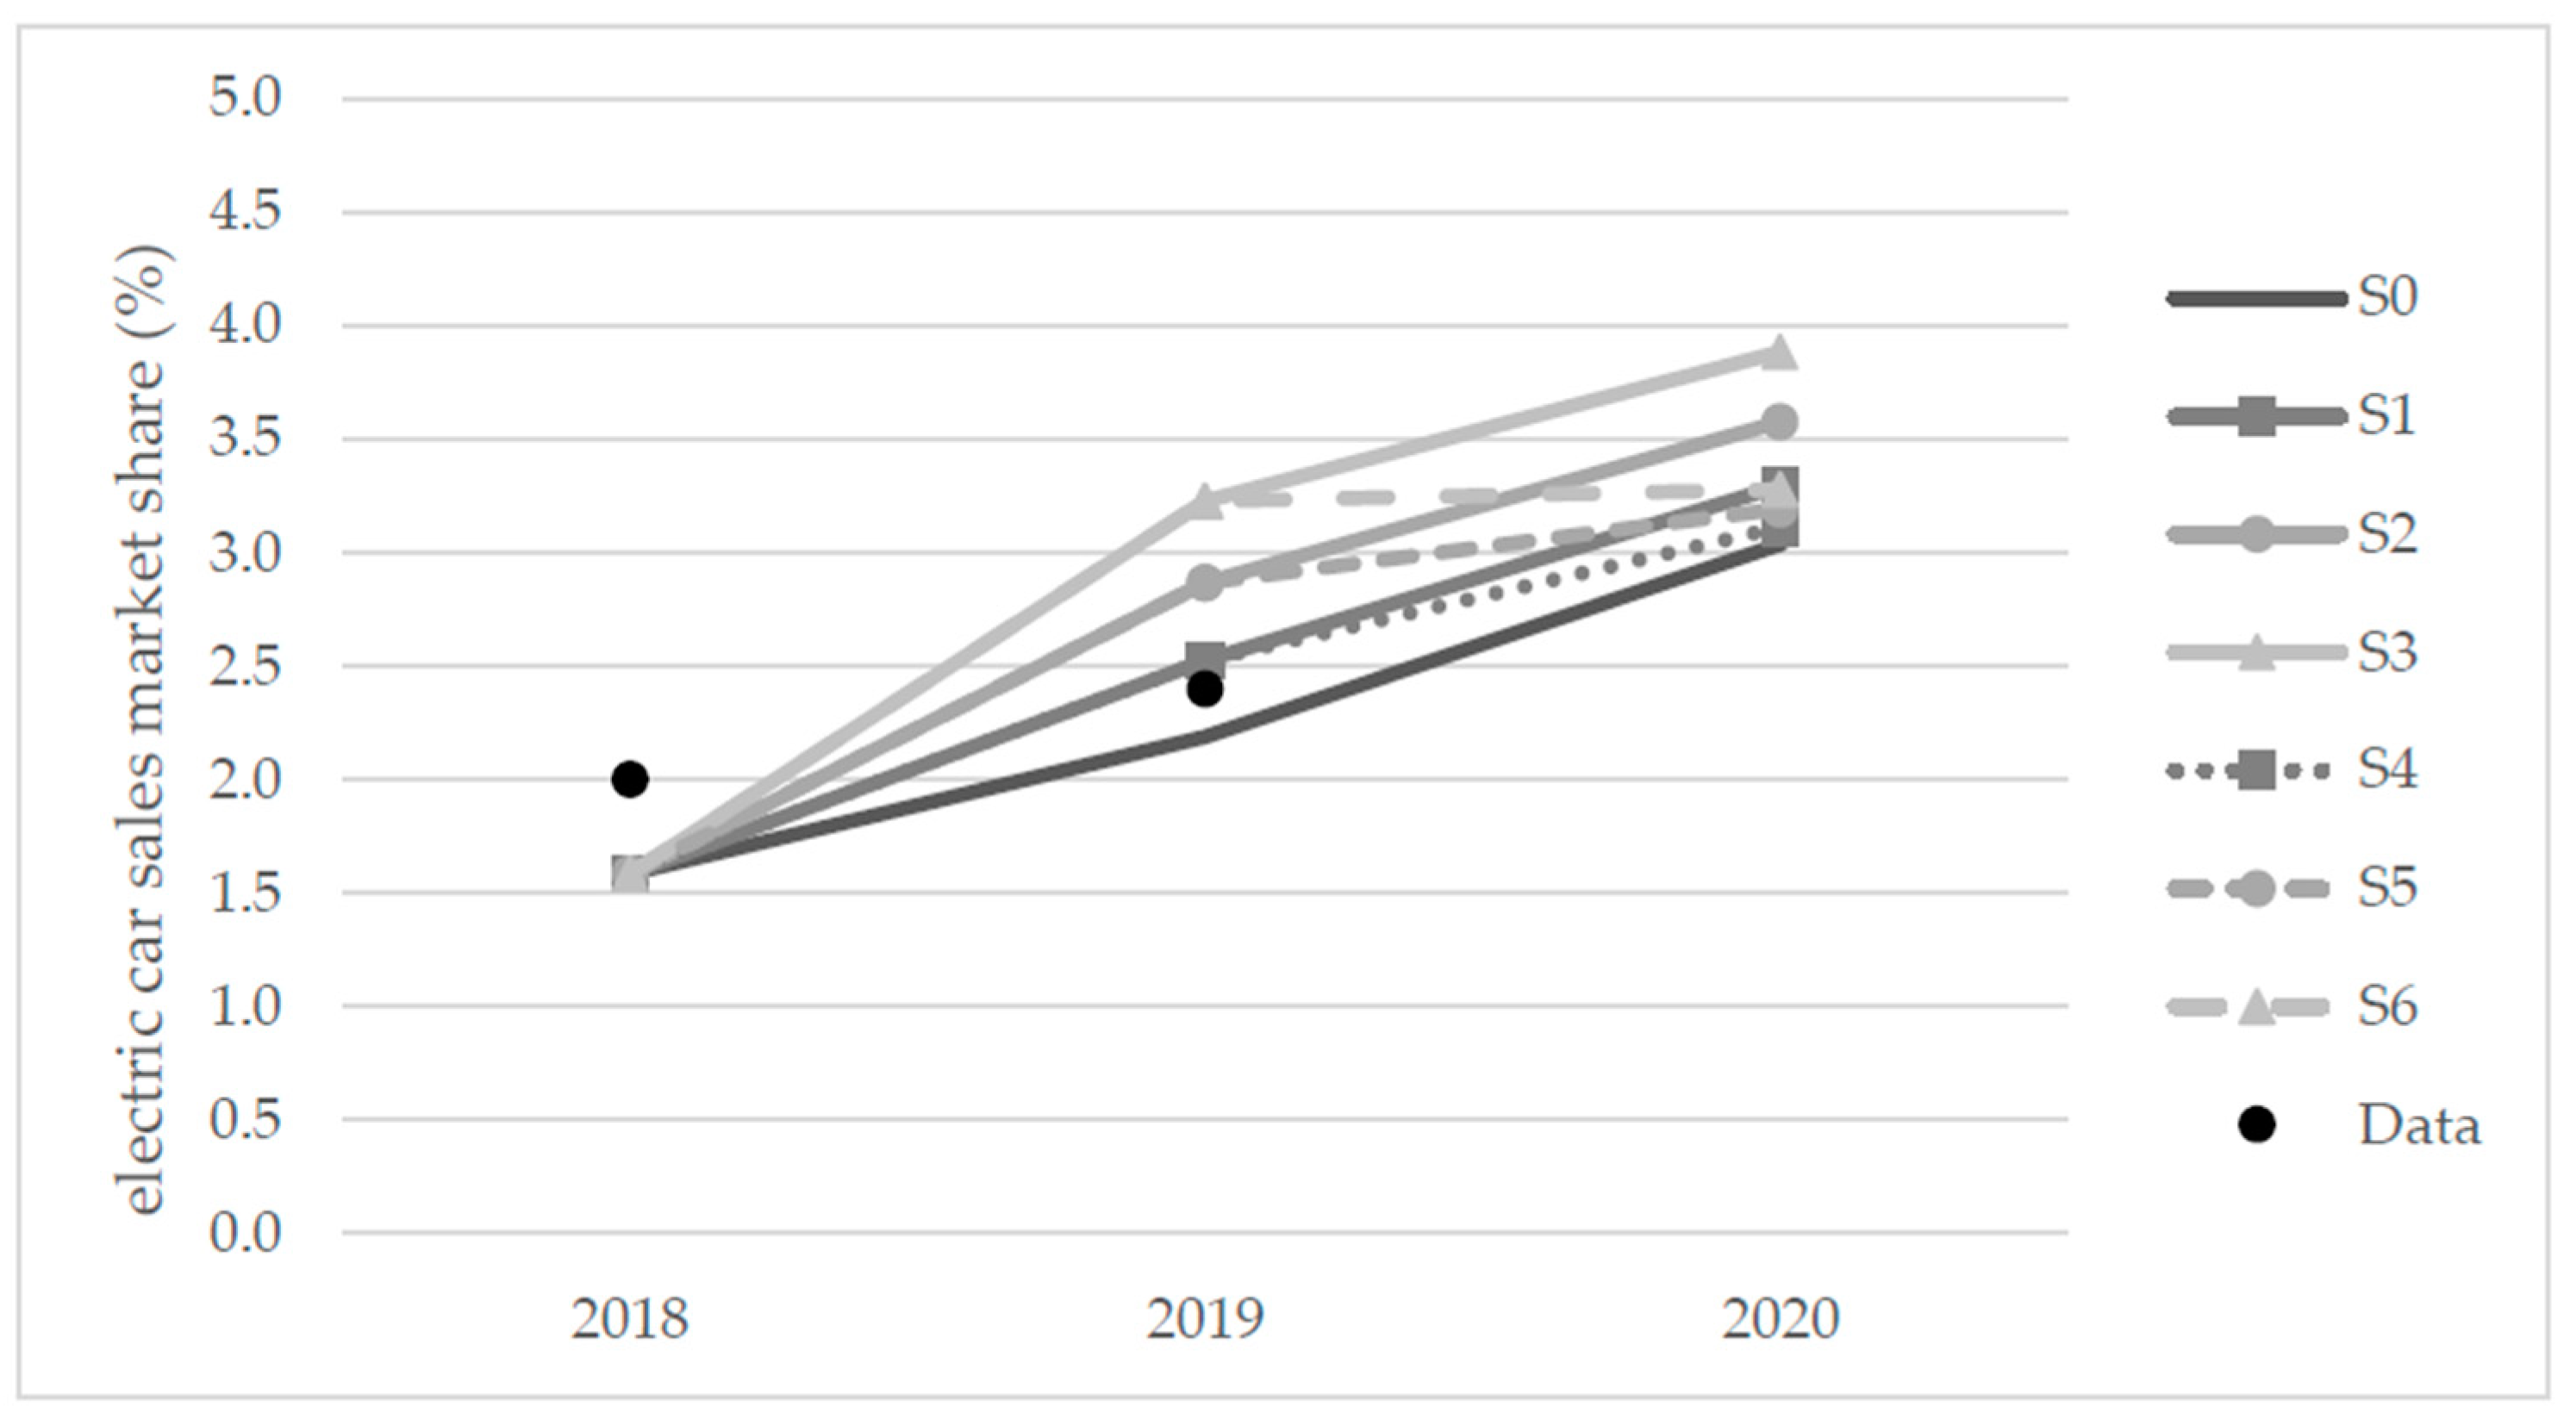
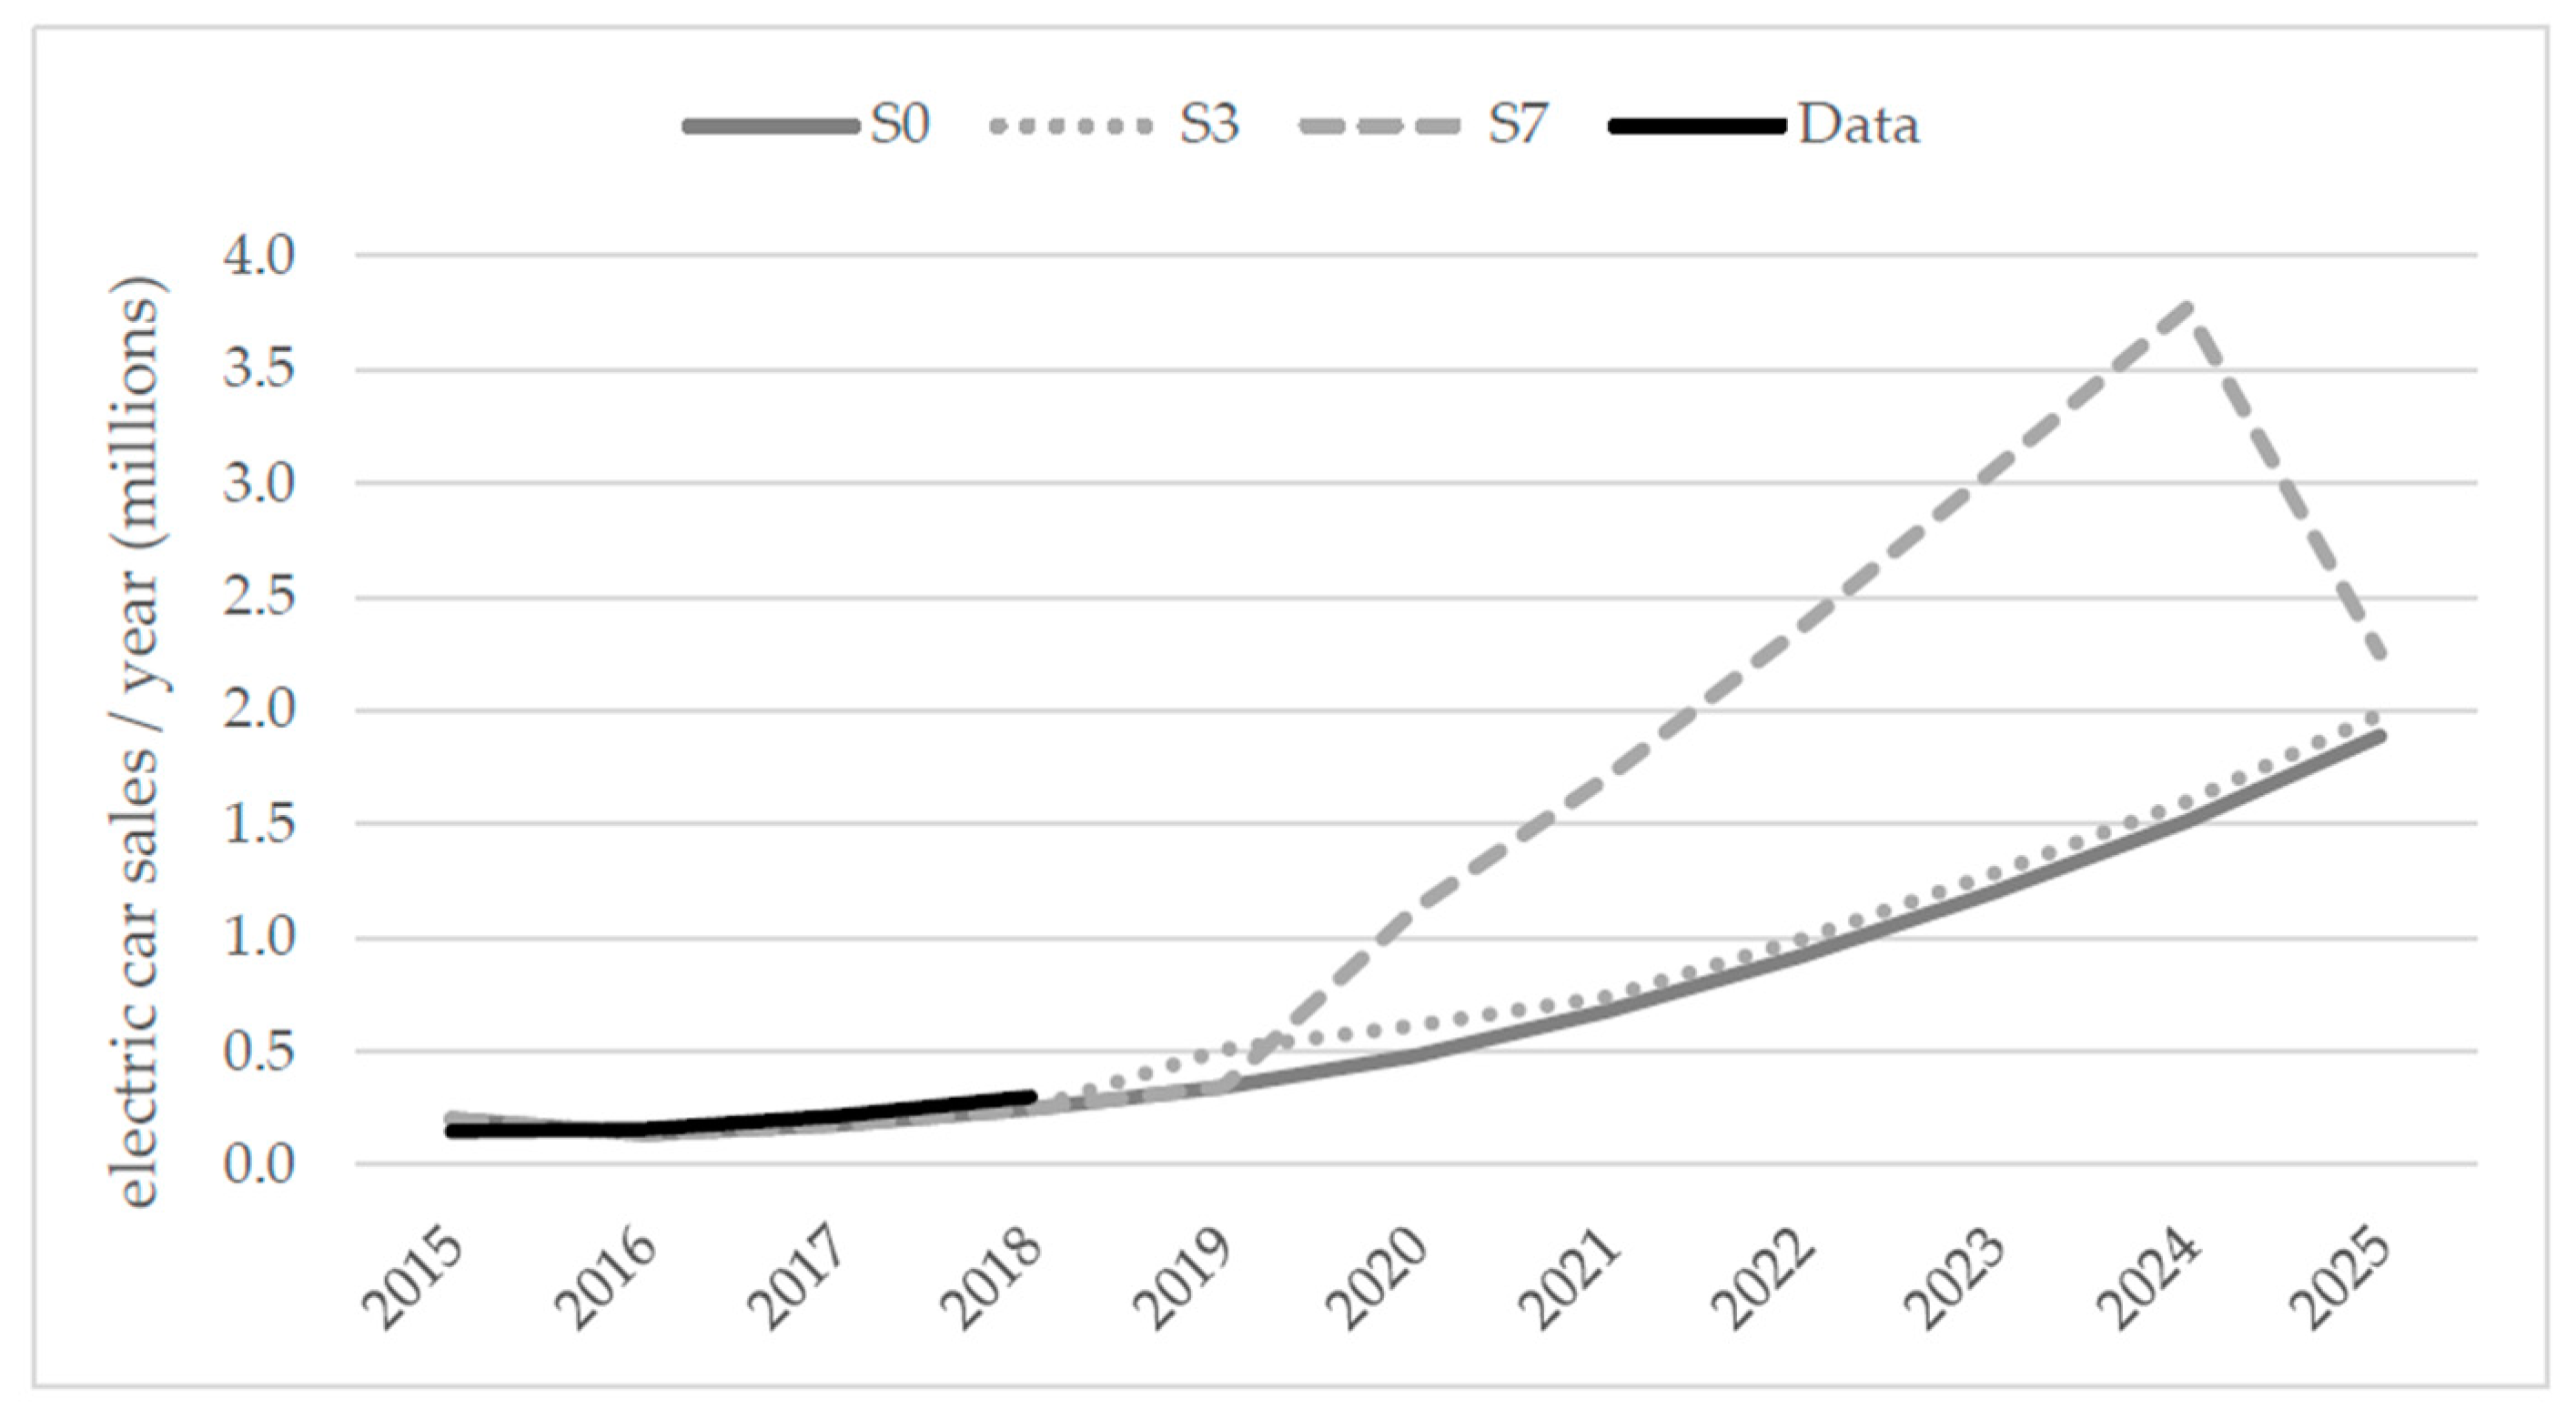
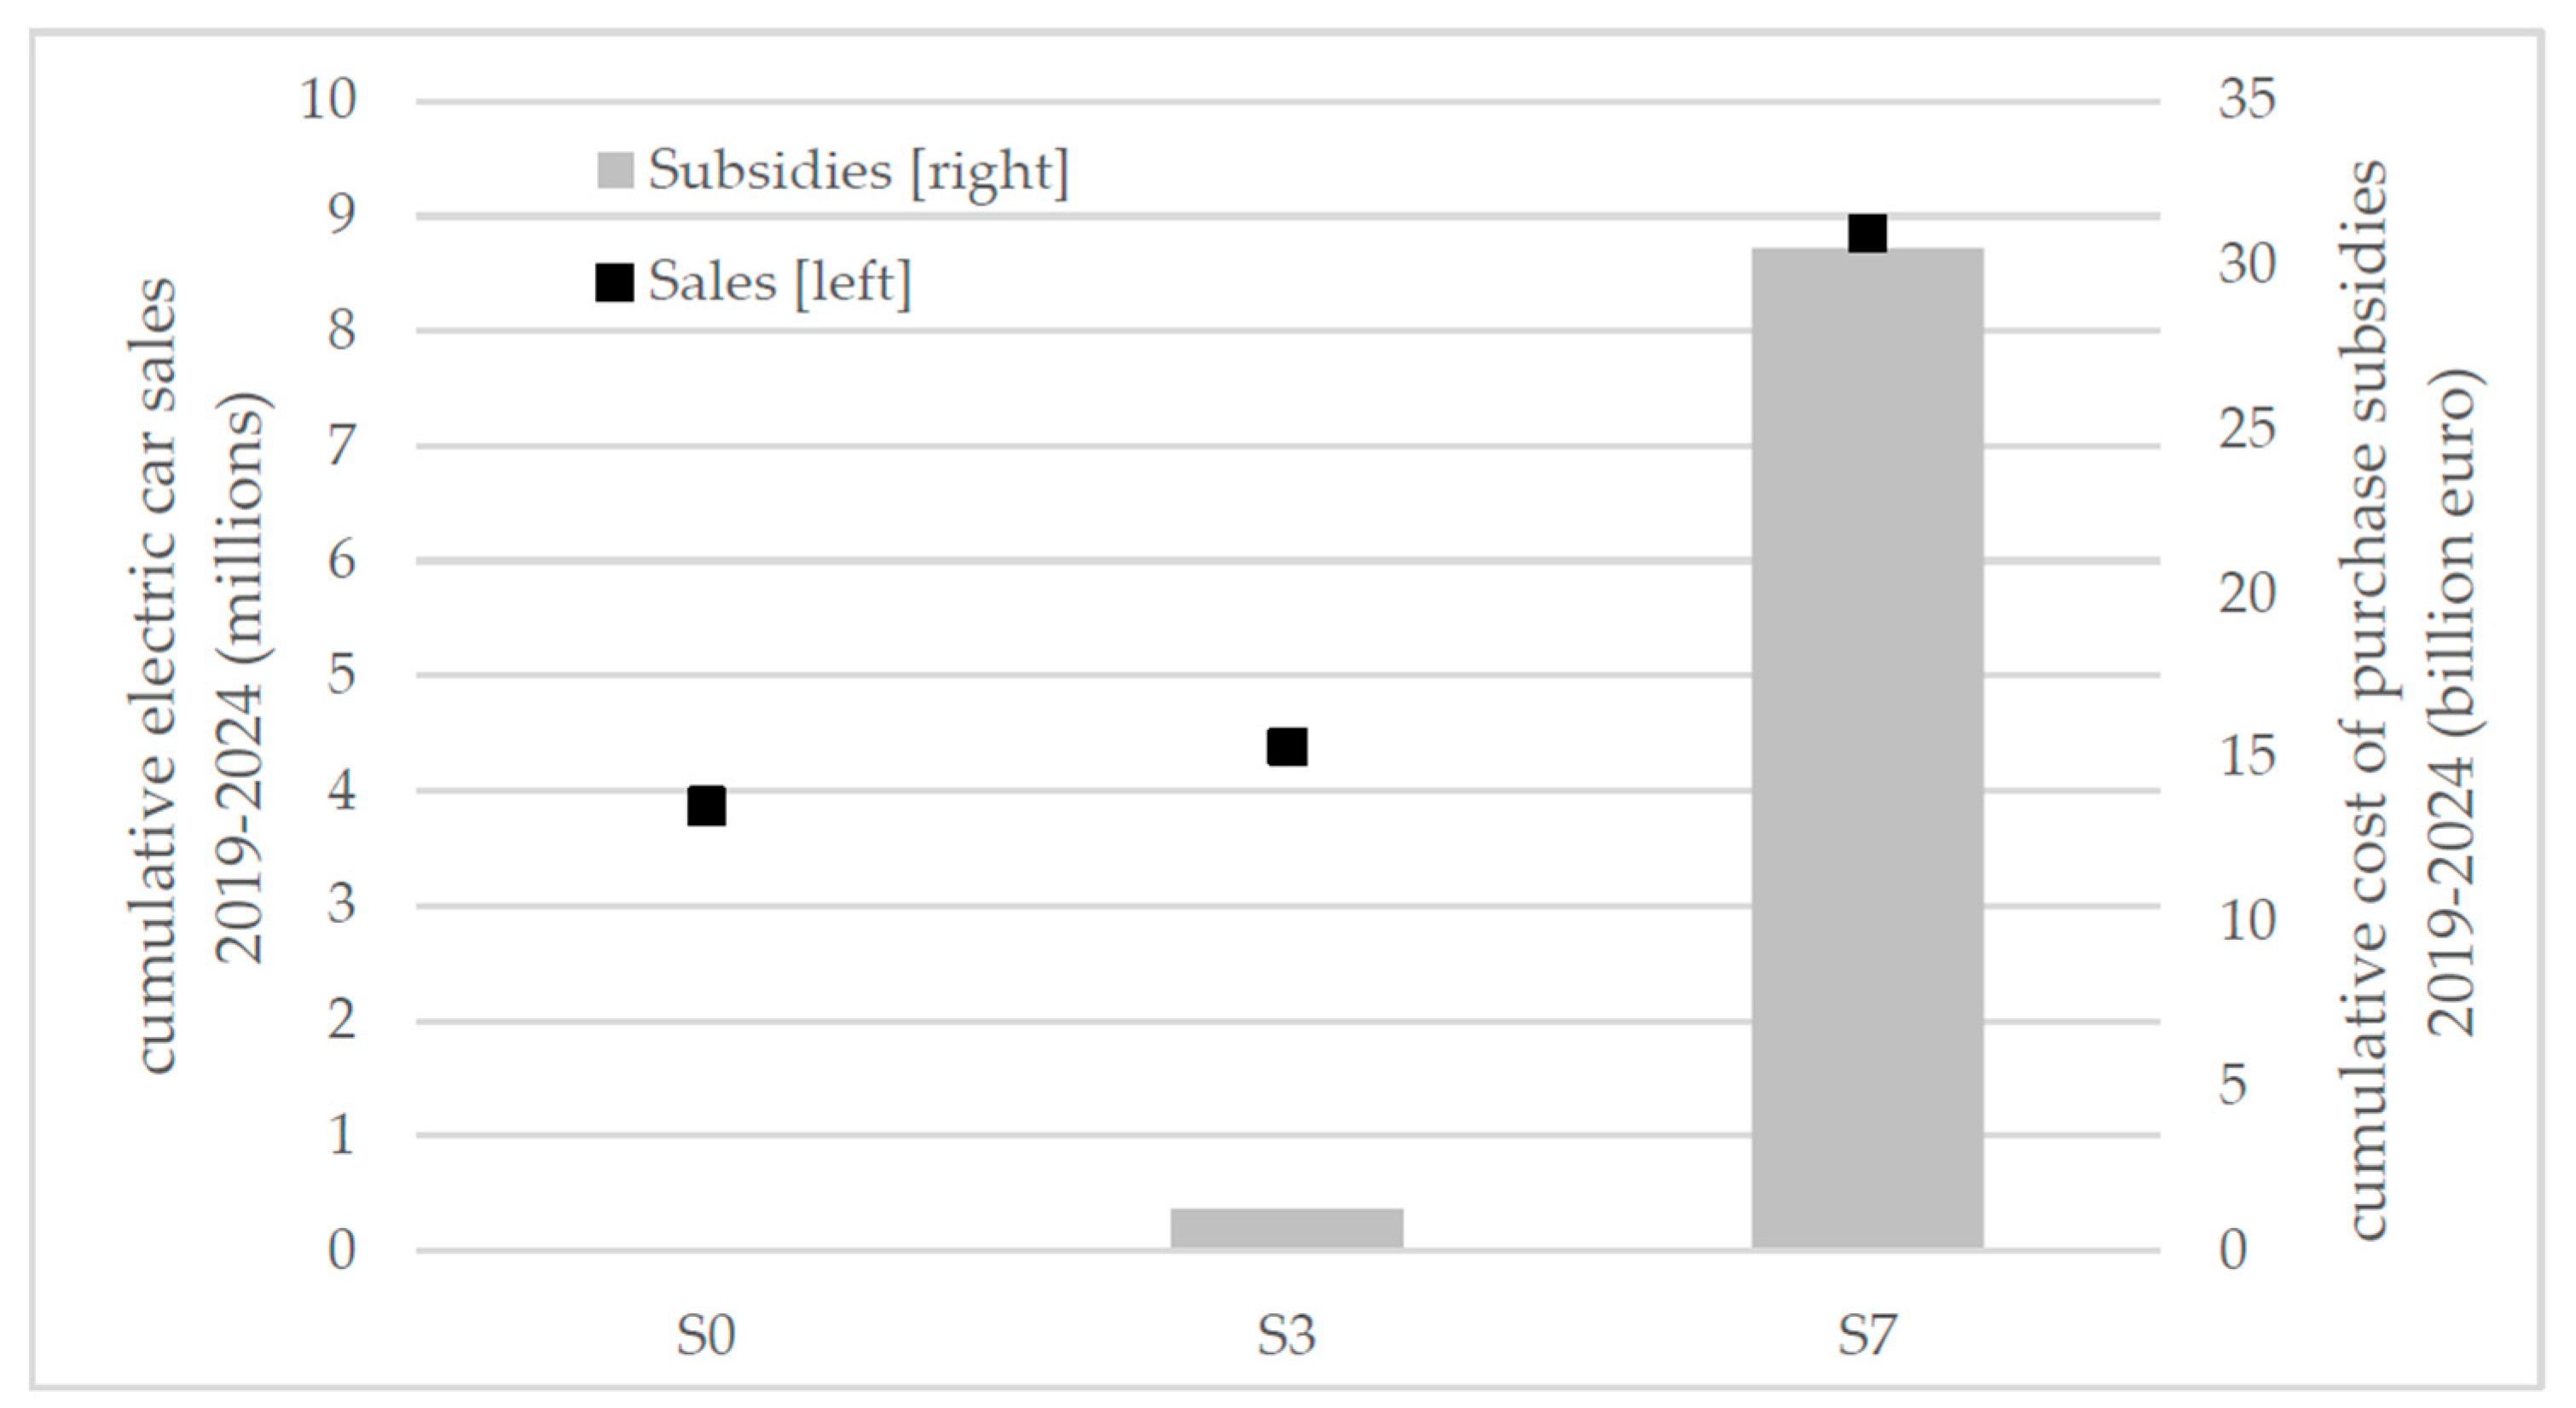
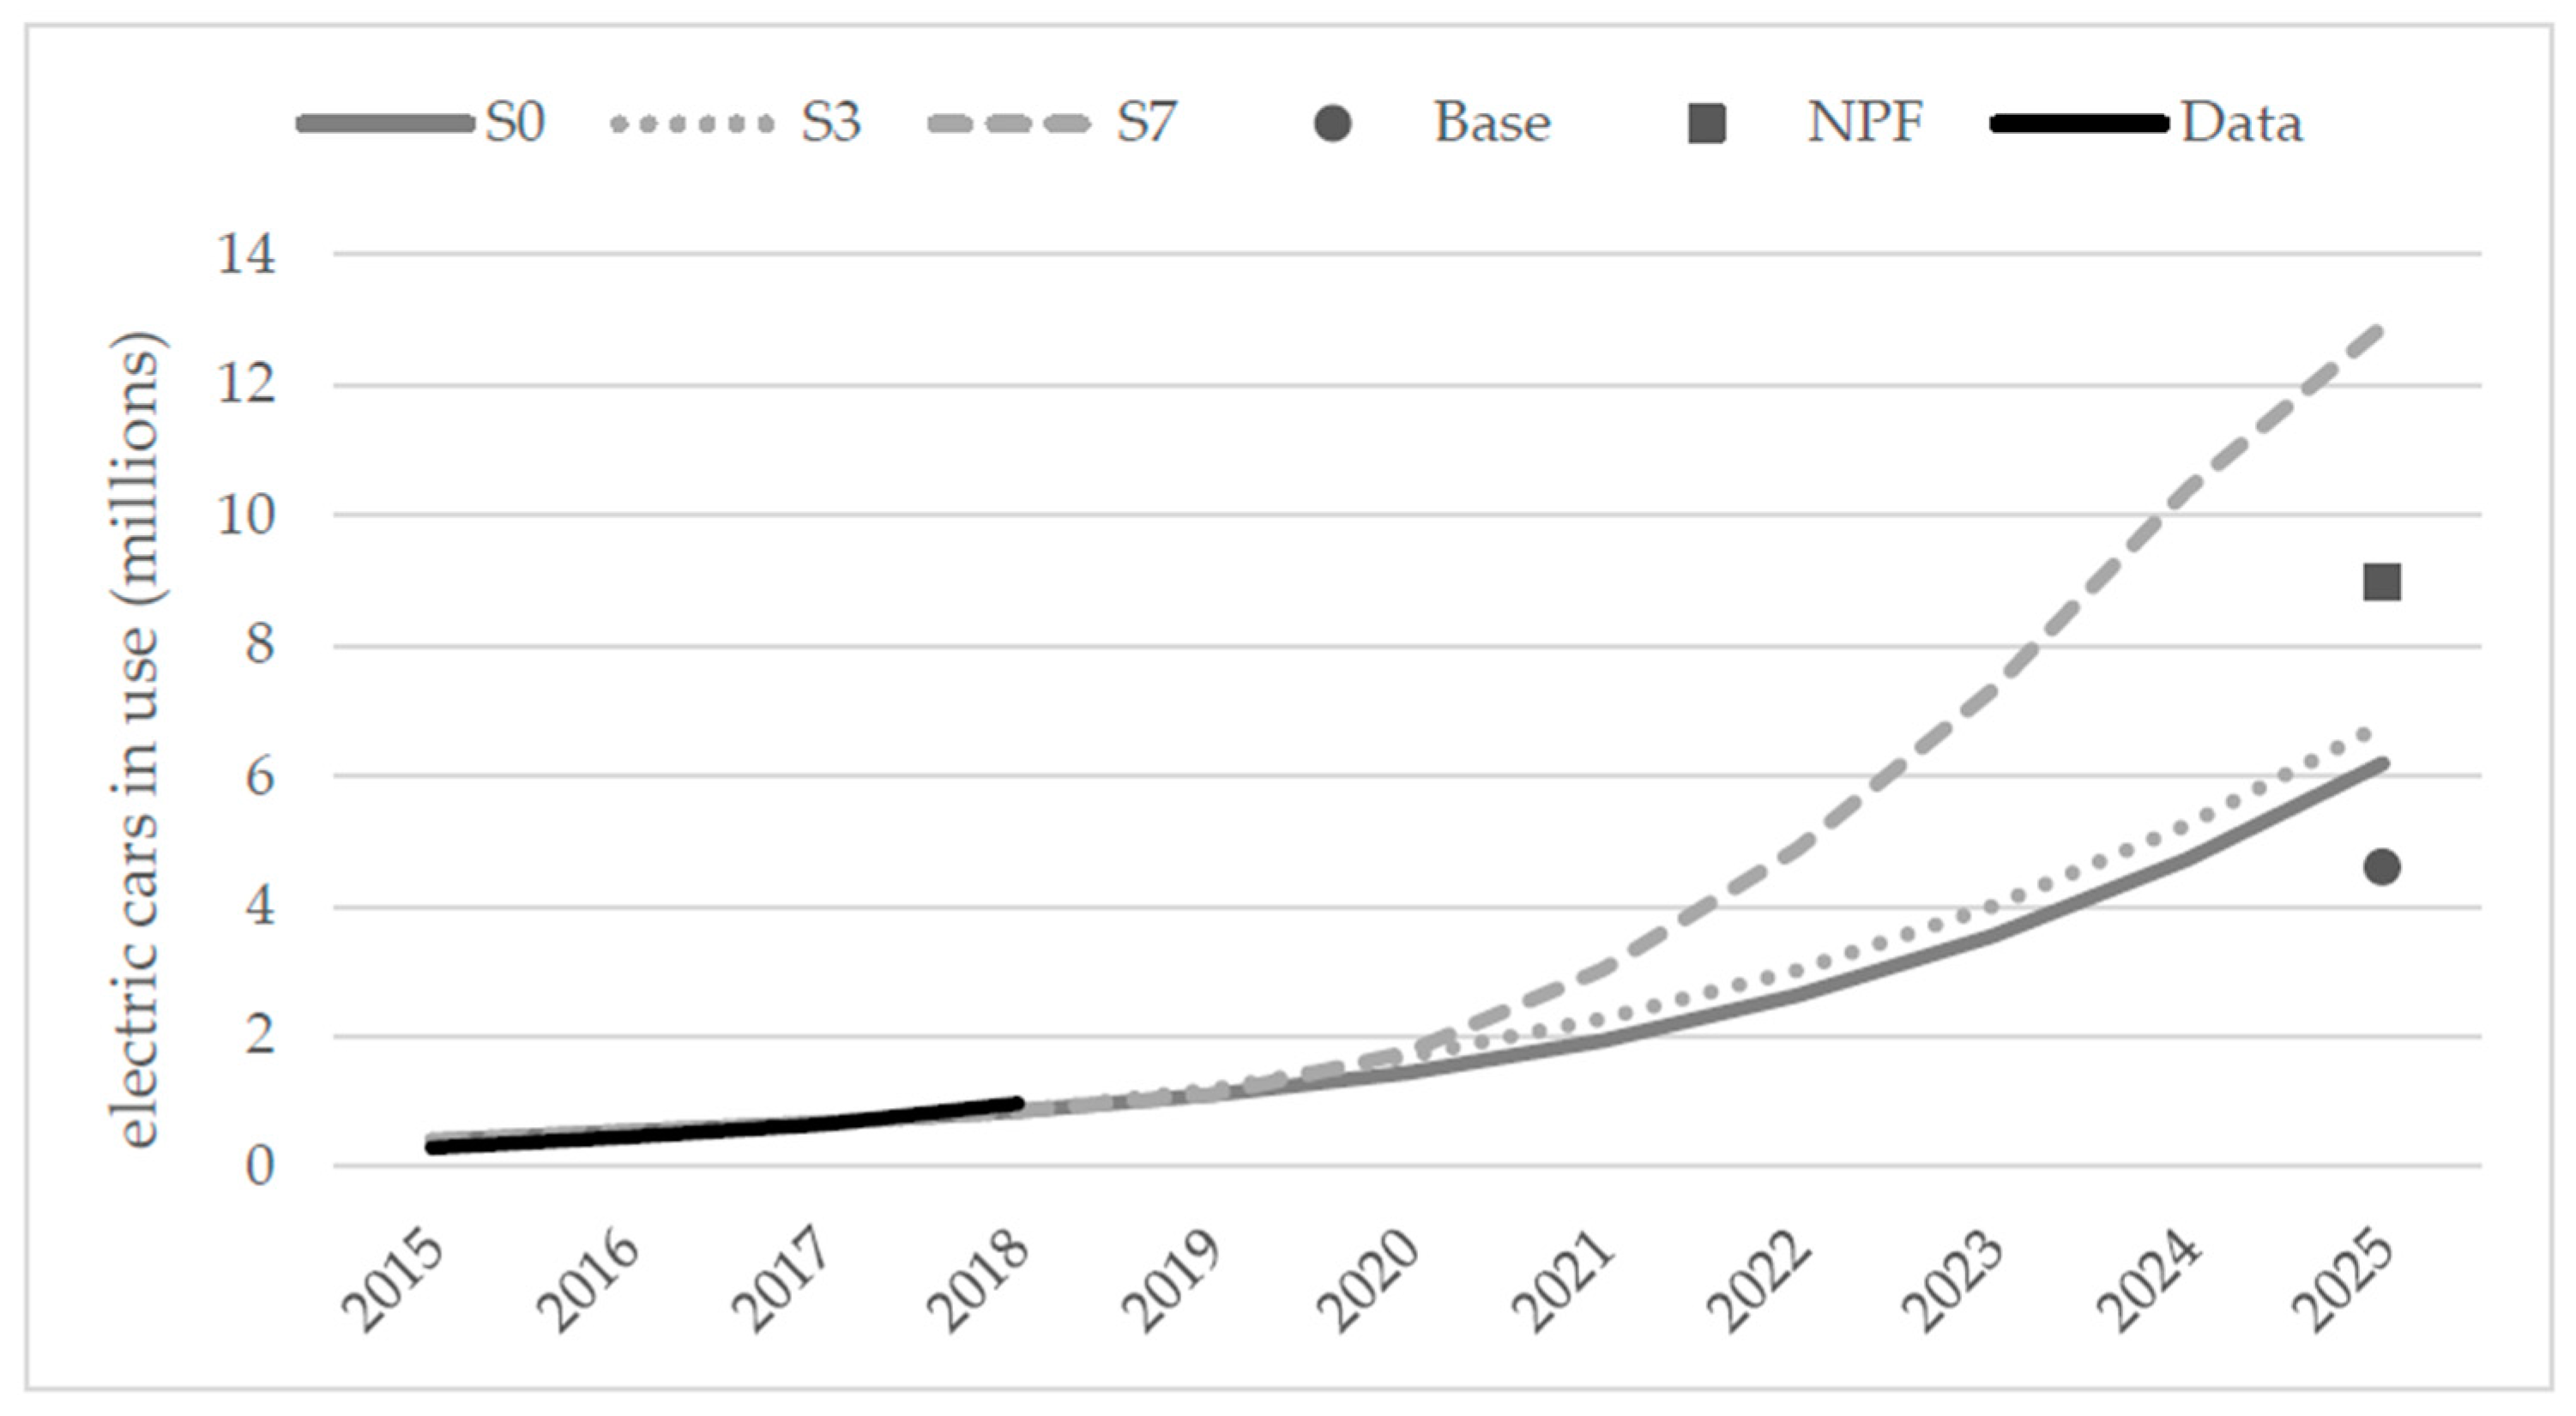
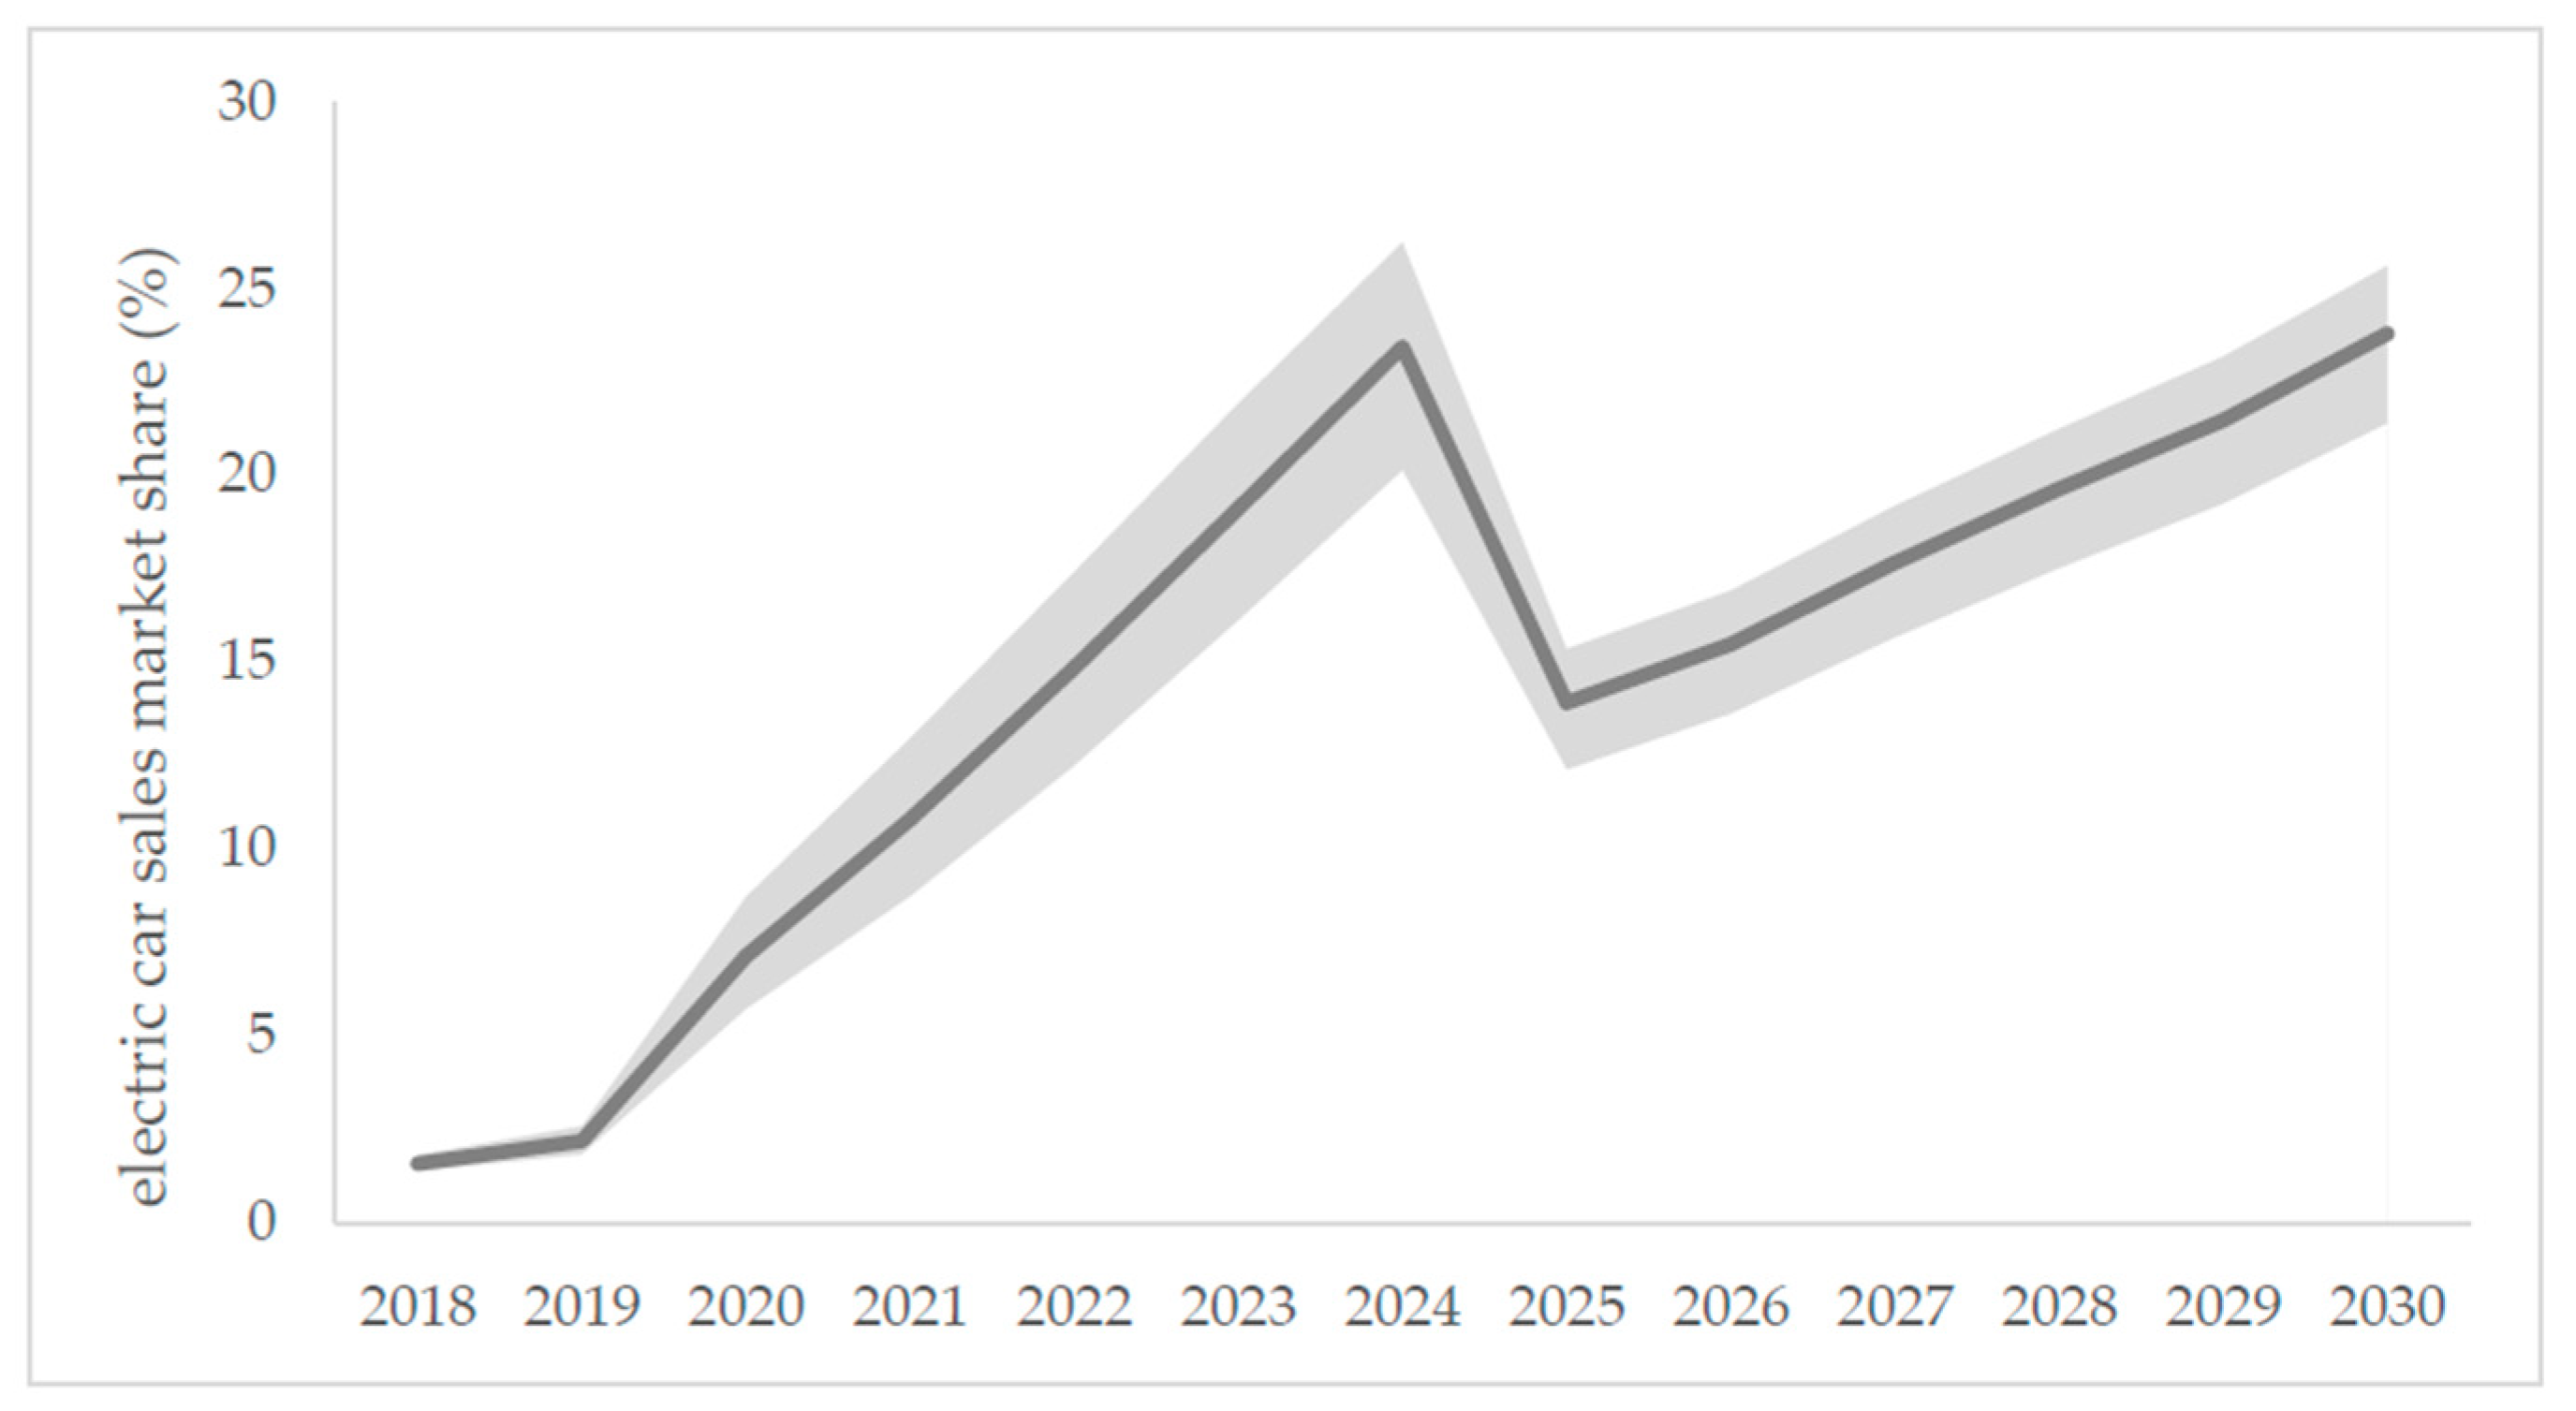
4.2. Electric Car Market Shares, Sales and Stock

Economic theory suggests that a reduction in purchase subsidies leads to higher purchase prices and thus a decline in demand, ceteris paribus. In PTTMAM, the reduction or removal of electric car purchase subsidies increased the purchase price of the BEV and PHEV powertrains, negatively affecting their consumer attractiveness and in turn influencing sales. Figure 6 shows historical data in 2018 (full year) and 2019 (as of October) as well as the simulated electric car sales market share in the EU in 2018–2020, depending on the scenario considered. The following can be observed:
  • The greatest market share was achieved under S3, both in 2019 and 2020;
  • By reducing the size of the subsidy, the market share was reduced (compare S3 to S1 and S2), both in 2019 and 2020;
  • The removal of purchase subsidies led to a lower market share (compare S0 to S1–S3), both in 2019 and 2020;
  • Shortening the duration of the subsidy had a severe impact on the market share, particularly under the most generous subsidy level (see S3 in 2020);
  • Offering a small subsidy in one year only had a temporarily minor effect on the market share (compare S4 to S0).
Thus as expected, the reduction in electric car purchase subsidies led to a fall in electric car market shares. In 2020, the market share ranged between 3% and 4%.
With regards to the medium-term analysis, we identified S3, in addition to the no-subsidy scenario (S0), as the most interesting scenario (from the set shown in Figure 6) for comparison to S7. Figure 7 shows the number of electric cars sold in the EU28 annually between 2015 and 2025, as simulated under three scenarios. As expected, the greater market share experienced by electric cars under S3 translated into a higher sales rate than under S0. Once the incentives in S3 were over in 2020, the rate of EU28 electric car sales remained until 2025 at a slightly higher level than in the scenario without subsidies. More remarkable was the evolution of sales under S7, peaking at 3.8 million electric cars in 2024 and overshooting when the incentives were removed in 2025.
In terms of cumulative sales over 2019–2024, the difference between S3 and S0 was only half a million electric cars, which came at a total cost of almost €1.3 billion in purchase subsidies in the EU (see Figure 8). During the same period, ca. 8.8 million electric cars were simulated to be sold under S7 at a total expense of €30.5 billion. This was still lower than budgets of recent vehicle scrappage schemes that were in place in various countries [26].
Finally, Figure 9 shows the dynamic behavior of EU28 electric car stock associated with each of these three scenarios. Despite the strong decline in sales in 2025 under S7, the stock was simulated to reach almost 13 million electric cars. This figure represents a doubling of the number of electric cars simulated to be in use in the EU under scenarios with either no subsidy or with short-lived (that is, 2019 and 2020 only) incentives. For comparison, the results (‘base’ and ‘NPF’ scenarios) of a previous study [27] are shown.

4.3. Testing the Sensitivity of the Battery Learning Curve

Since the period post–2020 was inherently more uncertain than the 2019–2020 one, a sensitivity analysis was carried out for the S7 run. The model variable ‘cost reduction fraction from learning’, which reflects the learning associated with battery manufacturing and its impact on battery cost for BEV and PHEV, was selected for this purpose. A Monte Carlo simulation was undertaken for that variable by applying a uniform probability distribution over 200 runs. The results for the EU28 are shown in Figure 10, where the line is based on the default 10% learning rate and the shaded area reflects the range between the lower and upper values equal to 5% and 15%, respectively.
As can be seen in the chart, the grey bounds widened while the S7 subsidies were in place. In 2024, all the runs fell within the range of 20%–26% market share for electric cars. As suspected from Figure 7, market shares went down as consumers stopped benefiting from purchase incentives. Between 2025 and 2030, the EU28 electric car sales market share increased steadily, despite the uncertainty of the battery learning rate.

5. Conclusions and Further Research

5.1. Conclusions and Policy Implications

In sum, a system dynamics model was applied to examine the implications of reducing or removing purchase subsidies for the electric car market in the EU. The motivation for this work was the market dynamics exhibited by Denmark and the Netherlands after amending the policy support the governments of these countries provided to electric cars. In 2018, the Danish and Dutch markets accounted for 4% and over 6% of EU28 annual total car sales and EU28 annual electric car sales, respectively [2,28].
In total, eight scenarios were considered in the modeling exercise: a no-subsidy scenario, six scenarios for the short-term (2019–2020) and one for the medium-term (2020–2025). Since uncertainty was greater for the latter period, sensitivity analysis was carried out on the learning rate associated with the battery cost.
When the electric car purchase subsidy was in place (scenarios 1 to 3), the resulting simulated EU28 market share was higher (cf. scenarios 4 to 6). We therefore concluded that purchase subsidies were expected to continue to foster the market share of electric cars in the EU until 2020, compared to a scenario without subsidies. While the least generous purchase incentive had a low impact on market share (compare scenario 4 to the no-subsidy scenario), shortening the most generous purchase subsidy had a noticeable effect on the market (scenario 6).
In the medium-run, a purchase subsidy scheme granting €3000 for PHEVs and €4000 for BEVs over the period 2020–2024 yielded the fastest electric car market uptake of all the scenarios considered. Under this scenario, the size of the purchase subsidy was €3447 per electric car on average. When taking into account the no-subsidy scenario, the marginal cost was however €6123 per electric car.
A key policy implication of this work was that reduction or removal of incentives before 2020 was expected to slow down electric car growth and might lead, for the most generous subsidy level, to even temporary market stagnation. Therefore, it may be premature to remove electric car purchase subsidies over the next years, if the policy goal is to speed up the market penetration of this technology or at least keep its current pace in the EU. This policy conclusion seems to be in line with that of [29]. Notwithstanding this, discussions on optimal incentive levels should be initiated.

5.2. Limitations and Further Research

The results of this study should be interpreted in view of the current limitations of the model, particularly visible in Section 4.1. A more recent attempt at model testing and validation using the Netherlands and Norway as case studies has been reported by [10]. There are sixteen powertrain technologies included in the choice set of PTTMAM’s ‘Users’ market agent, while for instance the European Environment Agency currently reports nine fuel types for cars. There is also room for simplifying the behavioral assumptions related to how probable it is that consumers will choose each powertrain. An update of PTTMAM is ongoing to reduce the set of alternatives and improve the users’ powertrain choice by incorporating the results of a survey conducted among European car drivers (see [30]).
Furthermore and since the temporal dimension of this analysis was annual, it would be interesting to complement the results shown here until 2020 with a more detailed time series analysis with a quarterly or even monthly frequency. In this context, extrapolative techniques may also be considered.
Although the Danish and Dutch time series illustrate well the dynamics of electric car incentives and sales, the United Kingdom represents a counter example as the removal of purchase subsidies (see Table 1) did not result in declining electric car sales or market shares [2]. This seems to reinforce the hypothesis that non-monetary factors also play a role in electric car markets. Although this country was examined in previous work (refer to [19]), it may be opportune to revisit it in future work.
Given that the geographical scope of this study was EU-wide, a more detailed analysis of each Member State, covering at length the specific national and regional policy context, would also be beneficial. This is likely to allow an analysis of the total economic implications for the budget of the government offering the purchase incentives as well as of the distributional effect of those subsidies.

Author Contributions

Conceptualization, C.T. and J.J.G.V.; software, J.J.G.V.; data curation, J.J.G.V.; writing—original draft preparation, J.J.G.V.; writing—review and editing, C.T.; project administration, C.T.

Funding

This research received no external funding.

Acknowledgments

We thank our colleague Biagio Ciuffo and four anonymous reviewers for their comments.

Conflicts of Interest

The authors declare no conflict of interest.

Disclaimer

The views expressed are purely those of the authors and may not in any circumstances be regarded as stating an official position of the European Commission.

References

  1. EVI. Global EV Outlook 2018; Electric Vehicles Initiative (EVI): Cambridge, UK; Organization for Economic Co-operation and Development (OECD): Paris, France; International Energy Agency (IEA): Paris, France, 2018; Available online: https://www.iea.org/gevo2018/ (accessed on 8 October 2019).
  2. European Alternative Fuels Observatory (EAFO). Available online: http://www.eafo.eu (accessed on 8 October 2019).
  3. Regulation (EC) No 443/2009 of the European Parliament and of the Council of 23 April 2009 Setting Emission Performance Standards for New Passenger Cars as Part of the Community’s Integrated Approach to Reduce CO2 Emissions from Light-Duty Vehicles. Euro. Available online: http://eur-lex.europa.eu/legal-content/en/ALL/?uri=CELEX:32009R0443 (accessed on 3 September 2019).
  4. Regulation (EU) No 333/2014 of the European Parliament and of the Council of 11 March 2014 Amending Regulation (EC) No 443/2009 to Define the Modalities for Reaching the 2020 Target to Reduce CO2 Emissions from New Passenger Cars. Available online: http://eur-lex.europa.eu/legal-content/EN/TXT/?toc=OJ%3AL%3A2014%3A103%3AFULL&uri=uriserv%3AOJ.L_.2014.103.01.0015.01.ENG (accessed on 3 September 2018).
  5. Directive 2014/94/EU of the European Parliament and of the Council of 22 October 2014 on the Deployment of Alternative Fuels Infrastructure. Available online: http://eur-lex.europa.eu/legal-content/EN/TXT/?uri=celex%3A32014L0094 (accessed on 3 September 2019).
  6. Lévay, P.Z.; Drossinos, Y.; Thiel, C. The effect of fiscal incentives on market penetration of electric vehicles: A pairwise comparison of total cost of ownership. Energy Policy 2017, 105, 524–533. [Google Scholar] [CrossRef]
  7. ACEA. Overview: Tax Incentives for Electric Vehicles in the EU; European Automobile Manufacturers Association (ACEA): Brussels, Belgium, 2018. [Google Scholar]
  8. Kindleberger, C.P. Manias, Panics and Crashes: A History of Financial Crises; Macmillan Press: New York, USA, 1996. [Google Scholar]
  9. Bloomberg, Denmark Does U-Turn on Electric Cars to Reach Fossil-Free Future. Available online: https://www.bloomberg.com/news/articles/2018-10-09/denmark-does-u-turn-on-electric-cars-to-reach-fossil-free-future (accessed on 3 September 2019).
  10. Deuten, S.; Gómez Vilchez, J.J.; Thiel, C. Analysis and testing of electric car incentive scenarios in the Netherlands and Norway. Technol. Forecast. Soc. Chang. 2019. under review. [Google Scholar]
  11. ACEA. Tax Guide. European Automobile Manufacturers Association (ACEA). Available online: https://www.acea.be/industry-topics/tag/category/tax-guide (accessed on 3 September 2019).
  12. Schmidt, O.; Hawkes, A.; Gambhir, A.; Staffell, I. The future cost of electrical energy storage based on experience rates. Nat. Energy 2017, 2, 17110. [Google Scholar] [CrossRef]
  13. Forrester, J.W. Industrial Dynamics; Massachusetts Institute of Technology Press: Cambridge, MA, USA, 1961. [Google Scholar]
  14. Sterman, J.D. Business Dynamics: Systems Thinking and Modeling for a Complex World; Irwin/McGraw-Hill: Boston, MA, USA, 2000. [Google Scholar]
  15. Harrison, G.; Thiel, C.; Jones, L. Powertrain Technology Transition Market Agent Model (PTTMAM): An Introduction; Joint Research Centre (JRC) Technical Report; European Commission (EC): Luxembourg, 2016; Available online: http://publications.jrc.ec.europa.eu/repository/bitstream/JRC100418/pttmam%20technical%20report%20final_online.pdf (accessed on 3 September 2019).
  16. Powertrain Technology Transition Market Agent Model (PTTMAM). EU Science Hub—The European Commission’s Science and Knowledge Service. Available online: https://ec.europa.eu/jrc/en/pttmam (accessed on 3 September 2019).
  17. Pasaoglu, G.; Harrison, G.; Jones, L.; Hill, A.; Beaudet, A.; Thiel, C. A system dynamics based market agent model simulating future powertrain technology transition: Scenarios in the EU light duty vehicle road transport sector. Technol. Forecast. Soc. Change 2016, 104, 133–146. [Google Scholar] [CrossRef]
  18. Harrison, G.; Gómez Vilchez, J.J.; Thiel, C. Industry strategies for the promotion of E-mobility under alternative policy and economic scenarios. Eur. Transp. Res. Rev. 2018, 10, 19. [Google Scholar] [CrossRef]
  19. Harrison, G.; Thiel, C. Policy insights and modelling challenges: The case of passenger car powertrain technology transition in the European Union. Eur. Transp. Res. Rev. 2017, 9, 37. [Google Scholar] [CrossRef] [Green Version]
  20. UBS. UBS Evidence Lab Electric Car Teardown—Disruption Ahead; UBS Group SA: Zurich, Switzerland, 2017. [Google Scholar]
  21. Tsiropoulos, I.; Tarvydas, D.; Lebedeva, N. Li-ion Batteries for Mobility and Stationary Storage Applications—Scenarios for Costs and Market Growth; Joint Research Centre (JRC) Science for Policy Report; European Commission (EC): Luxembourg, 2018; Available online: http://publications.jrc.ec.europa.eu/repository/bitstream/JRC113360/kjna29440enn.pdf (accessed on 3 September 2019).
  22. EC. SET-Plan ACTION n°7—Declaration of Intent ‘Become Competitive in the Global Battery Sector to Drive E-Mobility Forward’; European Commission (EC): Brussels, Belgium, 2016; Available online: https://setis.ec.europa.eu/system/files/integrated_set-plan/action7_declaration_of_intent_0.pdf (accessed on 3 September 2018).
  23. Commission Staff Working Document Detailed Assessment of the National Policy Frameworks Accompanying the Document Communication from the Commission to the European Parliament, the Council, the European Economic and Social Committee and the Committee of the Regions Towards the Broadest Use of Alternative Fuels—An Action Plan for Alternative Fuels Infrastructure under Article 10(6) of Directive 201/94/EU, Including the Assessment of National Policy Frameworks under Article 10(2) of Directive 2014/94/EU; SWD/2017/0365 Final, 2017. Available online: http://eur-lex.europa.eu/legal-content/EN/TXT/?qid=1512384850915&uri=CELEX:52017SC0365 (accessed on 3 September 2019).
  24. FuelsEurope. Statistical Report 2017; FuelsEurope: Brussels, Belgium, 2017. [Google Scholar]
  25. Keith, D.R.; Naumov, S.; Sterman, J.D. Driving the Future: A Management Flight Simulator of the US Automobile Market. Simul. Gaming 2017, 48, 735–769. [Google Scholar] [CrossRef]
  26. Thiel, C.; Schmidt, J.; Van Zyl, A.; Schmid, E. Cost and well-to-wheel implications of the vehicle fleet CO2 emission regulation in the European Union. Transp. Res. Part A Policy Pract. 2014, 63, 25–42. [Google Scholar] [CrossRef]
  27. Gómez Vilchez, J.J.; Julea, A.; Peduzzi, E.; Pisoni, E.; Krause, J.; Siskos, P.; Thiel, C. Modelling the impacts of EU countries’ electric car deployment plans on atmospheric emissions and concentrations. Eur. Transp. Res. Rev. 2019, 11, 40. [Google Scholar] [CrossRef]
  28. ACEA. New Passenger Car Registrations European Union; European Automobile Manufacturers Association (ACEA): Brussels, Belgium, 2019. [Google Scholar]
  29. Hardman, S.; Chandan, A.; Tal, G.; Turrentine, T. The effectiveness of financial purchase incentives for battery electric vehicles—A review of the evidence. Renew. Sustain. Energy Rev. 2017, 80, 1100–1111. [Google Scholar] [CrossRef]
  30. Gómez Vilchez, J.J.; Harrison, G.; Kelleher, L.; Smyth, A.; Thiel, C. Quantifying the Factors Influencing People’s Car Type Choices in Europe: Results of a Stated Preference Survey; Joint Research Centre (JRC) Science for Policy Report; European Commission (EC): Luxembourg, 2017; Available online: http://publications.jrc.ec.europa.eu/repository/bitstream/JRC109452/kjna28975enn.pdf (accessed on 3 September 2019).
Figure 1. Annual electric car sales in (a) Denmark and (b) in the Netherlands. Sources: own work based on [2,7].
Wevj 10 00064 g001
Figure 2. Stylized modular view of the powertrain technology transition market agent model (PTTMAM).
Wevj 10 00064 g002
Figure 3. Battery price evolution. Sources: data from [12,20,21,22] and own simulation.
Wevj 10 00064 g003
Figure 4. Total public recharging infrastructure deployment in the EU28. Sources: data from [2,23] and own simulation.
Wevj 10 00064 g004
Figure 5. Model fit to historical Danish and Dutch sales data. Sources: data from [2] and own simulations.
Wevj 10 00064 g005
Figure 6. EU28 electric car sales market share by scenario. Sources: data from [2] (as of October 2019) and own simulations.
Wevj 10 00064 g006
Figure 7. EU28 electric cars annually sold by scenario. Sources: data from [2] and own simulations.
Wevj 10 00064 g007
Figure 8. Cumulative EU28 electric car sales and corresponding cost of purchase subsidies by scenario. Sources: own simulations.
Wevj 10 00064 g008
Figure 9. EU28 electric car stock by scenario. Sources: data from [2,27] and own simulations.
Wevj 10 00064 g009
Figure 10. Sensitivity analysis. Sources: own work using Vensim®.
Wevj 10 00064 g010
Table 1. Purchase subsidy by country, in the thousands.
Country201320142015201620172018
France€4.5–7.0 1€4.0–6.3 1€2.0–6.3 1€0.7–6.3 1€1.0–10.0 2€2.5–10.0 3
Germany€0.0€0.0€0.0€3.0–4.0 4€3.0–4.0 4€3.0–4.0 4
Denmark€0.0€0.0€0.0€0.0€0.0€0.0
The Netherlands€0.0€0.0€0.0€0.0€0.0€0.0
United Kingdom≤£5.0≤£5.0≤£5.0€0.0€0.0€0.0
1 Depending on the emissions level and value-added tax ceiling. 2 Depending on the emissions level. €10,000 when an old diesel is replaced with an EV. 3 €2500 for replacing an old diesel with a PHEV. €10,000 if you combine two incentives when an old diesel is replaced with a BEV. 4 €3000 per PHEV and €4000 per BEV. Source: own work based on [11].
Table 2. CO2 emissions of the average new car sold in the EU28, in gram per km.
2021–20242025–20292030–20342035–20392040–20442045–2050
95.0080.7566.5050.0040.0030.00
Note: these values are based on the New European Driving Cycle (NEDC). Source: own assumptions.
Table 3. Policy scenarios 2019–2020: purchase incentives.
Scenario No.S1S2S3S4S5S6
Size (%)10%20%30%10%/0%20%/0%30%/0%
Timing (year)2019–20202019–20202019–20202019/20202019/20202019/2020

