1. Introduction
The take-up rate of electric vehicles (EVs) is steadily increasing globally. Year after year the number of sold EVs increases and the expectations are quite optimistic for future years to come [
1]. As it happens with any other technology that is accepted by society, the higher the deployment, the higher its overall impact will be in many different fields. In the case of EV, these fields are, for instance, household consumption, electricity grid balancing, and load management or the environment.
Regarding households, as most common EV batteries have a capacity of 24 kWh, which is more than the average household daily consumption, it seems obvious that the impact of EVs on daily energy consumption curves will be more than considerable. To evaluate and reduce the effects of EVs in buildings, it is important to count on smart energy management systems capable of optimizing the EV charges according to the instantaneous and the expected energy consumption of the building. These systems might also bring environmental and economic benefits to the building, which is the main goal of the SABINA project. The framework of this study is described in more detail in the methodology section.
On the other side of the meter, from an electricity grid perspective, uncontrolled and unexpected EV charges might bring to grid voltage variations, overloads, and network congestion [
2] and, in consequence, the need for load management strategies appears, such as the use of distributed energy resources with demand-side response capabilities. In this case, EVs might be part of the problem and of the solution at the same time thanks to vehicle-to-grid (V2G) technologies even though its implementation might not be yet economically viable [
3].
Nonetheless, apart from technical aspects, the entrance of EVs also carries environmental burdens to analyze. When dealing with an environmental analysis of EVs, Life Cycle Assessments (LCA) are launched considering that vehicles will run from 100,000 to almost 250,000 km [
4]. Many of them, though, try to be somehow aligned with the warranties given by car manufacturers, which nowadays go from 8 to 10 years within this range of mileage [
5], keeping the overall mileage around 150.000 km [
6]. This value is, incidentally, also aligned with the expected lifespan of batteries for traction purposes. In fact, batteries degrade over time and with use due to many factors, such as temperature, intensity of use, depth-of-discharge (DOD), working voltage, and time (used or not) [
7]. It is widely accepted that the battery is inappropriate for mobility purposes when its State-of-Health (SoH) reaches 70–80% of its initial capacity [
8]. This moment is commonly known as the End-of-Life (EoL) of the battery in the vehicle. Then, these batteries are either sent to recycle or they are re-used in stationary applications offering them a second life, as most car manufacturers are starting to evaluate and test [
9,
10].
However, some researchers have already noticed that, according to travel needs, this EoL might go below this limit [
11], which is said to be fixed by car manufacturers more due to commercial decisions rather than for noticeable driving impacts [
12]. These doubts regarding the EoL of EVs gain relevance seeing that the range of new EVs increase (without increasing the EV cost significantly) [
13], as vehicles will keep doing the same regular trips but will have a wider autonomy. Therefore, it seems that it makes sense to study the possibility to go beyond the generally accepted battery EoL of 70–80% SoH.
In order to answer this question, this paper analyzes thousands of EV charges involving hundreds of electric vehicles around Europe to obtain representative statistical curves that may be used to estimate EV charge events distribution in relation to the plug-in hour. These raw data are the result of the Green eMotion FP7 project [
14] that analyzed several electric mobility issues. Then, data is used to determine the average energy consumption per trip within an acceptable uncertainty range. The study of the energy consumption distributions per trip is further used to determine an acceptable SoH limit that correctly indicates the real EoL of EVs.
2. Materials and Methods
The origin of this study comes from the developments done in the EU-H2020 funded SABINA project (
http://sabina-project.eu). The main goal of SABINA is to maximize local renewable energy consumption of buildings by developing a Building Algorithm (BA) that manages the energy consumption of the building. As it might seem awkward to comprehend the relation between buildings and mobility, it is important to dedicate some space to describe the reasons and to show how, with the entrance of the EV, both sectors are getting closer.
SABINA’s building algorithm uses a Model Predictive Controller (MPC) whose main goal is to enhance the renewable energy self-consumption at building level. In particular, the building consists of a 4-floor residential building with one 105 m2 household per floor. Several building scenarios were considered in SABINA and, in one of them, there were EVs that act as an electrical load. In order to achieve maximization of self-consumption objective, the BA has several means of action. First, the building envelope is used to store thermal energy, by performing overheating or cooling using heat-pumps (HP) or chillers. Second, by using batteries, which can be in-house batteries (i.e., fixed) or EV batteries. To control these elements, the MPC self-constructs models of the considered elements. For the thermal behavior of the building, long-short term memory (LSTM) neural networks are used, which are trained by combining data from realistic EnergyPlus models and real data. For the batteries, basic models considering losses are employed. Finally, an optimization problem is posed where the objective function minimizes the total energy exchanged from/to the grid (aiming at maximizing self-consumption), as well as constraints associated with heating, cooling, and batteries. The decision variables of the model related to EV batteries are:
The function model predicts the building state for the horizon H (24 h) considering the state of the building for the past 6 h and where the PV power production is forecasted (W).
Knowing that EVs have a high impact potential on energy consumption of buildings, the MPC acts on the power of the EV charger, while taking into account usage constraints to ensure that the EV is charged with the right amount of energy (or more) at the time of departure (or before). Moreover, the BA adjusts the set-points of the elements (HVAC, batteries, EVs, etc.) in the building regarding the expected generation and foreseen events to maximize self-consumption. Therefore, it is relevant to include a forecasting system that would allow the BA to modify the behavior of such load following smart charge practices. More details of the project can be found in Reference [
15] for those that want to delve into it.
The forecasting of the EV energy consumption in the building has been built taking data from thousands of EV trips and charges around Europe resulting from the Green eMotion FP7 project. The project count on 8 municipalities, 4 car manufacturers, 3 EV technology institutions, 5 industries, 10 utilities, and 12 research centers to implement different demonstration sites with a large number of EVs of different models (including buses) and batteries. From all the data available, this study considers only the data from cars, which counts on information about the trips and the charges done. In particular, this study analyzes the EV charges instead of trips, as several small trips could come one after the other without any charge between them and because EV charges give more accurate information of the real needs of EVs and of what to expect from a building energy consumption perspective. All the data analysis is carried out using R software (V 3.5.2).
The study analyzed four EV charging parameters to decide which one provided more trustable and realistic information to facilitate the forecasting of the energy demand of the vehicle in the building:
Charge duration
Initial State of Charge (SoC)
Energy of the charge
Charge ratio, understood as the total amount of energy divided by the duration of the charge.
EV charge duration indicates the time needed per charge. Nonetheless, it is hard to find the reasons for charge termination. It could be either that the charge is complete or that there is a need for a sudden trip and it is stopped in the middle of a charge. Moreover, it gives less information on the amount of energy needed per charge, as charges at high SoC perform slower than charges at low SoC.
Similarly, the initial SoC does not gives information on the end of charge, that is, the charge could finish at 100% SoC or lower. This issue can be easily corrected by having the final SoC and taking the difference. However, that would require the capacity of the battery to also be known. If the BA could effectively know the EV model, battery capacity, battery aging and its consequent loss of capacity, it would mean that the error in the charge energy estimation would increase over time. Furthermore, it should be noted that the SoC is an estimated parameter and, although its accuracy is improving with recent research in the field, relying on it means assuming an uncertainty from the very beginning.
Contrarily, the energy accumulated from each charge eliminates the uncertainties of previous parameters. It is true that it gives no information on the final SoC, so it is difficult to know if the charge is completed or if, as it happens with the duration of the charge, the EV is unplugged prior to fully charge the battery.
Finally, the charge ratio gives an overview of the amount of energy delivered per hour. It is useful to know if the charge takes place at high SoCs (lower values) or if a fast charge was performed. However, it is impossible to extract the amount of energy per charge, which is the most valuable parameter from a building perspective, similar to what occurs with the charge duration mentioned in the first place.
The BA has a module that studies and forecasts stochastic events in the building it controls, such as the arrival or departure of an EV. The BA assumes, with a confidence range, the available amount of time in which the EV is plugged-in. Having that, and after analyzing the results of all the mentioned parameters (see results and discussion section), the most interesting parameter to count on for our purpose is the amount of energy per charge.
Once decided that the energy of the charge is the parameter to look at, the EV charge information is decoupled by hours to determine similarities between charges among hours using Kruskal Wallis Test. Having that, it is possible to group the intervals according to the distribution of the amount of energy per charge. This process results in 6 clusters of plug-in hours based on the charge events. Then, it was possible to obtain representative mathematical distribution of the EV charges in relation to the hour when the EV was plugged-in.
This charging distribution is then used by the BA to prepare the building for the expected charge having, in advance, a forecast of the arrival hour and the amount of energy to be charged. Moreover, as the BA also estimates the hour when the car will be disconnected, it can modify the power set-points of the charger to increase the overall benefits of the building.
Moreover, these distribution functions are then related to the available energy of EV batteries at the EoL, that is, when batteries in EVs reach 80% SoH to determine the number of times that the EV would not comply with the mobility needs. As the capacity of batteries change among EVs, this study analyses the impact on 16, 24, and 30 kWh batteries, which are the most common capacities among commercial non-luxury EV. The evaluation will even go deeper in the EoL analysis, by calculating what would happen if the SoH at the EoL is defined at lower values, such as 70% or 60%.
3. Results
This section puts the attention in the analysis of the real amount of energy per charge, which is the parameter that provides a clearer picture of what really occurs in EV charge distributions.
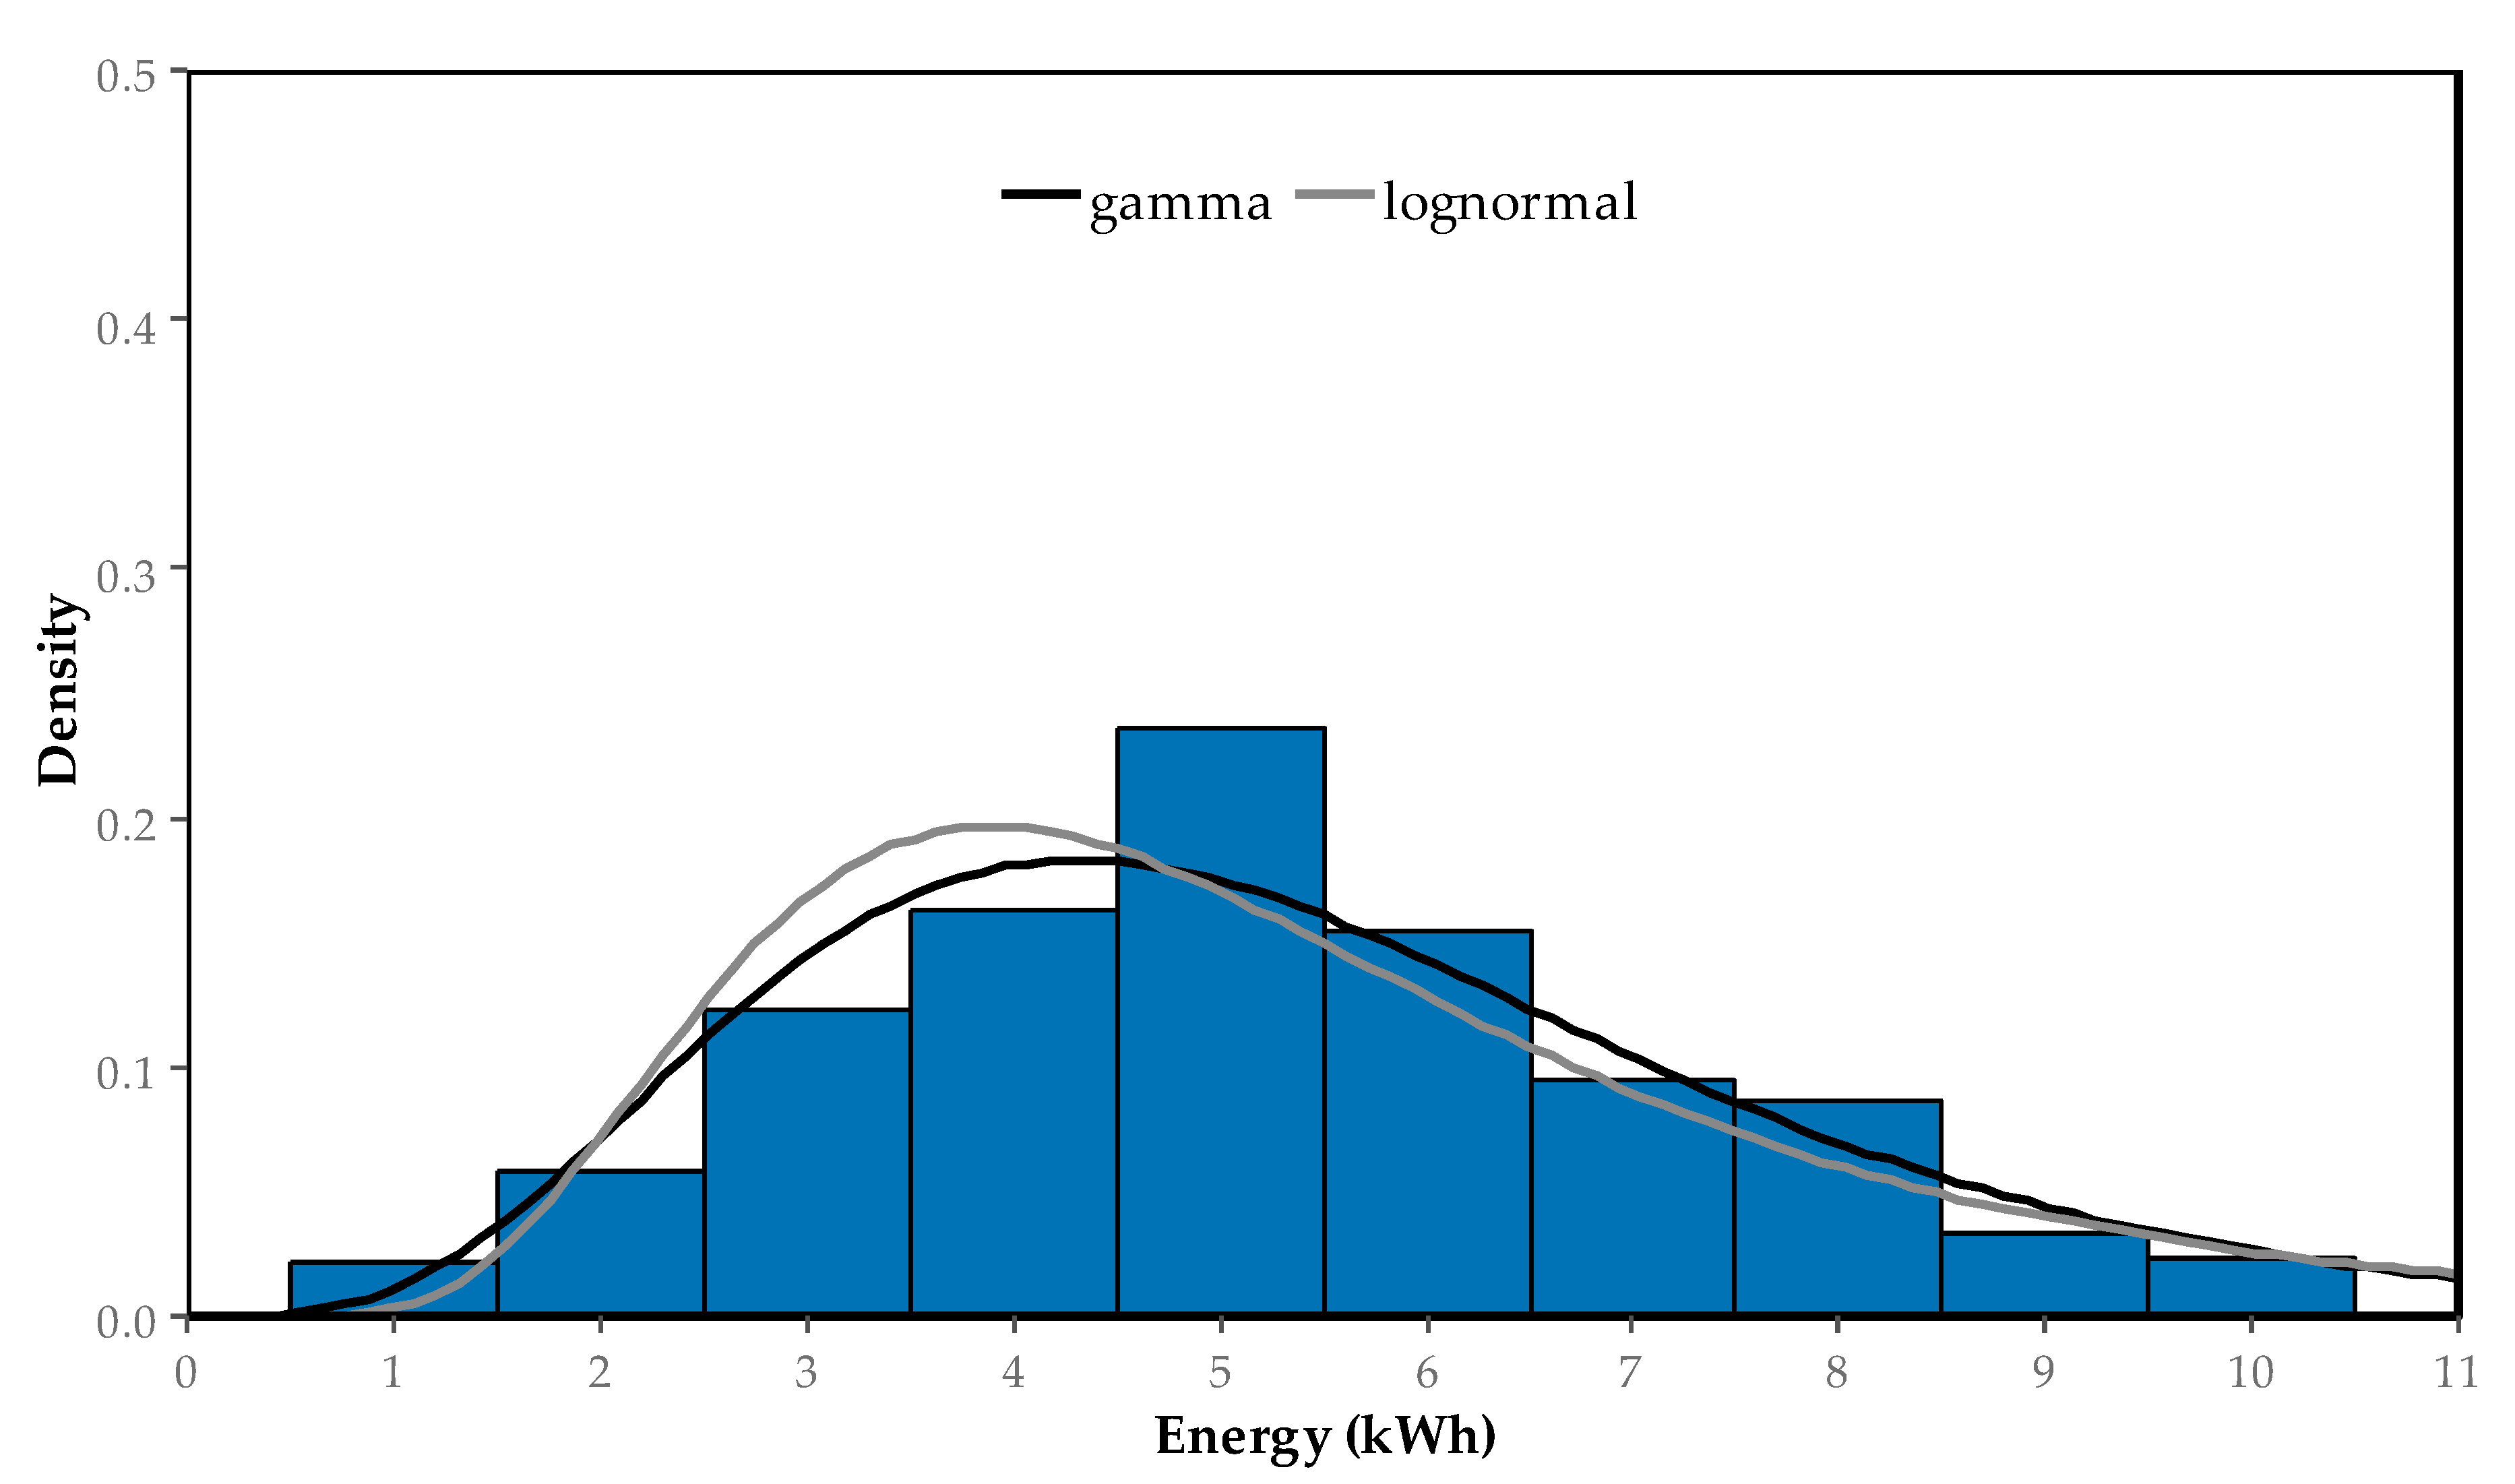
Taking a look to the energy per charge of all the charges together (
Figure 1) it can be seen that data do not follow any parametric distribution, such as gamma, lognormal, or normal distributions (the latter is not presented in the figure as it would show negative values which are impossible to occur in reality). In fact, neither of the parametric distributions can correctly represent the peak or the tail.
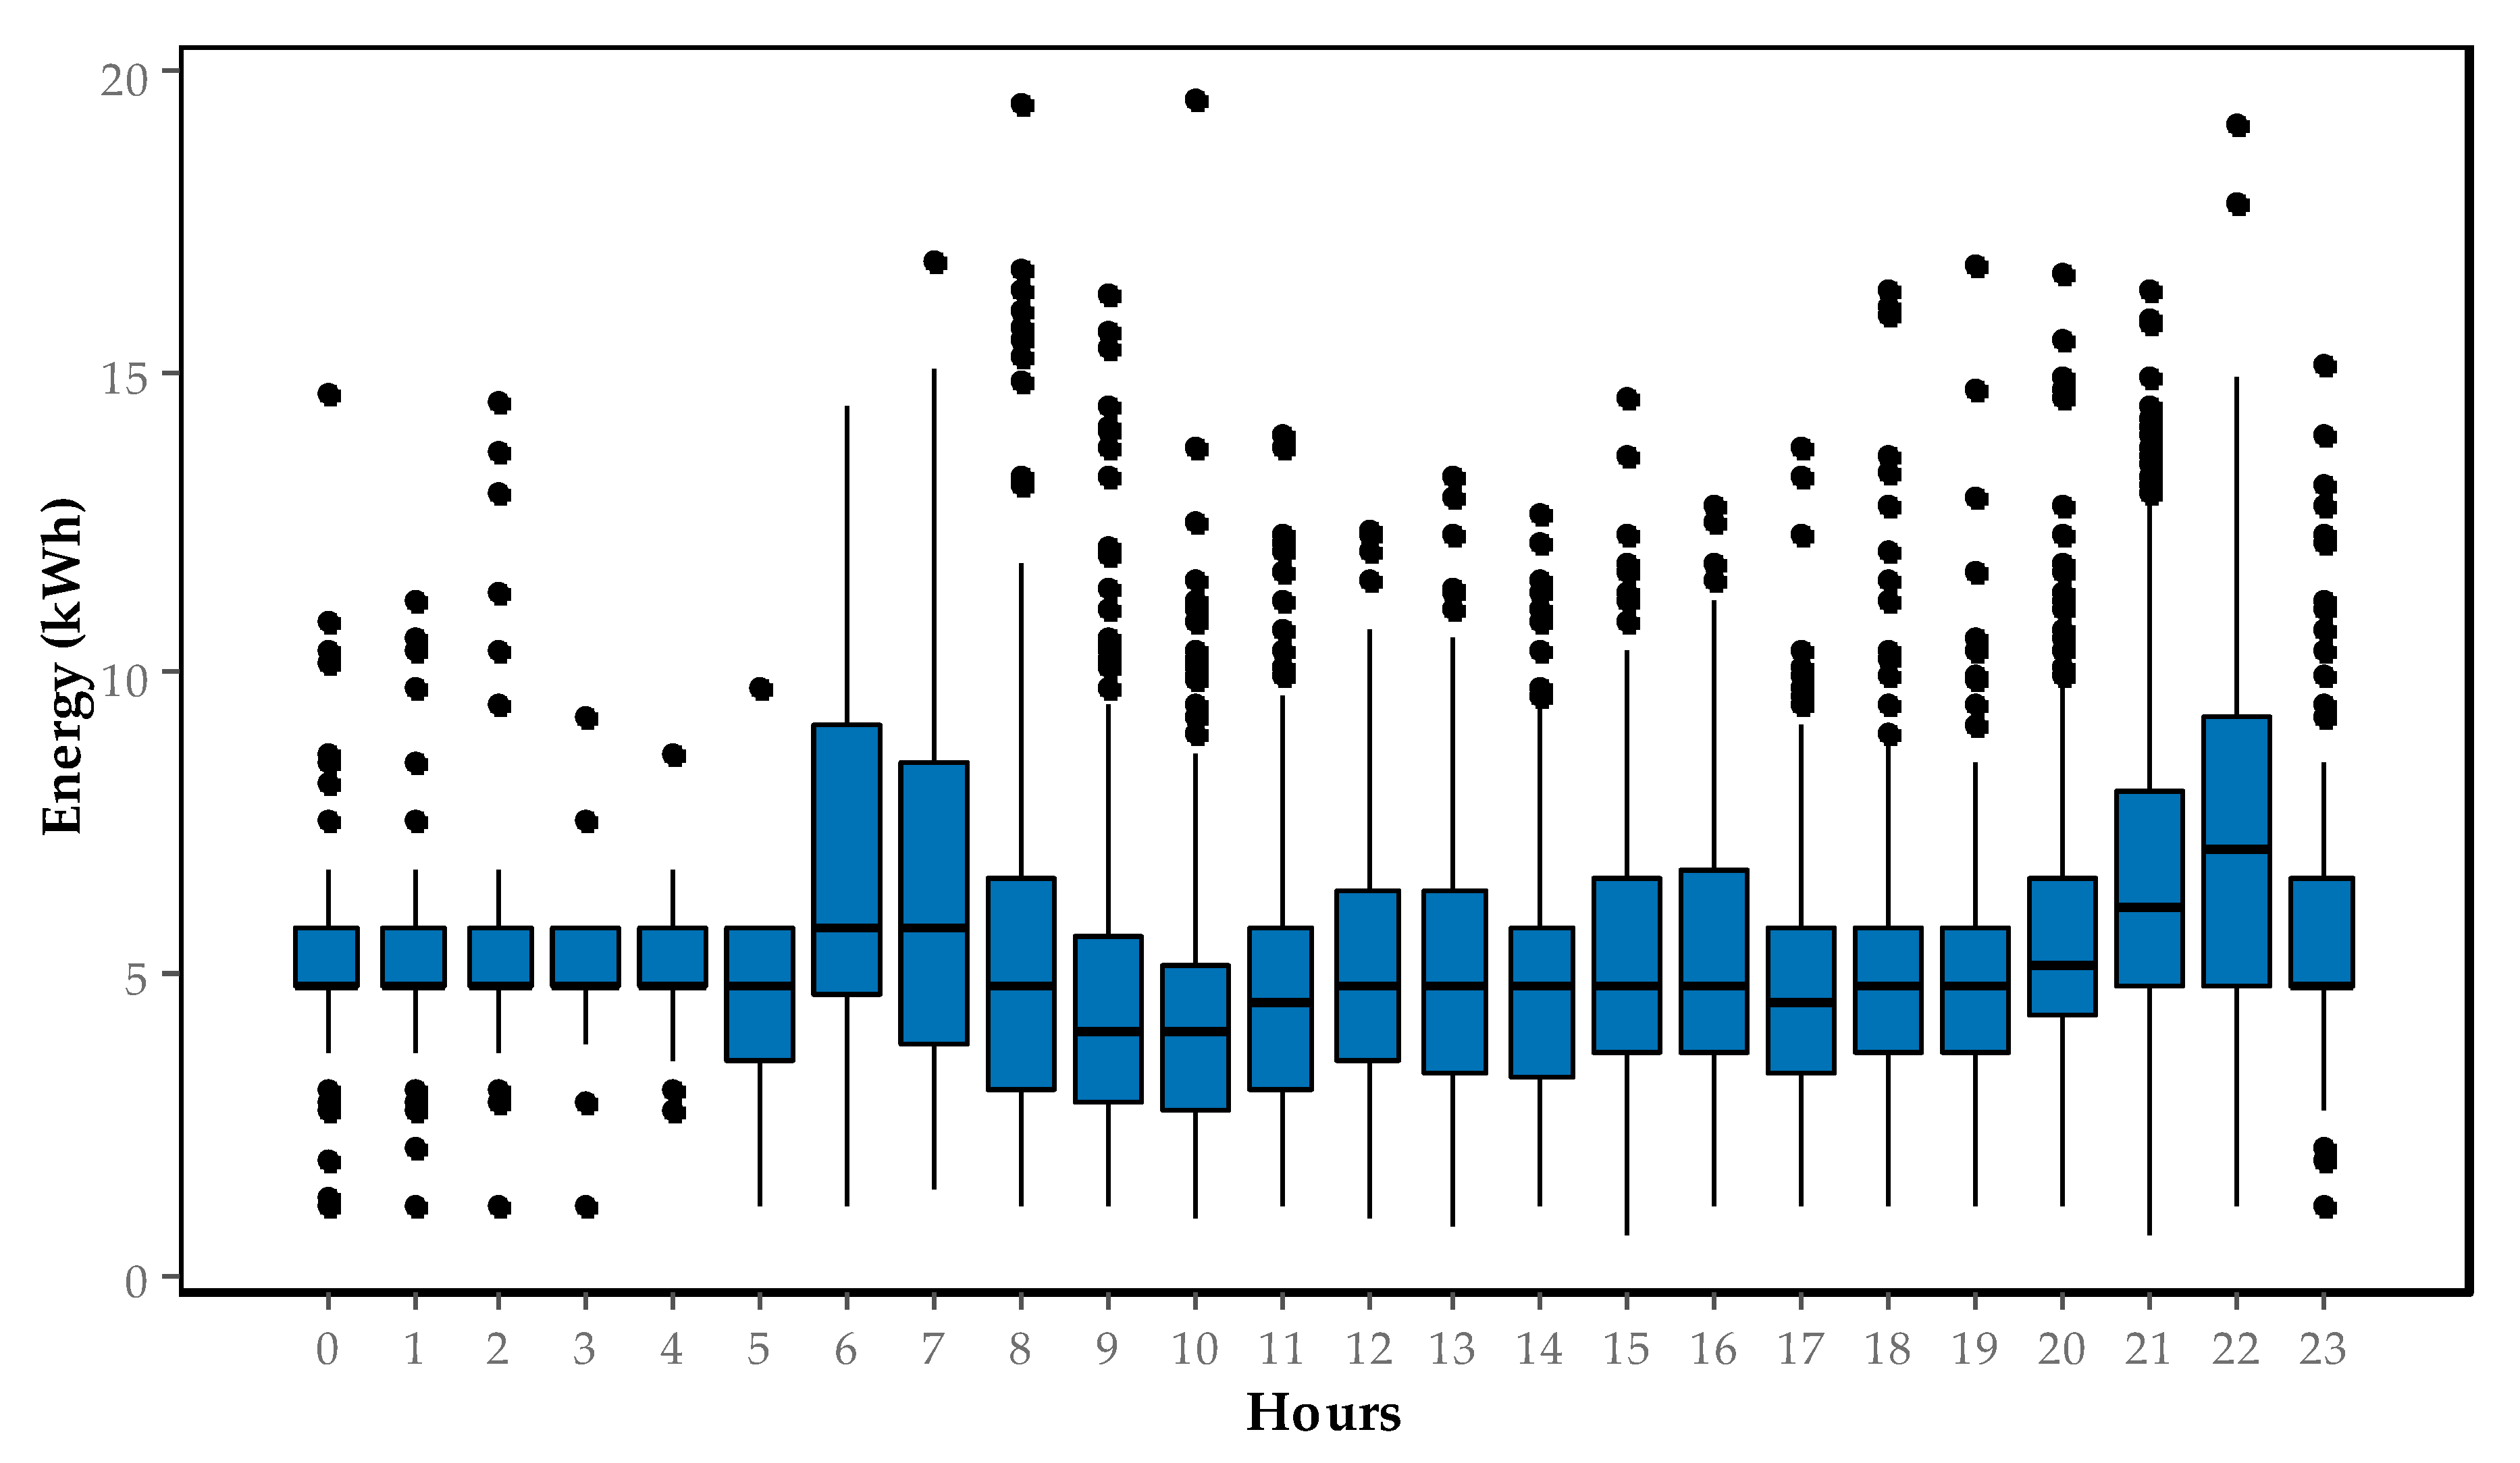
Aiming to obtain representative parametric distributions, the study began an analysis of the data hour by hour. The statistical analysis showed that the hours with fewer charges are those at late hours in the night (from 0 to 6), while at dawn or during the hours at the beginning of the night were those when more charges started. Differences in the central values (median) and dispersion of the amount of energy per charge distribution per hour are visible in the boxplot shown in
Figure 1. However, it already shows that most charges concentrate around 5 kWh and only a few of them go beyond 10 kWh. The minimum median in energy per charge is found between 9 and 10 in the morning (coinciding with the shorter charges) and the maximum median amount of energy charged on EVs is found at 22 h.
Figure 2 already anticipates the hours in which, presumably, battery charges behave in a similar manner. However, this EV charge distribution grouping should be confirmed following statistical methods, such as the Kruskal–Wallis test. With that, hours having similar distribution were grouped based on the significant differences, passing from 24 lots (one per hour) to only 6. Thus, hours were grouped as follows:
Group 1: 9 and 10 h;
Group 2: 8, 11, 13, 14, 17, and 19 h;
Group 3: 12, 15, 16, and 18 h;
Group 4: 20 and 23 h;
Group 5: 21 h;
Group 6: 22 h and from 0 to 7 h in the morning.
It is important to note that there were too few data during late night hour charges to have a reliable population and they were added to group 6. Moreover, note that the distribution of charges per group (
Table 1) is quite homogeneous. Although group 2 is the one having higher number of charges in comparison to the others, it is also the group that has more hours in it.
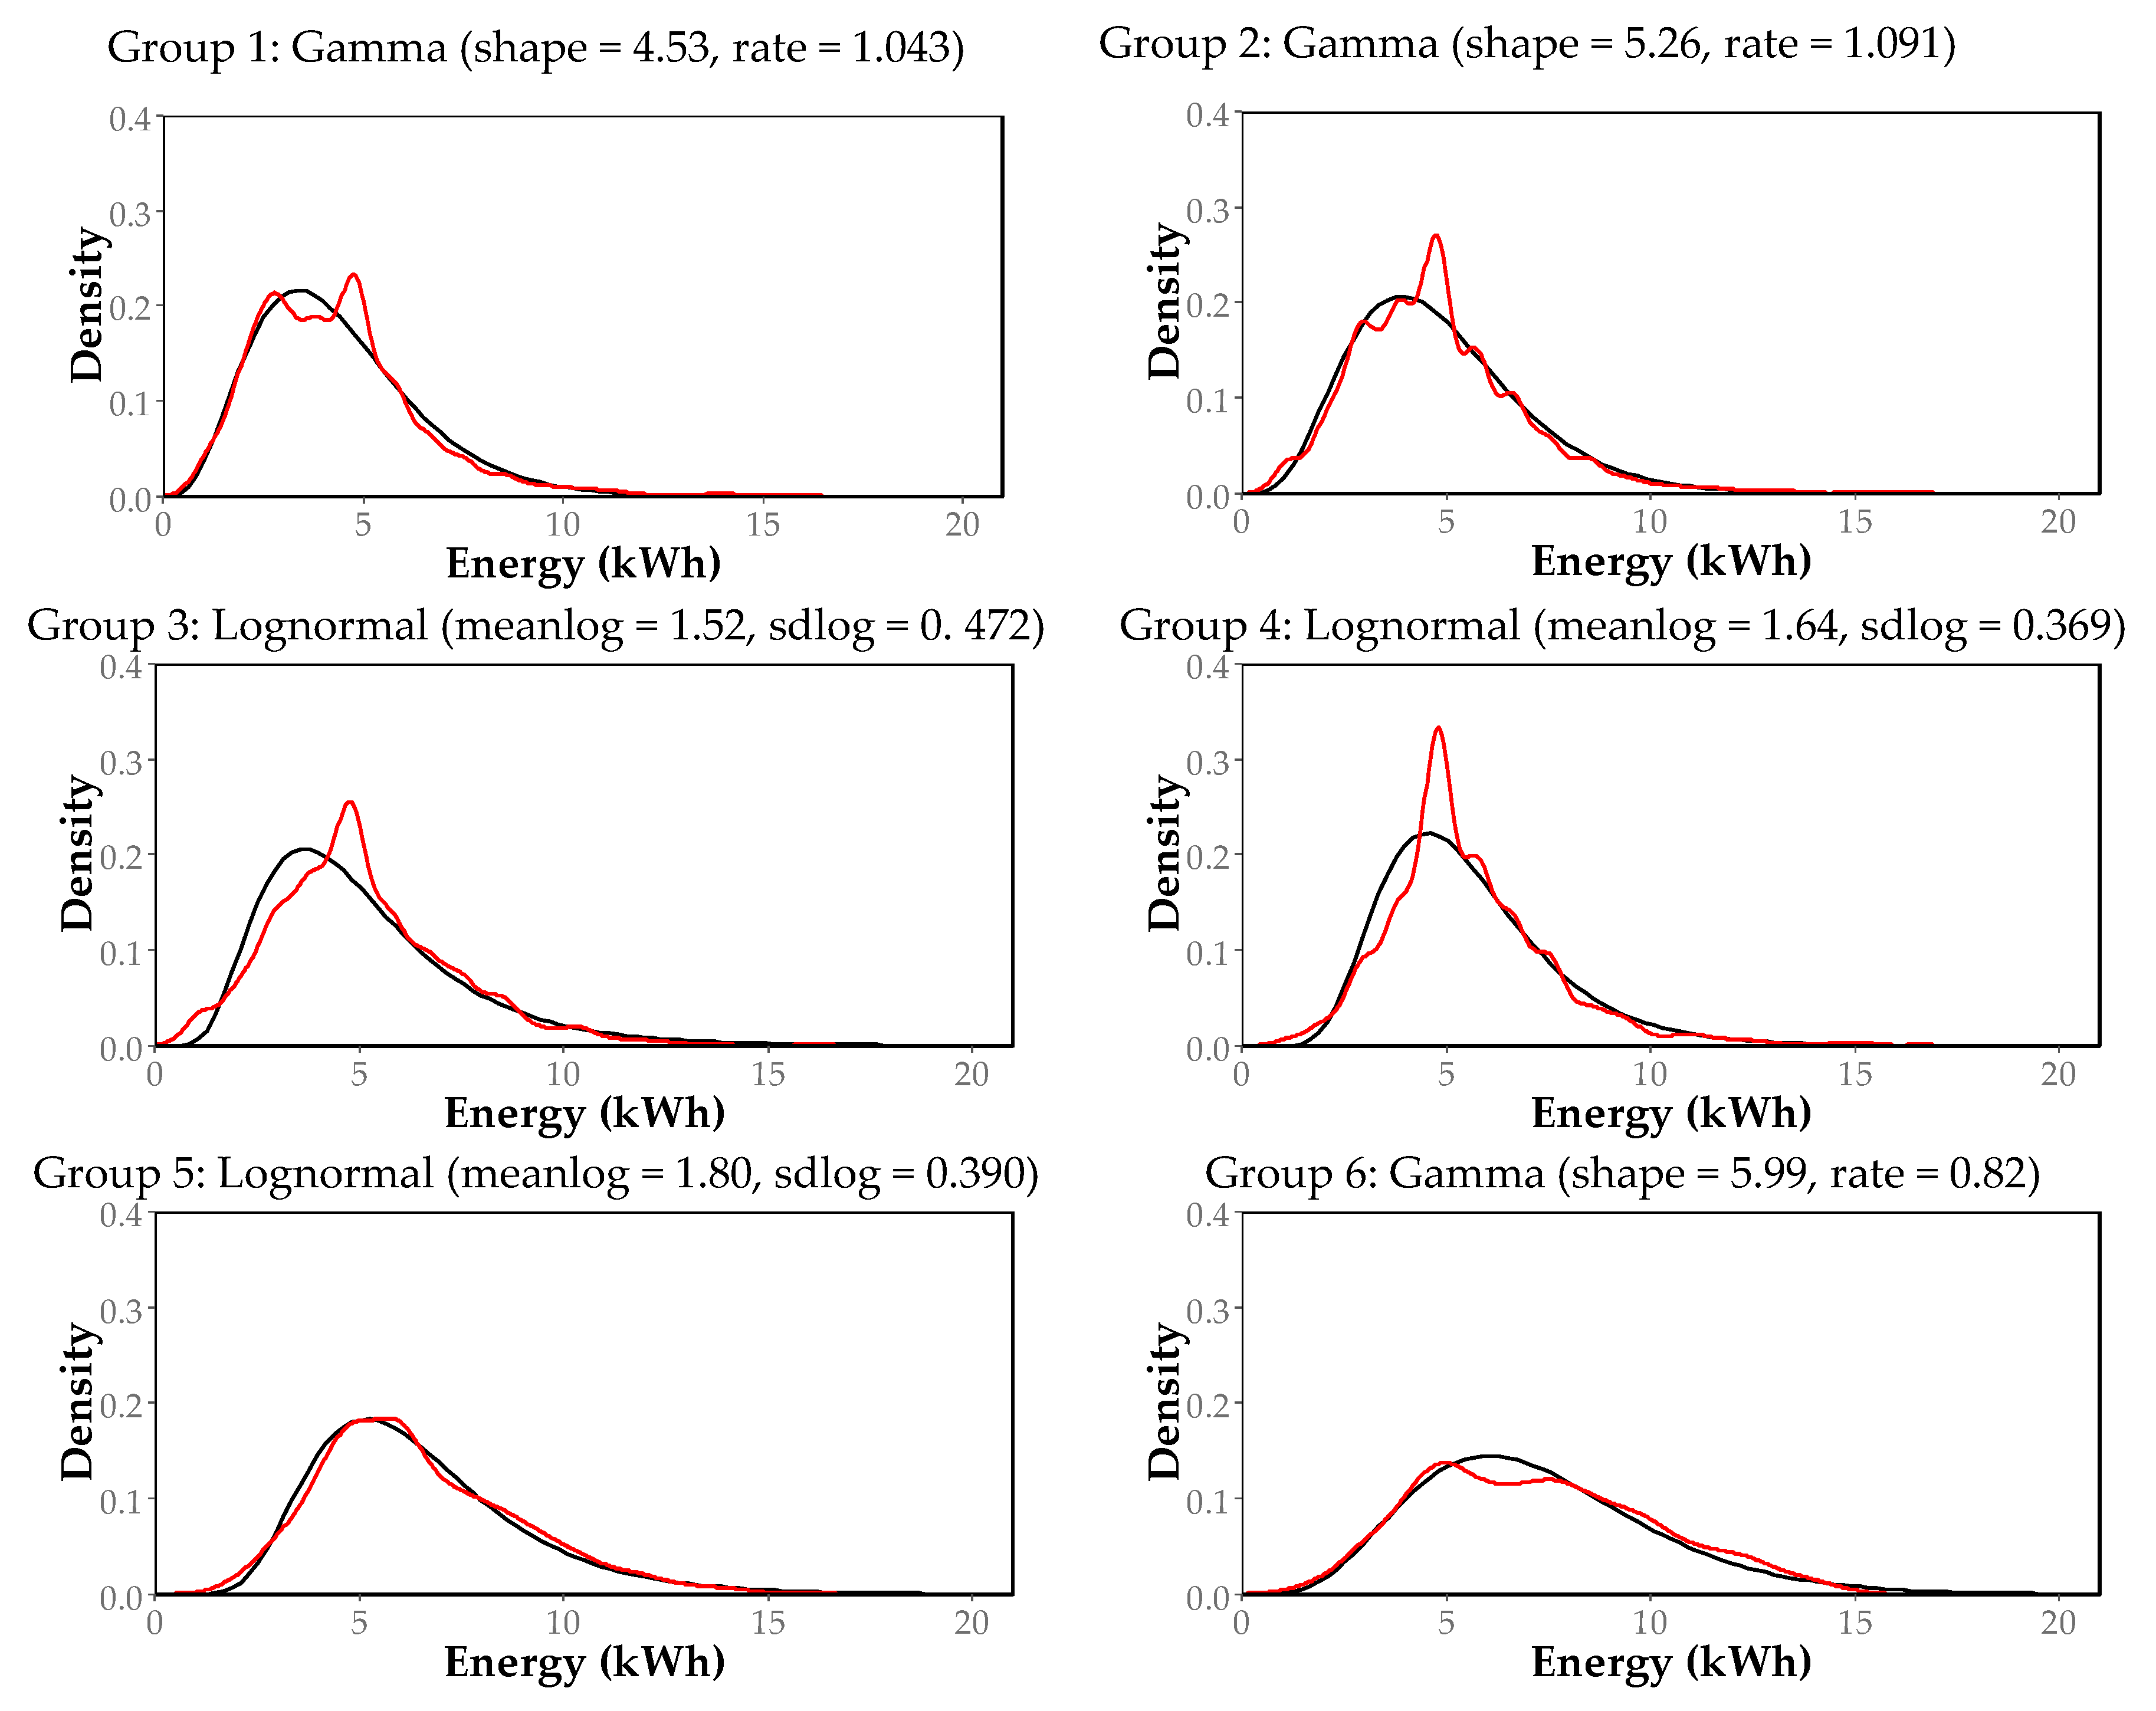
The statistical analysis of these 6 groups separately served to obtain the density functions that better fit to the experimental data.
Figure 3 presents an overlapping of the density that real data presents (red line) in contrast with the density function (black line) for each group. Density functions of groups 1, 2, and 6 follow a gamma distribution, while groups 3, 4, and 5 follow a lognormal distribution.
Similarly, in all groups except group 6, there are generally almost no charges beyond 10 kWh. Only in group 6 there is a significant number of charges over this value of 10 kWh, as it is shown in
Table 2 with 8.87% of the trips. However, even within this group, it seems clear that only a very small number of charges take more than 15 kWh.
Additionally, although the study focus is EV charges, the charge density distributions shown in
Figure 3 are a consequence also of the variabilities that determine EV charging energy consumption, such as the effect of driving behavior [
16], temperature, loads [
17], and urban-highway trips [
18] as data is taken from different drivers in different geographical places.
Taking these charging distributions and assuming that the battery EoL is fixed at 80% SoH it is possible to determine if EVs would be capable of meeting the owner’s mobility needs.
To do so, the study first considers more common EV battery capacities, which are around 16 and 24 kWh for first EV models in the market and 30 kWh for models sold since 2017 or 2018. For these cases, at the generally accepted EoL, their available capacity should still be 12.8, 19.2, and 24 kWh, respectively.
Note that, in the first place, the capacity of batteries at EoL of newer EV models (30 kWh) is equal to the capacity of most of the EV models that are nowadays running in our streets (24 kWh).
Table 2 presents the values corresponding to the percentage of charges, derived from the 6 groups of charging density functions, which are higher than the available capacity in the battery at EoL. Note also that it presents the results for different values of SoH at EoL to determine which would be the one that better fits to real driving needs.
Under these circumstances, all EVs seem to perfectly fit the driving needs at 80% SoH. However, when going beyond this point and for EoL fixed at 70 or 60% SoH, the percentage of charges in group 5 and 6 begin to be critical, revealing that around 5 or 10% of the energy needed between charges is higher than the available capacity of the battery (in red in
Table 2). However, these two groups are responsible of 13% and 17% of all charges (
Table 1), which implies that the global percentage of energy needed between charges that fail to comply with the owner’s needs reduces to 0.58 and 1.83% (group 5 and 6 respectively), which makes that, in overall, the percentage of charges that fall short is only 2.5%.
4. Discussion
Some of the advantages and disadvantages of using the different charging parameters to forecast the total amount of energy EVs would need to charge when they plug-in to the building’s premises have been discussed in the methodology section. This first part of the discussion section presents the histograms resulting from the data analysis that confirms the aforementioned situations.
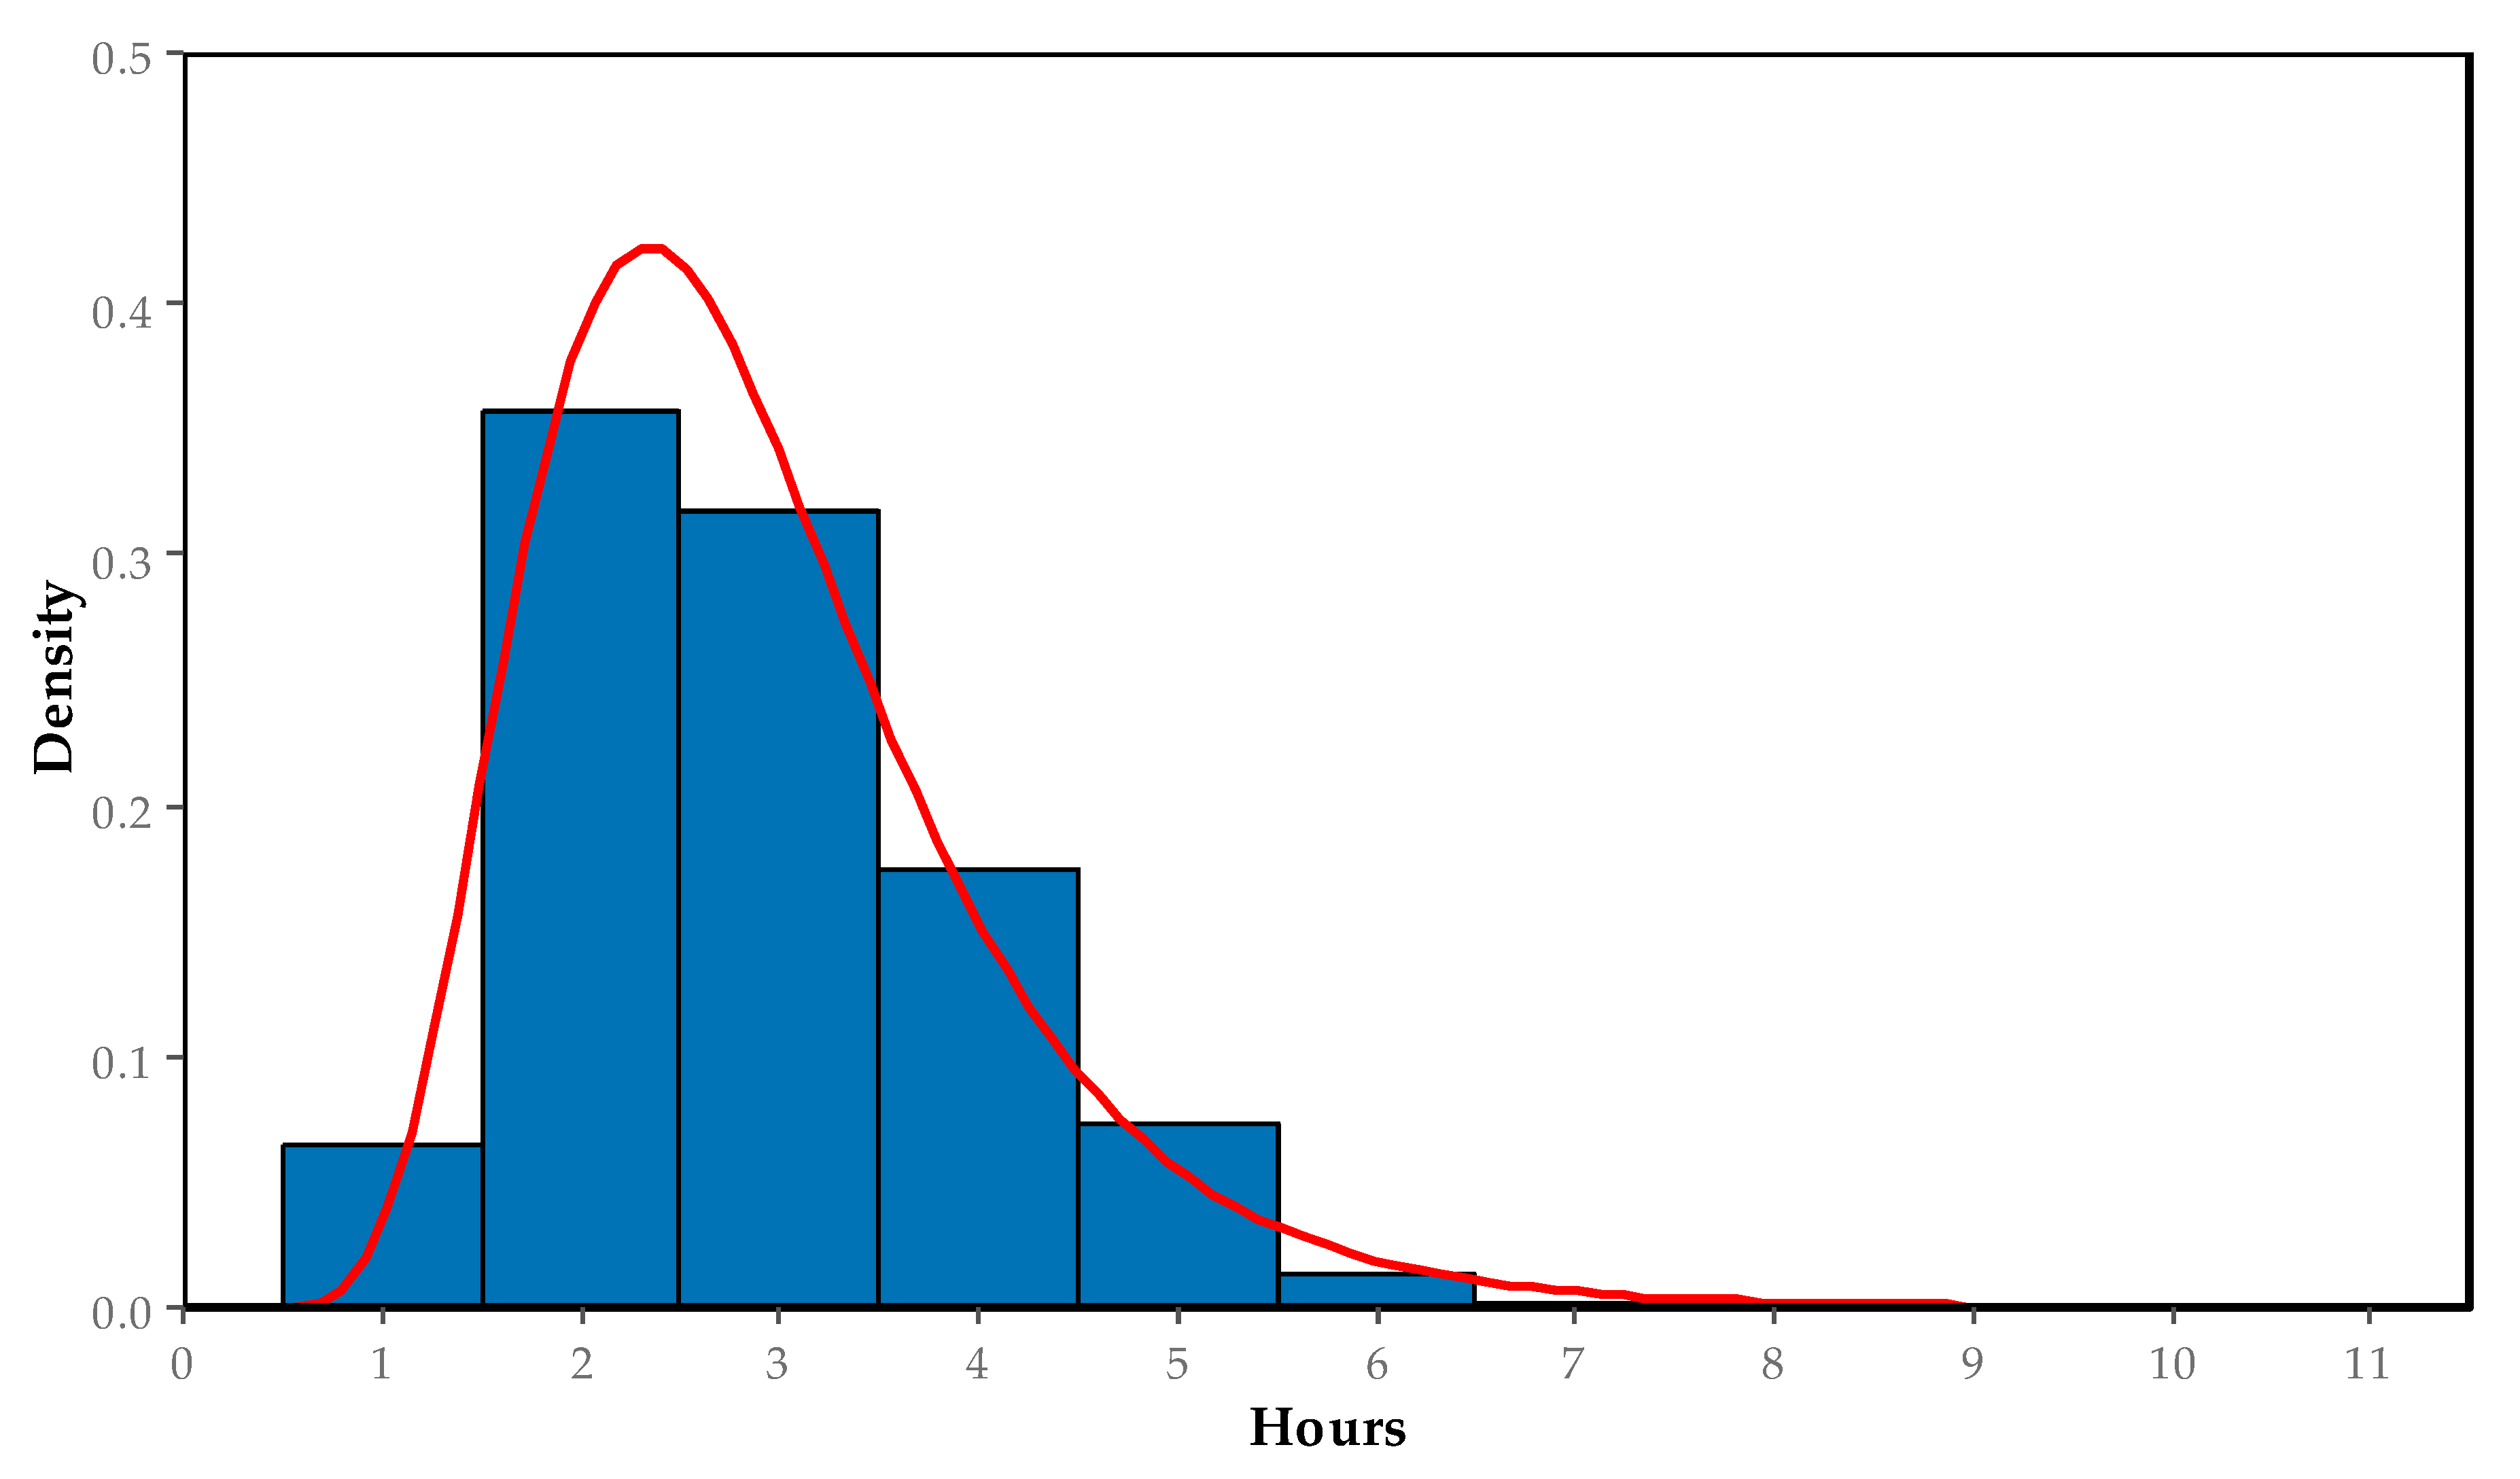
Figure 4 shows the empirical and theoretical density function of the duration of the charges (in hours). It can be appreciated that most of charges concentrate in the range between 2 and 4 h. Knowing that common EV charges work at 3.7 kW maximum power, these results give the idea that most of charges correspond to half battery charges.
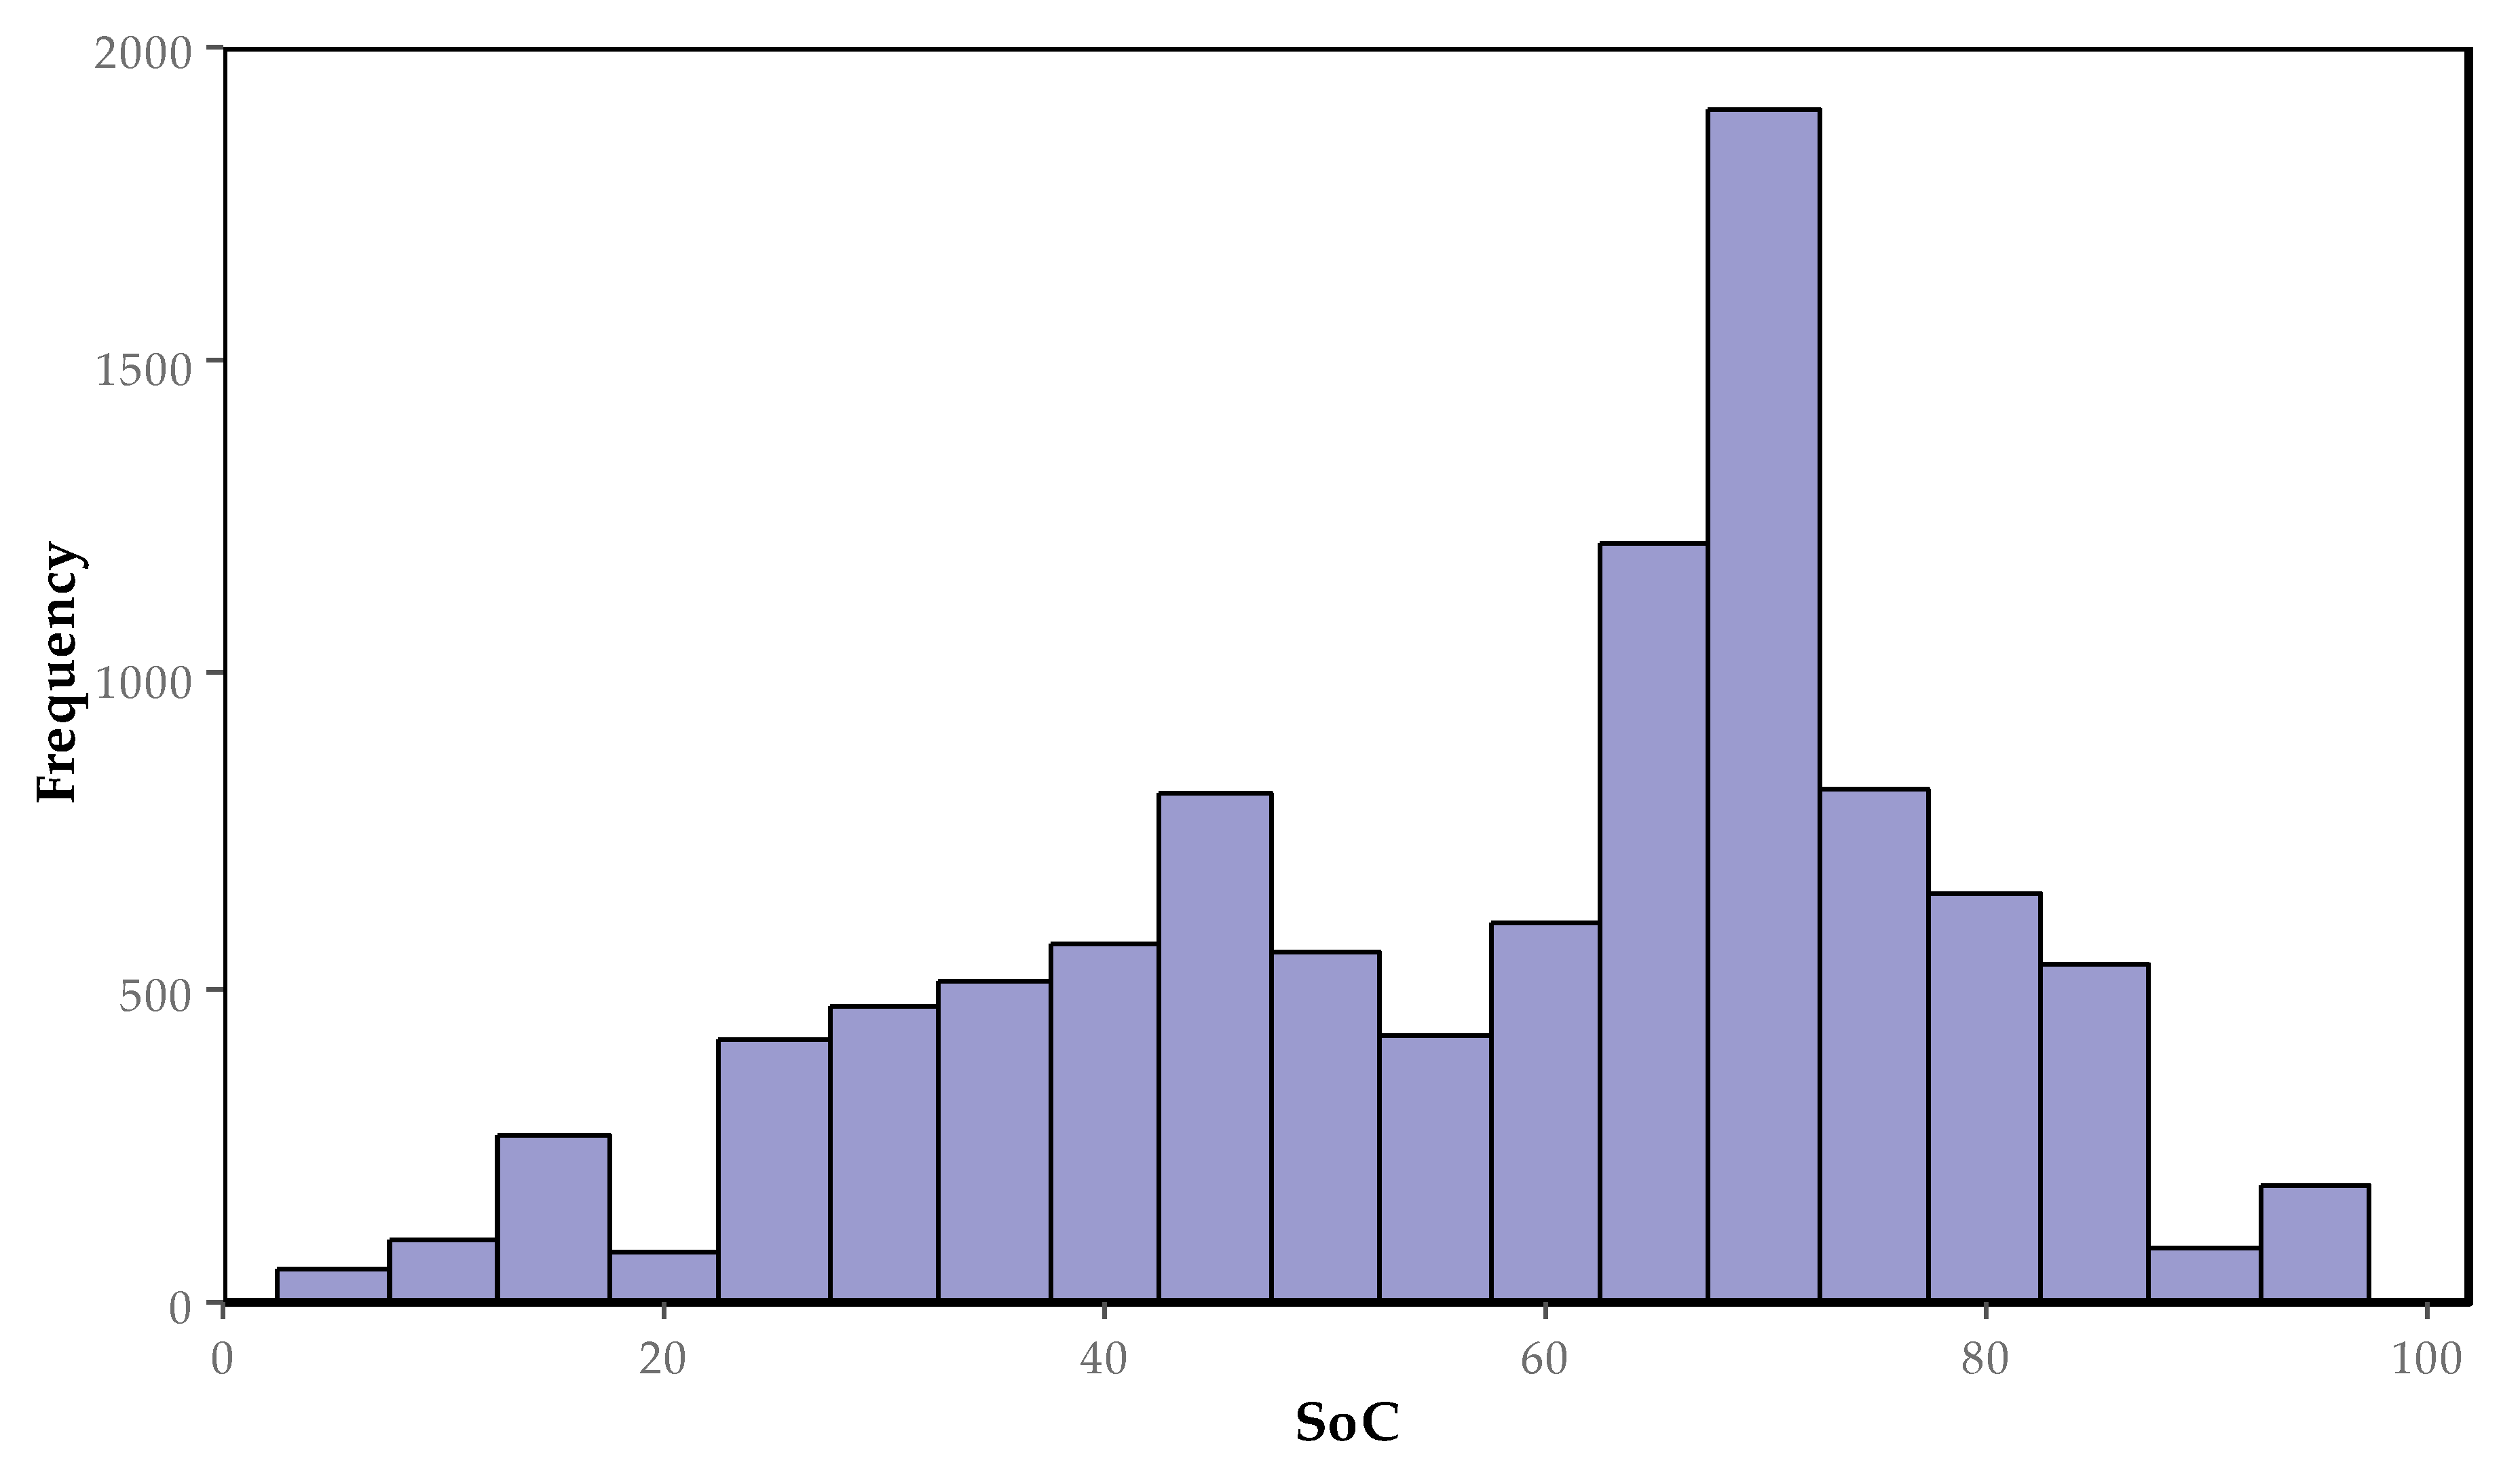
Confirming the previous statement,
Figure 5 shows the initial SoC of the EV battery when plugged-in and it clearly indicates that charges begin, more frequently, at a 70% SoC. That is, the battery has still more than two thirds of its capacity when the car is plugged-in to recharge, leaving a huge amount of unused energy.
Finally, according to the results regarding the total energy consumption per charge, it is clear that they are centered at 5 kWh, indicating that the EoL of 80% SoH might be mostly acceptable for small capacity EVs (16 kWh) having the opportunity to reduce it to less than 70% and even 60% without much effect on daily needs. Note that while these mathematical calculations indicate the percentage of trips that consume more energy than the available capacity in the vehicle when aged, knowing that EV owners are informed by the vehicle of the current SoC of the battery, they are capable to slightly modify their behavior when driving on presumably high consumption trips, reducing substantially the probabilities of being unable to reach the final destination.
On the other hand, for medium and higher capacity EVs (24 and 30 kWh) the 80% of SoH is clearly overestimated because, at that moment, their capacity is even higher than the one from new EVs with small batteries. Therefore, the SoH at the EoL could go even below 60% in terms of capacity without having a noticeable impact on daily mobility as more than 99% of trips are covered with severely aged batteries according to these results.
However, although the capacity decrease does not suppose a limitation in daily electric mobility, there are other aspects that can certainly have an impact on it. One is the exponential increase of the internal resistance of the battery with aging. In fact, the internal resistance at 80% SoH increases only by 20% while at 60% SoH it rises up to 200% [
19], which might suppose additional losses on power and on efficiency. The other aspect is that, beyond the 60% SoH, the chances to fall into the aging knee (a sudden acceleration of battery aging) increase dramatically, shortening considerably the expected lifespan after this point [
20]. These two issues should be another asset to inspect in future works.
From an environmental perspective, knowing that EV LCA should clearly identify the boundary conditions of the study before performing the environmental analysis, the first thing to do is to fix the SoH at the EoL. For instance, if the EoL is considered to be reached at 60% SoH, mileage during the first life should be enlarged to 225,000 km or more, increasing the greenhouse gas emissions of the EV during the use phase by more than 50% but saving the emissions of building new EVs, which can be the principal emission factor depending on the electricity mix of the country where the EV runs. Second, according to the definition of the SoH at the end of the first life in the vehicle, LCA should consider the incorporation of second life applications, as, in some cases, they can offer interesting economic and environmental opportunities [
21].
5. Conclusions
This study performed a statistical analysis of multiple trips of different models of EV in different countries around Europe to extract the distribution of the amount of energy to fulfill daily mobility needs from EV users.
This information is necessary, from the perspective of smart buildings, to forecast the energy needs and to optimize the energy flows. In the case of the SABINA project, where a building algorithm manages energy systems, this information is used to enhance the penetration of renewable energy sources for self-consumption.
Additionally, the resulting information was useful to evaluate the generally accepted value of 80% SOH at the EoL.
The results indicate that the definition of 80% SoH as the EoL of batteries in EVs seems to be statistically reasonable for small battery capacity EVs (16 kWh) only and that it would be possible to lower this to below 70% without significantly increasing the risks for EV drivers. For higher battery capacity EVs, this SoH could be reduced to 60% or below with a high probability that this would not represent an inconvenience to EV owners.
In fact, statistically and considering only the term of capacity fade, it would be even reasonable to go down to a 50% SoH in new high-capacity EVs (30 kWh). However, going below a 60% SoH might risk to enter into the aging knee (acceleration of the battery aging phenomena) and power limitations might be significantly below these values.
These new SoH limits suppose a rethinking of the second life opportunities, as the paradigm changes and it might be no longer possible if EV owners decide to expand the EV battery life down to these values (even if they are out of warranty from car manufacturers).
Moreover, environmental analysis should also consider these changes in the studies, as lower SoH values represent higher mileage at the end of life and they suppose an impact in second life scenarios, which should always be in the scope of critical environmental studies.


