Article

Case Study of Holistic Energy Management Using Genetic Algorithms in a Sliding Window Approach

by
Katharina Minnerup
*,
Thomas Herrmann
,
Matthias Steinstraeter
and
Markus Lienkamp
Institute of Automotive Technology, Technical University Munich, 85748 Garching, Germany
*
Author to whom correspondence should be addressed.
World Electr. Veh. J. 2019, 10(2), 46; https://doi.org/10.3390/wevj10020046
Submission received: 18 April 2019 / Revised: 25 May 2019 / Accepted: 4 June 2019 / Published: 18 June 2019

Abstract

:
Energy management systems are used to find a compromise between conflicting goals that can be identified for battery electric vehicles. Typically, these are the powertrain efficiency, the comfort of the driver, the driving dynamics, and the component aging. This paper introduces an optimization-based holistic energy management system for a battery electric vehicle. The energy management system can adapt the vehicle velocity and the power used for cabin heating, in order to minimize the overall energy consumption, while keeping the total driving time and the cabin temperature within predefined limits. A genetic algorithm is implemented in this paper. The approach is applied to different driving cycles, which are optimized by dividing them into distinctive time frames. This approach is referred to as the sliding window approach. The optimization is conducted with two separate driving cycles, the New European Driving Cycle (NEDC) and a recorded real-world drive. These are analyzed with regard to the aspects relevant to the energy management system, and the optimization results for the two cycles are compared. The results presented in this paper demonstrate the feasibility of the sliding window approach. Moreover, they reveal the differences in fundamental parameters between the NEDC and the recorded drive and how they affect the optimization results. The optimization leads to an overall reduction in energy consumption of 3.37 % for the NEDC and 3.27 % for the recorded drive, without extending the travel time.

1. Introduction

Energy management systems (EMSs) for battery electric vehicles (BEVs) are becoming increasingly important. They can help resolve the conflict of objectives in the design of BEVs, e.g., the powertrain efficiency, the component aging, the comfort of the driver and passengers, and the driving dynamics of the vehicle. Another reason for the rising interest in EMS is the growing importance of autonomous driving and driver-assistance functions. These add another variable to the EMS. At the same time, the computing power of vehicles’ control units has increased, also making EMSs more attractive.
This paper introduces an optimization-based holistic EMS, which is based on a genetic algorithm (GA). Essentially, the paper makes the following contributions:
  • Comparison of real-world drives and driving cycles in regard to the EMS
  • Application of a GA to an automotive EMS
  • Analysis of the optimization results
  • Critical assessment of the use of a GA for an EMS

2. Related Work

This section gives a brief overview of the existing literature on EMSs in BEVs. For a description of the whole electric vehicle and the powertrain, refer for example to [1]. The term EMS can be found within different areas of engineering. An EMS can generally be defined as follows: it is the software that controls the distribution of energy within the respective system. Energy refers to different forms of energy. Some EMSs manage only electrical energy, while others also manage other forms of energy, such as thermal or kinetic energy. An EMS system can either manage the energy flows within one component, the whole system, or a subsystem within the superordinate system. The EMS is often the link between other subsystems. It must be able to influence the energy flows actively during the operation of the system. It can control different parameters in order to accomplish different aims. Typically, one of the aims is to minimize energy consumption. Another might be to minimize component aging. If several aims must be attained, it finds a trade-off between these aims. In some cases, the term is not only used to refer to the software, but also to the hardware, which facilitates the distribution of the energy. In this publication, the focus lies on the software aspect. In automotive engineering it is most often found in the context of hybrid electric vehicles (HEV) and describes the power distribution between the electric machine and the combustion engine.
EMSs for BEVs can be categorized in various ways: The first distinction can be made between holistic and component-based EMS. A component-based EMS manages the energy of one component of the vehicle. This may for example be the battery, the gear box, or multiple electric machines. A holistic EMS on the other hand manages the energy flows for multiple components (the entire vehicle, ideally). Figure 1 shows an example of a holistic EMS. The top part of the figure lists possible requirements that the EMS has to fulfill. In the lower part of the figure, the subsystems with which the EMS has to communicate in order to reach a globally optimal solution are shown.
The second option for distinguishing between types of EMS is by the method that is applied to find the energy distribution [2]. Figure 2 shows this classification. The main distinction can be made between optimization-based and heuristic EMSs. Optimization-based EMSs can be further subdivided into multi-objective and single-objective approaches. “Multi-objective” means that the EMS has several objectives, as opposed to the single-objective approach with only one. For an EMS, the single objective is typically the energy consumption. Another distinction can be made between methods that find the global optimum for the whole drive and methods that only achieve a local optimum. The last distinction can be made between methods that can be used during the operation of the vehicle (online) and methods that cannot be used during the drive itself (offline). Heuristic strategies can be subdivided into rule-based strategies, strategies based on fuzzy logic, and market-based strategies. All heuristic strategies found in the literature could be used online. The classification methodology can be applied for holistic EMSs, as well as for EMSs focusing on one component.
Most of the literature focuses on EMSs for the components of the powertrain. In the following, a brief summary of the existing literature is given. Table 1 gives an overview of the literature on EMSs for individual components and holistic EMSs. The table is sorted by components for which EMS are developed and by the method on which the EMS is based. Here, the main distinction is made between heuristic and optimization-based strategies, as per Figure 2. The optimization-based strategies are divided into those that can be applied online and those that can only be used offline. For the heuristic strategies, two different groups are identified: on the one hand, strategies that are drawn up using the knowledge of an expert; on the other hand, strategies that are based on an optimization procedure. More distinctions can be made in accordance with Figure 2. However, for the sake of clarity, further subdivisions are neglected. In the table, the literature on the following components is collected:
  • Thermal management system: This includes systems that only consider the powertrain and those that combine powertrain and heating, ventilation, and air conditioning (HVAC). The variables are typically the energy that is used for thermal management and the internal states of the system.
  • Hybrid energy-storage system: The considered literature deals with an EMS for storage comprising a lithium-ion battery and super-capacitors. All of these strategies aim to optimize the power split between the two sources.
  • Variable gear ratio: Here, the focus lies on a gear-shifting schedule in order to minimize energy consumption.
  • Multiple electric machines: The literature cited on this row describes EMS for the use of multiple electric machines. All sources focus on optimizing the power split between the machines.
  • Variable voltage: Here, the EMS for the variable intermediate circuit voltage is considered. Only one source is found that focuses on the EMS and not on the overall system. The reason for this is that the optimal voltage for the machine can be computed analytically. Therefore, the focus is on the modeling of the machine.
  • HVAC: HVAC constitutes the second largest energy consumer. Therefore, it provides leverage for the EMS. The variable that is adapted is the power consumed by the HVAC. In addition to the energy consumption, the thermal comfort of the passengers is taken into account.
  • Driving strategies: Here, the literature on the development of driving strategies aiming to minimize energy consumption is cited. This is achieved by adapting the velocity profile.
Even without going into further detail regarding the content of the cited sources, it is evident that optimization plays an important role in the field of EMS. A large proportion of the heuristic strategies is derived from optimization. Moreover, the table reflects that the goal of most authors is to design an online EMS. In the last row of Table 1, two sources on holistic EMS for BEV are cited. As these are most relevant for this paper, they are described in more detail than the EMS for the individual components. In his dissertation, Basler [3] described a holistic EMS that aims to optimize the range, the vehicle dynamics and the thermal comfort of the passenger. In order to do that, the torque, the total power consumption and the power for acceleration are restricted. This author thus used optimization in order to design a heuristic strategy that can be used during the operation of the vehicle. Additionally, the author designed an optimization-based online strategy to divide the torque between two machines. The target of this thesis was to provide a thorough analysis of EMS and to draw up a strategy that can be used during the operation of the vehicle.
In his dissertation, Suchaneck ([36]) also drew up a holistic EMS. It influences the power consumed by the auxiliary consumers, primarily the HVAC, and uses recuperation for braking. The objective function comprises the range, the battery aging, the thermal comfort of the driver, and the longitudinal dynamics of the vehicle. The author uses stochastic dynamic programming and Pontryagin’s minimum principle. Both approaches are optimization-based and implemented for online application. Neither of the two authors simultaneously optimized the velocity and the HVAC.

3. Basics of Multi-Objective Optimization

In the following, the basics of multi-objective optimization relevant for this publication are introduced. Two different approaches to multi-objective optimization exist: a priori and a posteriori methods [37]. The difference between them is when the decision-maker chooses the desired point in the Pareto front. In an a priori method, the decision is made before the algorithm is started. For example, this can be done by devising a fitness function that assigns weights to the objective functions. When using an a posteriori method, the algorithm first comes up with the Pareto front, then the decision-maker decides on one solution. For this publication, only a priori methods are considered. This is done because for an EMS, the final goal is online use. This is not possible with an a posteriori approach as the input of the decision-maker is needed after the optimization is run. In contrast to this for an a priori approach, the involvement of the decision-maker is completed after the design process. Moreover, a priori approaches have a shorter computation time.
In order to compare several objective functions f i that contribute to a global optimization function F ( f i ) , an approach based on the compromise optimization method is used [38]. During optimization, the different objectives f i are normalized within the range [ 0 1 ] by applying Equation (1). When an upper constraint is violated (e.g., f ˜ i > 1 ), a penalty is applied, putting linear pressure on the fitness values, in order for the individual to become feasible again [39,40]; see Equations (2) and (3):
f ˜ i = f i f i , U f i , N f i , U
f ¯ i = f ˜ i + f ˜ i p e n
with the operator · p e n being defined as:
· p e n = 0 , if constraints fulfilled p e n a l t y ( f ˜ i ) , if constraints violated
f i , U describe the utopian curves, i.e., the best possible curve or value the objective i can assume during a driving cycle. These can be calculated independently of each other [37]. The worst physically possible values are called nadir points f i , N . In this approach, the nadir values are set to objective function values obtained by applying a conventional controlling policy π of the BEV’s variables, to force the used multi-objective optimization algorithm to find the global optimum. Finally, the f ¯ i defines the sum of the normalized objective values of a single objective function including its penalties for violating a constraint.
The weighted sum method lets the decision-maker assign his/her priorities θ = ( θ 1 θ m ) to the single objective functions f i resulting in F ( f i ) described in Equation (4):
F ( f i ) = i = 1 m θ i f ¯ i
with i m θ i = 1 , where the index m denotes the number of objective functions f.

4. Approach

For this publication, recorded real-world drives were optimized. The drives were generated at the Institute for Automotive Technology at the Technical University of Munich. A detailed description of the selection and measurement process, as well as an analysis of the data, can be found in [41]. The route was chosen to reflect a typical commuter drive. Thus, it is representative of the typical use case of an electric vehicle. Additionally, the NEDC is considered as a standardized driving cycle. As it represents a well-known test procedure, it provides a point of reference and ensures comparability with other studies.
For both driving cycles, the target velocity v x , t a r ( t ) was transformed into v x , t a r ( x ( t ) ) . Consequently, the velocity was expressed as a function of the current position x ( t ) . Idle times Δ t n , i d l were extracted from the speed profiles v x , t a r ( t ) and added during calculation of the fitness function’s value F ( f i ) gained from simulation when an idle position x ( t ) n , i d l (according to the driving cycle) was reached. Figure 3 depicts how the NEDC was transformed from a representation of v ( t ) to a v ( x ( t ) ) . For v ( x ( t ) ) , the stop times are no longer visible, because every x ( t ) has to be associated with a single v ( t ) . This combination of time and spatial dependency makes the optimization of real-world trips feasible: The power of the HVAC P h e a t is primarily dependent on the time t, while the velocity in a real-world trip depends on the traffic situation and other landmarks such as traffic lights, which are dependent on x. Therefore, v ( x ) must be optimized instead of v ( t ) .
Using a GA, the goal was to minimize the deviation Δ T c a b ( t ) from a desired cabin temperature T d e s ( t ) . Moreover, the accumulated energy demand E b a t ( x ( t ) , t ) resulting from the vehicle’s total power requirement P b a t ( x ( t ) , t ) and the total driving time were minimized t c y c .
In order to do so, the power P h e a t ( t ) of the HVAC unit can be varied between 0 and 5 kW, and the vehicle’s velocity v x ( x ( t ) ) can be varied within the range of 10% on an urban road and 30% on a highway, compared to the baseline of the driving cycle. This distinction is made under the assumption that larger speed variations are tolerated on the highway. On urban roads, however, the velocity must be closer to the target velocity.
For each of the stated target values ( Δ T c a b ( t ) , E b a t ( x ( t ) , t ) , and Δ t ), a single objective function f i is defined according to (5)–(7):
f T = | T ( t ) T d e s ( t ) | d t Δ t c y c
f E = P b a t ( x ( t ) , t ) d t
f t = Δ t o p t
with Δ t c y c defining the simulated timespan of the driving cycle and Δ t o p t being the time taken for the optimized speed profile to reach the destination. Δ x c y c is the accumulated driven distance.
The results of the objective functions f i were obtained by assigning time-series- and spatially-discretized data to a BEV simulation. The simulation model was implemented in MATLAB/Simulink 2016b and was parametrized to represent a VW eGolf. Implementation and validation were done at the Institute of Automotive Technology and published in [42]. For the optimization, the model was implemented to be run in parallel.
To ensure comparability among the single objective functions f i , they were normalized using Equations (1)–(3) discussed in Section 3. f t was divided by Δ t c y c to normalize it. Finally, a single fitness function value F ( f i ) resulted by taking the decision-maker’s preferences θ into account (Equation (4)). The result was a single optimized parameter set π ( x ( t ) , t ) instead of a Pareto front.
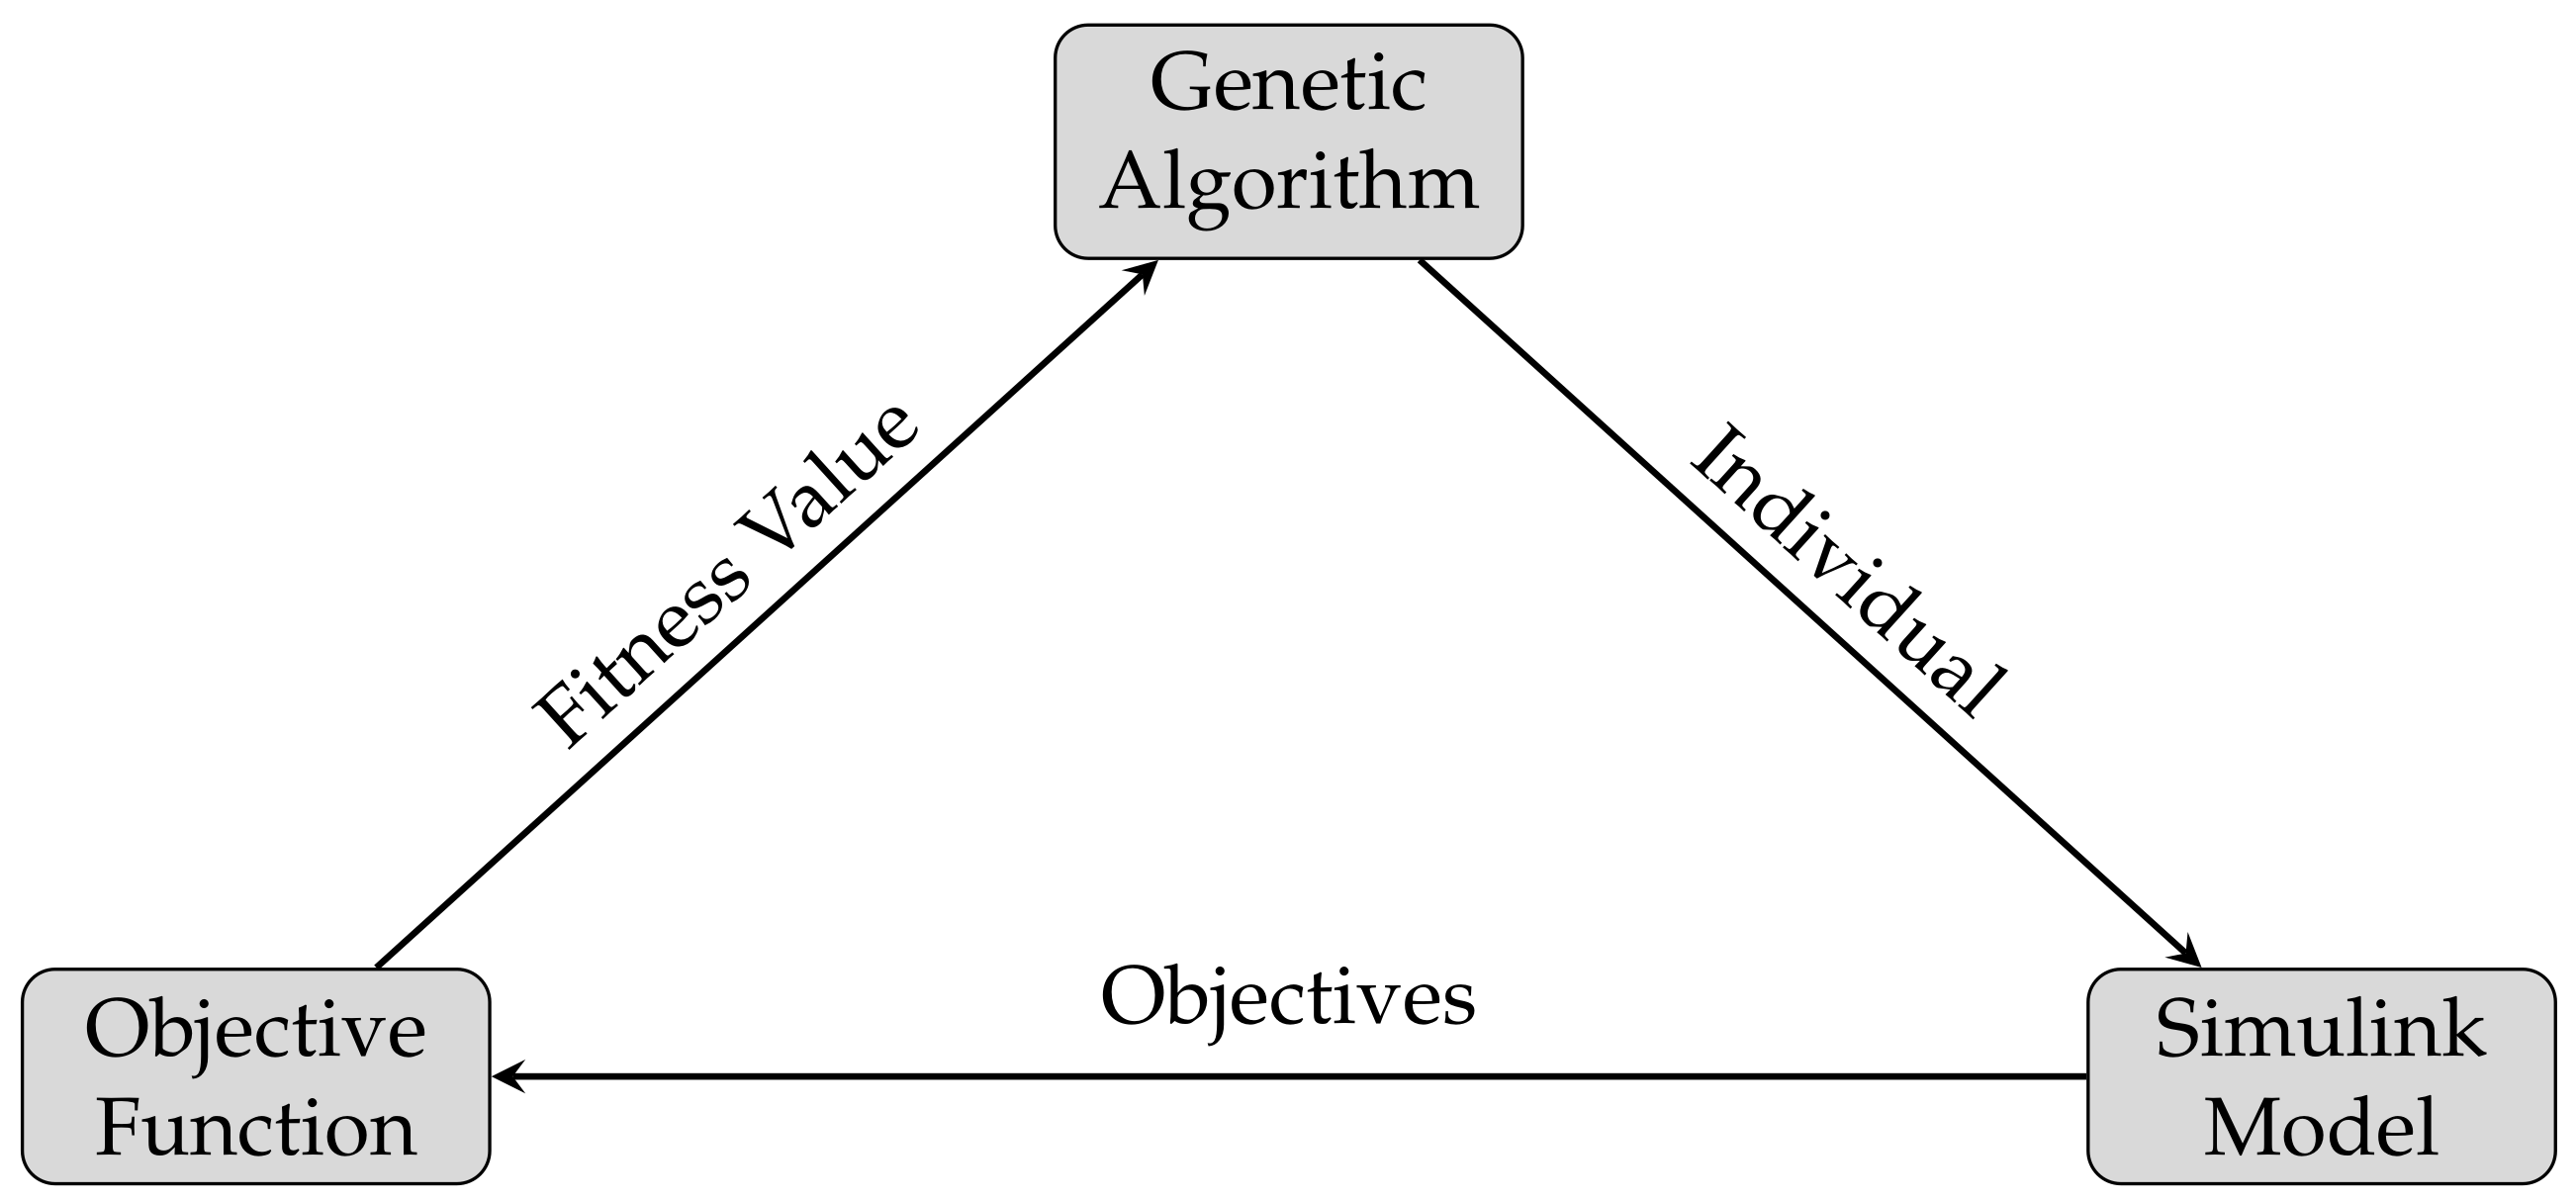
Figure 4 shows how the optimization and the simulation model interacted with each other. The GA supplied the powertrain model implemented in Simulink with an individual. For this individual, the objectives needed for the objective function were computed. Next, the overall fitness value was computed using the objective function. This was used by the GA to evaluate the individual.
The strategy described above can be used to develop a global optimization policy π ( x ( t ) , t ) for the whole driving cycle. However, it can also be adapted to the sliding window approach. For the sliding window approach, the driving cycle was subdivided into sections l = 1 , , L . Each section l was optimized separately with the same approach. A new section started at each position where the vehicle stopped. Consequently, an optimization policy π l + 1 ( x ( t ) , t ) was only computed for the section l + 1 immediately ahead. This shortened optimization horizon means that it was very unlikely that a global optimum for the entire test drive would be found. With the smaller prediction horizons, the computation times were reduced. This approach was the first step towards the integration of the optimization-based EMS into a vehicle, because it became feasible to optimize the driving cycle section l + 1 ahead while traveling the distance of the current section l.
The GA was parametrized as shown in Table 2. The population size was adapted to the number of parameters that were optimized per section l. The total distance in x and the driving time per window l determined the number of parameters to be optimized.

5. Results

This paper presents the results from optimizing a recorded drive, as well as the results for the optimization of the NEDC. For all optimizations, the sliding window approach was used. The results from a global optimization can be found in [44].
For all experiments, the temperature of the environment was set to T e n v = 10   ° C and the desired cabin temperature to T d e s = 22   ° C . The vehicle was preconditioned to T s t a r t = 18   ° C .
In Table 3, different optimizations are summarized. The results for different decision-maker priority vectors and different driving cycles are listed. The table illustrates that the decision-maker priority vector controlled which point of the Pareto surface was chosen. If the time was given a higher weighting, the total time needed to finish the cycle stayed nearly constant. Simultaneously, this means that the energy reduction was lower than if a lower weighting was associated with the time.
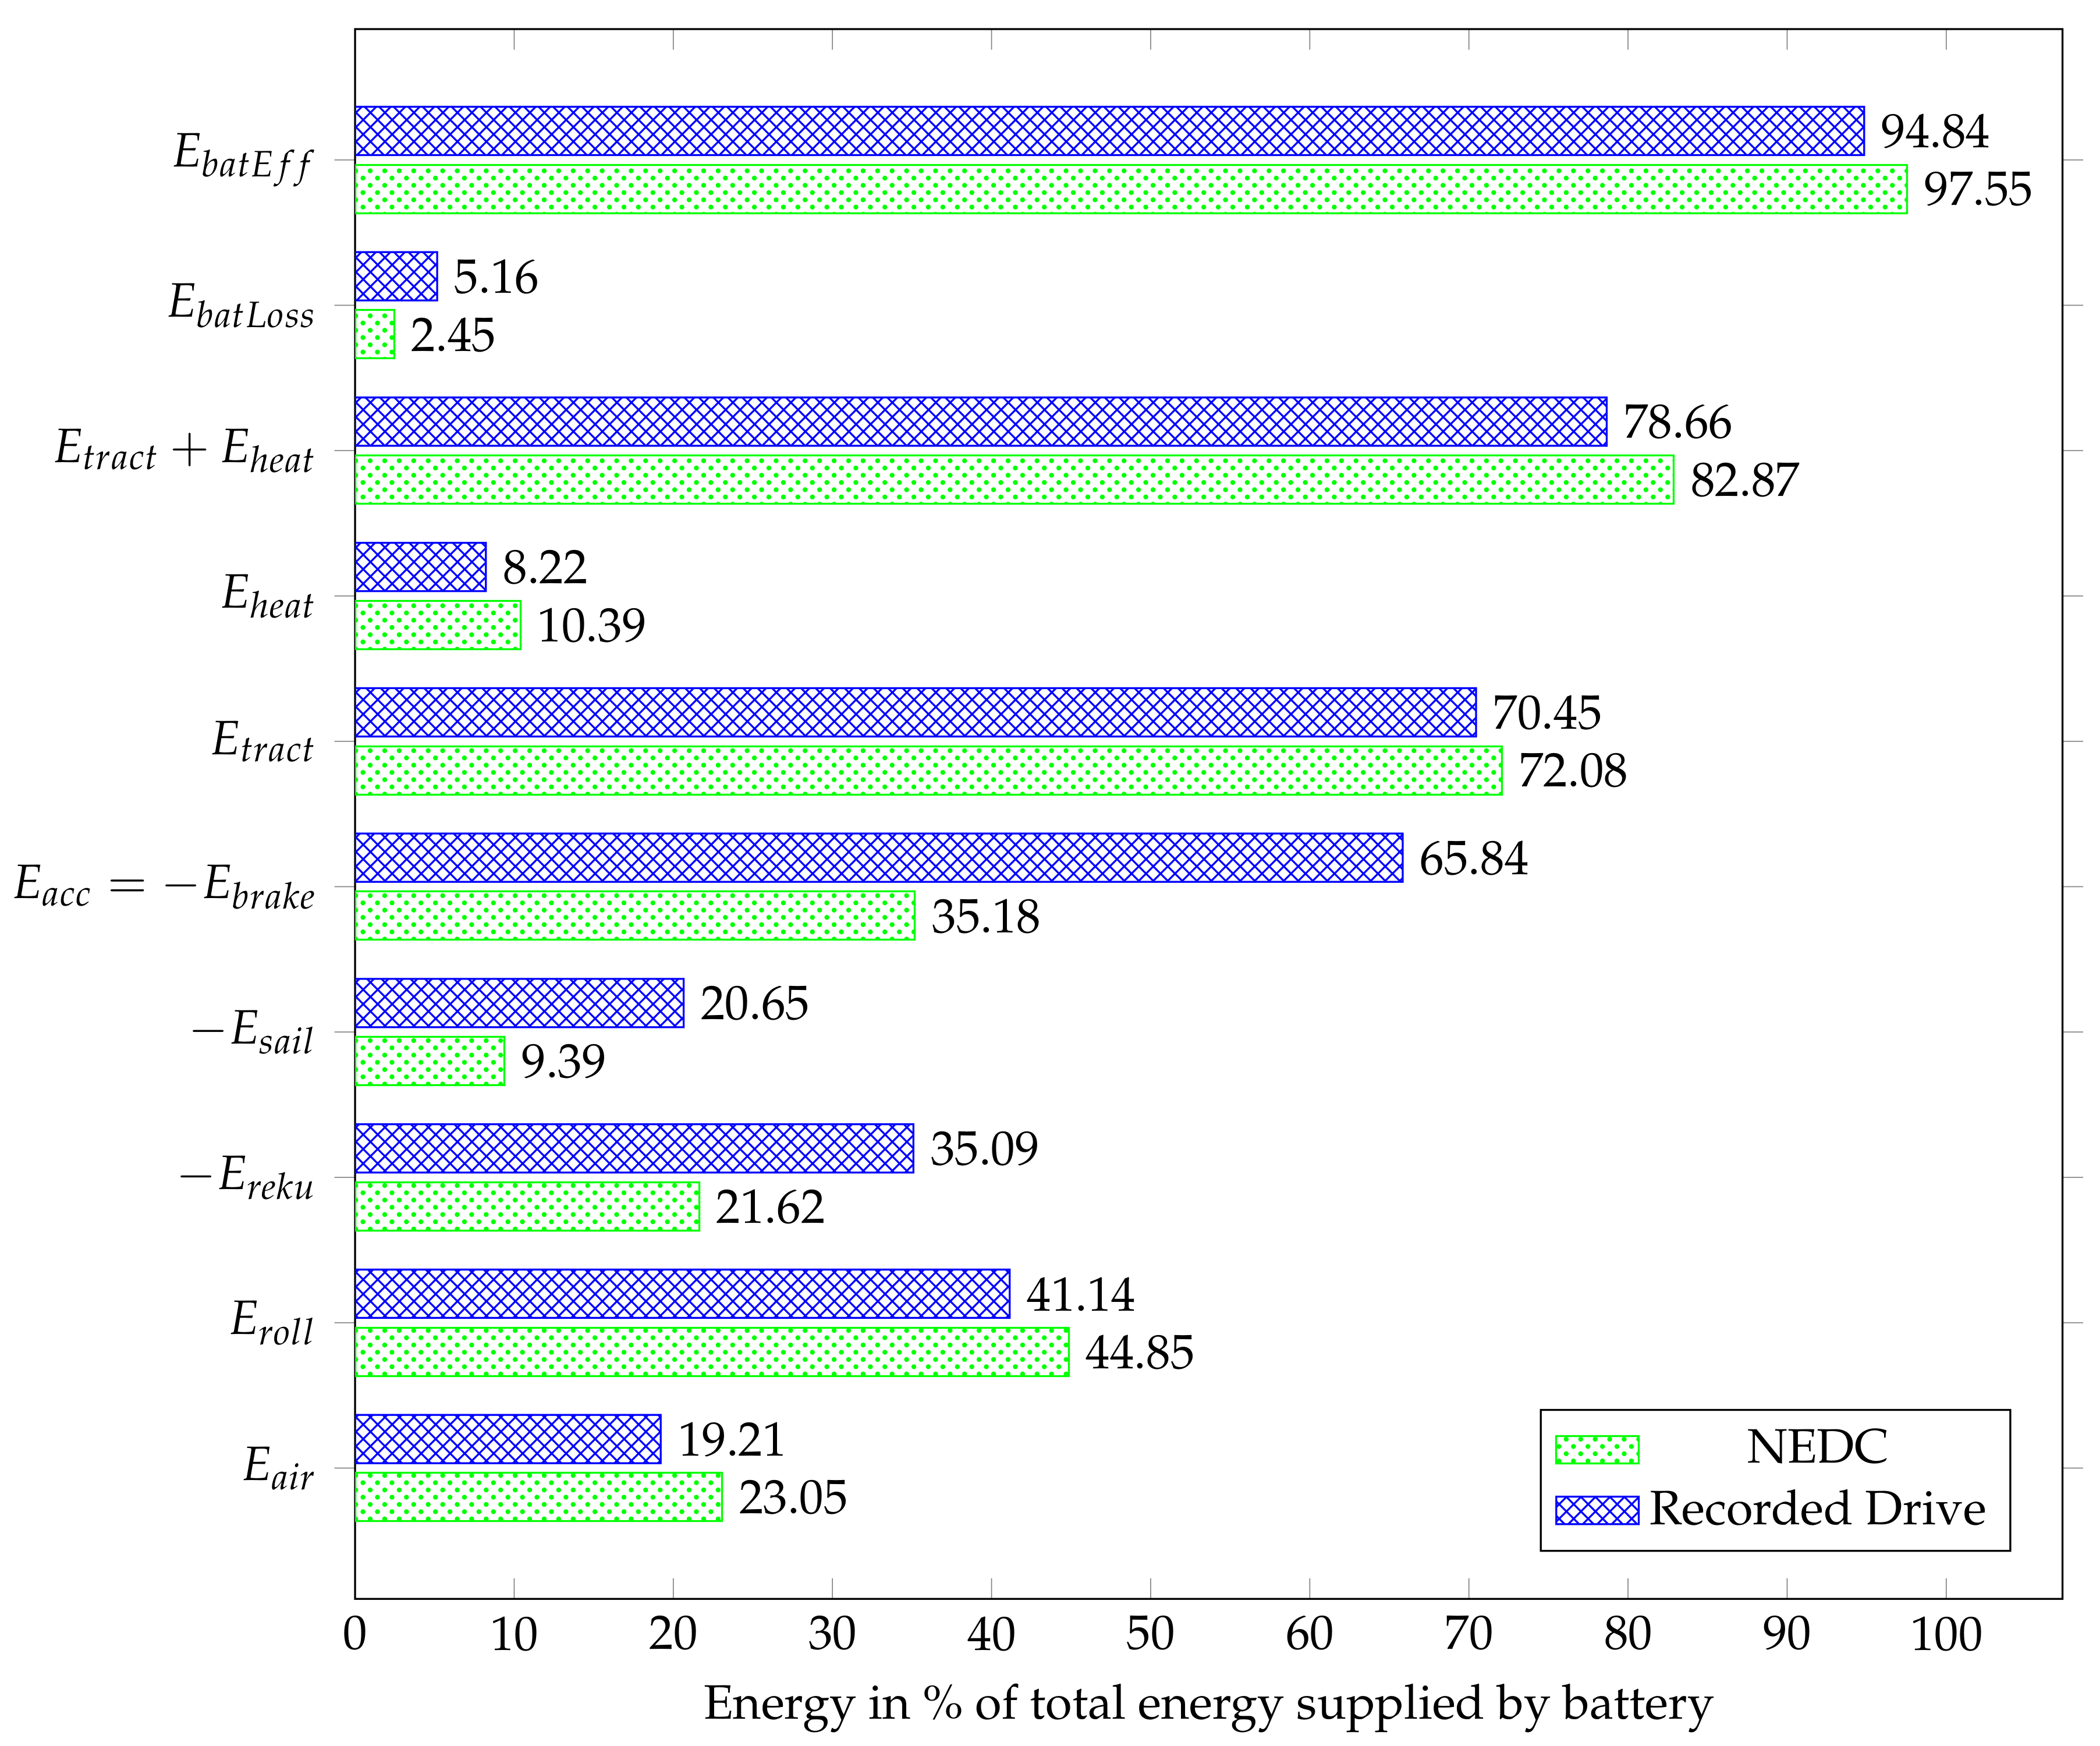
The results differed depending on the driving cycle. The optimization led to a lower reduction of the energy demand for the NEDC than for the recorded test drive. Figure 5 explores the reason for these differences. The figure illustrates the relevant components of energy consumption:
  • E b a t is the total electric energy provided by the battery. E b a t = E b a t E f f + E b a t L o s s .
  • E b a t E f f is the electrical energy taken from the battery that can be used by the auxiliary consumers and the drivetrain.
  • E b a t L o s s is the electrical energy that is lost in the battery. It is computed as: E b a t L o s s = R i n t e r n a l B a t · I b a t 2 with R i n t e r n a l B a t being the internal resistance of the battery dependent on current, temperature, and state-of-charge.
  • E h e a t is the electrical energy used to heat the cabin. Because it can be computed as E h e a t = 0 t m a x P h e a t e r ( t ) d t , it is directly influenced by the optimization algorithm.
  • E t r a c t is the total mechanical energy needed for driving. It can be computed as E t r a c t = E a i r + E r o l l + E a c c + E r e c u + E s a i l .
  • E a c c is the mechanical energy that is used for accelerating the vehicle. Only the positive acceleration is considered in this value. E a c c a .
  • E b r a k e is the mechanical energy needed to decelerate the vehicle. Because v ( t = 0 ) = v ( t = t m a x ) = 0 , it follows that E b r a k e = E a c c .
  • E s a i l is the mechanical energy that is used during the deceleration of the vehicle to overcome the roll and the air resistance. Like E b r a k e , E s a i l is negative.
  • E r e c u is the electrical energy that can be recuperated into the battery. Like E b r a k e , E r e c u is negative.
  • E r o l l is the mechanical energy needed to overcome the rolling resistance. E r o l l v .
  • E a i r is the mechanical energy needed to overcome the air resistance. E a i r v 2 .
All energies are expressed as a % of the total energy taken from the battery ( E b a t ). This was done to allow a comparison between the recorded drive and the NEDC, even though the absolute E b a t differed. It was 1.67 kWh for the NEDC and 3.08 kWh for the recorded drive.
Figure 5 shows that E b a t E f f was higher for the NEDC than for the recorded drive. Consequently, E b a t L o s s was higher for the recorded drive. As E b a t L o s s I b a t 2 , this was due to the difference in E r e c u : for the recorded drive, E r e c u was significantly higher than for the NEDC. The recuperated energy led to a battery current I b a t , which also led to losses. The total used energy expressed by E t r a c t + E h e a t was relatively lower for the recorded drive. E h e a t was slightly larger for the NEDC, because the recorded drive was longer by 570 s. This means that the energy needed to heat the cabin initially was smaller compared to the total energy for the recorded drive. E t r a c t was smaller for the recorded drive. This difference can be traced to the differences in E a i r and E r o l l . Both were higher for the NEDC. This was due to higher velocities. E a c c for the recorded drive was significantly higher, because the recorded drive was more dynamic: The mean acceleration a m e a n 0.12 m/s2, while a m e a n of the recorded drive was 0.24 m/s2. The higher E a c c led to a higher E b r a k e . This means that more energy could be retrieved: The retrieved energy was expressed as E s a i l and E r e c u .
In the following, one of the results listed in Table 3 is looked at in more detail. Because the recorded drive was closer to a real-world scenario, the optimization results obtained with these data were considered. Moreover, it was assumed that the driver would prefer a smaller difference in the time to arrival. Therefore, the results with θ 3 = ( 10   15   75 ) and the recorded drive are described in more detail. θ 3 = ( 10   15   75 ) means that the deviation from the cabin temperature Δ T c a b was weighted with 10 % , the total energy demand E b a t at 15 % , and the time to arrival t at 75 % .
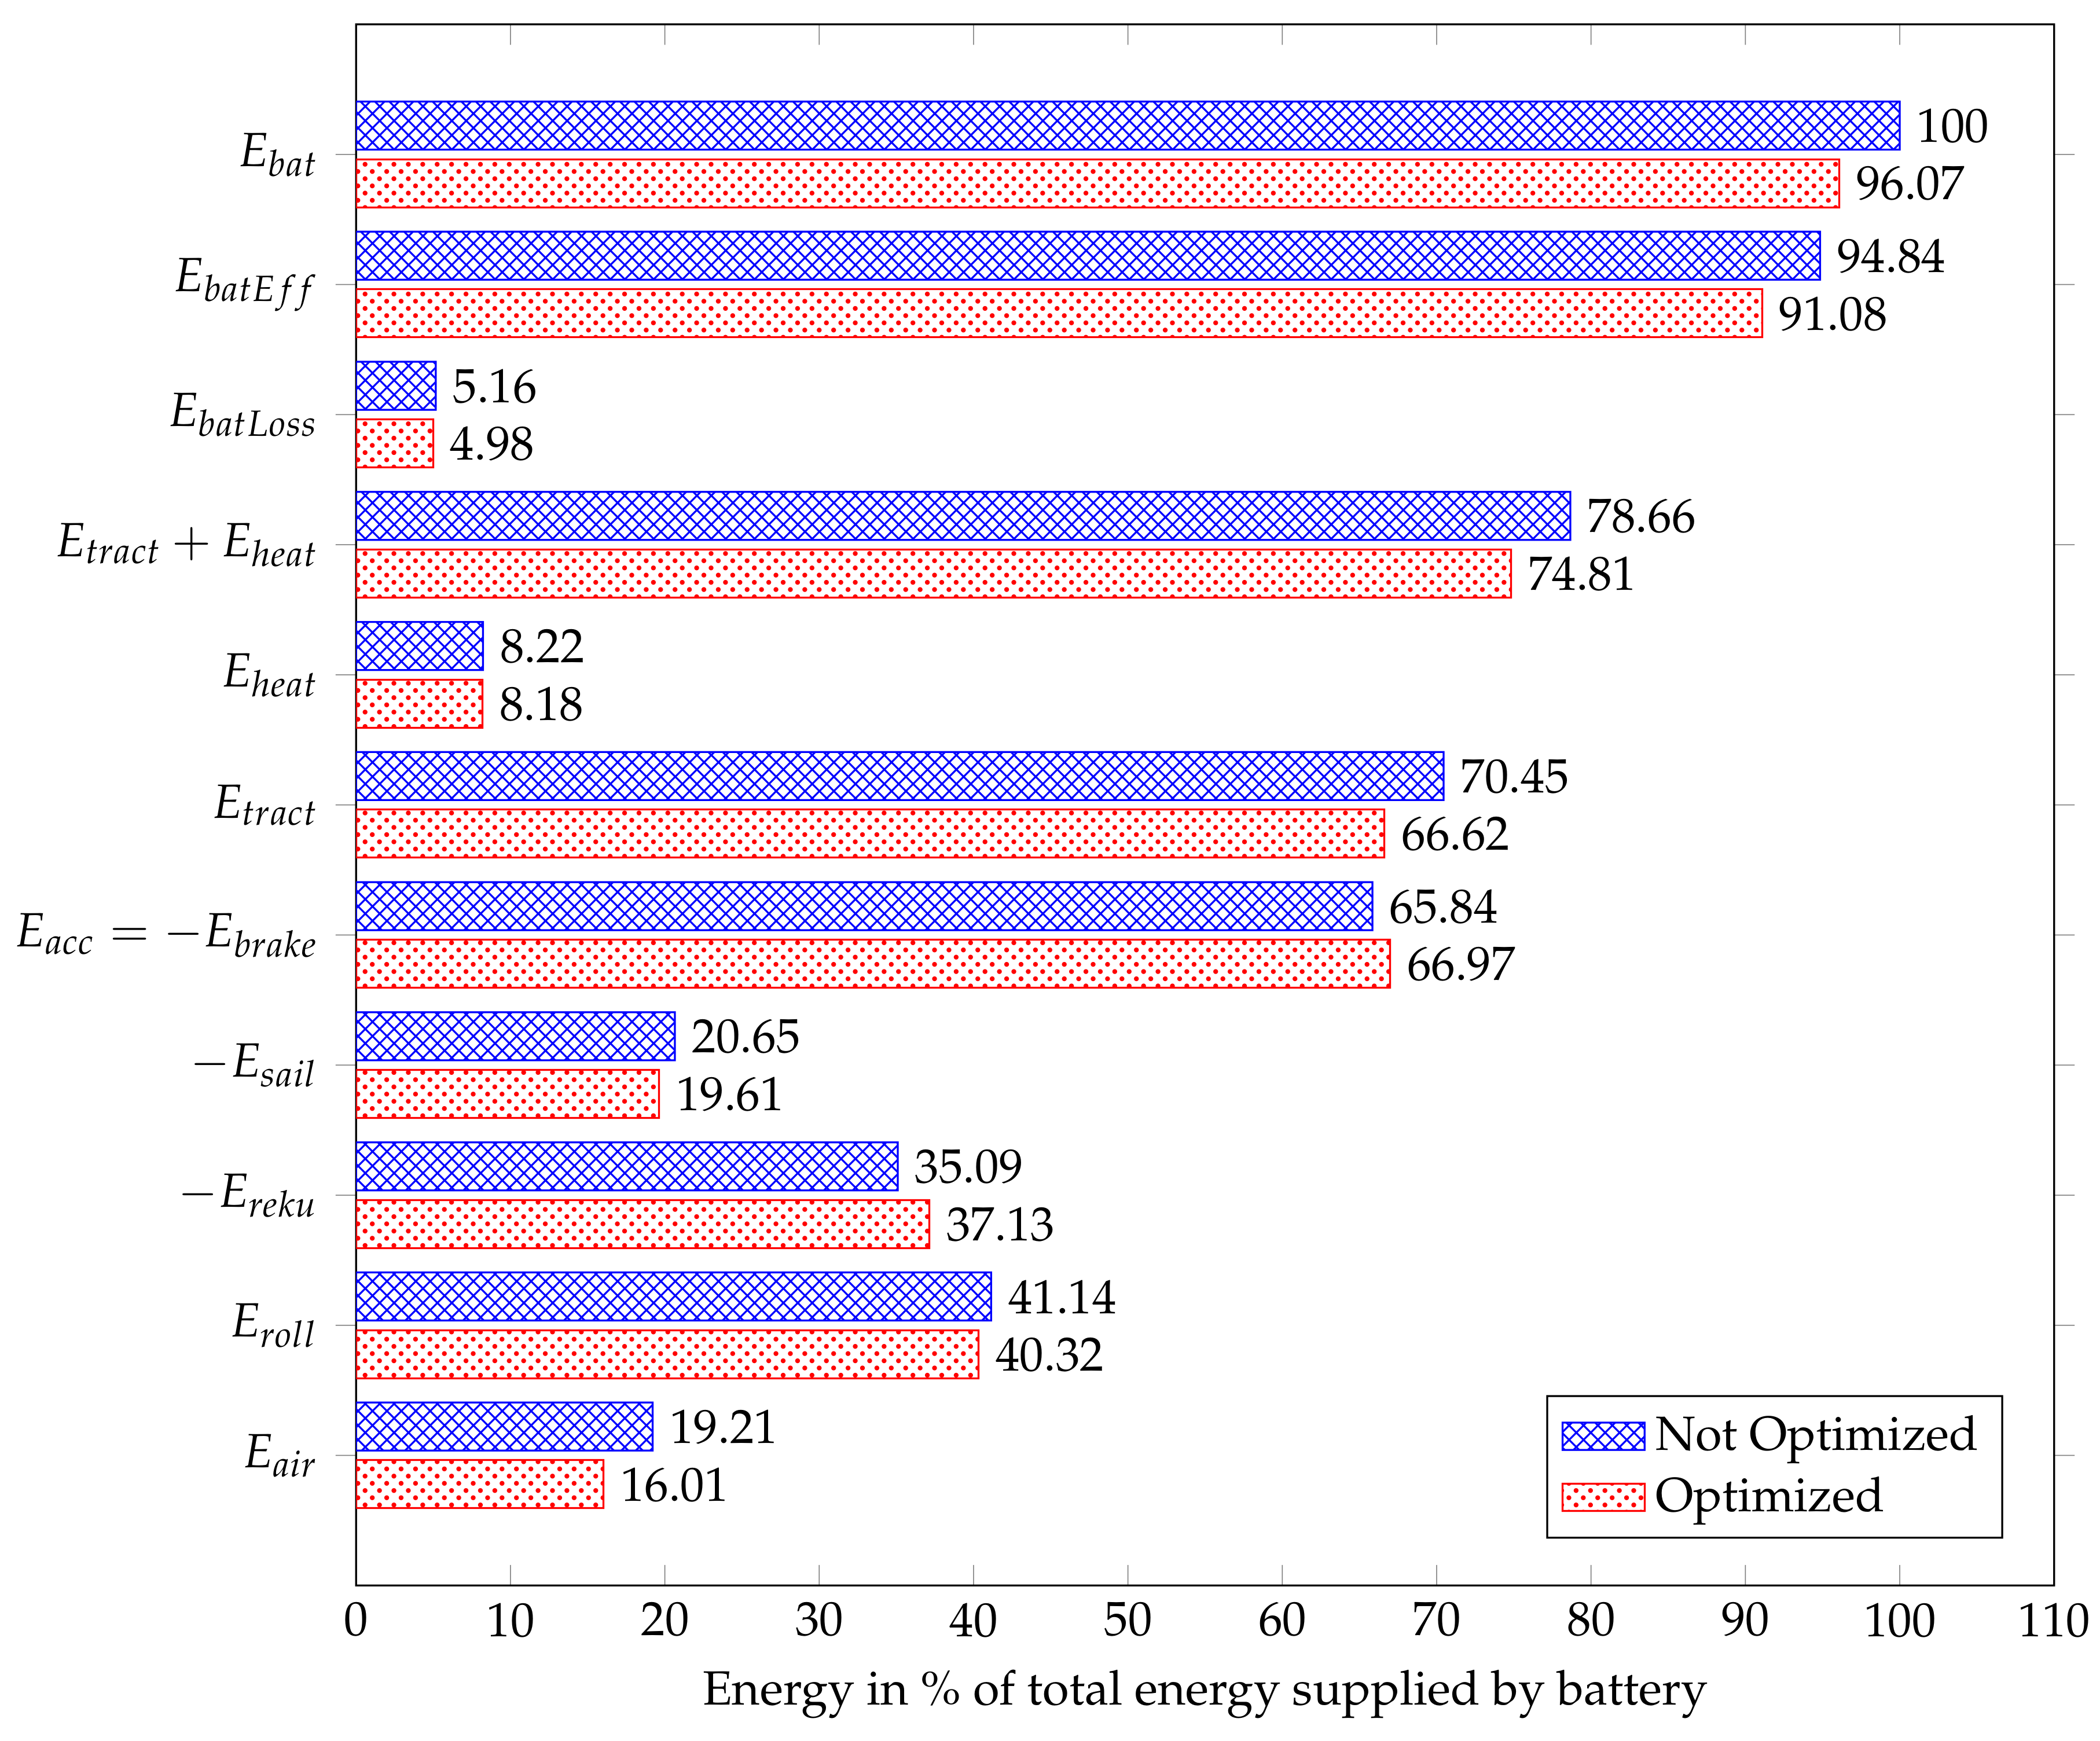
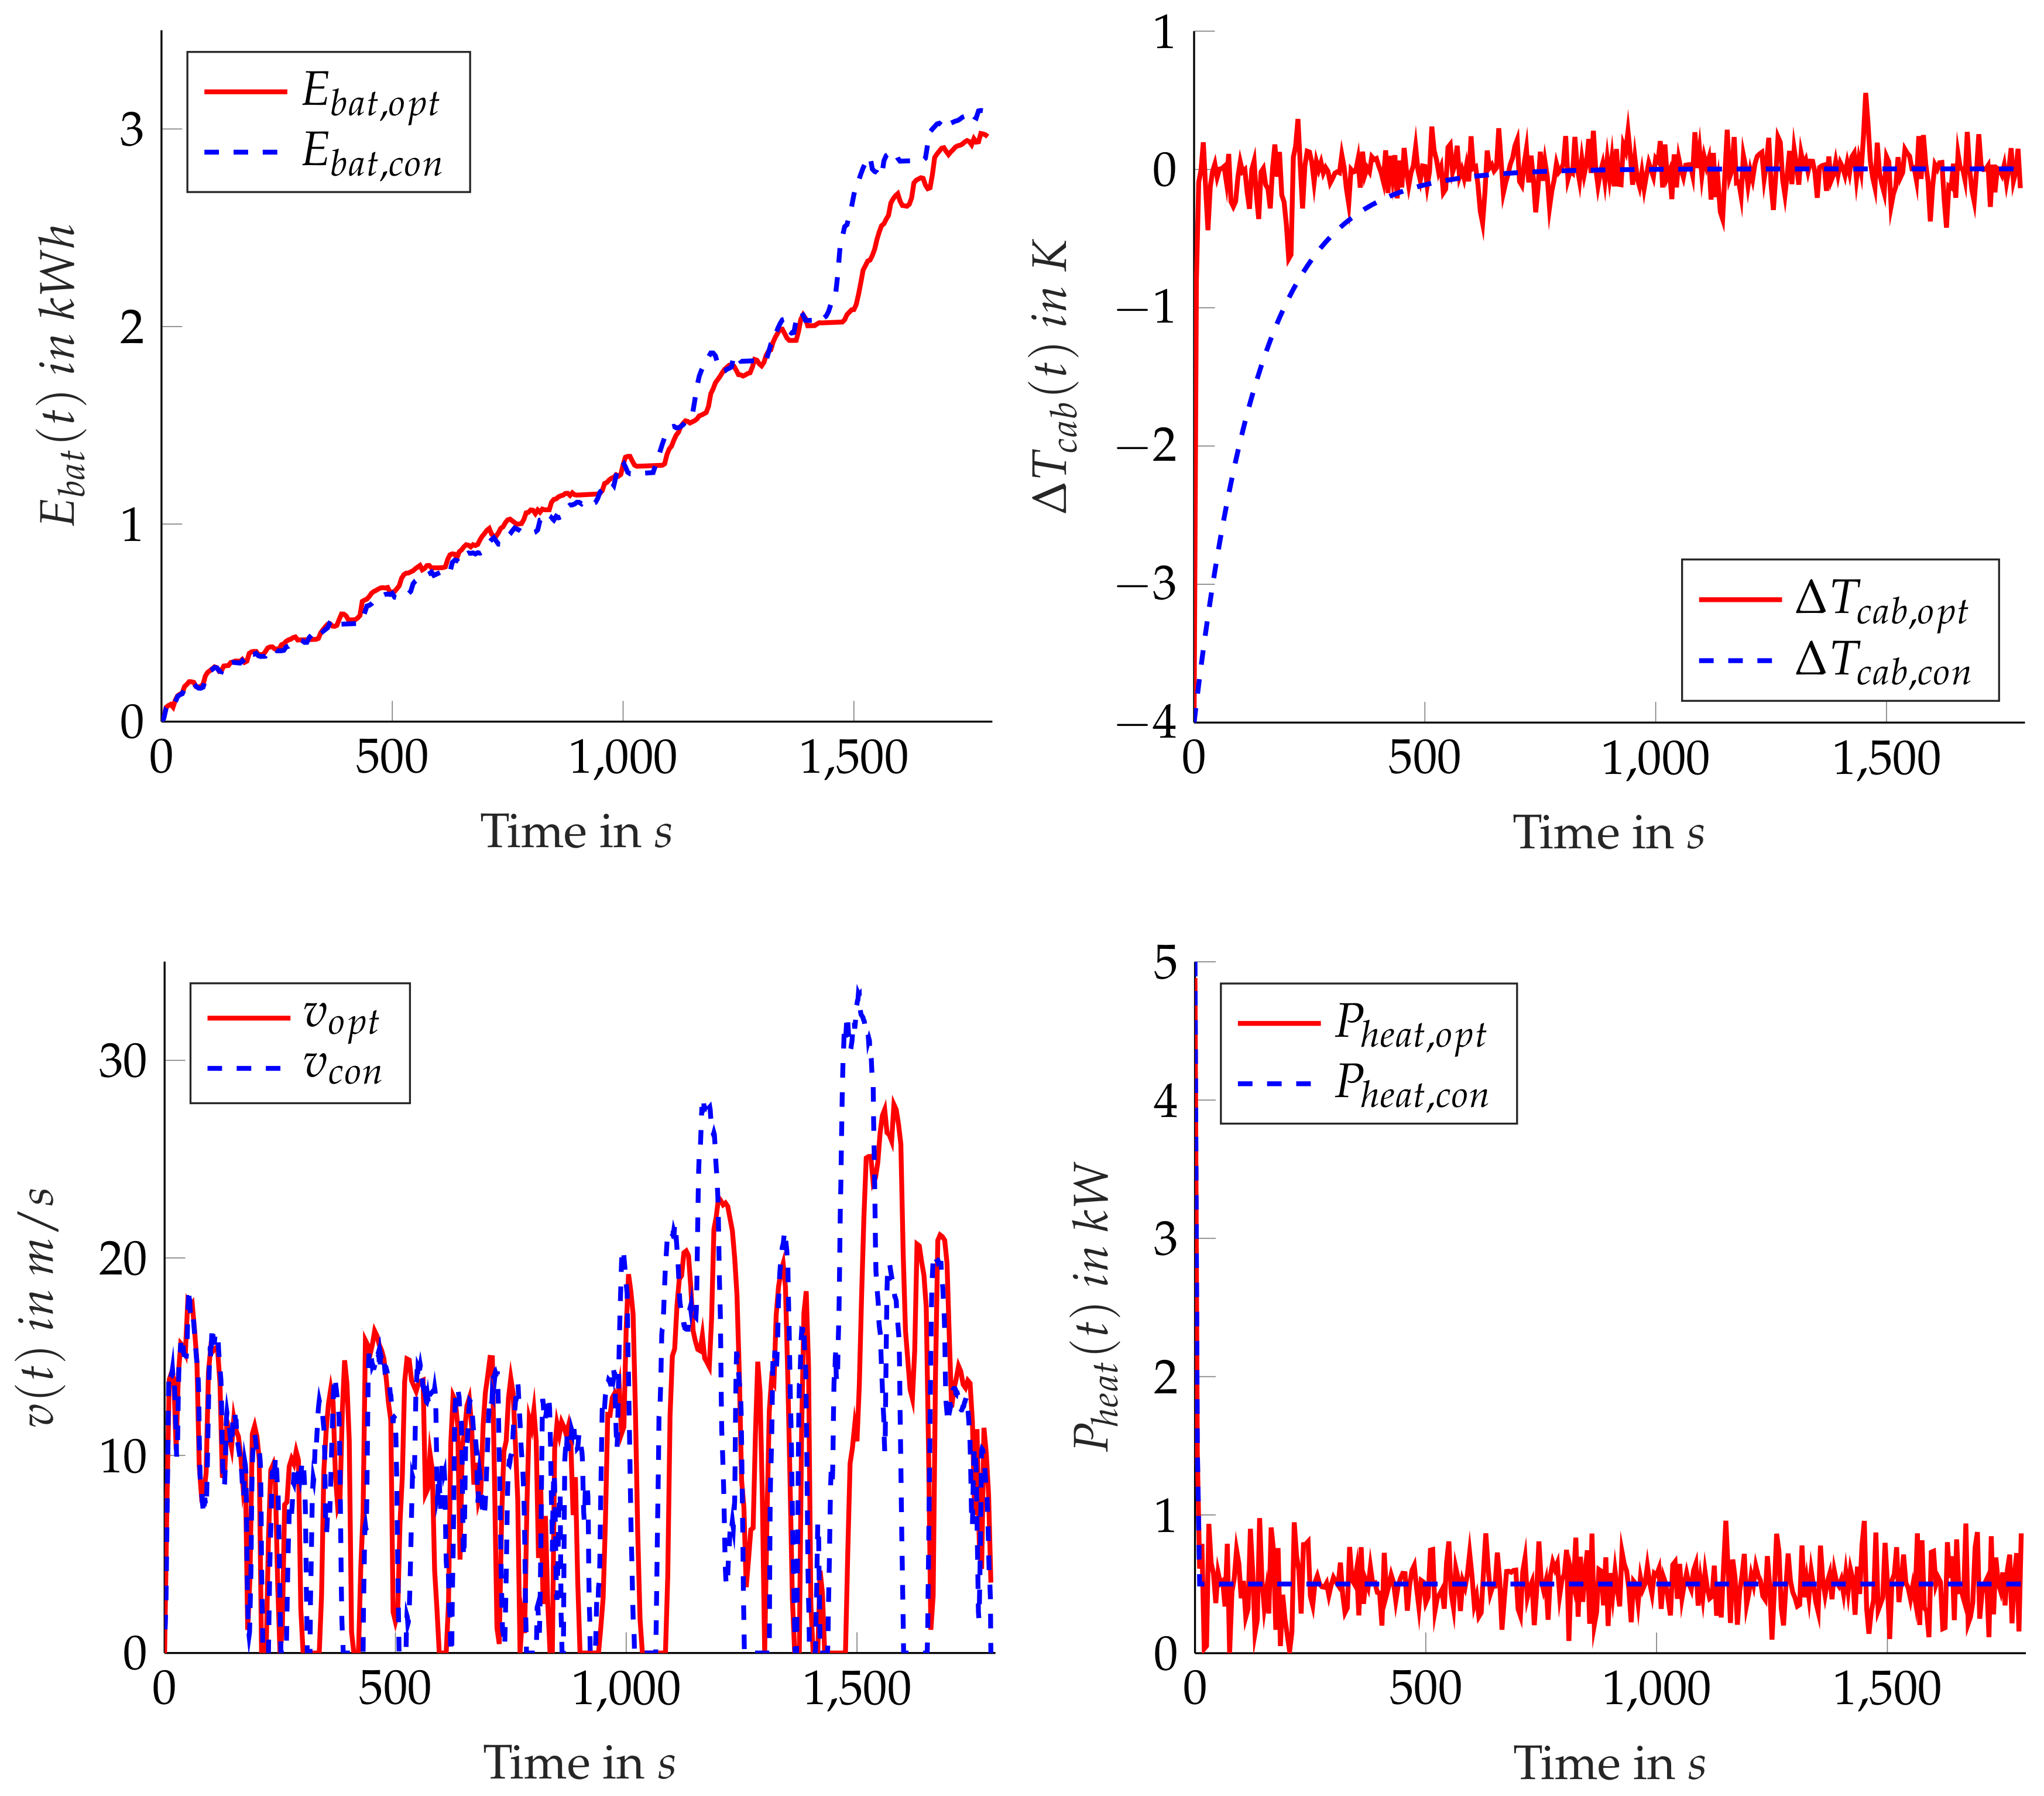
Figure 6 displays the energy components for the optimized and the original recorded drive. In order to ensure optimal comparability, all values were expressed as % of the unoptimized E b a t . Therefore, the unoptimized E b a t was expressed as 100 % . The optimized E b a t indicated the total reduction in the energy consumption and corresponded to the value in Table 3. This reduction can be traced to a reduction of both E b a t E f f and E b a t L o s s . The reduction of E b a t E f f was mostly due to a reduction of E t r a c t , whereas E h e a t stayed nearly constant. This reduction can be attributed to a reduction in E r o l l and E a i r . As both were connected to the velocity, they could be reduced because the optimization lowered the top speeds. This effect can be seen in Figure 7 in the plot of the optimized and unoptimized v ( t ) . Especially during phases with a high v c o n ( t ) , the v o p t ( t ) stayed well below v c o n ( t ) . Moreover, the optimization increased the share of energy that could be recuperated, and thus E r e c u . This could be done by ensuring that the deceleration was small enough to allow the energy to be recuperated.
Despite the higher E r e c u , E b a t L o s s could also be reduced. This effect can be explained by a shift in P h e a t ( t ) : P h e a t ( t ) was increased during recuperative braking. Consequently, the energy was not stored in the battery, but directly used for the cabin heating. This avoided battery losses due to the internal resistance of the battery. In Figure 7, the effects can be seen by the oscillating P h e a t ( t ) and as a consequence the oscillating cabin temperature.
The computations were done on a computer with 64 GB RAM, four cores, and an NVIDIA K4000. The optimization could be run in parallel, as well as serially. If the GA was parallelized, the evaluations of the individuals using the Simulink models were performed in parallel on the four cores of the computer. In the following, a short analysis of the computation time for the first sliding window of the real-world drive is presented. The total number of optimized variables for this window was 70. This means that the GA was run with 105 individuals. If the algorithm was run in parallel with four parallel threads, the total computation time was 1789 s; if it was run in series, the total time was 7845 s. In both cases, each model call took an average of 1.38 s, and the model was called 5356 times. In the case of series computation, the total time taken for model calls was 7413 s. This means that the model calls took up 94.5% of the total computation time.
The results showed that the GA was feasible for the problem at hand. However, it also had considerable drawbacks. Firstly, the Simulink model had to be called over 5000 times for every section. This number varied because the number of individuals depended on the length of the sliding window. The numerous model calls led to a high computation time. Secondly, the GA did not guarantee that a global optimum was found for every sliding window.
The detailed analysis of the optimization results can be summarized as follows:
  • The proposed approach led to a significant reduction in the total consumed energy, while keeping the driving time nearly constant and the cabin temperature within acceptable limits.
  • The holistic approach considering v ( x ( t ) ) and P h e a t ( t ) at the same time had an impact on the battery losses, by avoiding to store the energy in the battery, using it directly for heating instead.
  • The execution of the model took about 95% of the total optimization time. This made the GA very dependent on the run time of the simulation model.

6. Conclusions

This paper described a holistic optimization-based EMS. The implementation using a GA and a sliding window approach was described. The proposed method was applied to a standard driving cycle, namely the NEDC, and a recorded real-world drive. In order to better understand the mechanisms behind the optimization, the two driving cycles were compared with each other. The optimization results showed that the approach was feasible for the real-world data, as well as for the NEDC. The paper explored how the EMS achieved a reduction in the energy consumed. It analyzed the shares of the total energy consumption E b a t in order to understand how the optimization worked.
This paper closes the gap identified in the related work (see Section 2): It introduced an EMS that simultaneously considered the velocity profile and the HVAC using an optimization-based approach. Thus, it provides a feasibility study for a holistic EMS. While the results demonstrated the overall feasibility, they also showcased the problems of GAs in EMS. The first is the long computation times due to the large number of executions of the Simulink model. Secondly, the GA does not guarantee that a global optimum is found. Lastly, total foresight was assumed for this research. This means that the presented approach cannot be employed in combination with prediction areas.
Future work will address these problems and work on the expansion of the presented approach. Alternative optimization procedures will be explored, especially dynamic programming as a benchmark approach. The run time of the overall optimization will be improved by two approaches: Firstly, the run time of the simulation will be reduced by replacing it with a black-box model based on the existing model. Secondly, approaches with fewer model calls, e.g., gradient-based approaches like sequential quadratic programming, will be investigated.
Additionally, the EMS will be expanded to deal with prediction errors. In this context, the prediction errors will be simulated and the influence on the prediction accuracy investigated. The results from the optimization-based approach will be used to devise a rule-based strategy. Moreover, the objective function will be extended to include component aging and driving dynamics, and more variables will be included in the optimization.

Author Contributions

Conceptualization, K.M.; methodology, K.M. and T.H.; software for optimization, T.H. and K.M.; drive cycle analysis, K.M.; writing, original draft preparation, K.M. and T.H.; writing, review and editing, K.M., T.H., M.S., and M.L.; supervision, M.L.

Funding

This research received no external funding.

Acknowledgments

The drivetrain model used for this publication was developed and validated at the Institute of Automotive Engineering at the Technical University of Munich and was managed by Benedikt Danquah.

Conflicts of Interest

The authors declare no conflict of interest.

Abbreviations

The following abbreviations are used in this manuscript:
BEVBattery electric vehicle
EMSEnergy management system
GAGenetic algorithm
HEVHybrid electric vehicle
HVACHeating, ventilation and air conditioning
NEDCNew European Driving Cycle

References

  1. Nikowitz, M. Advanced Hybrid and Electric Vehicles: System Optimization and Vehicle Integration; Lecture Notes in Mobility; Springer International Publishing: Cham, Switzerland, 2016. [Google Scholar]
  2. Salmasi, F.R. Control Strategies for Hybrid Electric Vehicles: Evolution, Classification, Comparison, and Future Trends. IEEE Trans. Veh. Technol. 2007, 56, 2393–2404. [Google Scholar] [CrossRef]
  3. Basler, A. Eine Modulare Funktionsarchitektur zur Umsetzung einer Gesamtheitlichen Betriebsstrategie für Elektrofahrzeuge: Dissertation; KIT Scientific Publishing: Karlsruhe, Germany: 2015; Volume 42. [Google Scholar]
  4. Auer, M.; Wiedemann, J.; Widdecke, N.; Kuthada, T. Increase of Range of Battery Electric Vehicles through Thermal Management. ATZ Worldw. 2015, 117, 64–71. [Google Scholar] [CrossRef]
  5. Leighton, D. Combined Fluid Loop Thermal Management for Electric Drive Vehicle Range Improvement. SAE Int. J. Passeng. Cars Mech. Syst. 2015, 8. [Google Scholar] [CrossRef]
  6. Enthaler, A.; Weustenfeld, T.; Gauterin, F.; Koehler, J. Thermal management consumption and its effect on remaining range estimation of electric vehicles. In Proceedings of the 2014 International Conference on Connected Vehicles and Expo (ICCVE), Vienna, Austria, 3–7 November 2014; pp. 170–177. [Google Scholar] [CrossRef]
  7. Styler, A.; Podnar, G.; Dille, P.; Duescher, M.; Bartley, C.; Nourbakhsh, I. Active Management of a Heterogeneous Energy Store for Electric Vehicles. In Proceedings of the 2011 IEEE Forum on Integrated and Sustainable Transportation Systems, Vienna, Austria, 29 June–1 July 2011. [Google Scholar]
  8. Zheng, C.; Li, W.; Liang, Q. An Energy Management Strategy of Hybrid Energy Storage Systems for Electric Vehicle Applications. IEEE Trans. Sustain. Energy 2018, 9, 1880–1888. [Google Scholar] [CrossRef]
  9. Demircalı, A.; Sergeant, P.; Koroglu, S.; Kesler, S.; Öztürk, E.; Tumbek, M. Influence of the temperature on energy management in battery-ultracapacitor electric vehicles. J. Clean. Prod. 2018, 176, 716–725. [Google Scholar] [CrossRef]
  10. Hu, J.; Jiang, X.; Jia, M.; Zheng, Y. Energy Management Strategy for the Hybrid Energy Storage System of Pure Electric Vehicle Considering Traffic Information. Appl. Sci. 2018, 8, 1266. [Google Scholar] [CrossRef]
  11. Song, Z.; Li, J.; Hou, J.; Hofmann, H.; Ouyang, M.; Du, J. The battery-supercapacitor hybrid energy storage system in electric vehicle applications: A case study. Energy 2018, 154, 433–441. [Google Scholar] [CrossRef]
  12. Azizi, I.; Radjeai, H. A new strategy for battery and supercapacitor energy management for an urban electric vehicle. Electr. Eng. 2018, 100, 667–676. [Google Scholar] [CrossRef]
  13. Armenta, J.; Núñez, C.; Visairo, N.; Lázaro, I. An advanced energy management system for controlling the ultracapacitor discharge and improving the electric vehicle range. J. Power Sources 2015, 284, 452–458. [Google Scholar] [CrossRef]
  14. Trovão, J.P.; Silva, M.A.; Dubois, M.R. Coupled energy management algorithm for MESS in urban EV. IET Electr. Syst. Transp. 2017, 7, 125–134. [Google Scholar] [CrossRef]
  15. Rizoug, N.; Mesbahi, T.; Sadoun, R.; Bartholomeüs, P.; Le Moigne, P. Development of new improved energy management strategies for electric vehicle battery/supercapacitor hybrid energy storage system. Energy Effic. 2018, 11, 823–843. [Google Scholar] [CrossRef]
  16. Guo, L.; Gao, B.; Chen, H. Online Shift Schedule Optimization of 2-Speed Electric Vehicle Using Moving Horizon Strategy. IEEE/ASME Trans. Mechatron. 2016, 21, 2858–2869. [Google Scholar] [CrossRef]
  17. Shanding, Y.; Qiang, S.; Habibi, S. Dynamic optimization method for speed ratio of electric vehicle with two-speed transmission system. In Proceedings of the 2016 IEEE International Conference on Power and Renewable Energy (ICPRE), Shanghai, China, 21–23 October 2016; pp. 530–536. [Google Scholar] [CrossRef]
  18. Gunji, D.; Fujimoto, H. Efficiency analysis of powertrain with toroidal continuously variable transmission for Electric Vehicles. In Proceedings of the IECON 2013—39th Annual Conference of the IEEE Industrial Electronics Society, Vienna, Austria, 10–13 November 2013; pp. 6614–6619. [Google Scholar] [CrossRef]
  19. Gao, B.; Xiang, Y.; Chen, H.; Liang, Q.; Guo, L. Optimal Trajectory Planning of Motor Torque and Clutch Slip Speed for Gear Shift of a Two-Speed Electric Vehicle. J. Dyn. Syst. Meas. Control 2015, 137, 061016. [Google Scholar] [CrossRef]
  20. Zhu, B.; Zhang, N.; Walker, P.; Zhou, X.; Zhan, W.; Wei, Y.; Ke, N. Gear shift schedule design for multi-speed pure electric vehicles. Proc. Inst. Mech. Eng. Part D J. Autom. Eng. 2015, 229, 70–82. [Google Scholar] [CrossRef]
  21. An, J.; Binder, A. Operation Strategy with Thermal Management of E-Machines in Pure Electric Driving Mode for Twin-Drive-Transmission (DE-REX). In Proceedings of the 2017 IEEE Vehicle Power and Propulsion Conference (VPPC), Belfort, France, 11–14 December 2017; pp. 1–6. [Google Scholar] [CrossRef]
  22. Chen, Y.; Wang, J. Design and Experimental Evaluations on Energy Efficient Control Allocation Methods for Overactuated Electric Vehicles: Longitudinal Motion Case. IEEE/ASME Trans. Mechatron. 2014, 19, 538–548. [Google Scholar] [CrossRef]
  23. Hu, M.; Zeng, J.; Xu, S.; Fu, C.; Qin, D. Efficiency Study of a Dual-Motor Coupling EV Powertrain. IEEE Trans. Veh. Technol. 2015, 64, 2252–2260. [Google Scholar] [CrossRef]
  24. Liang, J.; Yang, H.; Wu, J.; Zhang, N.; Walker, P.D. Shifting and power sharing control of a novel dual input clutchless transmission for electric vehicles. Mech. Syst. Signal Process. 2018, 104, 725–743. [Google Scholar] [CrossRef]
  25. Hung, Y.H.; Wu, C.H. A combined optimal sizing and energy management approach for hybrid in-wheel motors of EVs. Appl. Energy 2015, 139, 260–271. [Google Scholar] [CrossRef]
  26. Wacker, P.; Wheldon, L.; Sperlich, M.; Adermann, J.; Lienkamp, M. Influence of active battery switching on the drivetrain efficiency of electric vehicles. In Proceedings of the 2017 IEEE Transportation Electrification Conference and Expo (ITEC), Chicago, IL, USA, 22–24 June 2017; pp. 33–38. [Google Scholar] [CrossRef]
  27. Sakhdari, B.; Azad, N. An Optimal Energy Management System for Battery Electric Vehicles. IFAC-PapersOnLine 2015, 48, 86–92. [Google Scholar] [CrossRef]
  28. Roscher, M.A.; Leidholdt, W.; Trepte, J. High efficiency energy management in BEV applications. Int. J. Electr. Power Energy Syst. 2012, 37, 126–130. [Google Scholar] [CrossRef]
  29. Becker, G. Ein Fahrerassistenzsystem zur Vergrößerung der Reichweite von Elektrofahrzeugen; Springer Vieweg: Wiesbaden, Germany, 2016. [Google Scholar]
  30. Madhusudhanan, A.K. A method to improve an electric vehicle’s range: Efficient Cruise Control. Eur. J. Control 2018. [Google Scholar] [CrossRef]
  31. Wu, X.; He, X.; Yu, G.; Harmandayan, A.; Wang, Y. Energy-Optimal Speed Control for Electric Vehicles on Signalized Arterials. IEEE Trans. Intell. Transp. Syst. 2015, 16, 2786–2796. [Google Scholar] [CrossRef]
  32. Fritsch, M.; Scherler, S.; Xiaobo, L.H. Eine Intelligente Fahrerassistenzfunktion zum Energieoptimalen Fahrbetrieb für Elektrofahrzeuge. In ASIM/GI STS/GMMS Workshop 2016; ARGESIM Verlag: Lippstadt, Germany, 2016. [Google Scholar]
  33. Vaz, W.S.; Nandi, A.K.; Koylu, U.O. A Multiobjective Approach to Find Optimal Electric-Vehicle Acceleration: Simultaneous Minimization of Acceleration Duration and Energy Consumption. IEEE Trans. Veh. Technol. 2016, 65, 4633–4644. [Google Scholar] [CrossRef]
  34. Dib, W.; Chasse, A.; Moulin, P.; Sciarretta, A.; Corde, G. Optimal energy management for an electric vehicle in eco-driving applications. Control Eng. Pract. 2014, 29, 299–307. [Google Scholar] [CrossRef]
  35. Flehmig, F.; Kästner, F.; Knödler, K.; Knoop, M. Eco-ACC für Elektro- und Hybridfahrzeuge. ATZ Automobiltech. Z. 2014, 116, 22–27. [Google Scholar] [CrossRef]
  36. Suchaneck, A. Energiemanagement-Strategien für Batterieelektrische Fahrzeuge; Forschungsberichte aus der Industriellen Informationstechnik; KIT Scientific Publishing: Karlsruhe, Germany, 2018; Volume 17. [Google Scholar]
  37. Branke, J.; Deb, K.; Miettinen, K.; Slowinski, R. (Eds.) Multiobjective Optimization: Interactive and Evolutionary Approaches; Lecture Notes in Computer Science; Springer: Berlin, Germany, 2008; Volume 5252. [Google Scholar]
  38. Vanderplaats, G.N. Numerical Optimization Techniques for Engineering Design: With Applications, 3rd ed.; McGraw-Hill Series in Mechanical Engineering; McGraw-Hill: New York, MY, USA, 2001. [Google Scholar]
  39. Deb, K. An efficient constraint handling method for genetic algorithms. Comput. Methods Appl. Mech. Eng. 2000, 186, 311–338. [Google Scholar] [CrossRef]
  40. Du, K.L.; Swamy, M.N.S. Search and Optimization by Metaheuristics; Springer International Publishing: Cham, Switzerland, 2016. [Google Scholar]
  41. Adermann, J.; Kreibich, J.; Lienkamp, M. Experimental Study of Energy Consumption Variation in Recurring Driving Trips. J. Electr. Eng. 2017, 5, 253–261. [Google Scholar] [CrossRef]
  42. Danquah, B.; Alexander Koch, A.; Weiß, T.; Lienkamp, M.; Pinnel, A. Modular, Open Source Simulation Approach: Application to Design and Analyze Electric Vehicles. In Proceedings of the 2019 Fourteenth International Conference on Ecological Vehicles and Renewable Energies (EVER), Monaco, Monaco, 8–10 May 2019. [Google Scholar]
  43. Romaus, C.; Gathmann, K.; Bocker, J. Optimal energy management for a hybrid energy storage system for electric vehicles based on Stochastic Dynamic Programming. In Proceedings of the IEEE Vehicle Power and Propulsion Conference (VPPC), Lille, France, 1–3 September 2010; pp. 1–6. [Google Scholar]
  44. Minnerup, K.; Herrmann, T.; Steinstraeter, M.; Lienkamp, M. Concept for a Holistic Energy Management System for Battery Electric Vehicles Using Hybrid Genetic Algorithms. In Proceedings of the 2018 IEEE 88th Vehicular Technology Conference (VTC-Fall), Chicago, IL, USA, 27–30 August 2018; pp. 1–6. [Google Scholar] [CrossRef]
Figure 1. Example for the requirements and the subsystem managed by an energy management system (EMS) in a battery electric vehicle (BEV).
Wevj 10 00046 g001
Figure 2. Overview of the classification of EMS (refer to [2]).
Wevj 10 00046 g002
Figure 3. To the left: v x , t a r ( t ) -curve; to the right: v x , t a r ( x ( t ) ) -curve of the NEDC.
Wevj 10 00046 g003
Figure 4. Interaction between the GA used for the optimization and the Simulink model.
Wevj 10 00046 g004
Figure 5. Comparison of the energy components for the recorded drive and the NEDC. All values are expressed as % of E b a t of the respective driving cycle.
Wevj 10 00046 g005
Figure 6. Comparison of the energy components for the recorded drive unoptimized and optimized. All values are expressed as % of E b a t of the unoptimized drive.
Wevj 10 00046 g006
Figure 7. Comparison of optimized and unoptimized time series of the variables v ( t ) and P h e a t ( t ) , as well as the components of the objective function E b a t ( t ) and Δ T c a b ( t ) .
Wevj 10 00046 g007
Table 1. Overview of literature EMS for BEV.
ComponentOptimization-BasedHeuristic
OnlineOfflineDerived from OptimizationNot Derived from Optimization
Thermal management system[4]--[5,6]
Hybrid energy storage[7][8][9,10,11][12,13,14,15]
Variable gear ratio-[16,17][18,19][20]
Multiple electric machines-[21][22,23,24][25]
Variable voltage---[26]
HVAC[27]--[28]
Driving strategies[29,30,31][32,33,34][35]-
Holistic EMS[36]-[3]-
Table 2. Parameters of the GA.
ParameterValue
Population size 1.5   · (number of parameters per section l)
Number of max. generations50
Crossover-fraction 0.80
Mutation ratefeasible adaption
Elitism 0.05   · population size
Selectionrank-based
Discretization step of time-dependent optimization parameters5 s [43]
Discretization step of space-dependent optimization parameters400 m
Table 3. Comparison of traveling time and energy demand E b a t for different decision-maker priority vectors θ .
ConfigurationReduction of Energy ConsumptionTime Relative to Original Traveling Time
Recorded Drive
θ 1 = ( 20 50 30 ) 15.2 % 112 %
θ 2 = ( 20 30 50 ) 10.7 % 106 %
θ 3 = ( 10 15 75 ) 3.39 % 100 %
NEDC
θ 1 = ( 20 50 30 ) 9.79 % 106 %
θ 2 = ( 20 30 50 ) 8.20 % 101 %
θ 3 = ( 10 15 75 ) 3.27 % 97.4 %