Article

Charging Load Allocation Strategy of EV Charging Station Considering Charging Mode

1
Beijing Electric Power Research Institute, State Grid Beijing Electric Power Company, Beijing 100075, China
2
School of Electrical Engineering and Automation, Wuhan University, Wuhan 430072, China
*
Author to whom correspondence should be addressed.
World Electr. Veh. J. 2019, 10(2), 47; https://doi.org/10.3390/wevj10020047
Submission received: 6 May 2019 / Revised: 17 June 2019 / Accepted: 20 June 2019 / Published: 23 June 2019
(This article belongs to the Special Issue Charging Infrastructure for Electric Vehicles)

Abstract

:
A charging load allocation strategy for Electric Vehicles (EVs) considering charging mode is proposed in this paper in order to solve the challenge and opportunity of large-scale grid-connected charging under the background of booming EV industry in recent years. Based on the peak-to-valley Time-of-Use (TOU) price, this strategy studies the grid load, charging cost and charging station revenue variation of EVs connected to the grid in different charging modes. In addition, this paper proposes an additional charging mechanism for charging stations to encourage EV owners to participate in the peak and valley reduction of the grid through coordinated charging. According to the example analysis, under the same charging demand conditions, the larger EV charging power will have a greater impact on the grid than the conventional charging power. This article collects additional service fees for car owners who are not involved in the coordinated charging. When the response charging ratio is less, the more total service charges are charged, which can compensate for the decline in the sales revenue of the charging station during the valley period. While having good economy, it can also encourage the majority of car owners to participate in the coordinated charging from the perspective of charging cost.

1. Introduction

With the increasing popularity of Electric Vehicles (EVs) [1], EV charging stations are widespread. Therefore, the impact of large-scale charging on the power grid and the economy cannot be ignored, which brings opportunities and challenges for the planning of the power grid [2,3]. It is crucial for smart grid to balance the load between charging stations in the region and guide car owners to participate in the dispatch through peak and valley of electricity price, which can effectively improve the security and economy of power grid operation.
At present, scholars are paying close attention to the large-scale EV charging problem, and are obtaining some new results. Typically, researchers conduct EV charging planning from the perspective of charging station construction, charging costs, grid fluctuations, traffic impact, and so on. Richardson considers charging needs of the EV owner, and modeled the charging process of the agent dispatching EVs during the contract period under the constraints of the distribution network and the conventional electricity [4]. Rashidizadeh-Kermani proposes a two-layer stochastic model of EV aggregator decision making process for aggregator profit and vehicle purchase cost [5]. Wang comprehensively considers the impact of peak and valley electricity prices and user’s satisfaction, and established a coordinated charging model that can be optimized over time [6]. Chokkalingam and Tang study EV charging plans from the perspective of charging driving navigation and charging station queuing length [7,8]. Mao and Sun have improved the performance of EV charging algorithms [9,10].
However, most existing studies achieve optimal allocation of EV charging load at specific targets. Existing research on EV charging mode analysis is less comprehensive. The EV charging mode is one of the key factors in the EV coordinated charging plan. EVs can get power by charging pile or replacing the battery. Different charging modes correspond to different charging powers [11], which will have different degrees of influence on the power grid [12].
In addition, Time-of-Use (TOU) price is an effective way to guide EV owners to participate in coordinated charging [13,14]. Many EV charging plans involving charging prices are mainly unilaterally considering the charging cost of the EV owner [15,16]. In fact, for charging station operators, changes in the revenue of charging stations and measures to increase revenue are worth exploring. There is a certain proportion of EV owners participating in the coordination of charging [17]. For EV owners who do not participate in the coordination of charges, the research on the payment mechanism under the specific EV charging mode can provide a good idea for improving charging station revenue.
In this paper, we propose a charging load allocation strategy for Electric Vehicles. Specifically, the EV grid-connected charging effects on charging station electricity purchase and sale under different charging modes are explored. The EV charging load is reasonably configured based on a heuristic algorithm. We use the peak-to-valley Time-of-Use (TOU) price to encourage EV owners to participate in the peak clipping of the grid through coordinated charging. And we further propose a charging mechanism for the additional charging service rate when the EV owners do not participate in coordinated charging. By considering the response coordinated charging ratio of EV owners, the benefits of EV charging load allocation strategy proposed in this paper are analyzed.
The contributions of this paper lie in: We propose an EV charging load distribution strategy considering charging mode, and study the effects of grid load, charging cost and charging station revenue of electric vehicles connected to the grid under different charging modes. In addition, a charging mechanism for charging an EV vehicle owner who does not participate in coordinated charging is proposed. From the perspective of the demand side response, the additional charging service fee can compensate for the charging station’s revenue decline caused by valley period sales, and is conducive to motivate more car owners to participate in EV coordinated charging.
This paper is organized as follows: EV owners’ charging behavior analyses are presented in Section 2. Section 3 describes charging strategies of EV charging stations, and charging strategies are mainly described from the charging station power cost, sales revenue, and EV charging modes. Section 4 gives the optimization goals of the EV charging model. Section 5 simulates charging strategies proposed in this paper. Conclusions are shown in Section 6.

2. Analysis of EV Owners’ Charging Behavior

With the popularity of EVs around the world, the number of household electric vehicle is increasing. The proportion of charging load of household electric vehicles in the power grid should not be underestimated. This paper takes household EVs as the research object of EV coordinated charging.
We assume that the EV travel time indicates the time when the owner leaves the charging station, and uses EV return time to indicate the start charging time. According to the statistical analysis of American household EV travel data [18], the probability density function of EV charging in one day can be expressed by the following normal distribution functions [6,19]. Thus, the time when the EV gains its access to the grid can be modeled as following Equation (1), and respectively, the time when it leaves the grid can be represented as Equation (2).
f ( x , μ , σ ) { 1 2 π σ 2 exp ( ( x μ ) 2 2 σ 2 ) μ 12 < x 24 1 2 π σ 2 exp ( ( x + 24 μ ) 2 2 σ 2 ) 0 < x μ 12
f ( x , μ , σ ) { 1 2 π σ 2 exp ( ( x μ ) 2 2 σ 2 ) 0 < x μ + 12 1 2 π σ 2 exp ( ( x 24 + μ ) 2 2 σ 2 ) μ + 12 < x 24
where μ and σ represent the mathematical expectation and standard deviation of the random variable x, which denotes the time during a day. Based on the previous work, μ = 19 h and σ = 3.4 h when EV starts charging, and μ = 9 h and σ = 0.5 h when charging is finished [19].
In real life, the state of charge is highly related to the habits of the owner. Combined with the investigation and statistics on the behavior of the car owners, it is almost impossible for a car to run out of electricity before charging. When the initial State of Charge (SOC) of an EV is nearly full, then the charging duration will be very short, and such EVs do not play a significant role in observing system load change trend over a long period of time.
About 70% of car owners choose to charge when the SOC is between 10% and 50%, and 91% of them choose to charge the car to more than 90% [18]. Therefore, on the basis of a normal distribution with an expected SOC of 40% and a variance of 0.08 at the initial charging time of EV [20], in order to improve the load change effect before and after the coordinated charging optimization, the data with the initial state of charge outside the state of 10%~50% is eliminated when the state of the EV is initialized.

3. Determination of Charging Strategy for Charging Station

By dividing a day as 24 h into M scheduling periods, we take M = 96 along with Δ t = 15   min as the interval to divide a day into 96 scheduling periods. The value of the scheduling period of 15 min per time determines whether the EV is charged and together makes up the total charge length of the EV during the day. For N EVs, the total charge length scheduling of these vehicles over the day can generate an N × 96 scheduling matrix. The variable xij in the matrix represents the charging status of the ith EV during the jth time period and can be specified as:
x i j = { 1   the   i th   EV   is   in   charging   time   state   during   the   j th   time   period   0   the   i th   EV   is   in   non-charging   time   state   during   the   j th   time   period
The EV charging duration of tc is related to the EV initial state of charge S o C s t , the EV final state of charge S O C e n , the charging power P , the charge efficiency η , and the size capacity of the battery B r , which can be expressed as:
t c = ( S O C e n S O C s t ) × B r P η
The number of private EVs is huge, and the behavior of EVs largely depends on the owners. The charging strategy of EVs will be carefully studied. In this paper, the charging places are collectively referred to as “charging stations”. Besides the charging power and the influence of large-scale charging of EVs on the power grid are studied, and the revenue of stations is analyzed. Figure 1 shows the schematic diagram of the controllable charging period of EV charging time t c in the parking period t p a r .
As shown in the figure, t s t is the time when an EV starts charging, and t e n is the time when it discharges, and t c is the actual charging time. The parking time of an EV can be expressed as:
t p a r = t e n t s t
The charging scheduling period t d which is represented as the difference between the vehicle stay time t p a r and the actual charging time t c , as shown in Equation (6).
t d = t p a r t c

3.1. Research on Charging Price of EVs

The operational cost of an EV charging station mainly consists of the electrical bill from the power grid company according to the electricity purchase prices, and its income mainly derives from the charging services. The charging station thus profits by the difference between the aforementioned two factor industrial electricity time-sharing electricity prices. In this paper, the electricity purchase price of the charging station from the power grid is industrial Time-of-Use (TOU) price. The electricity sale price pev of the charging station operator to the EV owner is comprised of electricity purchase price and the service fee of the station. The specific expression is:
p e v ( t ) = p g r i d ( t ) + p s t a ( t )
In the Equation (7), pev is the unit charging price of the EV, pgrid(t) is the unit selling price from the power grid to the charging station, and psta(t) is the unit service cost of the vehicle charging during T time period, which is expressed as:
p s t a ( t ) = { α 1 · p g r i d ( t )   EV   owner   obeys   charging   schedule   α 2 · p g r i d ( t )   EV   owner   disobeys   charging   schedule
p e v ( t ) = { ( 1 + α 1 ) · p g r i d ( t )   EV   owner   obeys   charging   schedule   ( 1 + α 2 ) · p g r i d ( t )   EV   owner   disobeys   charging   schedule
where α 1 and α 2 represent the service rate of charging station, when EV owners obey and disobey the dispatching, respectively. In this paper, α 1 = 0.5 and α 2 = 1 . It means that EV owners disobeying the charging schedule will be charged more than those who obey the charging schedule. In this paper, the electricity purchase price of the charging station comes from the existing domestic industrial TOU price [21]. To achieve a better comprehension, this article converts the prices to USD, which are shown in Table 1:

3.2. EV Charging Mode

The car owners will not pay close attention to the change of electricity price after choosing a charging strategy. Therefore, this paper gives an assumption that the owner’s charge behavior during a charging cycle is immutable, that is, the owner selects the corresponding charging mode will continue to the end of the charge.
For a coordinated charging system, the charging services that owners can choose at charging stations include: rechargeable scheduling, non-rechargeable scheduling, rapid charging, and conventional charging (slow charging). Respectively, tm, tk, and tpar are used to represent the fast charging time, slow charging time, and parking time of the vehicle in the charging station. When EVs in the area are fully dispatchable, the charging status of the vehicle at different parking time are shown in Table 2.
At this point, EV charging status F(Tp) can be expressed as:
F ( T P ) = { λ 1 B k + ( 1 λ 1 ) B m t p a r t k λ 2 D k + ( 1 λ 2 ) B m t k < t p a r t m λ 3 D k + ( 1 λ 3 ) D m t p a r > t m
t k = ( S O C e n S O C s t ) B r / ( P k · η )
In the above equations, Bk is the unschedulable fast charging mode, Dk is the schedulable fast charging mode, Bm is the unschedulable slow charging mode, and Dm is the schedulable slow charging mode. λ 1 , λ 2 , and λ 3 are binary variables, indicating that the charge status of vehicle is incompatible, and it is selected by the owner. Pm and Pc are the charging power of slow charging and fast charging.

4. Model Optimization

In the case of a charging optimization only considering the charging rates, it will lead to the result that most vehicles charge in the load valley. It may cause a new peak in the load valley if too much EVs connected to the grid. To avoid this, we take the vehicle charging cost and the grid load peak-to-valley difference as the optimization goal, and establish an objective function of the EV coordinated charging optimization model as follows:
{ f 1 = min j = 1 96 i = 1 N x i j P i p j Δ t f 2 = min ( L max L min ) = min [ max ( P 0 j + i = 1 N P i x i j ) min ( P 0 j + i = 1 N P i x i j ) ] j = 1 , 2 , , 96
where f1 is the target function of the vehicle owner charging rates, Pi is the power of the ith vehicle, pj is the price of the charging station during jth time period, and xij is the charging of the ith EV during the jth time period, Δ t is a 15 min interval out of 96 scheduling periods in a day. f2 is the system peak-to-valley difference objective function, L max is the load peak, Lmin is the load valley, P0j is the system normal load, and i = 1 N P i x i j is the charging load of N EVs at jth time period.
The coordinated charging process of EVs needs to meet certain conditions, which means when the EV is charged, the actual battery power cannot exceed the total capacity of the battery, and cannot be less than the amount desired by the EV owner, which can be expressed as:
S O C h S O C e n 1
Substituting Equations (4) and (13) into Equation (14), the following Equation can be obtained by converting the state of charge of the battery into a corresponding charging time constraint:
( S O C h S O C s t ) B r / ( P i Δ t η ) j = 1 96 x i j ( 1 S O C s t ) B r / ( P i Δ t η )

5. Case Analysis

5.1. Hypotheses of Simulation

If the heuristic algorithm can be used to move the charging time tc to the grid load period within tstay, the time period of the vehicle staying in the charging station, in the case of the same number of EV grid-connected charging, the peak-to-valley load difference will be greatly reduced. The heuristic algorithm is used to solve the mathematical model above.
This article selects the conventional load data of the EV provided in [22]. Assuming that the normal load and the charging load of the EVs are under the transformer, and the fast charging power of the EVs in the charging station is set to 7 kW and the slow charging power is set to 3.5 kW. When the owner leaves the charging station, the electric power is set to 90% (SOCh = 90%), and the charging efficiency η = 1, the battery capacity of EVs is 33kW (Br = 33kW), and the battery level must be higher than the desired amount of power required when an EV leaves.
The Monte Carlo method is used to initialize the arrival time tst and the expected pickup time ten of N EVs in charging stations, EV initial charging SOCst, and EV desired charging SOCh. To verify the control effect of coordinated charging, the article also calculates the operational state of the charging station under the condition of disordered charging, and compares the simulated results with the coordinated charging situation.
During the charging, the frequent switching of the charging will cause many adverse effects on the power grid. Therefore, the charging method considered in this paper is: after the vehicle owner selects the corresponding charging mode, the charging station provides continuous charging service for the EV till the owner picks up the car. If the EV battery is fully charged before the owner picks up the car, the charging will be stopped.

5.2. Simulation Results

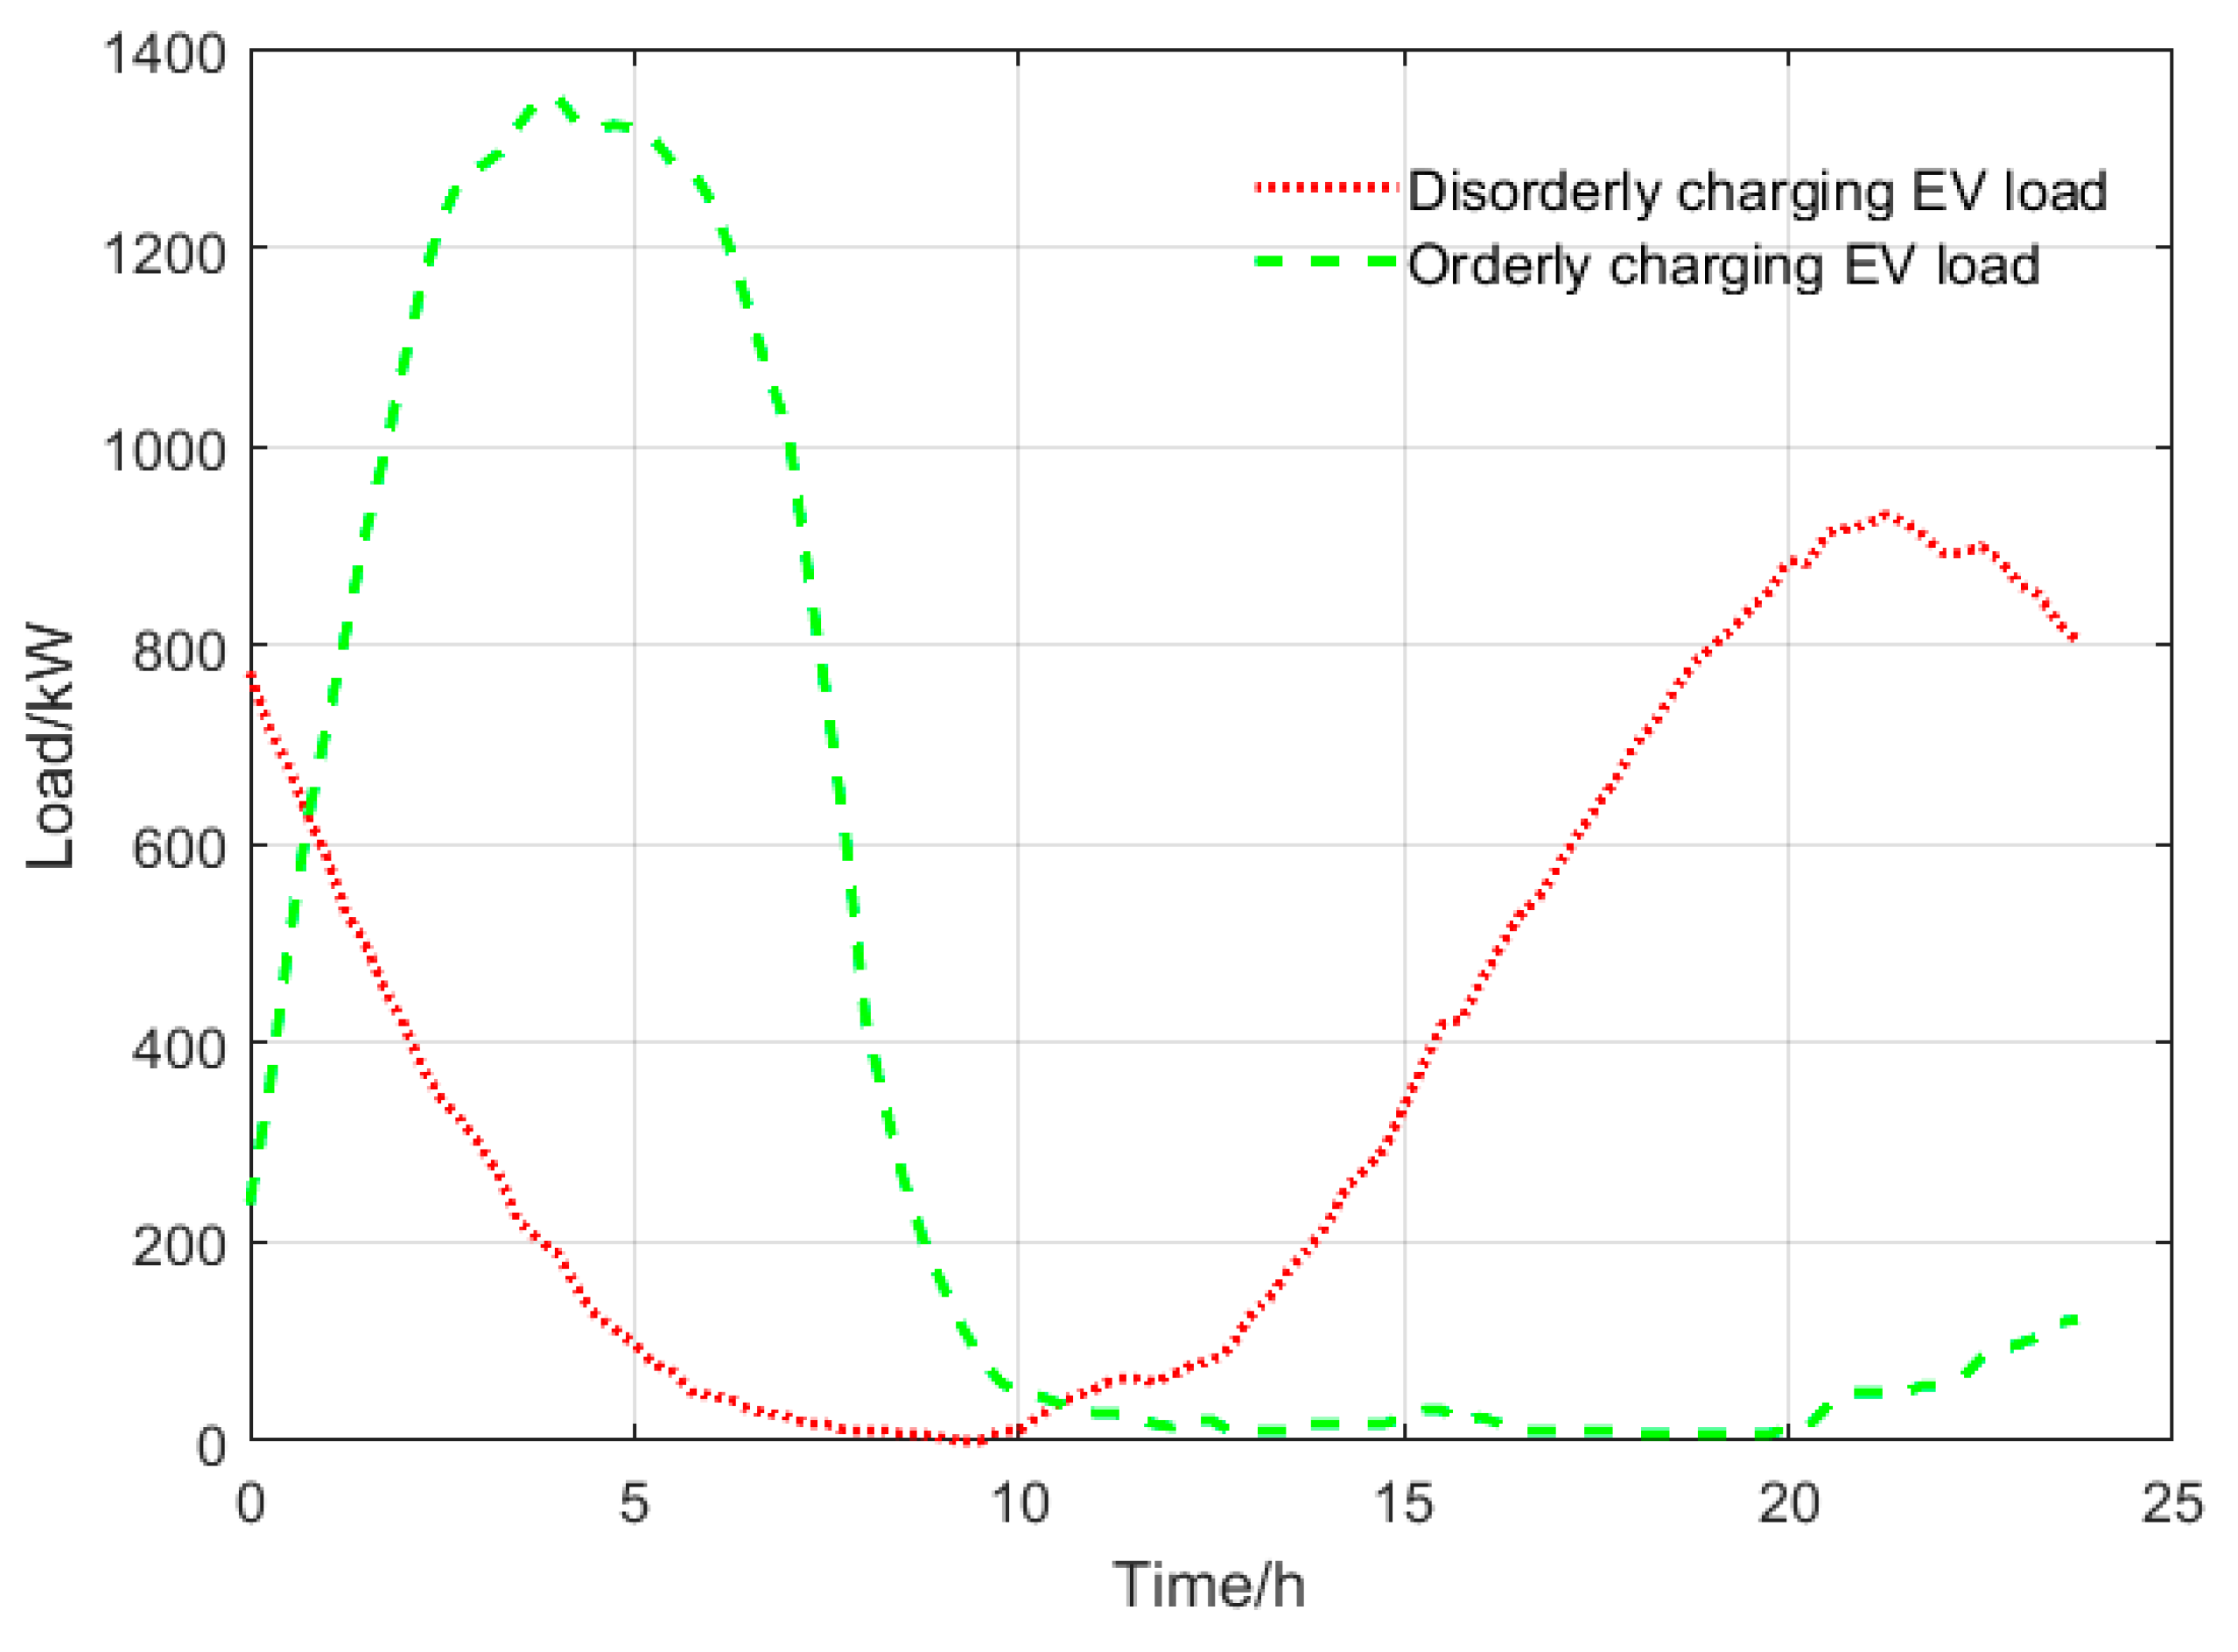
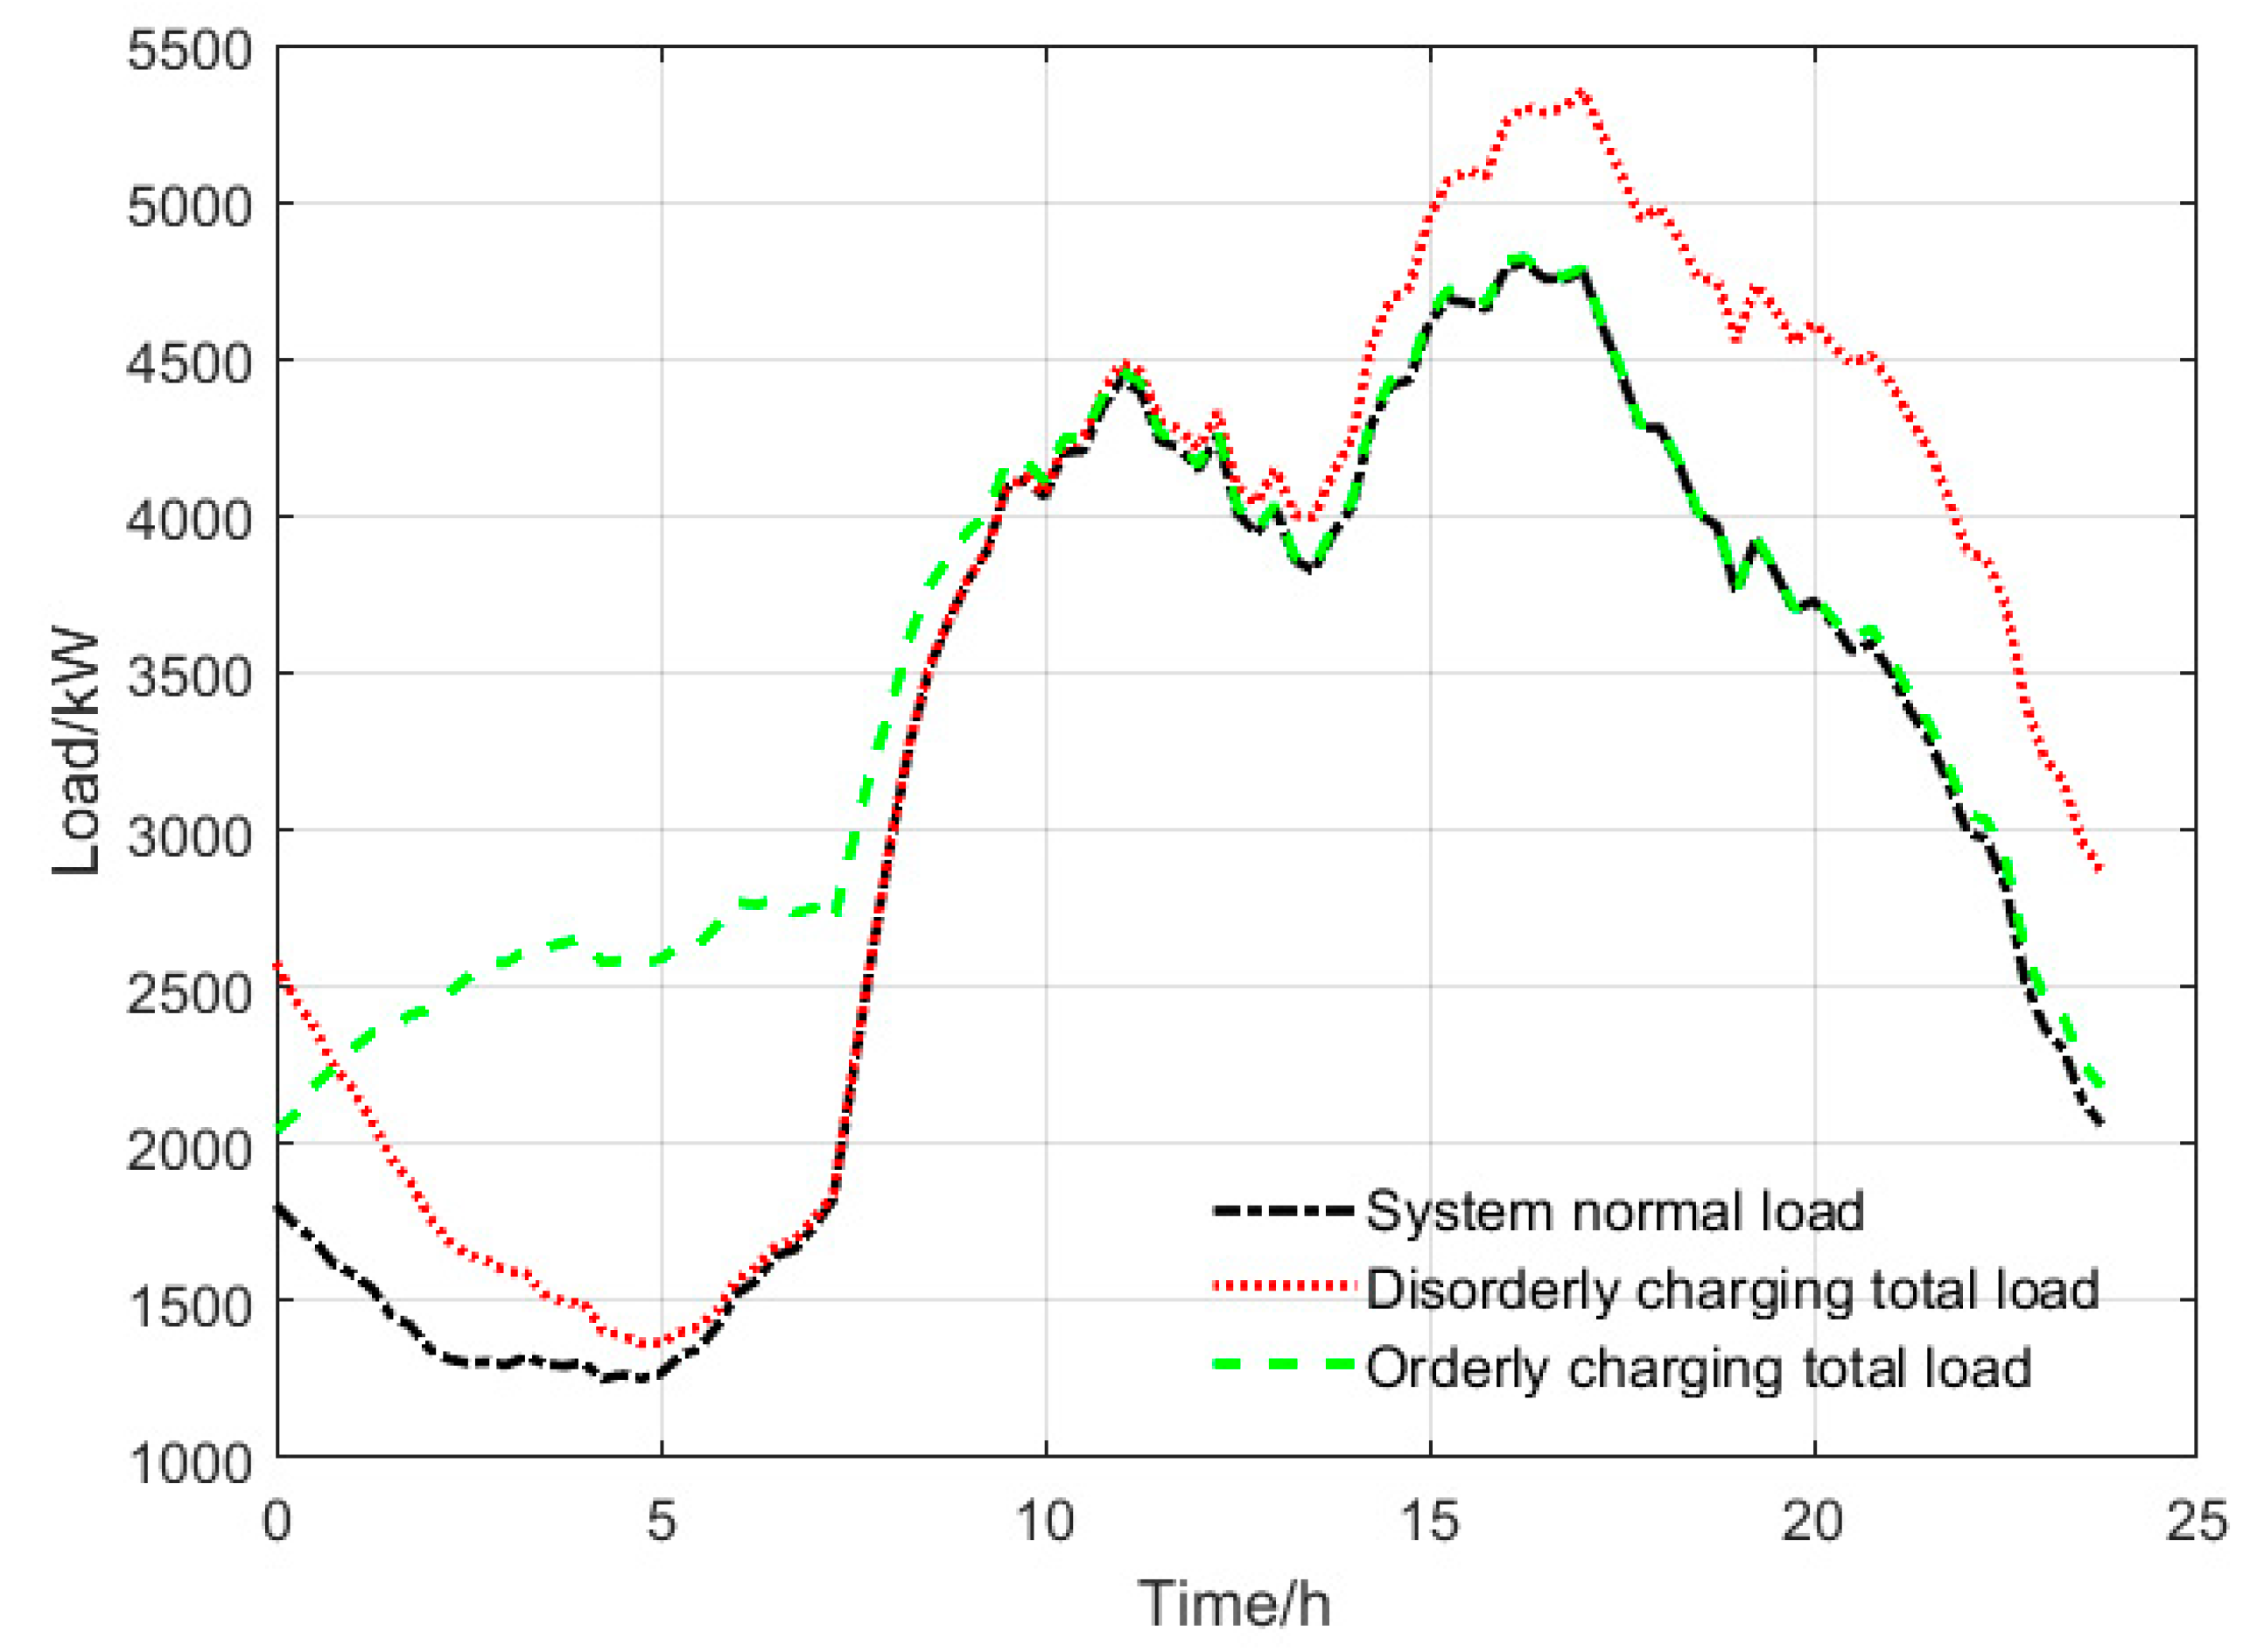
5.2.1. Coordinated Charging and Disordered Charging

The heuristic algorithm is used to optimize the coordinated charging of electric vehicles under the consideration of the charging cost of the vehicle owner and the peak-to-valley difference of the load.
We firstly make the comparison of system charging load changes when EV owners fully response to coordinated charging or disordered charging mode (the situation of the owner’s partial response will be mentioned later). Figure 2 and Figure 3 show a 400 EVs charging load curve and a system total load curve for coordinated and normal charging mode.
With the charging scheme including different charging powers shown in Table 2, when EV owners fully respond to the coordinated charging scheme, EV charging load can be well shifted to the system load valley compared with the disordered charging method.

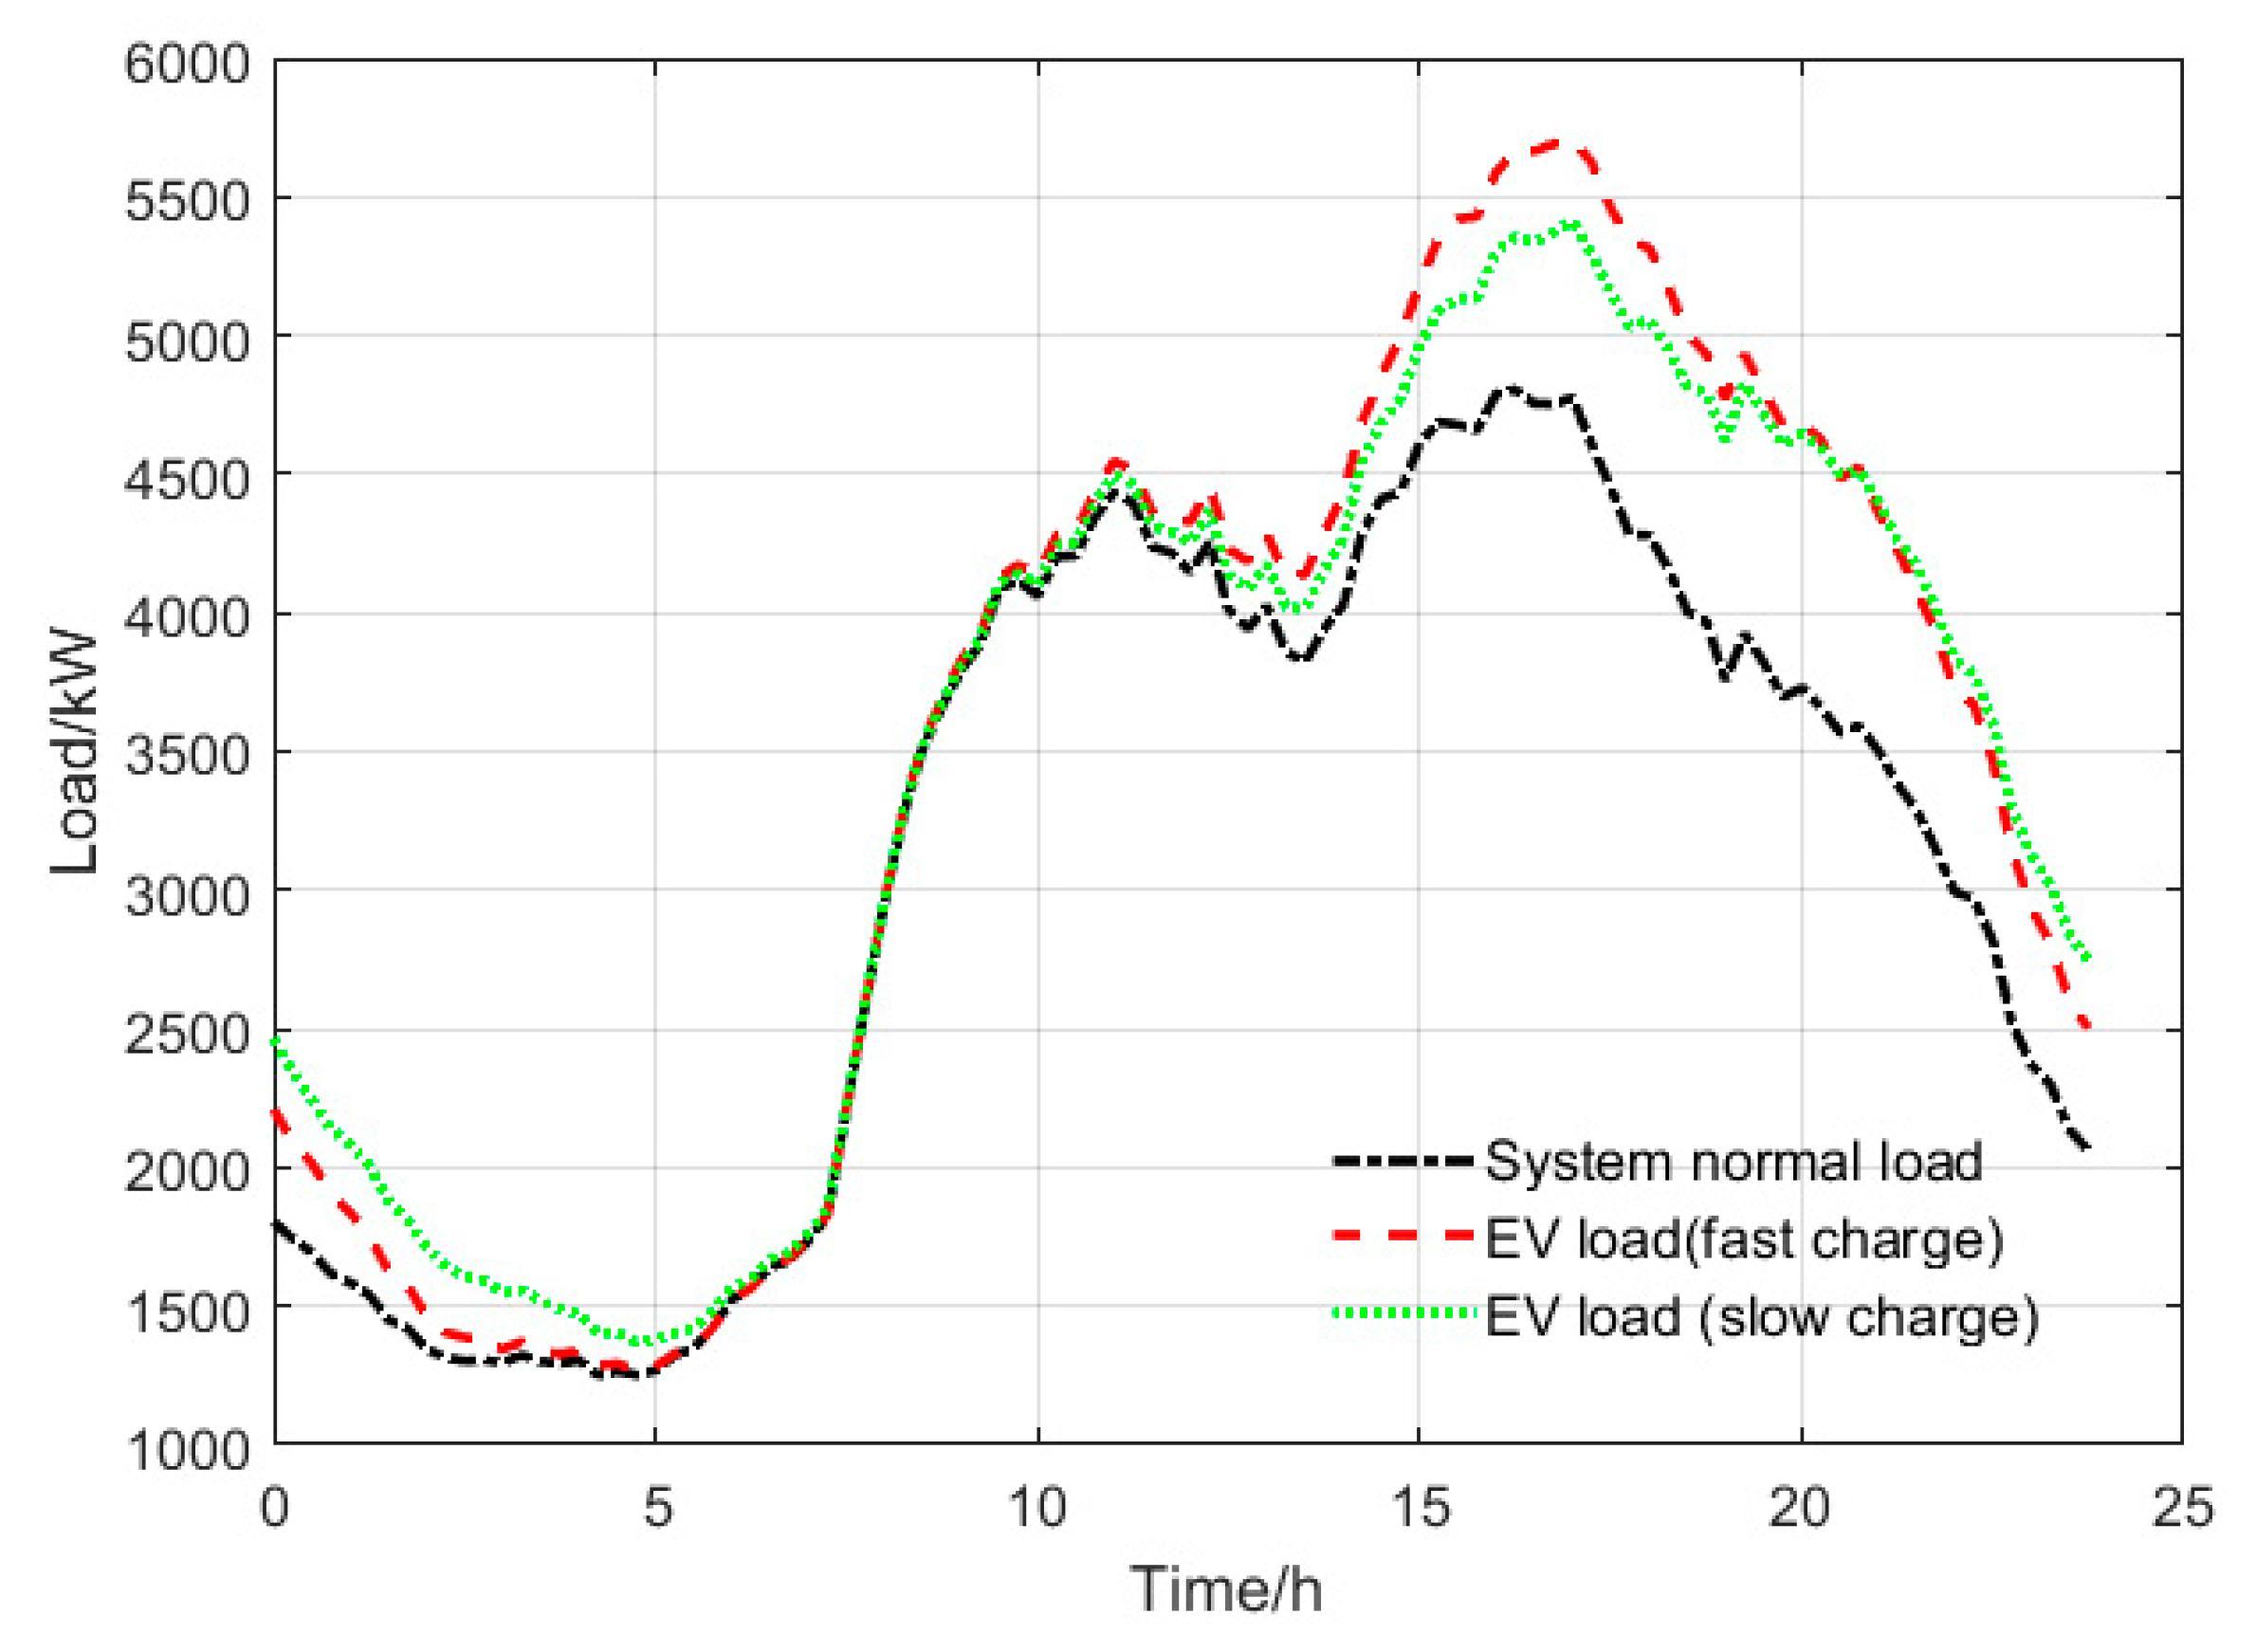
5.2.2. Different Charging Modes in Disordered Charging

This section explores the effect of load change caused by different EV charging power modes. Figure 4 shows an EV load curve and a system total load curve for 400 EVs connected in fast charge and slow charge modes, respectively.
When the same number and same charging demand of EVs are connected to the grid for disordered charging, the charging power is larger, the impact on the power grid is greater, the charging power is smaller, and the electric vehicle load curve is relatively flat. At this time, the system load peak-to-valley difference in the fast charge and slow charge modes is 4119 kW and 3884 kW, respectively.

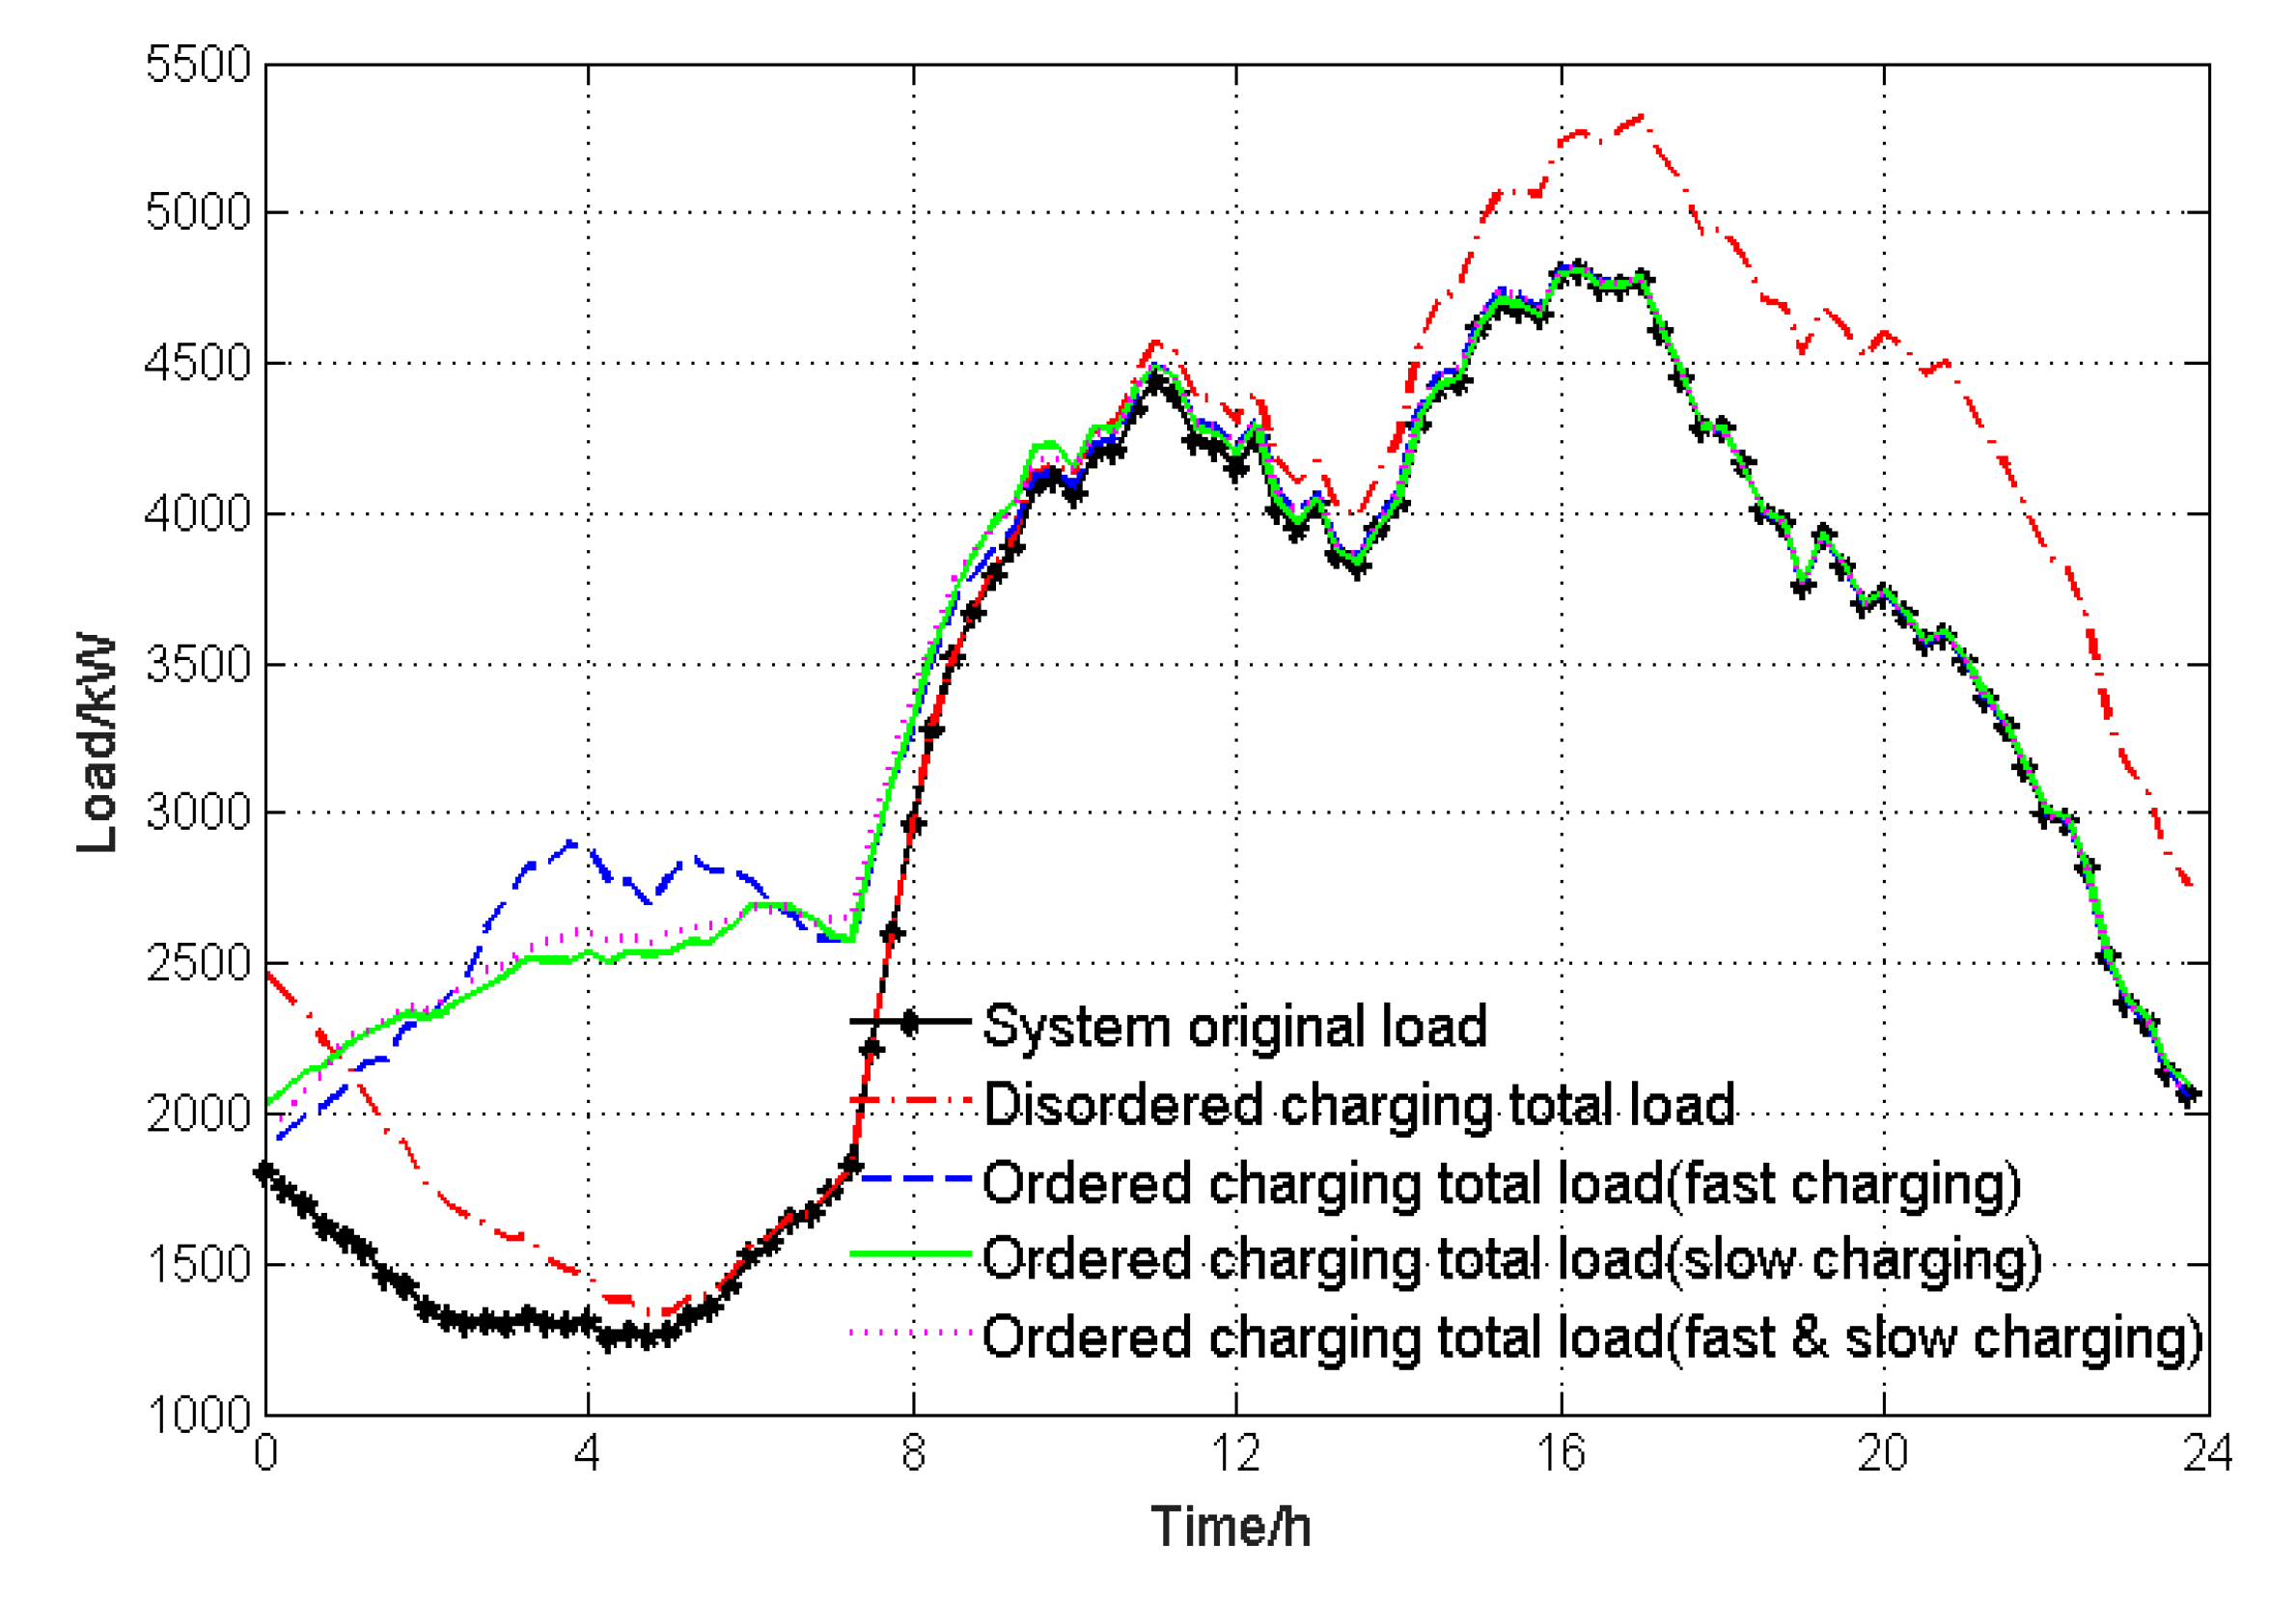
5.2.3. Different Charging Modes in Coordinated Charging

Figure 5 shows the comparison of the load curves of 400 EVs with a given initial state in the fast charging, slow charging, and fast charging and slow charging modes represented by Equation (10), respectively. It can be seen from Figure 5 that when the EV owner adopts different charging powers to participate in the ordered charging planning, the load can be shifted to the load valley period compared with the disordered charging method. When the vehicle adopts the fast charging mode for the coordinated charging plan, it is easier to cause a new load spike in the valley period due to the impact caused by the large charging power.
Table 3 shows the system load peak-to-valley difference, vehicle charging cost and charging station revenue comparison of 400 EVs in different charging modes. It can be seen from the table that, in terms of charging cost and charging station revenue, the coordinated charging method can better reduce the charging cost of EV owner compared with the disordered charging method, but the charging station revenue is also reduced by 36.53%: from 409 USD to 257 USD.
However, due to the fact that during the coordinated charging process of the vehicle, the charging period is moved to the valley period, and the revenue of the charging station unit is lower, the revenue of the charging station also decreased. In the case that the initial demand of the vehicle is the same, the charging cost and charging station revenue of the electric vehicle with different charging powers after participating in the coordinated charging are not large, mainly depending on the total required charging amount of the vehicle.

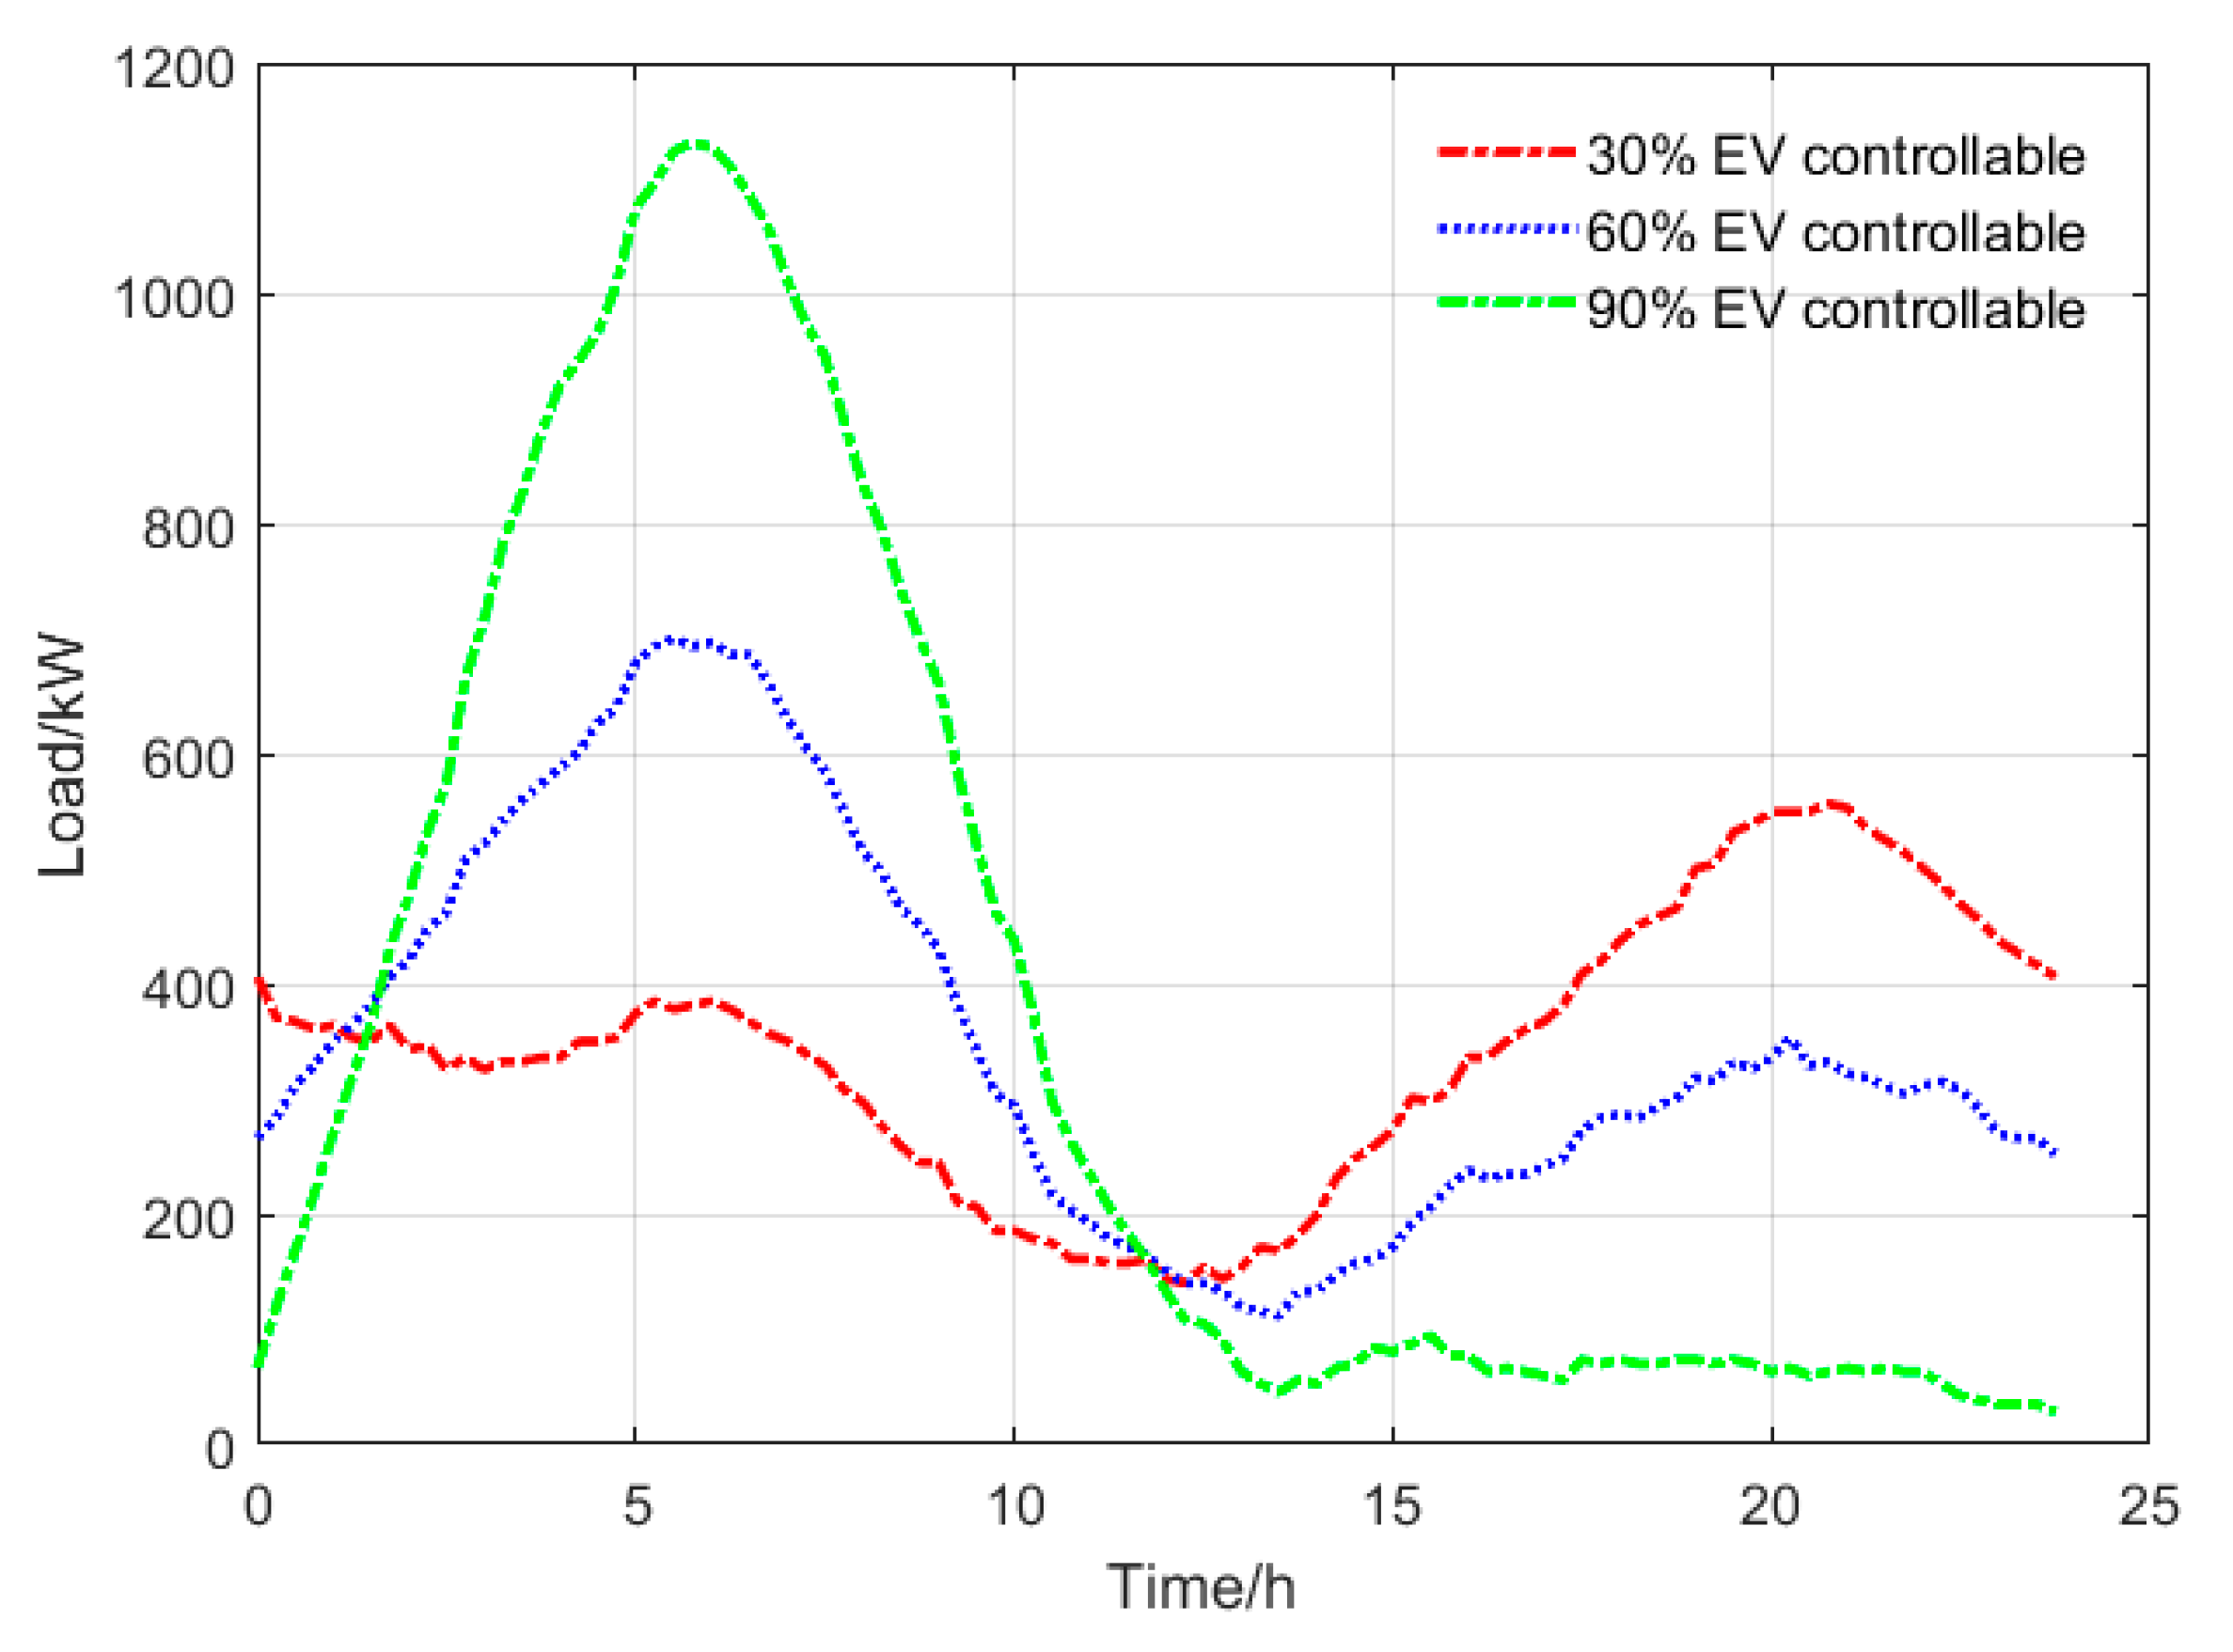
5.2.4. Coordinated Charging Analysis under Different EV Controllable Ratios

Figure 6 and Table 4 show the variation of system peak-to-valley difference, charging cost and charging station revenue when 400 EVs participate in coordinated charging under different controllable ratios (30%, 60%, and 90%, respectively). From the improvement degree of the load peak-to-valley difference, the higher the proportion of the vehicle owner’s response to charging, the smaller the load peak-to-valley difference, that is, the better the effect of peak load and valley filling on the system load. When the controllable proportion of electric vehicles increased from 30% to 90%, the load peak-to-valley difference are 3483 kW and 2980 kW, respectively, decreased by 503 kW.
From the perspective of the owner’s charging cost, the greater the proportion of the owner’s response to charging, means that the more EV charging time can be planned to the load valley. If the scheduling fee is not considered, due to the lower power rate in the valley period, the EV charging rate and the charging station revenue decrease as the user’s response charging ratio increases. At 30%, 60%, and 90% controllable ratio, the charging station revenues are 370 USD, 342 USD, and 309 USD, respectively.
When charging an additional scheduling fee for a vehicle owner who refuses to participate in an coordinated charge, the revenue of the charging station are 647 USD, 502 USD, and 343 USD under the controllable ratio of 30%, 60%, and 90%, and the revenue increased by 74.7%, 46.80%, and 10.9%. The less controllable the EV is, the more the charging station will charge the owners who are not involved in the coordinated charging. For charging station operators, this way can increase the operating revenue of the charging stations. On the other hand, it can potentially encourage the vehicle owners to participate in the coordinated charging scheduling of the system, which helps to smooth the grid load curve.
From the perspective of EV owner’s charging cost, the greater the proportion of the owner’s response to coordinated charging, means that the more EV charging time can be planned to the load valley. Charging station revenue during the load valley period is lower. In the case of the same charging demand, the more the EV owners respond to the coordinated charging, the more electricity is sold during the valley, the less electricity is sold during the peak period, and the charging station revenue decreases. If the scheduling fee is not considered, the EV charging rate and the charging station revenue decrease as EV owner’s response charging ratio increases. At 30%, 60%, and 90% controllable ratio, the charging station revenues are 370 USD, 342 USD, and 309 USD, respectively.
When charging additional fees for owners who refused to participate in the coordination fee, the revenue of the charging station was 647 USD, 502 USD, and 343 USD, respectively. The controllable ratio was 30%, 60%, and 90%, and the revenue increased by 74.7%, 46.80% and 10.9%, respectively. The lower the controllability of the EV, the more car owners refuse to participate in the orderly charging, and the more the additional service fees are charged for the owner who refuses to participate in the coordinated charging. For charging station operators, this approach can increase the operating revenue of the charging station. On the other hand, it can potentially encourage EV owners to participate in the system’s coordinated charging schedule, which helps to smooth the grid load curve.

6. Conclusions

This paper explores the adverse effects of a certain number of EVs connected to the grid in the case of disordered charging, and the EV coordinated charging can well shift EV load to the system load valley, which confirms the previous findings.
On this basis, the EV grid-connected charging effects on charging station electricity purchase and sale under different charging power conditions are explored. The research results show that under the same charging demand, the change of charging power will affect the fluctuation of the system load curve, and the high-power fast charging mode will have a greater impact on the power grid.
During EV coordinated charging, the EV charging periods in different charging modes can basically move to the valley period. Therefore, in the case of the same initial EV charging demand, there is small difference in charging station purchasing and selling electricity cost in different charging modes after EV coordinated charging, which mainly depends on EV total charging demand.
In terms of EV owners’ charging cost and charging stations’ revenue, compared with the disordered charging method, the coordinated charging method can better reduce the charging cost of owners, but the charging station revenue is also reduced accordingly. Based on this, we further propose a charging mechanism for the additional charging service rate when EV owners do not participate in coordinated charging. This mechanism can encourage EV owners to participate in the peak clipping of the grid through coordinated charging.
Finally, by comprehensively considering the different charging rates of different electric vehicle owners, the benefits brought by the charging service scheme proposed in this paper are more intuitively reflected. Vehicle owners who do not participate in the coordination of charges will be charged an additional service fee to compensate for the reduced revenue of the charging station caused by the above-mentioned EV coordinated charging. This is more advantageous for the charging station operator. For the power grid, it can indirectly encourage more car owners to participate in the peak clipping of the grid by coordinating charging.
The paper does not consider the impact of construction costs on the station revenue such as the number of charging facilities in the charging station. Besides, this paper does not consider the Vehicle-to-Grid (V2G) optimization problems and the cost-benefit problem of EV optimization control for intermittent energy grid connection, which needs further research.

Author Contributions

Y.Z. (Yutong Zhao), H.H., and X.C. were responsible to the conceptualization of the algorithms; Y.Z. (Yutong Zhao), H.H., and B.Z. were responsible to methodology; H.H. and X.C. conducted formal analysis, Y.Z. (Yutong Zhao), H.H., and Y.Z. (Yiguo Zhang) were responsible to validation; Y.J., Q.Z., L.C., and Y.C. conducted the investigation and supervision.

Funding

This research was funded by the project “research and demonstration application of key technologies for charging intercommunication, safety and remote detection of electric vehicle charging facilities” of State Grid Corporation Headquarters Science and Technology Project, (Project number 5202011600U5).

Conflicts of Interest

The authors declare no conflict of interest.

References

  1. Clairand, J.M.; Javier, R.G.; Bel, C.A. Smart Charging for Electric Vehicle Aggregators considering Users’ Preferences. IEEE Access 2018, 6, 54624–54635. [Google Scholar] [CrossRef]
  2. Gan, L.; Ufuk, T.; Steven, H.L. Optimal Decentralized Protocol for Electric Vehicle Charging. IEEE Trans. Power Syst. 2013, 28, 940–951. [Google Scholar] [CrossRef]
  3. Yao, W.; Zhao, J.; Wen, F. A Hierarchical Decomposition Approach for Coordinated Dispatch of Plug-in Electric Vehicles. IEEE Trans. Power Syst. 2013, 28, 2768–2778. [Google Scholar] [CrossRef]
  4. Richardson, P.; Flynn, D.; Keane, A. Optimal Charging of Electric Vehicles in Low-Voltage Distribution Systems. IEEE Trans. Power Syst. 2012, 27, 268–279. [Google Scholar] [CrossRef]
  5. Rashidizadeh-Kermani, H.; Vahedipour-Dahraie, M.; Najafi, H.R.; Anvari-Moghaddam, A.; Guerrero, J.M. A Stochastic Bi-Level Scheduling Approach for the Participation of EV Aggregators in Competitive Electricity Markets. Appl. Sci. 2017, 7, 1100. [Google Scholar] [CrossRef]
  6. Wang, B.; Ai, X. Coordinated Charging of Peak-valley Time-period Optimization by Considering V2G User Reactivity. Mod. Electr. Power 2016, 33, 39–44. [Google Scholar]
  7. Chokkalingam, B.; Padmanaban, S.; Siano, P.; Krishnamoorthy, R.; Selvaraj, R. Real-Time Forecasting of EV Charging Station Scheduling for Smart Energy Systems. Energies 2017, 10, 377. [Google Scholar] [CrossRef]
  8. Tang, D.; Peng, W. Nodal Impact Assessment and Alleviation of Moving Electric Vehicle Loads: From Traffic Flow to Power Flow. IEEE Trans. Power Syst. 2016, 31, 4231–4242. [Google Scholar] [CrossRef]
  9. Mao, T.; Zhang, X.; Zhou, B. Intelligent Energy Management Algorithms for EV-charging Scheduling with Consideration of Multiple EV Charging Modes. Energies 2019, 12, 265. [Google Scholar] [CrossRef]
  10. Sun, B.; Huang, Z.; Tan, X. Optimal Scheduling for Electric Vehicle Charging with Discrete Charging Levels in Distribution Grid. IEEE Trans. Smart Grid 2018, 9, 624–634. [Google Scholar] [CrossRef]
  11. Erdinc, O.; Uzunoglu, M. Optimum design of hybrid renewable energy systems: Overview of different approaches. Renew. Sustain. Energy Rev. 2012, 16, 1412–1425. [Google Scholar] [CrossRef]
  12. Xiao, X.; Wen, J.; Tao, S. Study and Recommendations of the Key Issues in Planning of Electric Vehicles’ Charging Facilities. Trans. China Electrotech. Soc. 2014, 29, 1–10. [Google Scholar]
  13. Sarker, M.; Kirschen, D. Optimal coordination and scheduling of demand response via monetary incentives. IEEE Trans. Power Syst. 2015, 6, 1341–1351. [Google Scholar] [CrossRef]
  14. Luo, C.; Huang, Y.; Gupta, V. Stochastic Dynamic Pricing for EV Charging Stations with Renewables Integration and Energy Storage. IEEE Trans. Smart Grid 2018, 9, 91494–91505. [Google Scholar] [CrossRef]
  15. Liu, P.; Yu, J.; Mohammed, E. Decentralised PEV charging coordination to absorb surplus wind energy via stochastically staggered dual-tariff schemes considering feeder-level regulations. IET Gener. Transm. Distrib. 2018, 12, 3655–3665. [Google Scholar] [CrossRef]
  16. Zethmayr, J.; Kolata, D. Charge for Less: An Analysis of Hourly Electricity Pricing for Electric Vehicles. World Electr. Veh. J. 2019, 10, 6. [Google Scholar] [CrossRef]
  17. Luo, Z.; Hu, Z.; Song, Y.; Xu, Z. Coordinated Charging and Discharging of Large-scale Plug-in Electric Vehicles with Cost and Capacity Benefit Analysis. Autom. Electr. Power Syst. 2012, 36, 19–26. [Google Scholar]
  18. Federal Highway Administration. US Department of Transportation. 2009 National Household Travel Survey [EB/OL]. Available online: http://nhts.ornl.gov (accessed on 30 April 2019).
  19. Dang, J.; Tang, Y.; Ning, J.; Fu, X.; Wang, B. A Strategy for Distribution of Electric Vehicles Charging Load Based on User Intention and Trip Rule. Power Syst. Prot. Control 2015, 16, 8–15. [Google Scholar]
  20. Zhang, W.; Zhang, D.; Wen, J.; Zhang, C. Optimized Design of Electric Bus Battery Swap Station. J. Beijing Jiaotong Univ. 2012, 36, 100–104. [Google Scholar]
  21. Xu, Z.; Hu, Z.; Song, Y. Coordinated Charging of Plug-in Electric Vehicles in Charging Stations. Autom. Electr. Power Syst. 2012, 36, 38–43. [Google Scholar]
  22. Luo, Q. Studies on the Impacts of Electric Vehicles Charging to the Power System and Coordinated Charging. Master’s Thesis, Zhejiang University, Zhejiang, China, 2016. [Google Scholar]
Figure 1. Electric Vehicle (EV) charging status in the charging station.
Wevj 10 00047 g001
Figure 2. Coordinated charging and disorderly charging EV load curve in 400 EVs fully controllable mode.
Wevj 10 00047 g002
Figure 3. Coordinated charging and disordered charging total load curve of 400 EVs in fully controllable mode.
Wevj 10 00047 g003
Figure 4. Total load curves of disordered charging of 400 EVs in fast or slow charge mode.
Wevj 10 00047 g004
Figure 5. Coordinated charging load curves of 400 EVs in fast charging, fast & slow charging and slow charging mode.
Wevj 10 00047 g005
Figure 6. Charging Load Curves of 400 EVs with Different Controllable Proportions.
Wevj 10 00047 g006
Table 1. Time-of-Use (TOU) prices of power grid.
Period of TimeCharging Station Purchase Price (USD/kWh)Charging Station Selling Price When EV Owner Obeys the Dispatch (USD/kWh)Charging Station Selling Price When EV Owner Disobeys the Dispatch (USD/kWh)
The peak time
8:00–12:00
17:00–21:00
0.1260.1890.251
The normal times
12:00–17:00
21:00–24:00
0.0990.1490.199
The valley time
0:00–8:00
0.0530.0790.106
Table 2. Vehicle Charging Status Table.
ModeFast Charge Scheduling StatusSlow Charge Scheduling Status
t p a r t k Fast charging but not dispatchableSlow charging but not dispatchable
t k < t p a r t m Fast charging and dispatchableSlow charging but not dispatchable
t p a r > t m Fast charging and dispatchableSlow charging and dispatchable
Table 3. Charging cost and peak-to-valley difference comparison of different charging modes under fully controllable conditions of electric vehicles (100% charge response).
Optimization MethodSystem Load Peak-To-Valley Difference (kW)Charging Rates (USD)Charging Station Revenue (USD)
Disordered charging40451227409
Coordinated charging (fast charge & slow charge)2842770257
Coordinated charging (fast charge)2908752247
Coordinated charging (slow charge)2828754251
Table 4. Analysis of the effects of charging load and income of 400 EVs with different controllable proportions.
EV Charging Controllable Ration (%)System Load Peak-To-Valley Difference (kW)EV Charging Rates Regardless of Scheduling Fee (USD)Charging Station Revenue Regardless of Scheduling Fee (USD)EV Charging Rates Considering Scheduling Fee (USD)Charging Station Revenue Considering Scheduling Fee (USD)Proportion of Revenue Increase Considering the Scheduling Fee (%)
30%34831139370138764774.7
60%31901025342118550246.8
90%298092730996134310.9

