Abstract
A hydrogen rail (hydrail) powertrain is conceptualized in this study, using drive cycles collected from the trains currently working on the Union Pearson Express (UPE) railroad. The powertrain consists of three preliminary different subsystems: fuel cell, battery, and hydrogen storage systems. A backward design approach is proposed to calculate the time-variable power demand based on a “route simulation data” method. The powertrain components are then conceptually sized according to the calculated duty cycle. The results of this study show that 275 kg of hydrogen is sufficient to satisfy the daily power and energy demand of a hydrogen locomotive with drive cycles similar to the ones currently working on the UPE rail route.
1. Introduction
The transportation sector accounts for a significant portion of global greenhouse gas (GHG) emissions [1,2]. In 2016 in Canada, 28.3% of the total CO2 emissions were due to the transportation and energy sector [3]. Ontario, one of the highest CO2-emitting provinces in Canada, has been able to reduce its GHG emissions in the electricity sector through replacing coal power plants with renewable power generation technologies. However, the transportation sector has remained a major contributor to GHG emissions in the province [4].
Promoting green public transport is an important step in moving towards sustainability and reducing GHG emissions [5]. In this context, rail transportation development in Ontario is a key issue for both provincial and federal governments of Canada. GO Transit System (GTS), a regional public transit system serving the Greater Golden Horseshoe region of Ontario, has seven rail lines in the Greater Toronto Area (GTA) with diverse transit schedules. Diesel multiple units (DMUs) operating in these lines are the main rail public transportation technologies in Ontario with 60,000 daily ridership. The Union Pearson Express (UPE) line placed on the Kitchener GO rail route also has several common segments with the Lakeshore GO line [6].
A major challenge for rail electrification in an urban area like the GTA is the electricity consumption of the transportation system and the consequent grid stability issues [6]. Contrary to electricity, hydrogen transportation systems will not impose excessive loads to the grid because the hydrogen can be produced at times of surplus power and stored for later use, to meet heat and electricity demands specifically for transportation applications. This can also prevent grid fluctuations and improve the flexibility of the electricity grid and help in controlling the intermittency of renewable systems [7,8,9,10,11,12].
Hydrogen transportation is a multidimensional issue that can be analyzed from different aspects including, but not limited to, hydrogen production, refueling station infrastructure, powertrain components topology, sizing, and control. Evaluating the infrastructural requirements and energy consumption of such a system is an essential part towards commercialization. In that sense, the high portion of clean electricity, generated by nuclear and renewable sources, in Ontario’s supply mix provides a unique opportunity for development of a hydrogen transportation system. Figure 1, shows Ontario electricity supply mix in 2017 [13].
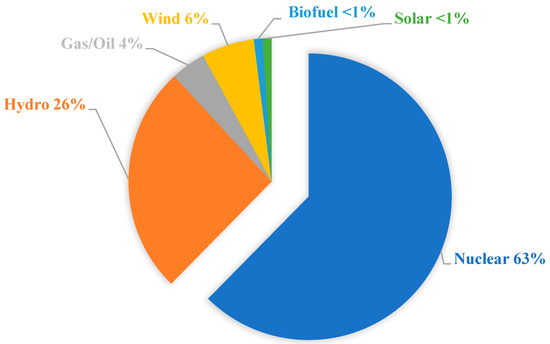
Figure 1.
Ontario electricity supply mix in 2017 [14].
An analysis by Marin focused on evaluating the impact of hydrogen and electricity supply on the cost and GHG emissions of a case study of GO transit along the Lakeshore corridor in Toronto, and this revealed that using scaled-up fuel cells within the existing Bombardier ALP-46A locomotives was reasonable [15]. Furthermore, multiple studies have investigated different design and operation aspects of hydrogen rail systems. For instance, Li developed a tramway powertrain system, which consisted of a proton-exchange membrane fuel cell (PEMFC), a battery and a supercapacitor that evaluates the responses of the designed energy management system [16]. The designed energy management system was able to guarantee safe operating conditions and also increased the lifetime of each power source, thereby achieving better overall system energy efficiency. Peng proposed an experimental powertrain prototype for a locomotive and used PEMFC as the prime energy source [17]. The operation of the designed locomotive was tested on a test line in Sichuan, China. Yamamoto tested a hybrid fuel cell/battery system for a railway vehicle, which was supposed to be an equivalent to current system used in Japan [18]. The authors found an efficiency of 65% for their proposed system. Hsiao developed a PEMFC used in a mini-train [19]. The developed system included both hydrogen storage and lead–acid battery systems, and was tested in Taiwan. The test results showed the capability of battery/fuel cell hybrid system was feasible to be implemented in Taiwan weather conditions and supplied stable power. A model of a locomotive with PEMFC/battery hybrid energy system were developed in 2018. In this study, to size the components, the authors used a diesel locomotive class WDM-7 which is used by the Indian Railways as the baseline [20].
The first prototype of a large-scale hydrogen fuel cell locomotive was developed in a North American consortium. In the implementation procedure of the 130 ton shunt locomotive, 300 kW of the power demand was supplied by means of hydrogen fuel cells. The locomotive was fabricated between 2007 and 2009 [21]. A group of Spanish researchers investigated the potential of fuel cell powertrains for the railways of Spain between 2010 and 2013. They used three different power management scenarios in a hybrid tramway over the rail routes in Sevilla [22]. In another experimental study, an English research group developed numerical models and used a typical trip and train system as the benchmark [23]. Between the proposed configurations of the study, it turned out that the most optimal topology only needed a tank of 27 kg of hydrogen to complete each trip. However, these studies were not commercially concluded until 2016, when ALSTOM tested the first ever commercial fuel cell train system in Germany [24].
Hydrogen powertrains may be considered as an ambition of future railway transportation, due to their suitability for urban, suburban, and military transportation needs. The development of such complex systems, however, needs interdisciplinary studies for each route. In that sense, this study aims at the conceptual design of different subsystems of a hydrogen powertrain for the UPE route. The reason for such a claim is the necessity to identify different aspects in the development of such a complex system. The aim of this study is to find the approximate sizes of compulsory components used in a hydrail powertrain system. These components consist of Li-ion battery packs and fuel cell stacks. The main goal of such an analysis is to characterize the daily hydrogen demand for the specific rail route.
The rest of the manuscript is organized as follows: In Section 2, a mechanical model is developed to evaluate the power demand of UPE route with respect to the particular drive cycle. It is assumed that the trains follow a unique drive cycle in each trip. Additionally, the technical specifications for current locomotives are analyzed, as our benchmark, to compare with the resultant duty cycle to evaluate the fidelity of the proposed platform. In Section 3, a hybridization scenario is implemented based on the calculations done in Section 2. The component sizing is done based on the demanded duty cycle in Section 3. Section 4 is devoted to the conclusions of the study.
2. Benchmarking
Analyzing the demanded driving cycle is the first step in sizing a hybrid powertrain. Once the drive cycle is extracted, the fuel cell prime mover can be designed based on the demanded duty cycle and the desired topology. The current UPE’s prime movers “Nippon Sharyo diesel multiple units (DMUs)” are used as a benchmark for our calculations.
Table 1 shows the specifications of a self-propelled DMU train. The provided information corresponds to each DMU, whether the trainset is an A-car or C-car. An “A-car” configuration consists of two DMU cars and a C-car configuration consists of three DMU cars synchronized to operate together.

Table 1.
Self-Propelled Diesel Multiple Unit (DMU) Train Specification [25].
2.1. Drive Cycle
Cyclic energy and power demand can be calculated using drive cycle. For our work, UPE drive cycle was extracted using the “Speed Tracker” mobile application with a one second data-sampling rate as shown in Figure 2. This application uses the global positioning system (GPS) data to save the time-dependent velocity of the vehicle on its path. In UPE route, each trip takes 25.5 min and the train has 10 min of idling at the Union and Pearson stops. From the graph, it turns out that the maximum train speed on the route is 127 km/h, which corresponds to the train specification information [25].
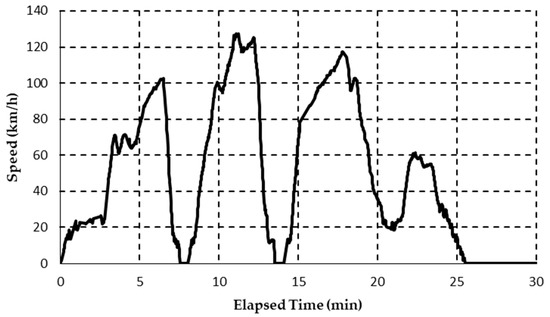
Figure 2.
Union Pearson Express (UPE)-extracted reputable drive cycle.
Figure 3 shows the route altitude versus time through a UPE route derived from the data output of the Speed Tracker application. The change in the train altitude occurs because of the difference in the altitude of Toronto (with an average of 76.5 m) and Mississauga, Ontario, Canada, where the Pearson Airport is located (with an average altitude of 156 m).
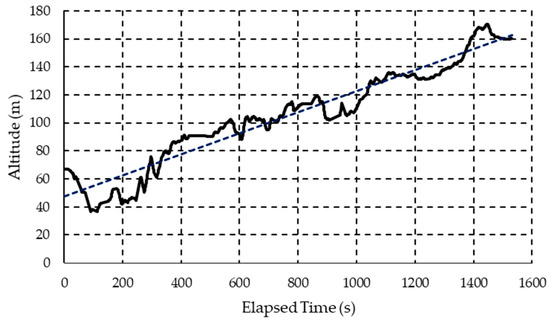
Figure 3.
Altitude of the UPE route.
2.2. Duty Cycle
The duty cycle shows the relationship between the power demand and time [26]. Once the duty cycle is obtained, parameters such as peak and average power demand, power transient response, and peak and average energy demand are calculated and used in sizing the powertrain [27]. Duty cycle calculation can be done based on two types of data: “time-at-notch” measurement data and “route simulation data” [26]. In the former method, an event recorder is the preliminary instrument that is used to monitor the train’s power demand. Hence, the parameters of interest are estimated based on statistical analysis. The latter is only used when the drive cycle is highly repeatable and the simulation can be undertaken by means of analytical methods [23]. Since the UPE drive cycle does not change during different trips as based on our multiple data collection processes, we have used a simple theoretical model to calculate the demanded duty cycle based on the collected drive cycle.
To develop an applicable model which can represent the dynamic response of the powertrain based on the above mentioned drive cycle, we considered four basic sources of resistant forces: gravitational force, aerodynamic drag, rolling resistance, and transient force, described by the following equations:
In the above equations, is the acceleration due to gravity (9.81 m/), is the air density (1.184 kg/), is the drag coefficient (0.9388), is the frontal area with a value of 15.33 for the UPE trains [25], is the train velocity, and , and are the rolling resistances with values of 0.0019 and 0.000015, respectively.
To calculate the weight of the train, it was assumed that the passengers have an average weight of 65 kg (per person). A C-car configuration is modeled in this study. As a result, the train should be able to transfer 175 (3 × 58 + 1) passenger in each trip [28]. It is also assumed that each passenger carries a 5 kg load into the car. Hence, the total weight of a full train can be estimated as 236,779 kg. Moreover, Equation (5) was used to calculate the track grade from Figure 4.
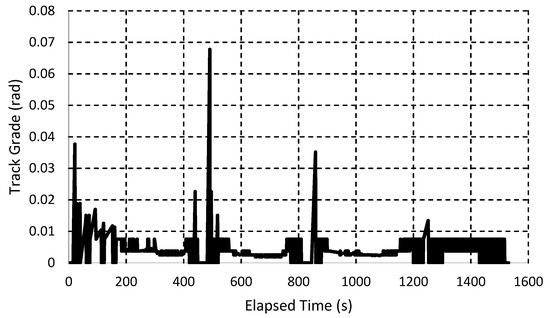
Figure 4.
Normalized time variant grade.
In this equation, and represent the altitude and distance respectively and are both in meter. Figure 4 shows the normalized time variant grade for the UPE route.
In the next step the total traction force is calculated using Equation (6).
To find the magnitude of torque applied on wheels at each time step, we used a single degree of freedom (1-DOF) dynamic model, Equation (7), with the proportional torque distribution factor of 0.5 as the only parameter to be considered for the longitudinal acceleration and velocity. The value of 0.5 is based on the assumption the wheel forces are evenly distributed. To simplify the calculations at this step, it is also assumed that the wheel is a solid and rigid cylinder with a radius of meter, which corresponds to the current train’s wheel dimension [25].
Here, is wheel inertia in kg m2 and is proportional torque distribution factor. Once the wheel tractive torque is calculated, angular velocity and acceleration can be calculated using the demanded drive cycle. Since the positive direction of the axis is fixed to the direction of the train velocity, the positive direction for the angular velocity in the proposed backward modeling approach was assigned to be clockwise.
Figure 5 shows the calculated power demand for trains working in the UPE route. It can be seen that the train motion has three different modes: acceleration, deceleration, and idling. The braking events were identified as the regions with negative acceleration slope. To estimate the corresponding braking power, for each two successive time instants within the braking region, the difference in power demand due to the grading resistance change was subtracted from the difference in total power demand. This wasted power can be partly recovered as regenerative braking where the battery is partially charged Figure 6.
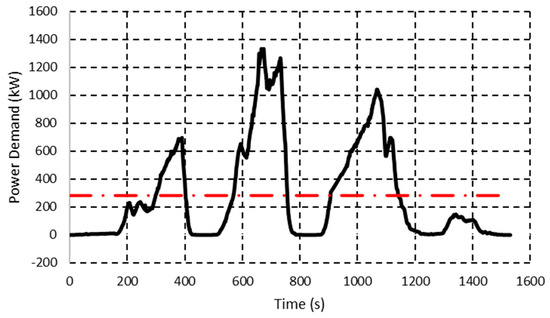
Figure 5.
Evaluated duty cycle of the current trains working in UPE route.
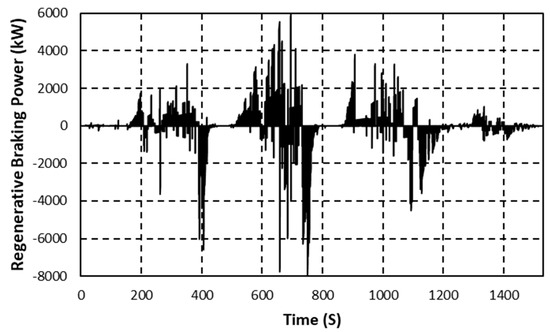
Figure 6.
Regenerative braking power.
To analyze the route power demand, a histogram of the power demand during each journey is calculated and shown in Figure 7. As can be seen, the most frequent part of the power demand occurs below the mean power of 283.3 kW and is shown in Figure 5 with a red line. In the next part of this study, we used the mean power as a design criteria value to conceptualize an appropriate topology for the mentioned drive cycle. This would be a good option since the value differs between different routes and can be used in conceptual design step for any individual route.
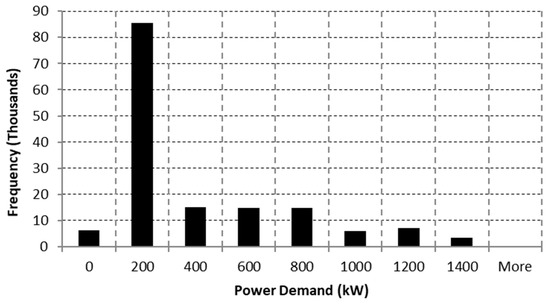
Figure 7.
Histogram of power demand.
To use the estimated power demand for calculating the hydrogen fuel consumption, we compared our results with the Nippon Sharyo DMU specifications. The “2-B” prime mover has two trucks, and the wheel assemblies are installed on each of its three cars. The “2” truck is installed under the front of the unit and contains two idler axles in a row. Also, there is a “B” bogie located under the rear of each car which has two powered axles. According to the Table 2, each bogie of the current locomotives is equipped with a QSK19-R prime mover. Based on the engine specification data, the output power of the engine is 567 kW. By comparing this value with the calculated power demand, 400 kW of peak power demand, in this paper, a safety factor of 1.4 is observed showing an acceptable deviation.
Table 2.
Modified preliminary prime mover and final drive specifications.
3. Hybridization Scenario
Figure 8 shows a schematic of the topology of interest in conceptualizing the powertrain based on the collected drive cycle. In the basic topology, the main power supply resource is the fuel cell.
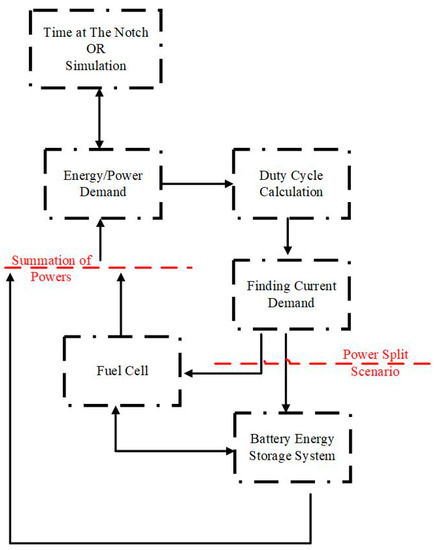
Figure 8.
Topology of interest in designing the powertrain for the demanded drive cycle.
The fuel cell should supply the energy demand in different phases. In this scenario, the fuel cell individually provides more than 50% of power demand, which is below the mean power demand (283.3 kW). This means that the power demand at each time step can be broken down into two portions. The first portion should be supplied by the primary resource, which is the fuel cell in this case, and the second proportion is supplied by the battery package. Although there are several power splitting strategies like frequency separation, this method would be sufficient for evaluating the sensitivity of the system. However, the amplitude of the first part should be below or equal to the time-varying average power demand, and the second proportion is the remaining part of the demand at the mentioned time step. The main goal in this step is to find the number of battery cells based on this scenario. To sustain a designing goal, it is critical to consider that the main bus standard voltage in a locomotive should be designed to be in the range of 600–850 VDC [26]. To design a battery pack that can supply the energy of the main bus, it is necessary to define the voltage of the bus as a design criterion. To decrease the demanded current with respect to the energy demand, the bus voltage was assumed to be 850 VDC. In the implementation of the topology, it was assumed that the train should complete the journey with a full battery pack. At this stage, preliminary sizing the battery package can help the designer. However, it is considered as a design criterion of our work, which means that the fuel cell should provide enough energy to completely maintain the energy level of battery for the duration of the trip, meaning that the battery package should become full of charge at the last steps of each trip. Based on this and using the hydrogen’s Low Heating Value (LHV), we have calculated the hydrogen demand without considering the fuel cell dynamics. In addition, this key criterion will be a base for our future calculations in the development of a good energy management system for UPE trains.
It was also assumed that the battery sizing solely depends on the main bus voltage. Since this voltage is 850 V, the total battery pack’s current demand can be calculated by the Equation (8):
To design the battery pack, we analyzed the duty cycle to calculate the difference between time-varying average power demand and the peak power demand. In the proposed topology, it was assumed that batteries connected in series should provide the appropriate VDC level. The demanded transient current should also be provided by adding these serial battery branches in parallel. Hence, using a typical lithium ion battery [29], the number of cells in series and parallel can be calculated based on the following.
Cells in Series, nseries:
Strings in Parallel, nparallel:
The calculation shows that if the portion of fuel cell contribution is subtracted from the battery portion—which is the difference of the maximum power demand and the mean power demand—the required battery pack should have 12 strings in parallel with each string, having 236 cells in series.
3.1. Fuel Cell Stack Calculation
In the conceptual design, we take the number of fuel cells as a design criterion. The criteria should be a goal in detailed design as well. This factor can automatically satisfy several other parameters like the minimum hydrogen consumption. In other words, to minimize the hydrogen consumption in each trip, an optimal number of fuel cells should be used in a powertrain depending on the control strategy. However, in this approach, fuel cells in collaboration with the battery packs must provide the powertrain with enough energy demand in all modes of motion. Although the fuel cell individually should supply the time-varying average power demand, as it is working in parallel with the battery pack, as the main energy source, it should be able to provide the necessary power demand to keep the battery pack full until the train is working in its high-frequency portion of its duty cycle. In order to benchmark the size of the fuel cell pack, Table 3 shows the specification of the fuel cell module choosing to be used in the powertrain. However, based on the calculations, 14 fuel cell stacks configured in one serial string can supply the mean power portion of the total power demand as well as the other energy-supplying phases.
Table 3.
Fuel cell specification used in calculations [30].
3.2. Hydrogen Fuel Calculation
To calculate the required hydrogen, the lower heating value (LHV) of hydrogen is used over the higher heating value (HHV). The LHV of the gaseous hydrogen is 119.96 MJ/kg [31]. Figure 9 shows the energy consumption of the train during a journey of one day based on the real world duty cycle. It is seen that the maximum value of energy consumption is around 121 kW for that particular duty cycle. In addition, the corresponding required timely hydrogen consumption was also calculated, and is presented in Figure 10. To calculate the hydrogen consumption, it is suffice to multiply energy consumption with hydrogen LHV. Figure 11 shows the hydrogen consumption for one trip and, from the plot, it turns out that the train consumes 3.6 kg of hydrogen in each trip. According to a Metrolinx report [6], the total number of trips per day is 154 for weekdays and 146 over the weekends. This translates to a total of 55,442 trips per year. This is equivalent to 0.2 tons of hydrogen consumption per year.
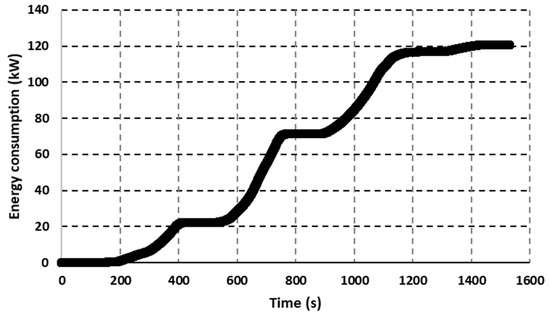
Figure 9.
Energy consumption of the train during its path.
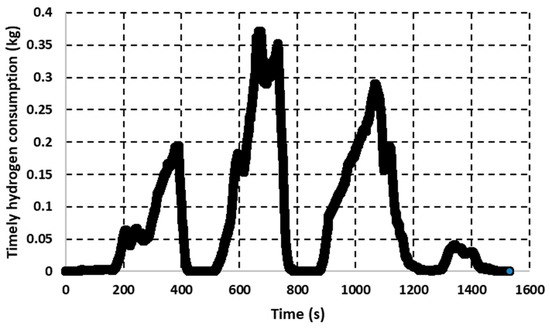
Figure 10.
Timely hydrogen consumption.
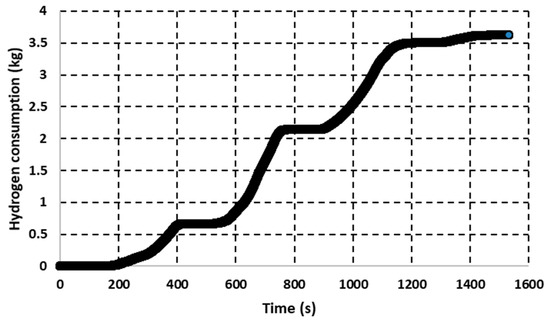
Figure 11.
Hydrogen consumption for one trip.
4. Conclusions
In this study, a hybrid fuel cell powertrain was conceptually designed for use in Union Pearson drive cycle in Toronto, Ontario, Canada. The repeatable drive cycle of the Union Pearson Express trains was extracted and used in obtaining the time-dependent power demand profile, “duty cycle”. To size the powertrain, four major subsystems were estimated as the primary components of interest, and the appropriate commercialized subsystems put forward in the calculations to investigate the feasibility of the implementing the topology of interest.
The calculations showed that a hydrogen/battery hybrid powertrain was able to generate an average power demand of 283.3 kW and peak power demand of 1335 kW, which was needed to meet the drive cycle of the trains and the route geometry requirement based on an empirical data extracted from the working trains. In the development of the powertrain topology, the fuel cell packs were designed to supply the time average power demand of about 283.3 kW. The main reason was that the highest percentage of power demand shows to be lower than this value. Another reason for such a scenario was that the batteries can respond faster than the fuel cells.
The fuel cell and battery pack were capable of satisfying the route energy demand. The battery packs were totally charged at the end of the route, and the regenerative braking portion was also considered in the route energy demand. Finally, the hydrogen demand for the proposed topology was estimated as 275 kg per day, and it turned out that the range of the powertrain, with this hydrogen volume, will be improved compared to the conventional Trier 4 diesel engines and their current fuel storage tanks. The developed model can be considered as a semi-empirical method, and the model can be used for similar trains working in a high accelerated drive cycles in GTA.
Author Contributions
This is to notice that the following contribution were conducted with the co-authors during the manuscript preparation: writing, review, and editing of the original paper, M.H.A., S.P., E.S., and E.H.; supervision, professors M.F., K.R., and R.F.
Funding
This paper was written with the support of National Science and Engineering Research Council Discovery Grant 261669-2013-RGPIN and Clean Rail Program—Transport Canada.
Acknowledgments
We thank Manoj Mathew and Muneendra Prasad Arkhat for their technical supports and during writing this paper.
Conflicts of Interest
This statement is to certify that all Authors have seen and approved the manuscript being submitted. We warrant that the article is the Authors’ original work. We warrant that the article has not received prior publication and is not under consideration for publication elsewhere. On behalf of all Co-Authors, the corresponding Author shall bear full responsibility for the submission. This research has not been submitted for publication nor has it been published in whole or in part elsewhere. We attest to the fact that all Authors listed on the title page have contributed significantly to the work, have read the manuscript, attest to the validity and legitimacy of the data and its interpretation, and agree to its submission to the World Electric Vehicle Journal. All authors agree that author list is correct in its content and order and that no modification to the author list can be made without the formal approval of the Editor-in-Chief, and all authors accept that the Editor-in-Chief’s decisions over acceptance or rejection or in the event of any breach of the Principles of Ethical Publishing in the World Electric Vehicle Journal being discovered of retraction are final. No additional authors will be added post submission, unless editors receive agreement from all authors and detailed information is supplied as to why the author list should be amended.
Nomenclature
| Variable | Name | Units |
| Af | frontal area | m2 |
| Cd | drag coefficient | - |
| df | proportional torque distribution factor | - |
| E | energy | kWh |
| FAD | aerodynamic drag | N |
| FRR | rolling resistance | N |
| FTG | track grade force | N |
| FTractive | tractive force | N |
| FTransient | transient force | N |
| g | gravitational constant | m/s2 |
| I | current | A |
| Icap | current capacity | A⋅h |
| Jw | wheel inertia | kg⋅m2 |
| m | mass | kg |
| P | power | kW |
| R1 | rolling resistance coefficient 1 | - |
| R2 | rolling resistance coefficient 2 | - |
| rw | wheel radius | m |
| t | time | s |
| Tw | wheel torque | N⋅m |
| V | voltage | V |
| v | velocity | m/s |
| Δd | change in distance | m |
| Δh | change in height (altitude) | m |
| θ | track grade | rad |
| ρ | density | kg/m3 |
| ωw | wheel angular velocity | m/s |
Acronyms
| ADC | Ampere Direct Current |
| CNR | Canadian National Railway |
| CPR | Canadian Pacific Railway |
| DOF | degree of freedom |
| DMUs | diesel multiple units |
| GHG | greenhouse gas |
| GTS | GO Transit System |
| GTA | Greater Toronto Area |
| GPS | global positioning system |
| GEFC | Green Energy and Fuel Cell |
| TPH | Toronto Public Health |
| PEMFC | proton-exchange membrane fuel cell |
| UPE | Union Pearson Express |
| VDC | volt direct current |
References
- United States Environmental Protection Agency (EPA). 2018. Available online: https://www.epa.gov/ghgemissions/global-greenhouse-gas-emissions-data (accessed on 1 October 2018).
- Intergovernmental Panel on Climate Change (IPCC). Climate Change 2007: Synthesis Report; Intergovernmental Panel on Climate Change: Geneva, Switzerland, 2007; Available online: https://www.ipcc.ch/report/ar4/syr (accessed on 1 January 2019).
- Environment and Climate Change Canada. Greenhouse gas sources and sink in Canada. Available online: https://www.canada.ca/en/environment-climate-change/services/climate-change/greenhouse-gas-emissions/sources-sinks-executive-summary-2018.html (accessed on 1 January 2019).
- Website of the Ontario Government. Greenhouse Gas Emissions by Sector. 2018. Available online: https://www.ontario.ca/data/greenhouse-gas-emissions-sector (accessed on 1 April 2018).
- Shaheen, S.A.; Lipman, T.E. Reducing greenhouse emissions and fuel consumption: Sustainable approaches for surface transportation. IATSS Res. 2007, 31, 6–20. [Google Scholar] [CrossRef]
- Metrolinx Website. 2018. Available online: http://www.metrolinx.com (accessed on 1 October 2018).
- Khosravi, A.; Koury, R.N.N.; Machado, L.; Pabon, J.J.G. Energy, exergy and economic analysis of a hybrid renewable energy with hydrogen storage system. Energy 2018, 148, 1087–1102. [Google Scholar] [CrossRef]
- Zhang, F.; Zhao, P.; Niu, M.; Maddy, J. The survey of key technologies in hydrogen energy storage. Int. J. Hydrogen Energy 2016, 41, 14535–14552. [Google Scholar] [CrossRef]
- Mukherjee, U.; Elsholkami, M.; Walker, S.; Fowler, F.; Elkamel, A.; Hajimiragha, A. Optimal sizing of an electrolytic hydrogen production system using an existing natural gas infrastructure. Int. J. Hydrogen Energy 2015, 40, 9760–9772. [Google Scholar] [CrossRef]
- Nastasi, B.; Basso, G.L. Hydrogen to link heat and electricity in the transition towards future Smart Energy Systems. Energy 2016, 110, 5–22. [Google Scholar] [CrossRef]
- Singh, S.; Jain, S.; Venkateswaran, P.S.; Tiwari, A.K.; Nouni, M.R.; Pandey, J.K.; Goel, S. Hydrogen: A sustainable fuel for future of the transport sector. Renew. Sustain. Energy Rev. 2015, 51, 623–633. [Google Scholar] [CrossRef]
- Nastasi, B.; Basso, G.L. Power-to-gas integration in the transition towards future urban energy systems. Int. J. Hydrogen Energy 2017, 42, 23933–23951. [Google Scholar] [CrossRef]
- Haghi, E.; Fowler, M.; Raahemifar, K. Co-benefit analysis of incentives for energy generation and storage systems; a multi-stakeholder perspective. Int. J. Hydrogen Energy 2018. [Google Scholar] [CrossRef]
- Independent Electricity system Operator (IESO). Transmission-Connected Generation. Available online: http://www.ieso.ca/power-data/supply-overview/transmission-connected-generation (accessed on 1 April 2018).
- Marin, G.D.; Naterer, G.F.; Gabriel, K. Rail transportation by hydrogen vs. electrification—Case study for Ontario, Canada, II: Energy supply and distribution. Int. J. Hydrogen Energy 2010, 35, 6097–6107. [Google Scholar] [CrossRef]
- Li, Q.; Chen, W.; Liu, Z.; Li, M.; Ma, L. Development of energy management system based on a power sharing strategy for a fuel cell-battery-supercapacitor hybrid tramway. J. Power Sources 2015, 279, 267–280. [Google Scholar] [CrossRef]
- Peng, F.; Chen, W.; Liu, Z.; Li, Q.; Dai, C. System integration of China’s first proton exchange membrane fuel cell locomotive. Int. J. Hydrogen Energy 2014, 39, 13886–13893. [Google Scholar] [CrossRef]
- Yamamoto, T.; Hasegawa, H.; Furuya, T.; Ogawa, K. Energy efficiency evaluation of fuel cells and batteries hybrid railway test vehicles. Q. Rep. RTRI 2010, 51, 115–121. [Google Scholar] [CrossRef][Green Version]
- Hsiao, D.R.; Huang, B.W.; Shih, N.C. Development and dynamic characteristics of hybrid fuel cell-powered mini-train system. Int. J. Hydrogen Energy 2012, 37, 1058–1066. [Google Scholar] [CrossRef]
- Sarma, U.; Ganguly, S. Modelling and cost-benefit analysis of PEM fuel-cell-battery hybrid energy system for locomotive application. In Proceedings of the 2018 Technologies for Smart-City Energy Security and Power (ICSESP), Bhubaneswar, India, 28–30 March 2018; pp. 1–5. [Google Scholar]
- Miller, A.R.; Hess, K.S.; Barnes, D.L.; Erickson, T.L. System design of a large fuel cell hybrid locomotive. J. Power Sources 2007, 173, 935–942. [Google Scholar] [CrossRef]
- Garcia, P.; Fernández, L.M.; Garcia, C.A.; Jurado, F. Comparative study of PEM fuel cell models for integration in propulsion systems of urban public transport. Fuel Cells 2010, 10, 1024–1039. [Google Scholar] [CrossRef]
- Meegahawatte, D.; Hillmansen, S.; Roberts, C.; Falco, M.; McGordon, A.; Jennings, P. Analysis of a fuel cell hybrid commuter railway vehicle. J. Power Sources 2010, 195, 7829–7837. [Google Scholar] [CrossRef]
- Ballard Company. Ballard powers hybrid urban tram in China for Tangshan Railway. Fuel Cells Bull. 2016, 2016, 2–3. [Google Scholar] [CrossRef]
- SMART. 2010. Available online: http://sonomamarintrain.org (accessed on 1 October 2018).
- Miller, A.R.; Peters, J.; Smith, B.E.; Velev, O.A. Analysis of fuel cell hybrid locomotives. J. Power Sources 2006, 157, 855–861. [Google Scholar] [CrossRef]
- Silvas, E.; Hofman, T.; Murgovski, N.; Etman, L.P.; Steinbuch, M. Review of optimization strategies for system-level design in hybrid electric vehicles. IEEE Trans. Veh. Technol. 2017, 66, 57–70. [Google Scholar] [CrossRef]
- UP Union Pearson Express. TRAIN FACTS. (2018). Available online: https://www.upexpress.com (accessed on 1 October 2018).
- A123 Systems. 2018. Available online: http://www.a123systems.com (accessed on 1 October 2018).
- Hydrogenics 2018. HYPM-HD 30 Power Module. Available online: http://www.hydrogenics.com/wp-content/uploads/HyPM-30-Spec-Sheet.pdf (accessed on 1 October 2018).
- Hydrogen Tools. Lower and Higher Heating Values of Fuels. Available online: https://h2tools.org/hyarc/calculator-tools/lower-and-higher-heating-values-fuels (accessed on 1 October 2018).


© 2019 by the authors. Licensee MDPI, Basel, Switzerland. This article is an open access article distributed under the terms and conditions of the Creative Commons Attribution (CC BY) license (http://creativecommons.org/licenses/by/4.0/).