Article

Test and Modelling of Commercial V2G CHAdeMO Chargers to Assess the Suitability for Grid Services

Center for Electric Power and Energy, Department of Electrical Engineering, Technical University of Denmark, 4000 Roskilde, Denmark
*
Author to whom correspondence should be addressed.
World Electr. Veh. J. 2019, 10(2), 21; https://doi.org/10.3390/wevj10020021
Submission received: 14 February 2019 / Revised: 12 April 2019 / Accepted: 18 April 2019 / Published: 24 April 2019

Abstract

:
Aggregation and control of electric vehicles (EVs) via vehicle-to-grid (V2G) technologies is seen as a valid option for providing ancillary power system services. This work presents results from V2G-ready equipment tests and modelling. The technical capabilities of an EV connected to a commercial V2G charger are investigated when controlled either locally or remotely. The charger is characterized in terms of efficiency characteristics, activation time, response granularity, ramping-up/down time, accuracy and precision. Test results show the performance for different operating conditions, highlighting the importance of a good calibration and knowledge of the employed hardware when providing standard-compliant grid regulation services via V2G technology. Ultimately, a set of simulations demonstrates that the designed EV charger model replicates accurately the operating conditions of the real hardware.

1. Introduction

Within the electrification of the transportation sector, a crucial role is played by the vehicle–grid integration research, which aims at defining proactive charging control strategies to facilitate the integration in the power systems. The term grid integrated vehicle (GIV) describes an electric vehicle (EV) purposely designed to limit its self-induced adverse effects in the power system, while also supporting the system by being able to provide a number of power and energy services. Such services may be aimed at achieving energy autonomy [1,2], supporting the local grid infrastructure [3,4,5] or providing regional power and energy balancing [6,7].
Ancillary service provision from EVs (both with uni- and bi-directional power flow) pertains to the domain of demand response, which in general is growing in popularity as an alternative to traditional grid service providers. Many studies and research projects analyze the current state-of-the-art in relationship to the electricity markets opening towards the inclusion of demand response resources [8,9,10,11,12]. A study carried out by the SEDC (Smart Energy Demand Coalition) consortium provides an overview of the actual status of the current regulatory framework in 18 countries of the EU zone, and proposes a demand response map in its technical report [12]. As for the Nordic countries, Finland allows independent aggregation in at least one of the programs in the ancillary services, whereas in Denmark, Norway, and Sweden regulatory barriers remain an issue, hindering market growth. Although several markets are open to demand response in principle, program requirements continue to exist which are not adjusted to enable demand-side participation. The issue of access by independent aggregators to the wholesale market is shown to be prevalent across the majority of the analyzed countries. In most cases, the framework allows only for balance responsible parties (BRPs) or retailers to aggregate and sell flexibility on the wholesale market. However, relatively good progress has been made by most countries in providing access to demand-side resources to the balancing markets (ancillary service provision), and positive cooperation between stakeholders (new market entrants, regulators, transmission system operators (TSOs), and retailers) is underlined. However, the Nordic countries have started processes to find a standard solution for the role of independent aggregators. For example, in Denmark, possible new market models for aggregators are jointly proposed and studied by the national TSO and the Danish Energy Association [13]. Such models are characterized by increasing responsibilities for the aggregators, which in the future will be seen as a stakeholder (a player, not a mere role) independent from an existing BRP, as it is today.
Despite the mentioned market mechanisms and regulatory barriers to facilitate demand response via EVs for grid services, it is also of high interest to assess the technical suitability of the controllable hardware for such purposes. Such technical aspects are investigated in this paper. One class of system services EVs may provide is frequency containment reserves (FCR), which is required in the Nordic synchronous region. In order to provide FCR, the EV charging or discharging process would be controlled to support the system frequency. This service is interesting for two reasons. Firstly, the service is enumerated based on the available power [kW], not on the actual energy exchanged with the grid. Since the EV battery is an exhaustible resource in terms of energy but is capable of providing high instantaneous power, this represents a good technical match. Secondly, some markets already allow EV aggregators to participate in FCR provision. However, FCR is also one of the most technically demanding services with high requirements to a fast and reliable response and where access to vehicle-to-grid (V2G) strengthens the vehicles ability to provide the service considerably [14,15,16,17].
Bi-directionality is presently only accessible through DC chargers using the CHAdeMO protocol. While DC chargers typically are associated with public fast-charging stations, reduction in size and price may ultimately allow for domestic use as well. A number of contemporary EV integration projects focused on V2G explore the use of early V2G-enabled DC chargers [18,19,20,21]. These chargers represent a key technology, enabling V2G across a broad number of EV models. It then becomes important to investigate the performance of these chargers on parameters specific to the provision of V2G based services—going beyond traditional one-way charging. This is the focus of this work, investigating the technical capabilities of V2G equipment when controlled either locally or remotely. In the authors’ previous work [22], an operational characterization of a commercial ±10 kW V2G DC charger [23] has been presented. The overall investigation is now extended with the inclusion of a comprehensive modelling activity using the Simulink platform within the Matlab MathWorks 2018b software environment, which takes into account the outcome of the tests. The proposed characterization of the real V2G hardware describes the extent to which DC chargers may be used for critical and demanding smart grid services such as FCR, while the detailed charger model has to be seen as a novel realistic tool for power system simulation studies. The paper is structured as follows. Section 2 outlines the concept of the EV flexibility product and highlights the importance of carrying out hardware performance assessments. Section 3 outlines the performed hardware control tests, and presents respective results. In Section 4, a comprehensive discussion on the suitability of the tested V2G charger for FCR provision is provided, by comparing the hardware test results with the actual grid code requirements used as benchmark. Section 5 presents the implementation of a detailed model of the V2G charger under study, which takes into account the tested flexibility product attributes. Conclusions are in Section 6.

2. The Need for Hardware Performance Assessment When Controlling EVs

In order to correctly procure the amount of reserve needed for ancillary services, it is necessary to define the most important attributes characterizing the unit response. The flexibility product can be defined as the power adjustment sustained from a particular moment for a certain duration at a specific location [3]. Given the nature of the service provided, the flexibility product can be either active or reactive power adjustment. However, as in this work reactive power exchange was not supported by the employed hardware, we always refer to active power.
In order to make the EV flexibility product a tradable asset, appropriate regulations and requirements should be introduced. Establishing standardized tests for evaluating the charger and EV performance are needed to categorize the supplied EV flexibility product. Thus, a deep knowledge of the controlled hardware performance is needed, including the EV charger efficiency for different set-points (presented in Section 3), to assess the accumulated losses during a V2G session. Such insights into the charger’s efficiency can guarantee to the charger operator an accurate estimation of the real amount of energy flowing in/out of the battery. This is a necessary information for a safe and effective fleet operation, provided that low efficiencies may challenge the business case due to additional energy costs. Besides the necessity of a charging/discharging efficiency test, it is of utmost importance also to define the relevant characteristics of the flexible EV when controlled for providing a power system service as FCR [14], to validate the fulfillment of the required performance. In this respect, we list seven attributes that have been experimentally assessed on V2G real hardware, the results of which are reported in Section 5:
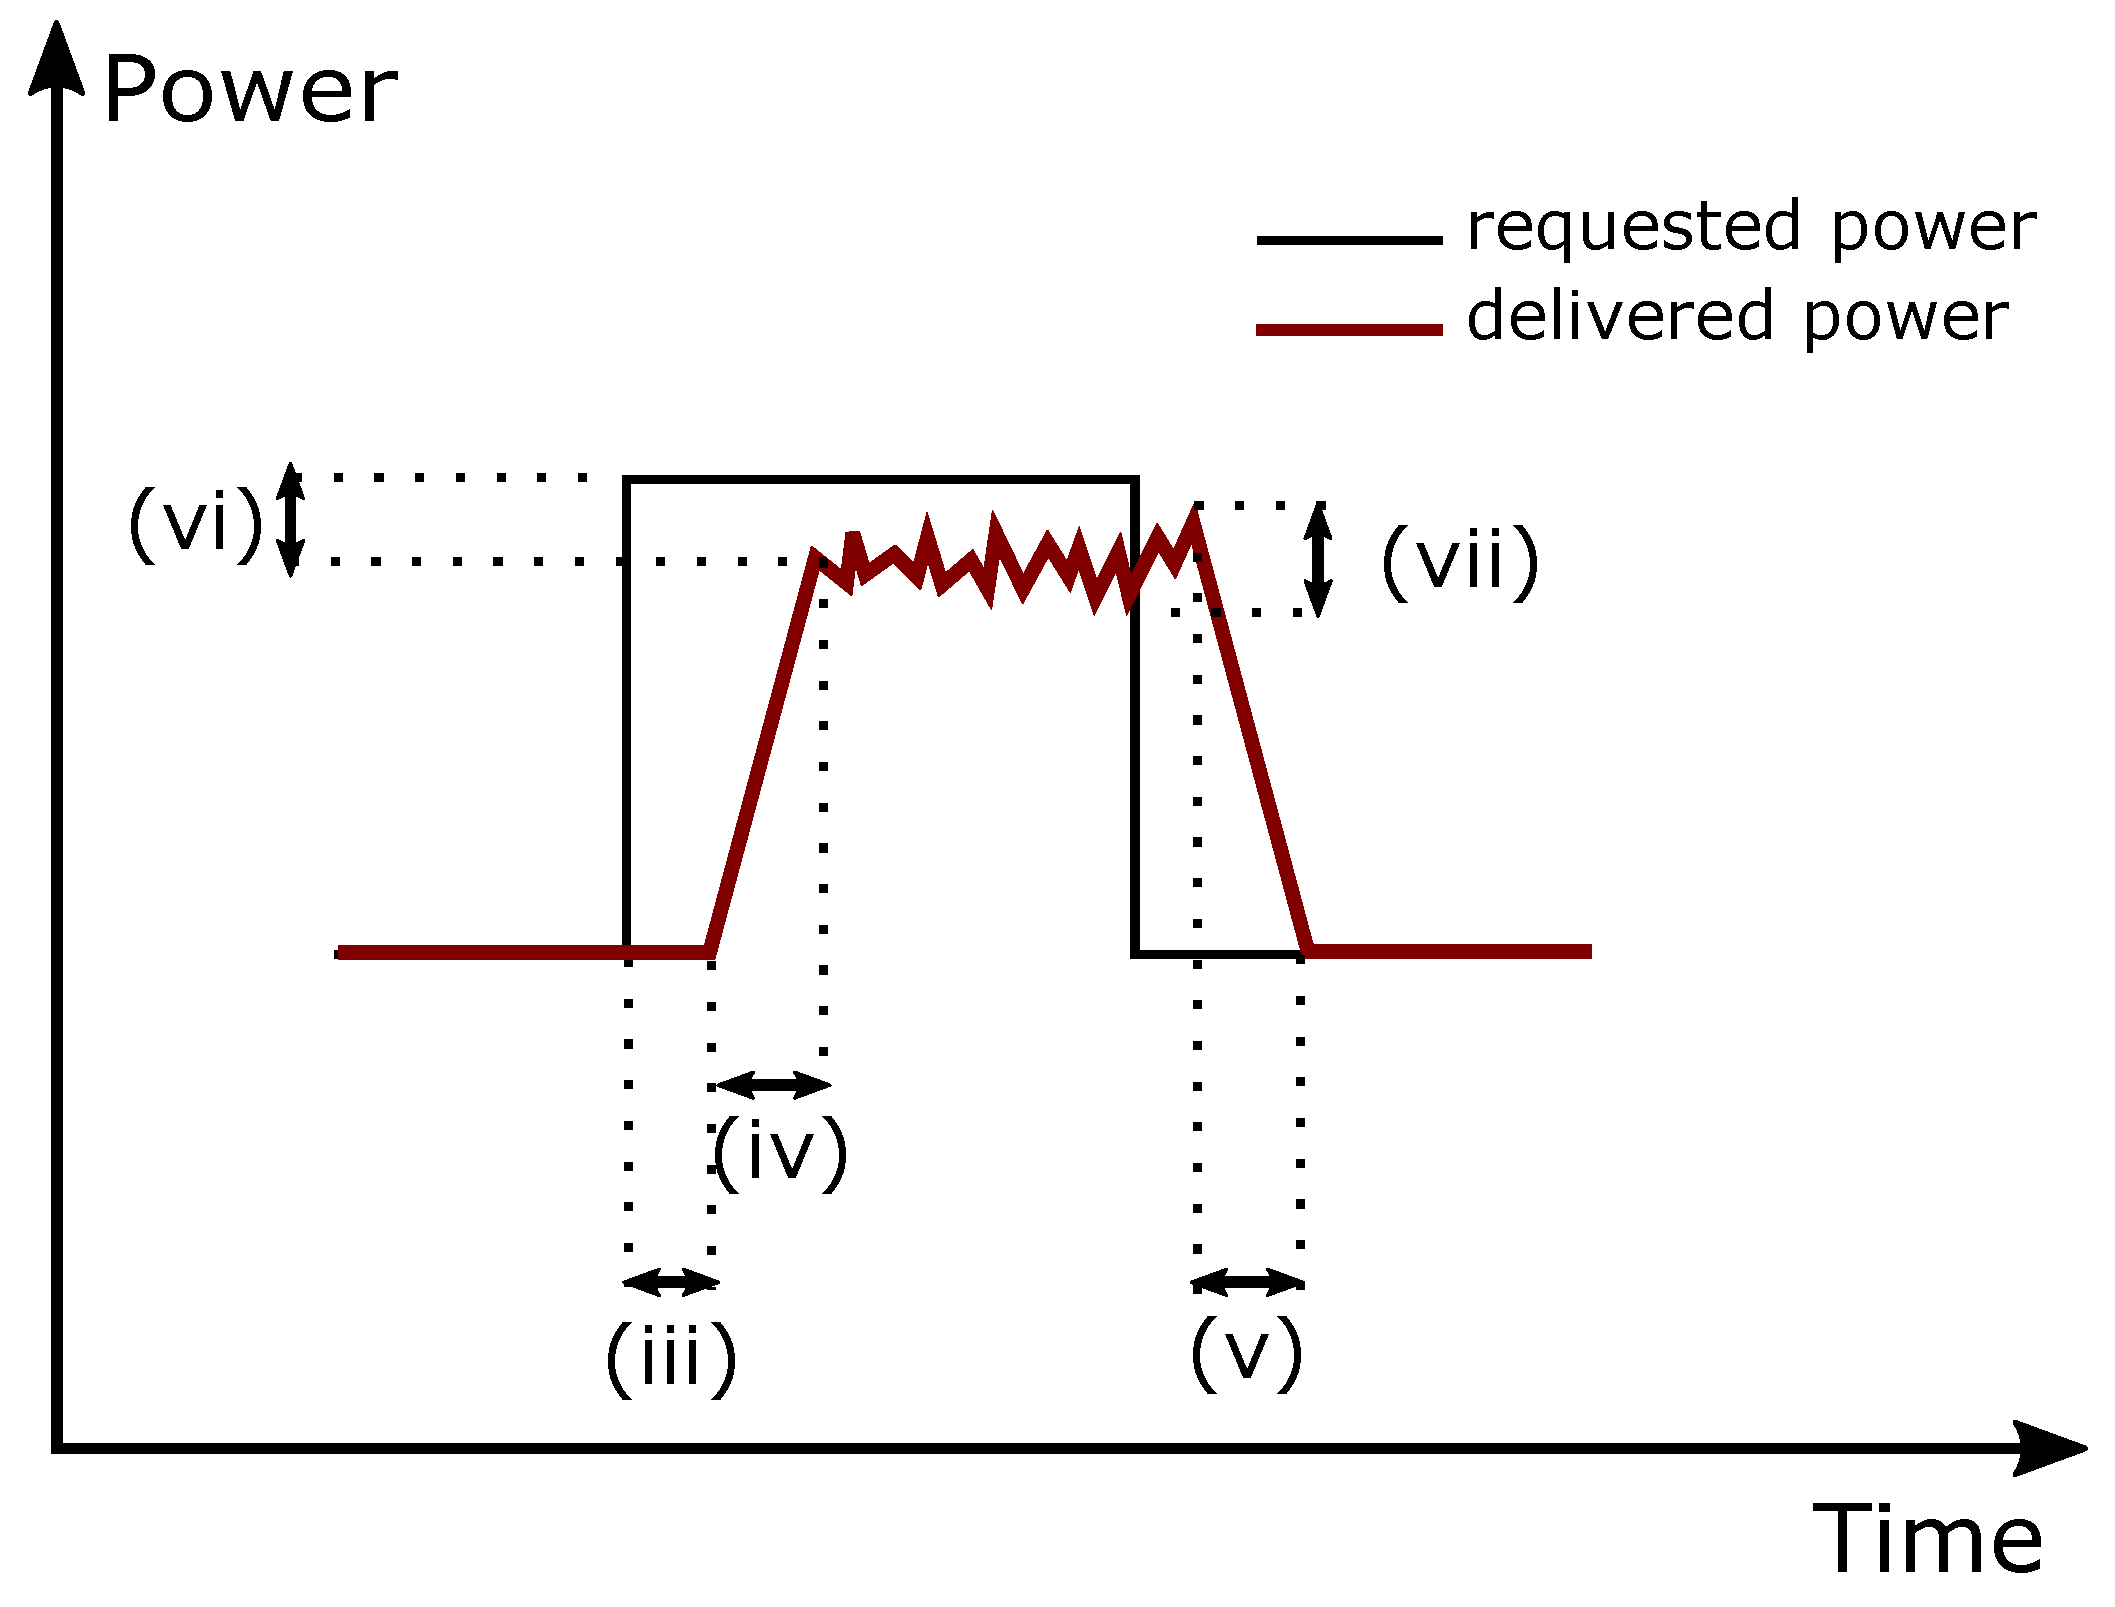
  • (i) Direction: The information if an EV can provide only uni-directional or bi-directional (V2G) power flow.
  • (ii) Set-point linearity: The discreteness of the charging/discharging power set-point.
  • (iii) Starting time and maximum activation time: The period between receiving the set-point and activating the flexibility.
  • (iv-v) Ramp-up/ramp-down time: The up/downwards time between activation time and full service provision, and vice versa.
  • (vi) Accuracy: The difference between the required and the delivered response, e.g., the acceptable response band.
  • (vii) Precision: The variation of the delivered response for a given set-point.
Figure 1 shows attributes (iii)–(vii) for an EV flexibility product, highlighting the difference between requested and provided power when controlling a flexible EV.

3. Locally and Remotely Controlled EVs Performance Tests

The first tests we present aim at assessing the efficiency of the V2G charger for a number of set-points. This is done in a local fashion, i.e., the set-points have been manually and locally set on the hardware, enabling us to derive the activation time of only the employed hardware. In order to evaluate the influence on the total activation time of additional communication latencies, the second tests were performed in a remote control fashion. The remote control test setup includes the communication and control infrastructure utilized by an actual EV aggregator, operating in on-field projects such as the Danish-funded projects ACES [18] and Parker [19]. Figure 2 as a whole shows the test configuration for the centralized control architecture, enabling us to derive the total activation time including communication latencies. In this case, the EV supply equipment (EVSE) receives a power set-point remotely computed, and responds accordingly setting appropriate power flows in/out of the battery. With this design, the aggregator calculates in a centralized way the appropriate V2G control signals to dispatch to its EVs, e.g., according to system frequency measurement in case of FCR. In case of the first local tests, the EV fleet operator platform is not utilized, whereas the set-points are directly set on the EVSE computer embedded in the charger.
In the proposed test activities, two different active power test patterns were sent to the V2G-capable EVSE/EV. The first one is based on charging/discharging set-points modulation from −10 kW to +10 kW with steps of 400 W. This test pattern allows the operational characterization of the V2G charger in terms of efficiency mapping for different levels of capacity stored in the battery, i.e., different states of charge. The charging part of the first test pattern is outlined in Figure 3a. For the remote control test (Figure 3b), the pattern is designed in a way to allow an estimation of the seven flexibility service attributes defined in Section 2. Firstly, it enables us to validate the bi-directional capability and to assess total response time when controlling EVs in a remote fashion, including both communication latencies and charger and EV response time. This information is of utmost importance when assessing the capabilities on the provision of time-critical power system services from aggregated small distributed energy resources. Secondly, the remote test pattern consists first of a continuous and then of a step-wise variation of the charging/discharging power set-points. Such a cycle allows the measurement of the other five identified flexibility service attributes: the continuous part of the pattern allows the estimation of the step size granularity, whereas the step-wise part allows the estimation of the ramping times, the accuracy and the precision. Figure 3b shows the test cycle, which in practice was identically repeated four times, in order to have a more reliable measurement dataset for a more exhaustive and precise performance evaluation. Although the charger’s size is ±10 kW, the extreme power set-points are ±8.5 kW due to an internal limitation set on the internal charger software. Note that, for Figure 3 and for all the subsequent figures with time on the x-axis, time is indicated in the form of hours, minute, day of the month, month and year.

3.1. Outcome of Local Control Tests

The local control test intends to quantify the charger efficiency at all possible charging and discharging levels at different SOC. The tests where performed with a 30 kWh Nissan LEAF parked in a laboratory with room temperature 20 C. The measurements at the AC grid are performed with a DEIF MIC-2 power meter with 0.2% accuracy and 1 s reporting time [24], while the DC side is measured with the internal DC voltage and current probe of the V2G charger, each with 1 s sample rate and 0.2% accuracy [23]. The full charging/discharging power capability is studied by repeatedly stepping through current set-points with 1 A steps at the DC side, i.e., 400 W in case of 400 V DC. For each power set-point, the efficiency is calculated by means of the procedure in Figure 4a. In order to assess the influence of the SOC, the results reported in Figure 4b show the efficiency as a function of the power, for a number of SOC.

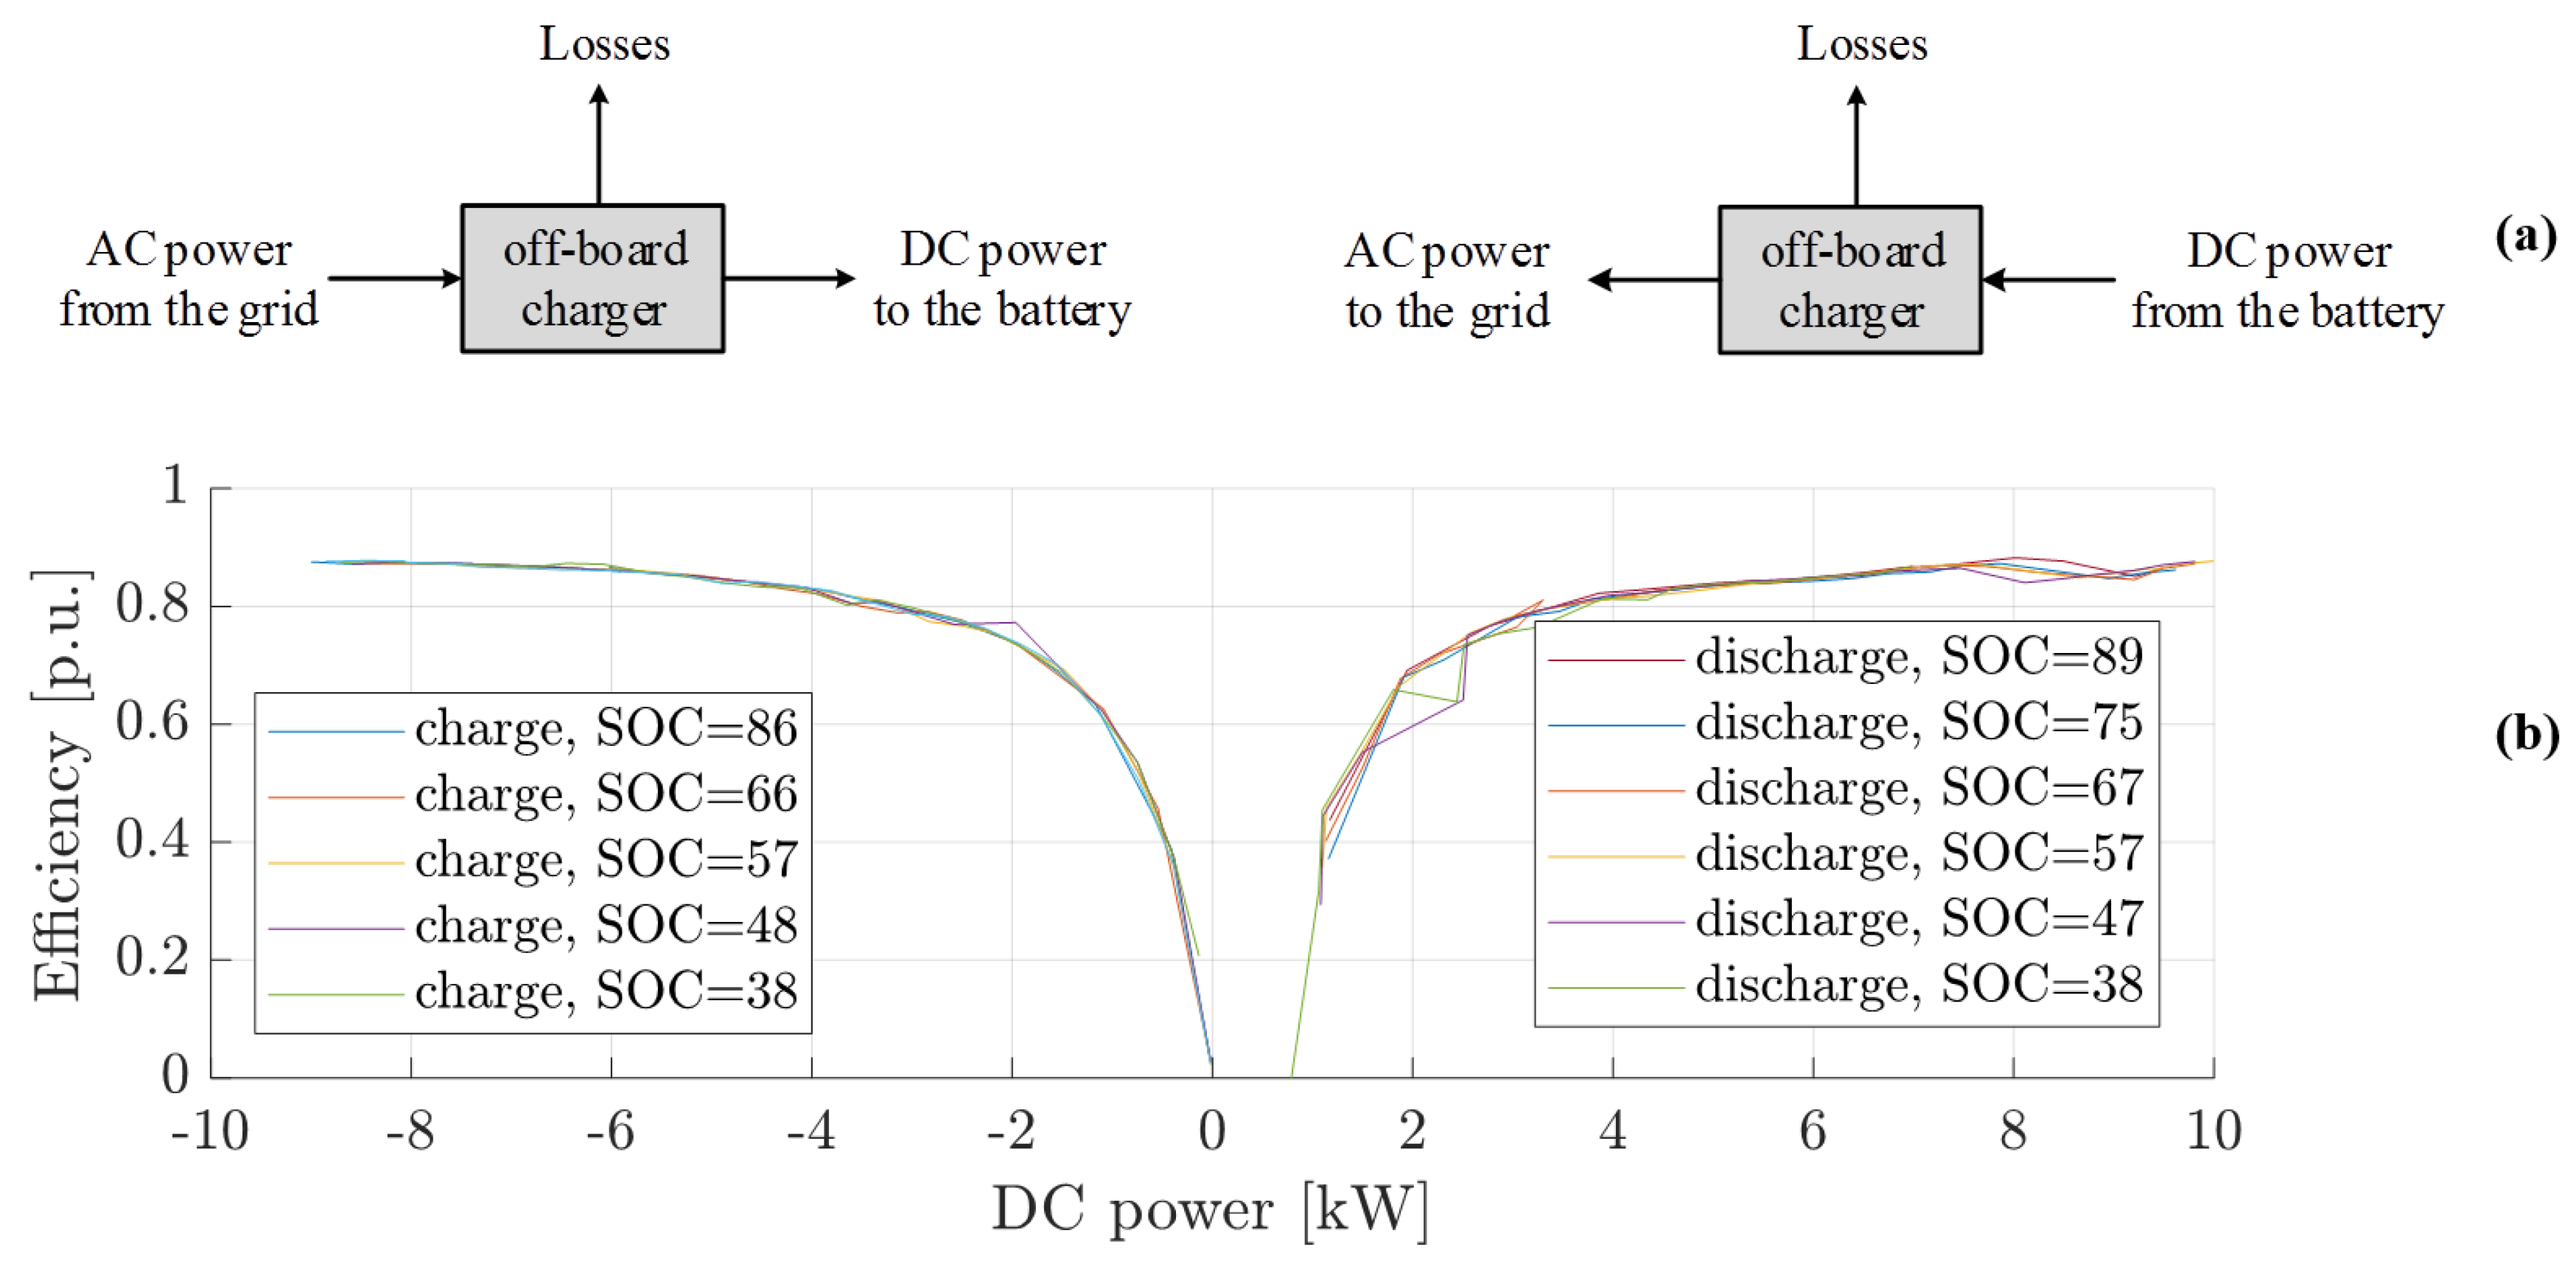
3.1.1. Calculation of Efficiency Map

In a first set of tests, the efficiency was calculated during a FCR session, and it resulted in a large variance of efficiency values for each power set point due to the relatively large time constant of the charger, and the constantly changing set-point [25]. To avoid this issue, for the here-presented test, the power set-point is changed only with 1 min intervals, giving each charge/discharge cycle a 25 min duration. The efficiency calculated for each DC power set-point value is the average during the whole minute, giving a granularity of 25 values for each SOC level. The efficiency during charging operation ηch is defined as the ratio between the power flowing into the charger (AC power, PAC) and the power flowing out (DC power PDC). Similarly, the discharging efficiency ηdis is defined as PDC/PAC. They are calculated as in Figure 4. Results are reported in Figure 4b, which shows that the large difference in the SOC has a negligible influence on the efficiency. The tests are performed only in the SOC range where the voltage changes linearly, so eventual difference in the results when operating in the extreme regions are not considered. However, it is not relevant considering the BMS limits in the usable range of the battery.

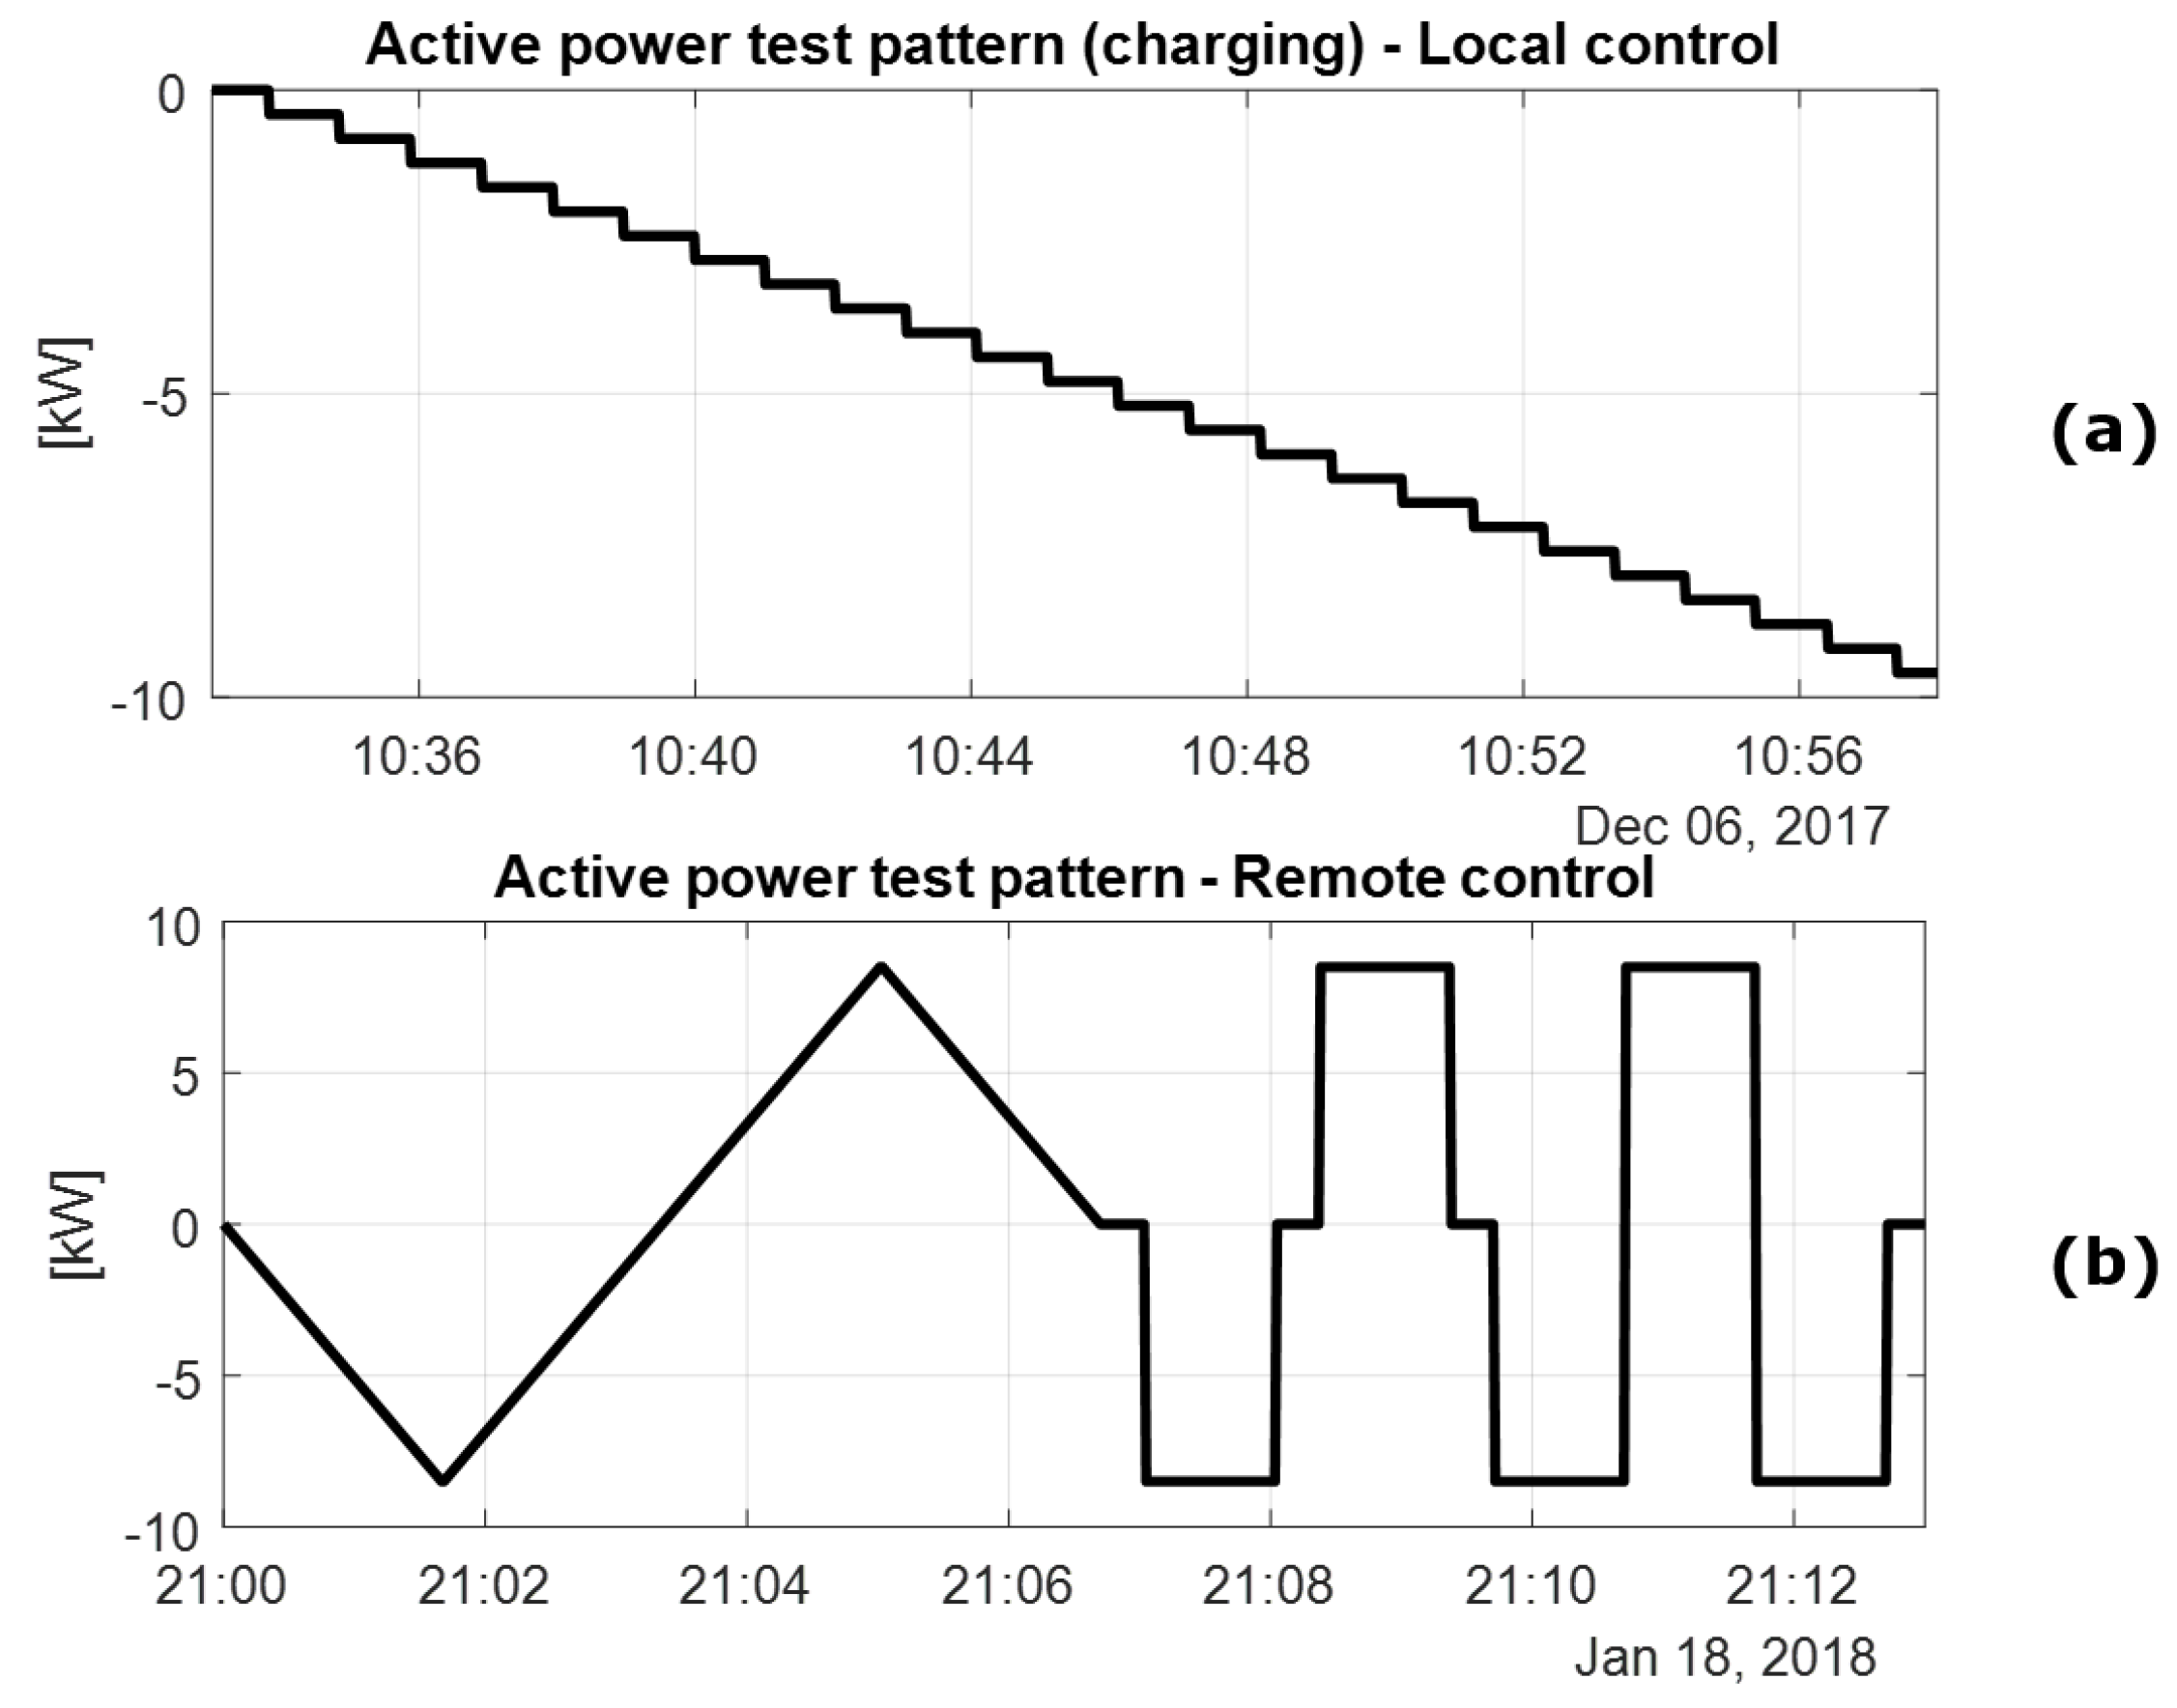
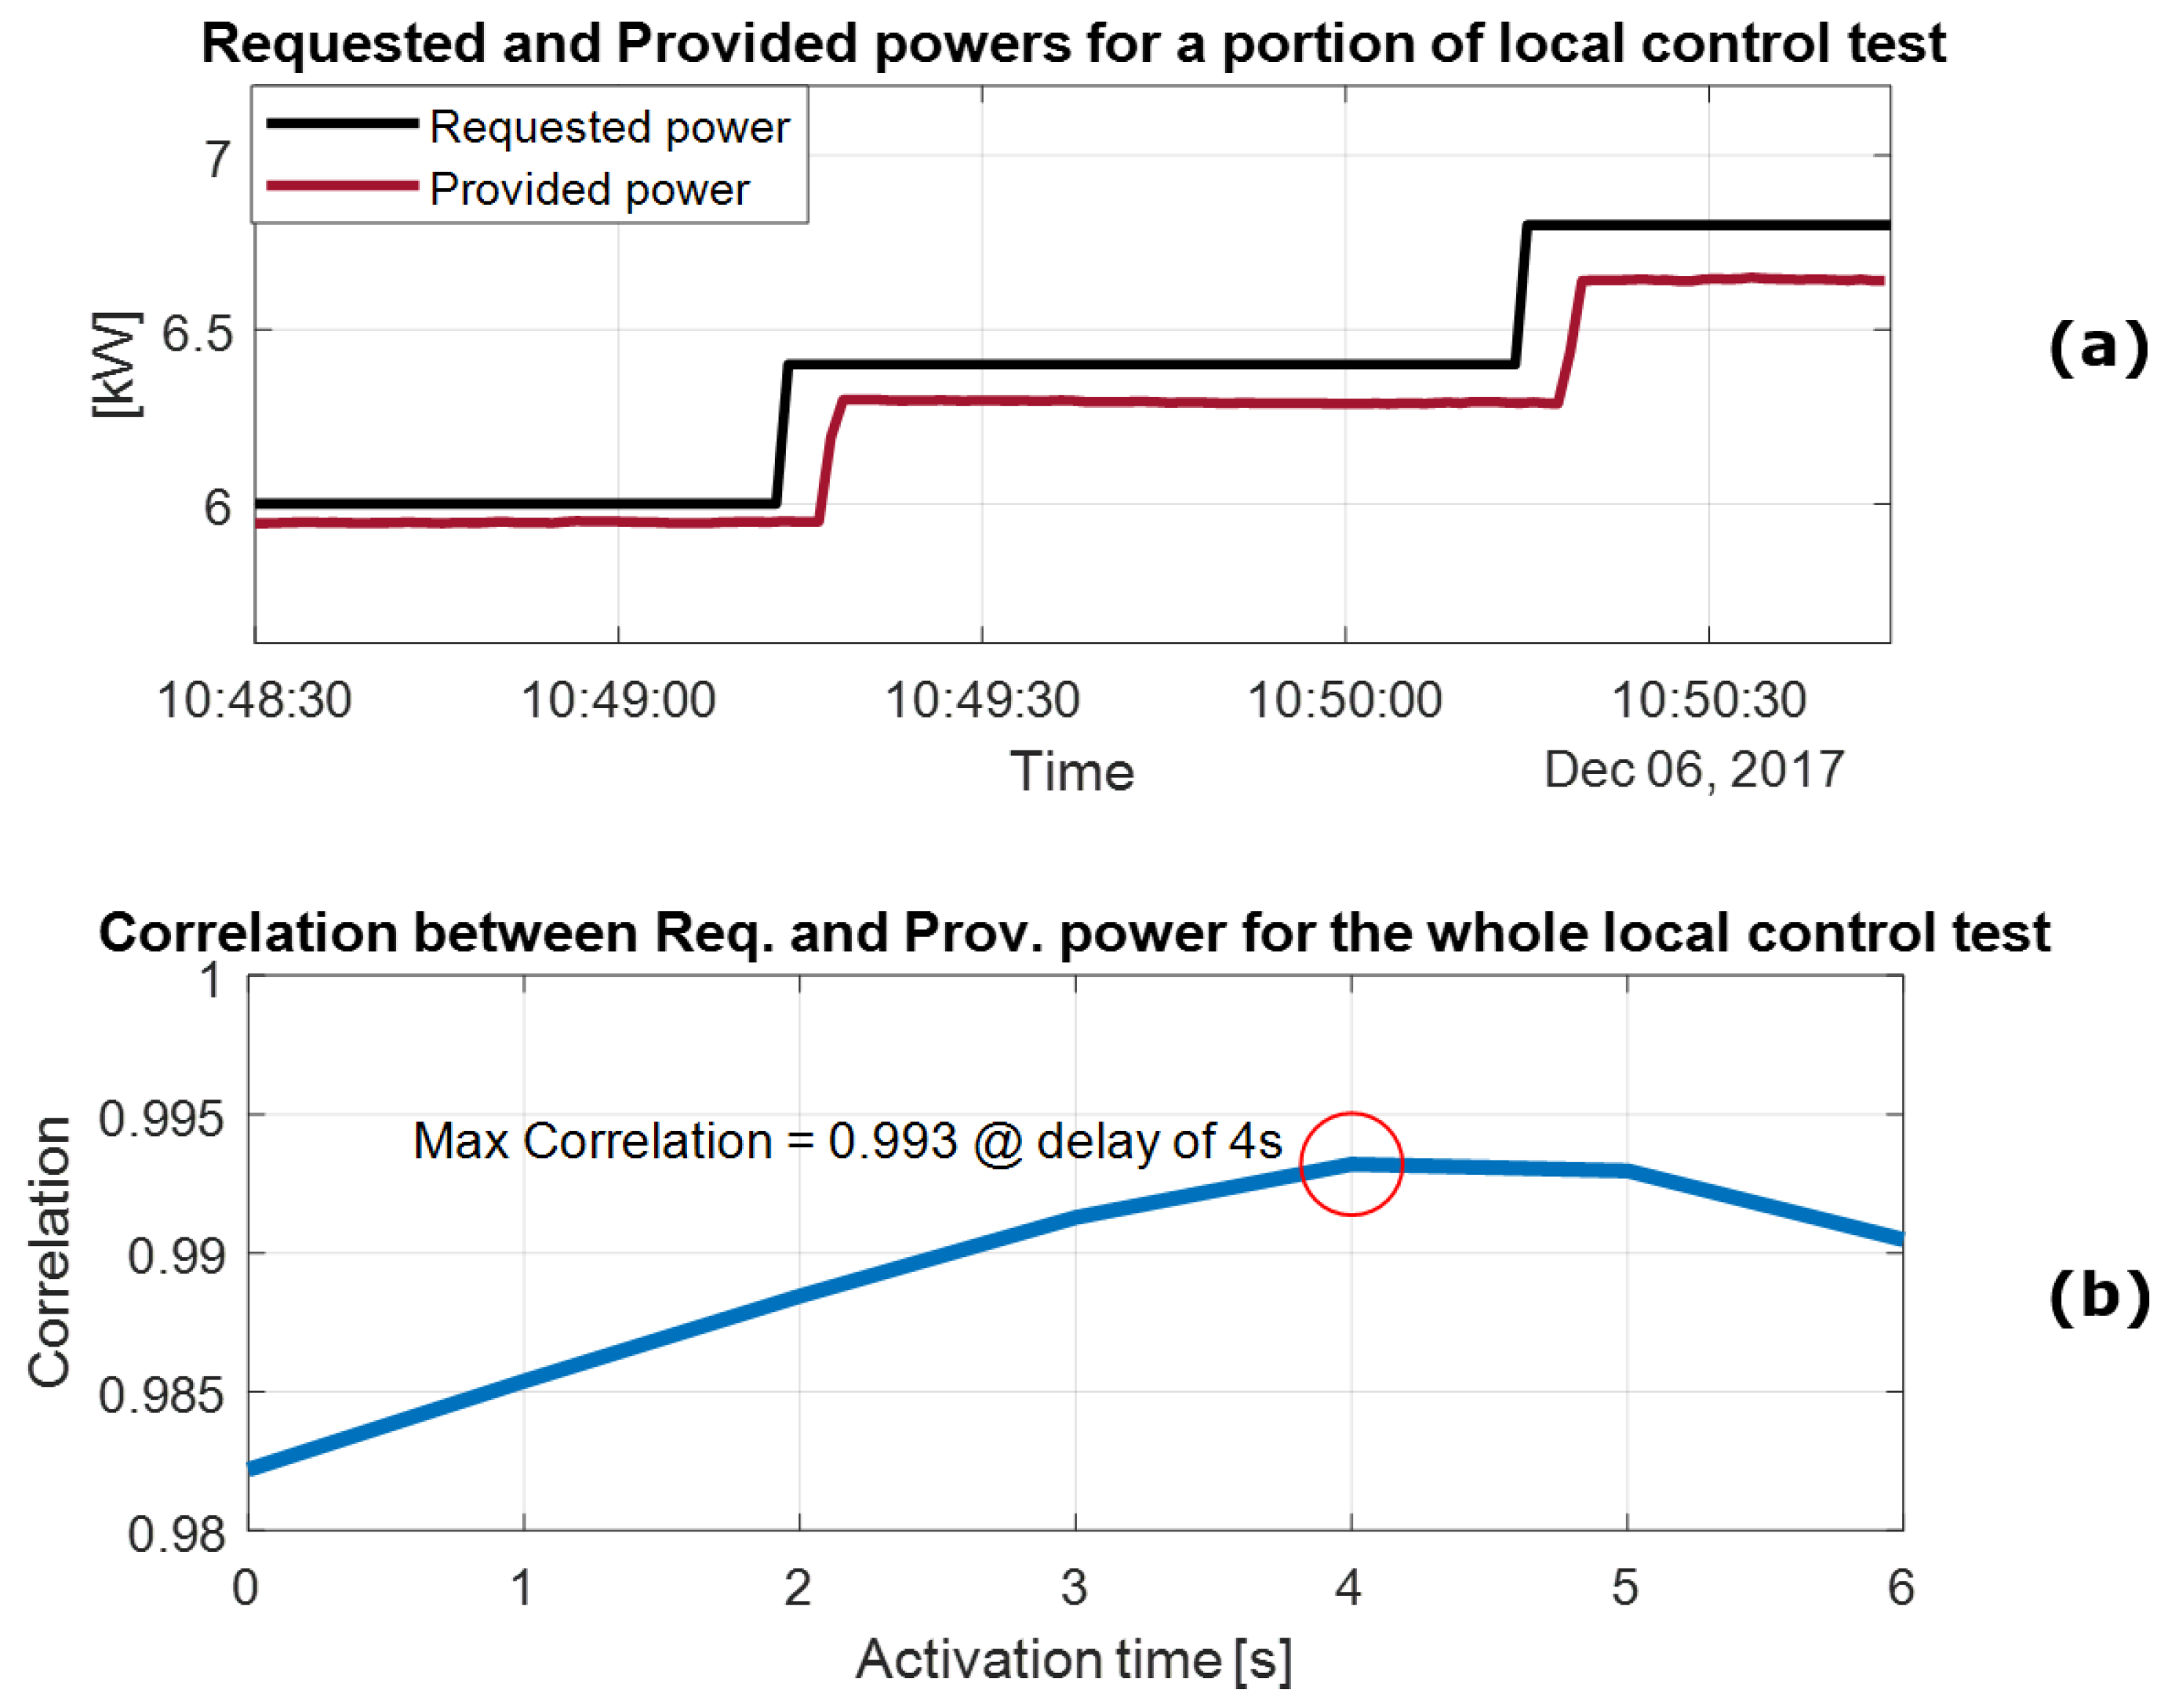
3.1.2. Calculation of Activation Time

The set-point control signal and the AC power provided on the grid side are shown in Figure 5a, which is a zoom-in of a part of the AC power measured during the charging test of Figure 3b. The time shift represents the activation time given the employed local control setup, thus it includes only the actual hardware response without any additional latencies due to communications of the remote control setup. Figure 5b shows the correlation of the two signals when applying different time shifts to one of them for the whole duration of the test. The maximum is found for a shift of 4 s, which is then considered as the activation time of the tested V2G equipment.

3.2. Outcome of Remote Control Tests

This section presents the results of the performance test with the remote control setup. Note that the hardware under test and the laboratory environment conditions are the same as for the local control test.
Figure 6 shows the required and the provided power of one cycle of the active power test pattern. In general, a time shift can be noticed, which here represents the total activation time given the employed remote control setup. Then, one can note the non-perfect linearity in the response to the signal in the continuous portion due to the set-point granularity imposed by protocols and the power electronics in the V2G charger. Finally, the time needed to reach the set-point is utilized for the calculation of the ramping rates, while the measured power at the stable set-point levels allows the calculation of accuracy and precision.

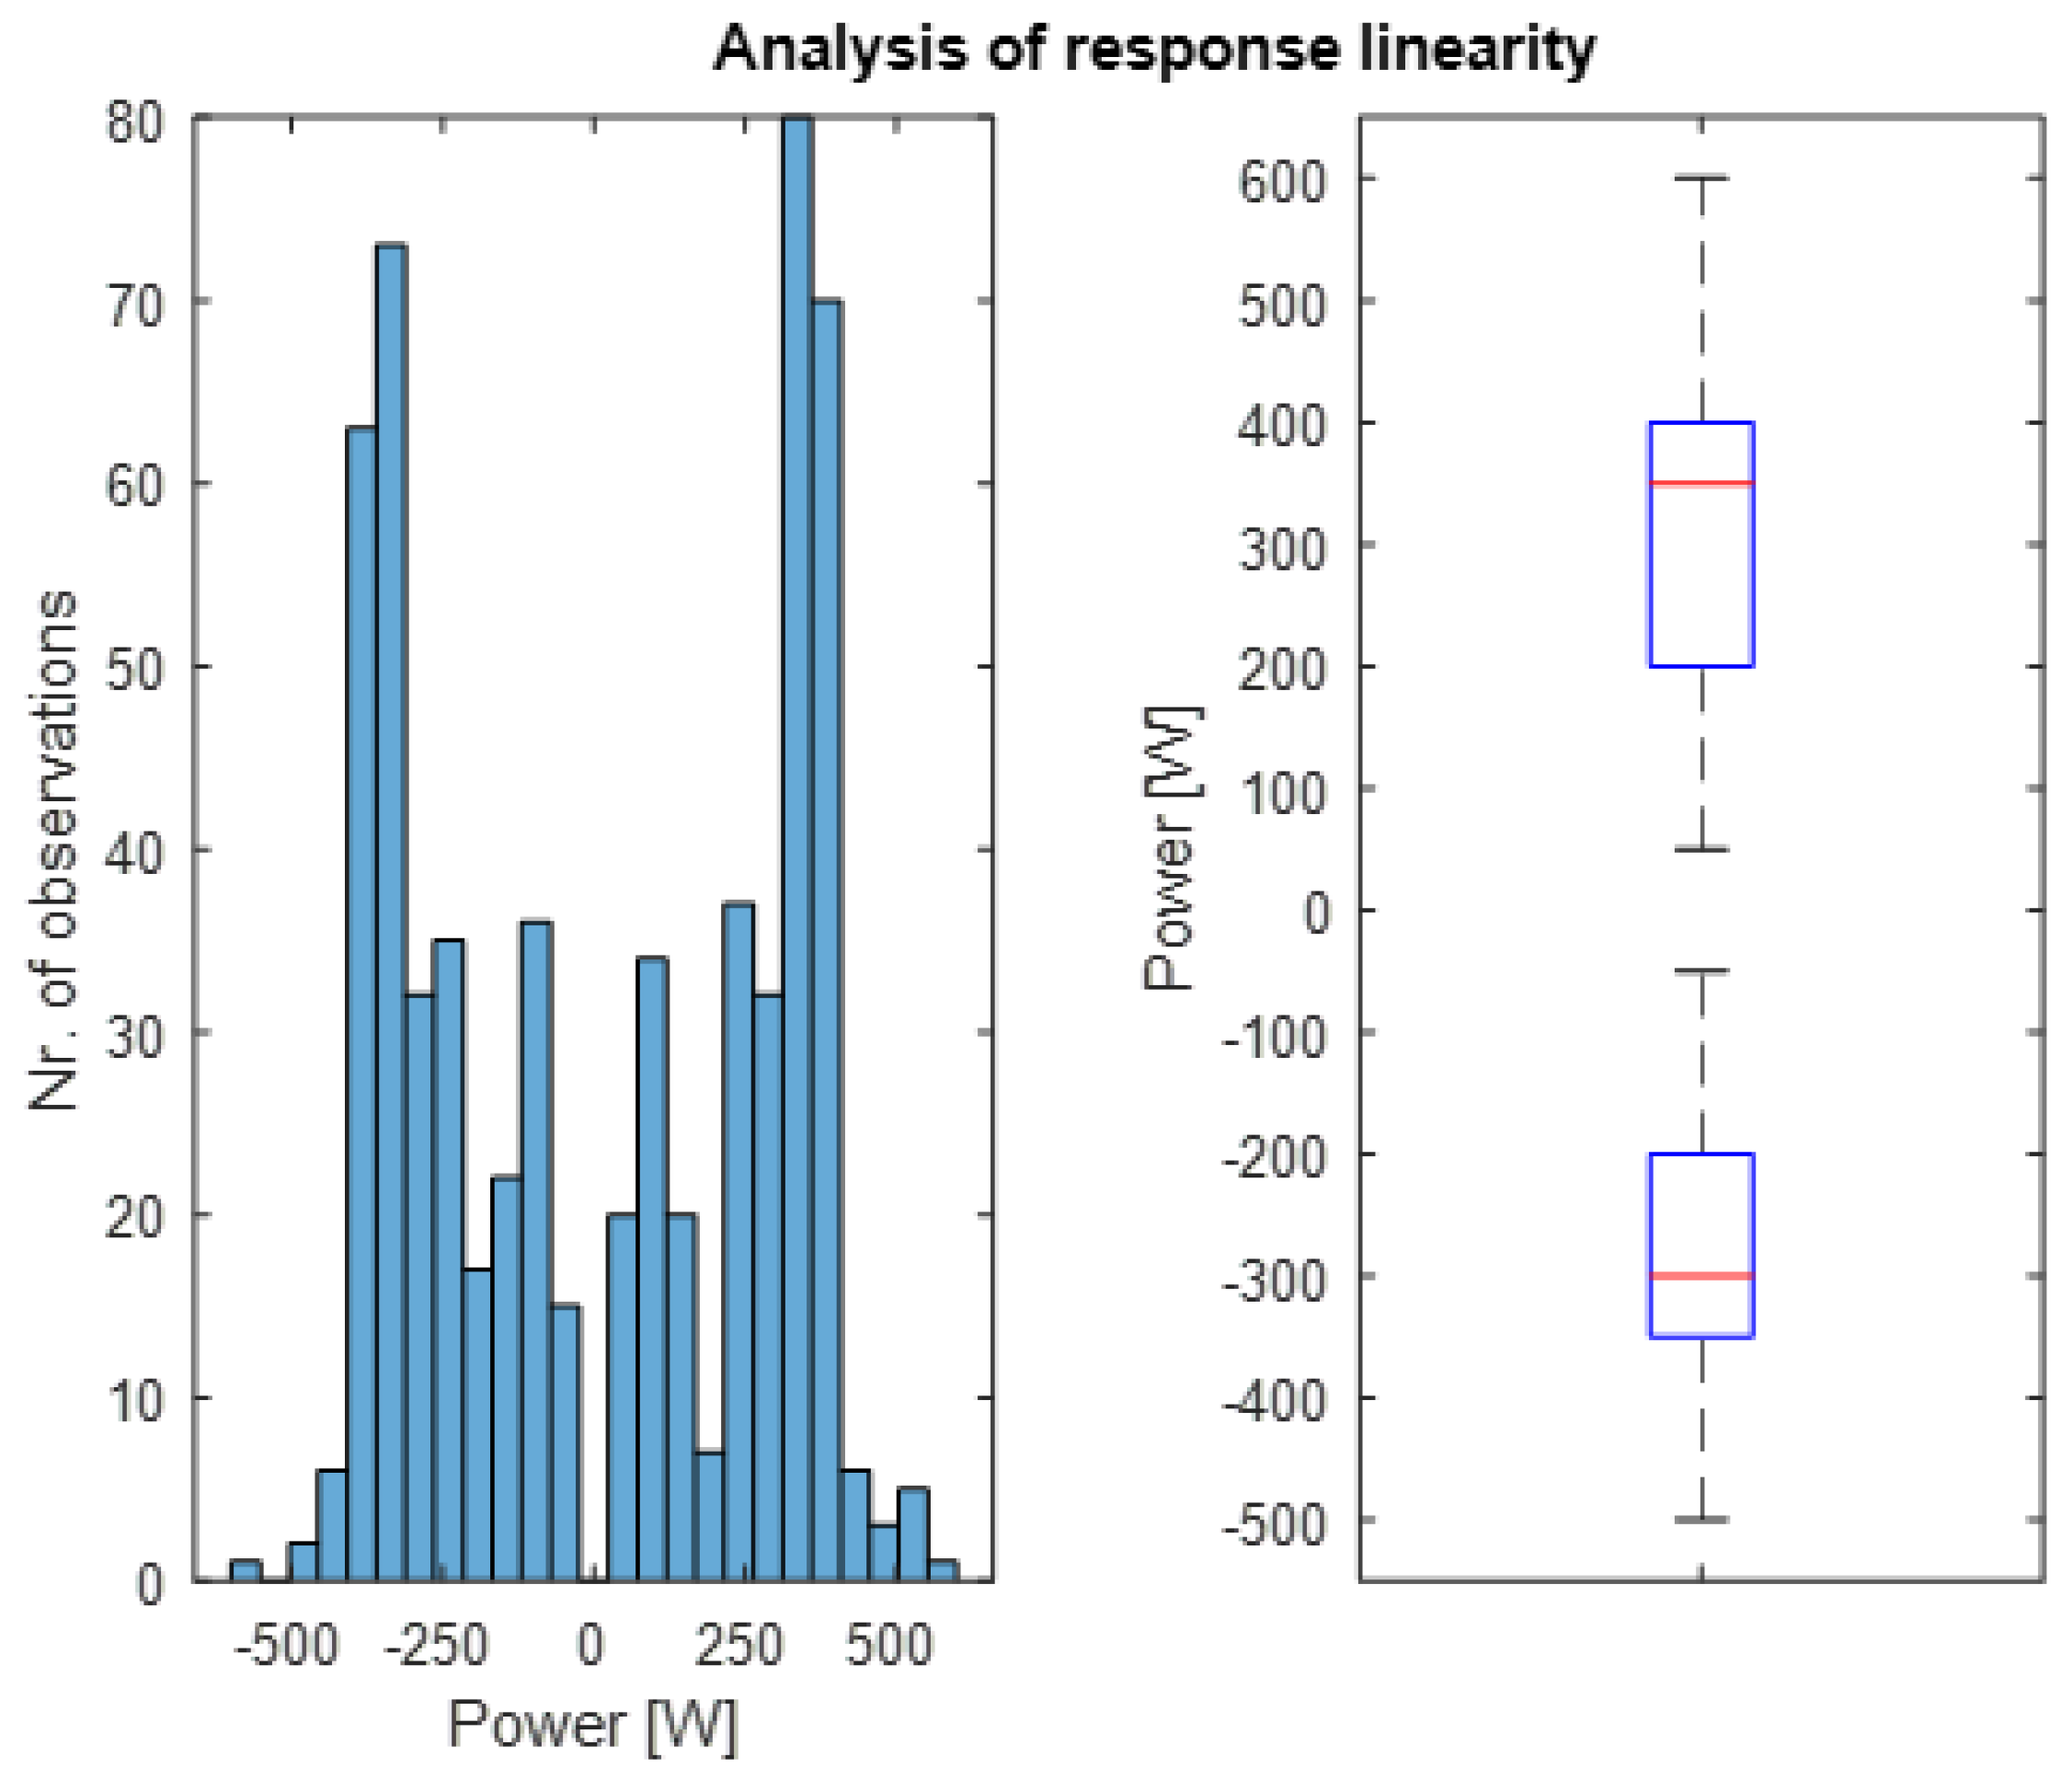
3.2.1. Calculation of Set-Point Linearity

The linearity in the response is studied in the continuous portion of the tested cycles, when a continuous linear set-point is sent to the unit. The amplitude of the granular response is calculated as the difference of the measured provided power calculated at two consecutive time stamps. Hence, a number of set-point granularities are calculated, which are then analyzed. In the presented response linearity analysis, two sources of probable errors have been excluded: the unavoidable noise in the measurements, and the response precision when setting a given set-point value. In this way, the actual linearity in the response can be calculated, thus excluding the influence of the response precision in the calculation. This is achieved by applying a manual discretization of 50 W on the measured data, given the average response precision of 50 W, as will be shown in Section 3.2.5.
Results are reported in Figure 7. The bar plot shows the distribution of the observed granularities for different positive or negative sizes. First, the symmetrical distribution for charging (<0) and discharging (>0) can be noticed. Then, the two bars with more observations (∼50% of the total observations) cover the range ±{300 400} W, whereas only in few cases (less than 5%) the absolute value of the granularity is >400 W. The same results are reported in the boxplots, which show the median values −300 W and +350 W.
In general, one can conclude that in very few cases the EV responds with a discreteness larger than 400 W when controlled with a linear signal. In addition, 400 W in AC can thus be considered as the finest response granularity for the hardware under test. In this case, neglecting conversion losses, 400 W in DC means a granularity of 1 A, being the DC link voltage equal to 400 V, according to the technical CHAdeMO protocol.

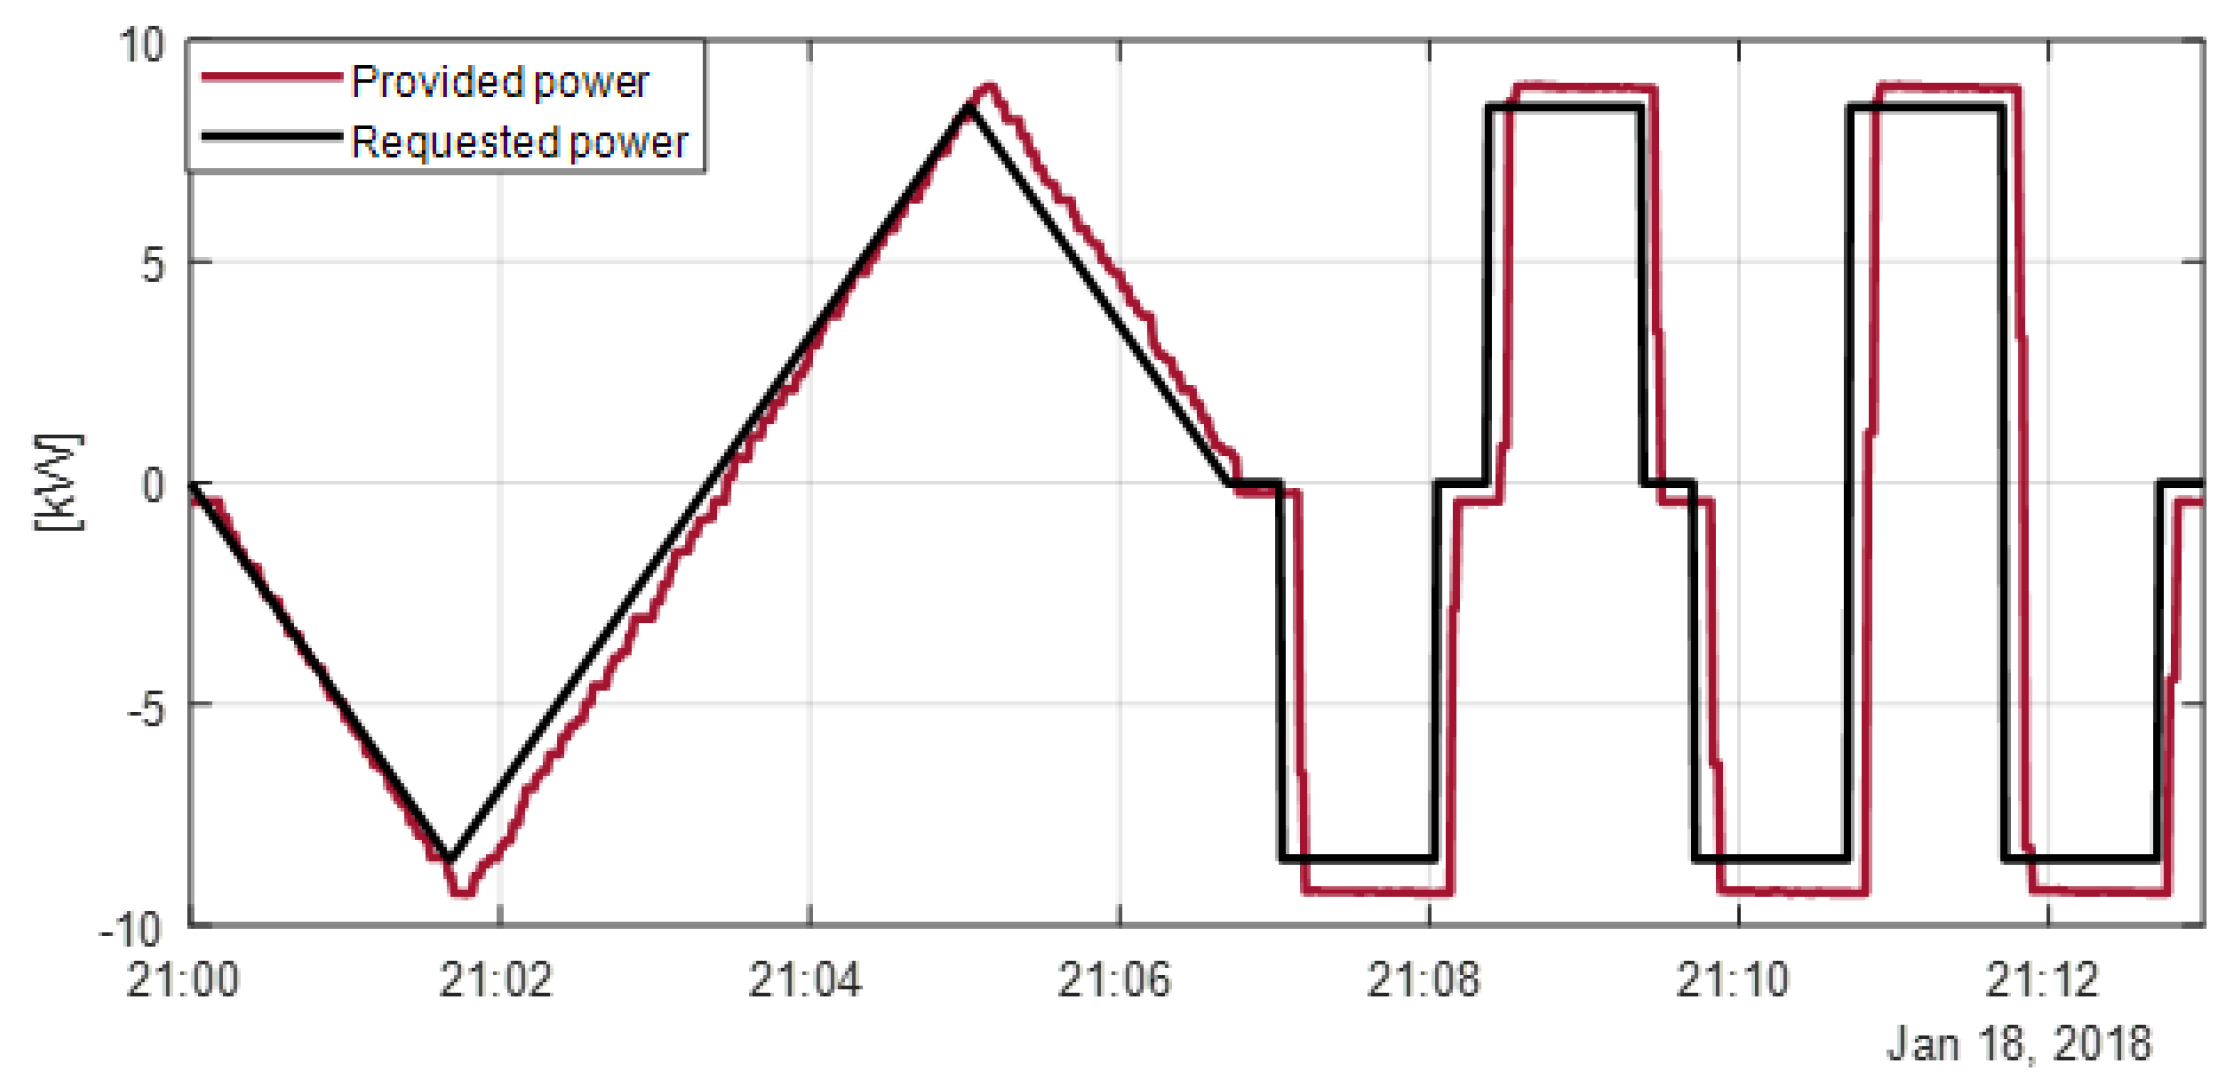
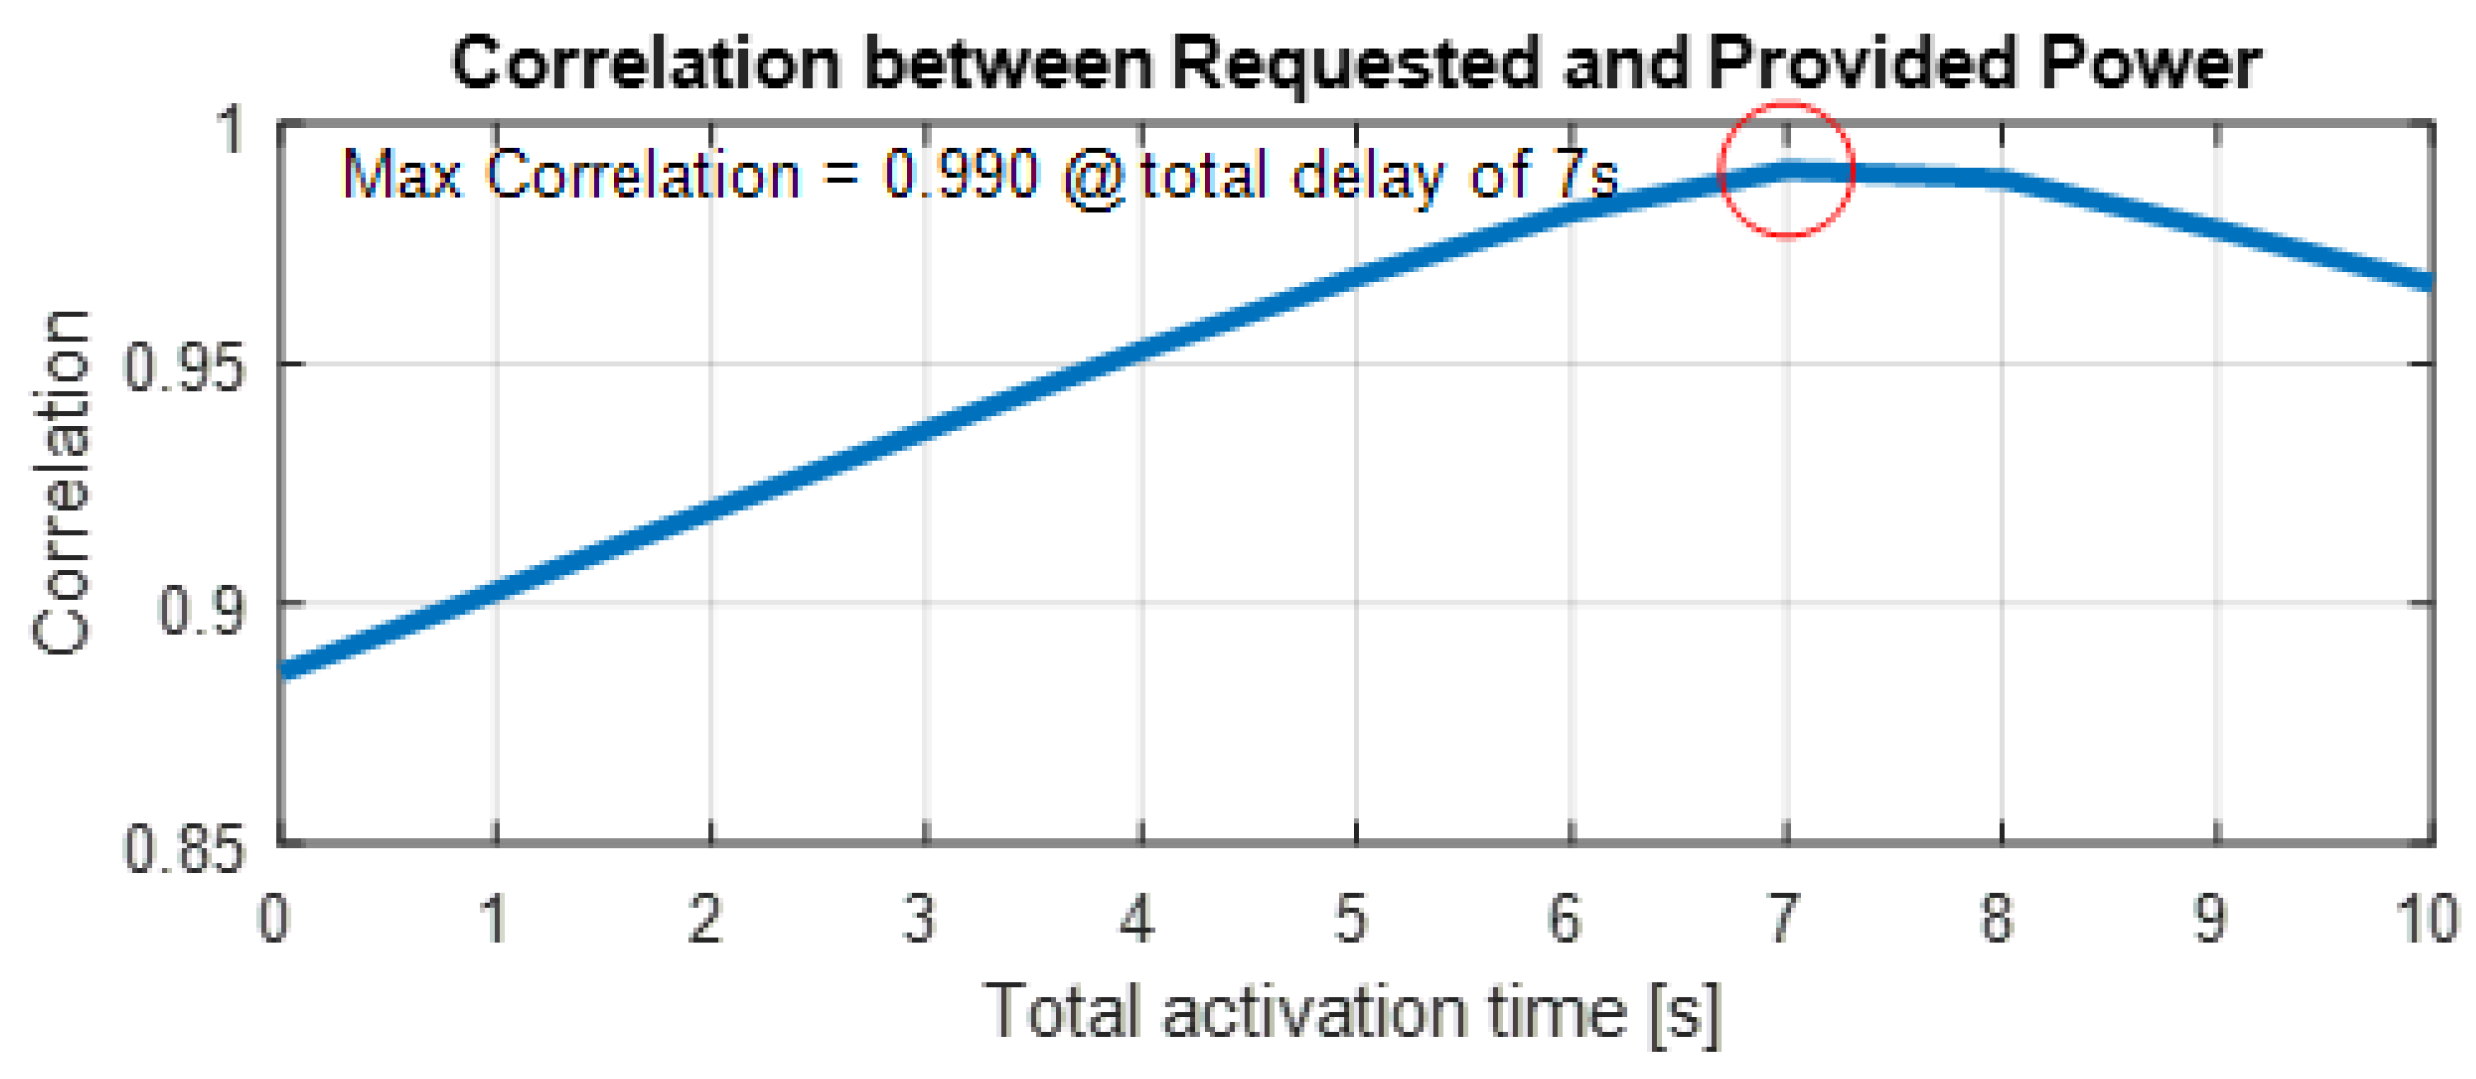
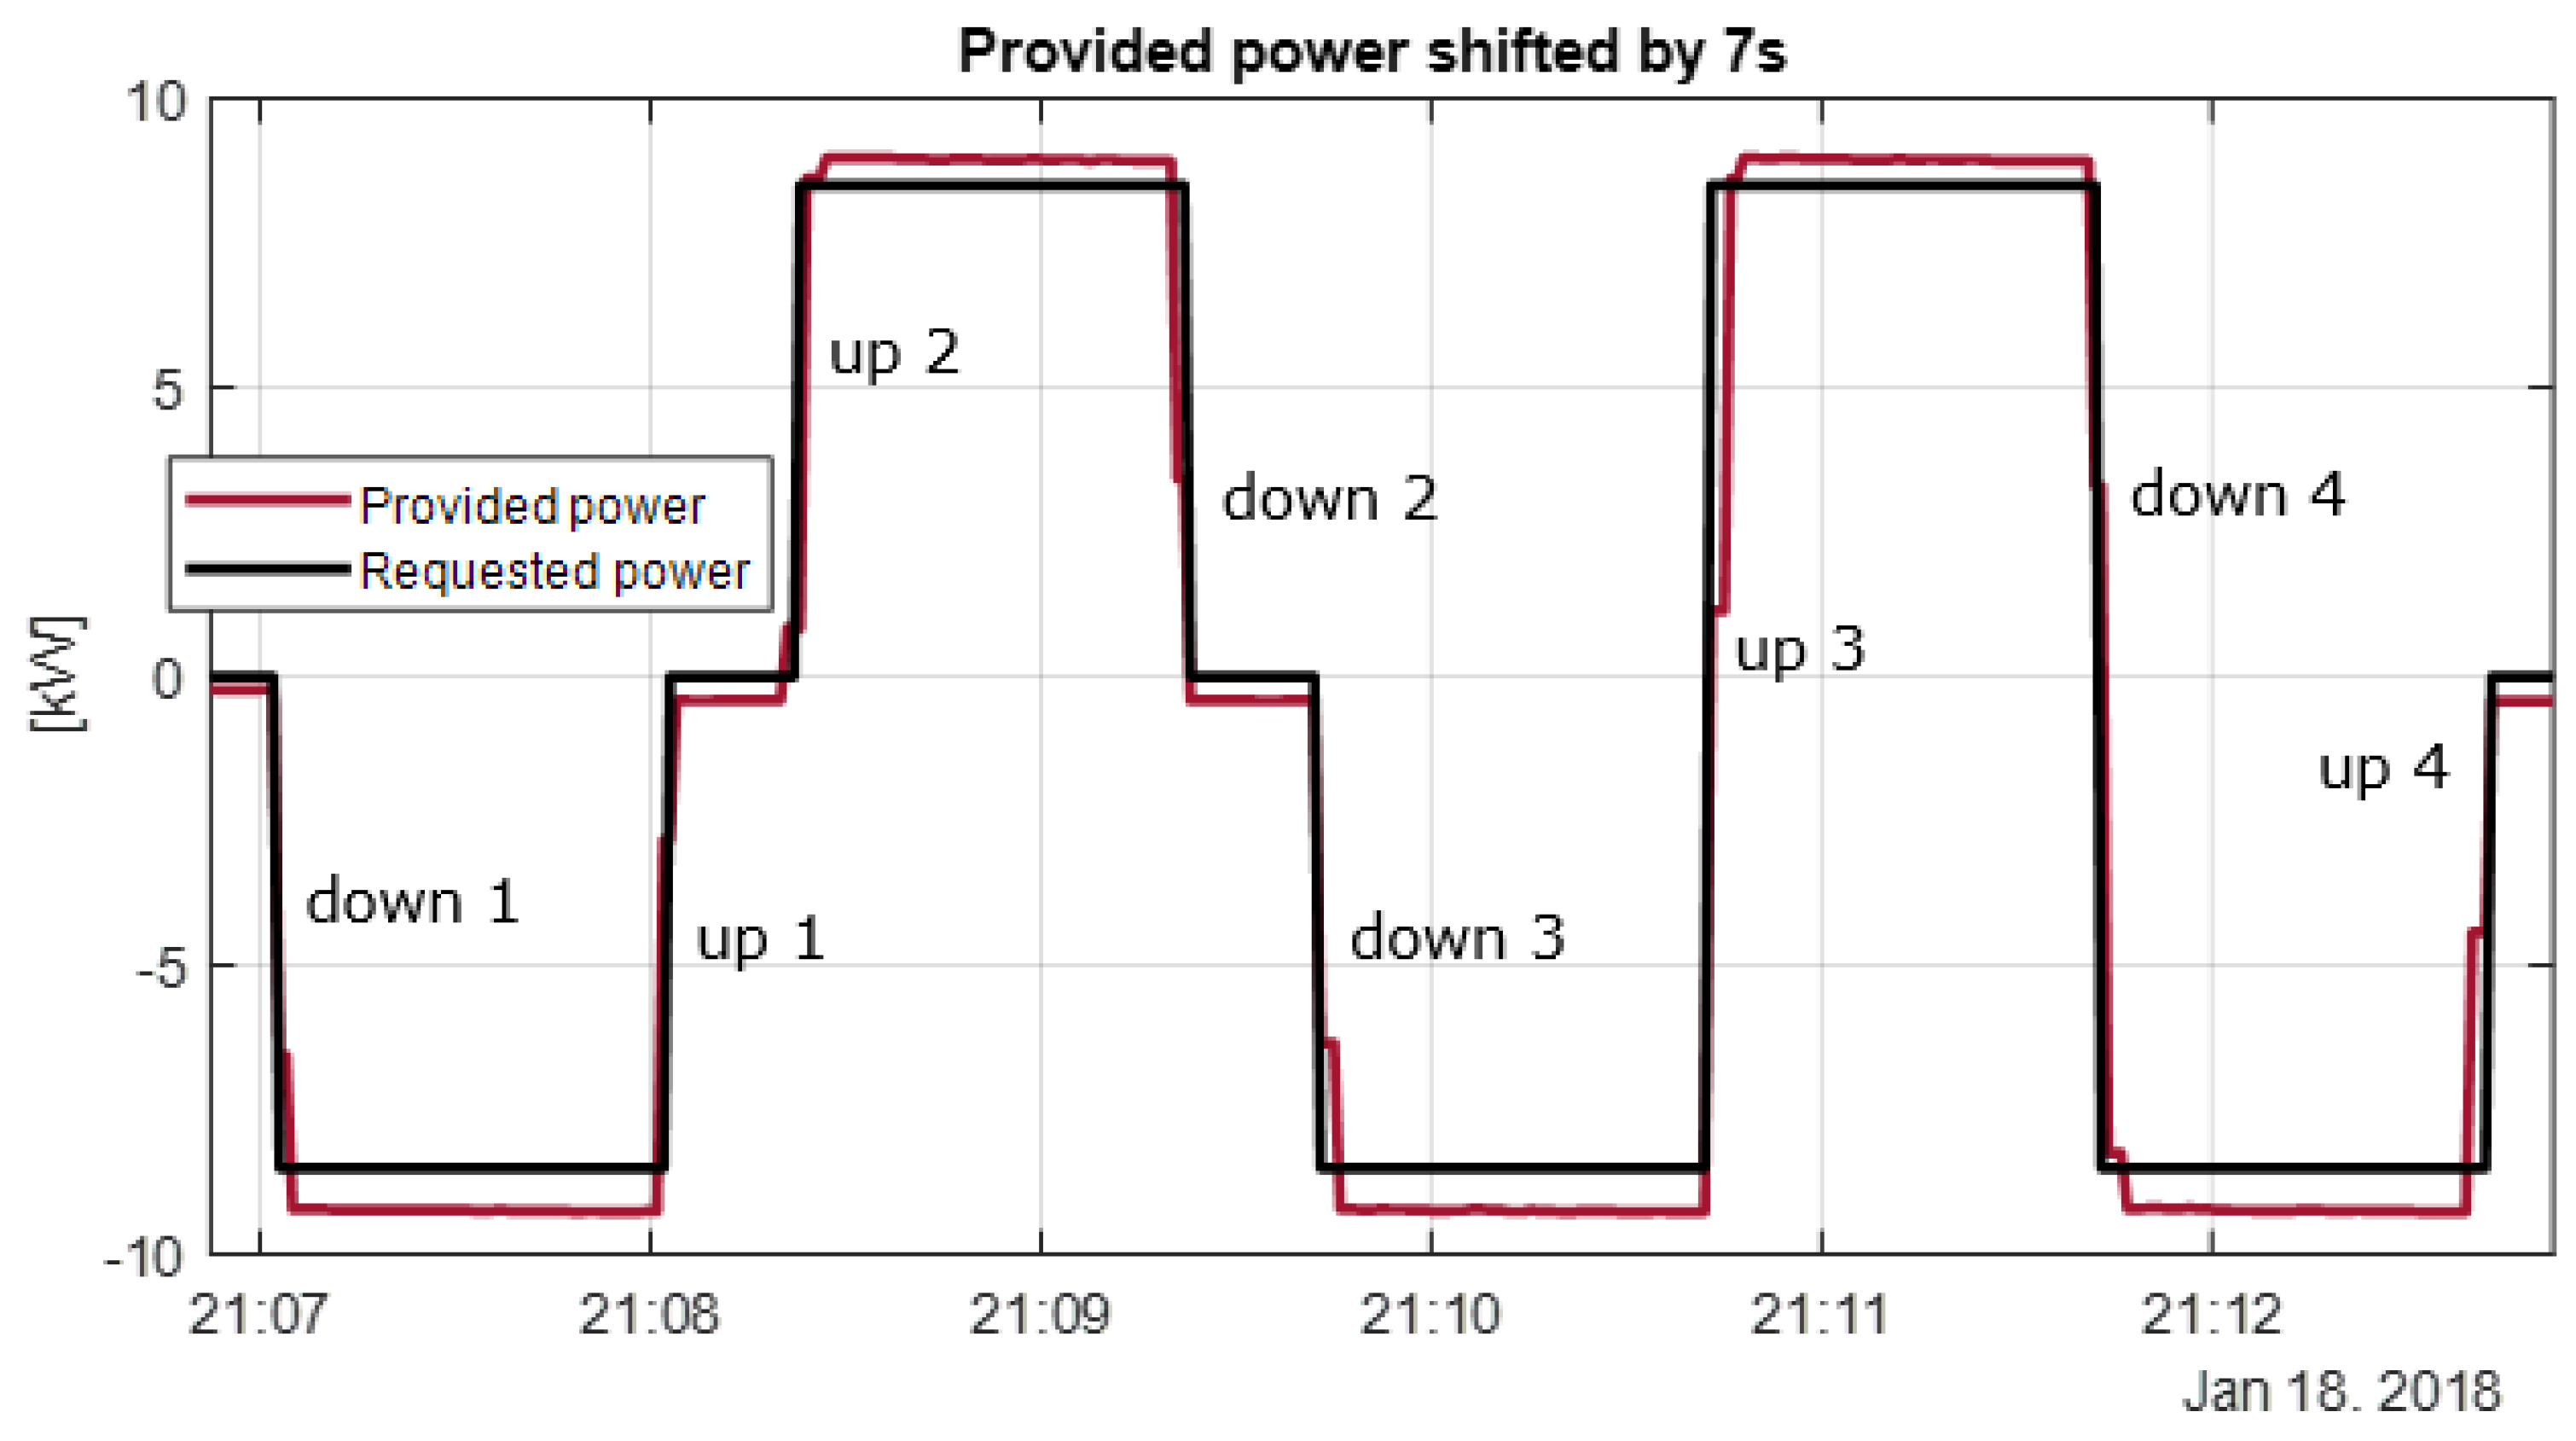
3.2.2. Calculation of Total Activation Time

The time shift shown in Figure 6 represents the total activation time given the employed remote control setup, which includes both the 4 s delay of the actual hardware response time found in Section 3.1.2, and the additional latencies due to the centralized control architecture. Figure 8 shows the correlation of the two signals of Figure 6 when applying different time shifts to one of them. The maximum is found for a shift of 7 s, which is then considered as the total activation time when the tested V2G equipment is controlled via the employed commercial centralized remote control setup.
By comparing this analysis with the similar one proposed in Section 4 for local control, an assessment of the influence on the overall response time only due to a centralized control architecture can be derived. This validation can then provide a valuable information on the actual total activation time capabilities given either a local or a remote control. Such information is of utmost importance when assessing the capabilities on the provision of time-critical power system services from aggregated small distributed energy resources, so when evaluating whether to implement a centralized or a decentralized control strategy.

3.2.3. Calculation of Ramping Up/Down

The ramping up/down capabilities are studied in the step-wise portion of the tested cycles, where four events up and four events down are performed as shown in Figure 9. The charging power is changed from the zero set-point to the minimum and maximum values, back to zero. In addition, the largest possible steps are analyzed, i.e., when setting the maximum power starting from the minimum set-point, and vice versa.
Table 1 reports numerical results of the calculated up/down ramping rates. The average up and down rates almost coincide, and are equal to about 3.3 kW/s when expressed in the general unit of measurement [kW/s], i.e., related to 1 s time window. Nevertheless, the minimum calculated up and down rates are 1.8 kW/s (up2-cycle4) and 2.2 kW/s (down1-cycle2,3 and down3-cycle1), respectively, which is way lower than the average. This means that the unit on average responds with 3.3 kW/s, but may respond slower.
This outcome on the ramping rates is very important, as it can be valuable information for grid operators when performing grid regulation studies, assessing the impacts of grid regulation services provided by such units. Moreover, it can be useful also when defining requirements for grid connected V2G technologies, provided the knowledge of the technology under exam.

3.2.4. Calculation of Set-Point Accuracy

The calculation of the set-point accuracy is done during the constant set-point levels of the step-wise portion of the tested cycles, as highlighted in Figure 10. The accuracy is calculated as the difference between the requested and the provided power over the appropriate time windows.
It was found that, for charging operations (power < 0), the power drawn from the grid is larger than the requested power. The same happens in case of zero set-point, where the power consumption is justified as the own consumption of the power electronics on stand-by mode. During the discharge operations, the power injected into the AC grid is higher than expected. This is probably due to a wrong calibration of the internal EV charger power electronics, which should be tuned to avoid higher injection of power higher than the requested value, as it could compromise the safe operation.
At zero set-point, the charger absorbs from the grid on average 420 W, which can then be considered as the unit’s stand-by loss. In case of full charging operation (requested power = 8.5 kW), the calculated accuracy is 740 W, which represents the 8.7% of the power set-point. Such accuracy is higher than the stand-by losses, probably due to a non-optimal calibration of the unit. Finally, during the full discharging operation (requested power = −8.5 kW), an unexpected power value higher than the requested one was measured. Results show that the average power provided is higher than the requested by 440 W, which is 5.2% of the power set-point.

3.2.5. Calculation of Set-Point Precision

As done for the accuracy, the precision is calculated during the constant set-point levels of the step-wise portion of the test cycles. The accuracy is calculated as the difference between the maximum and the minimum values of the provided power over the whole length of the time windows with stable extreme set-points. This means that the precision calculated with this test cycle can be considered as the worst case as for the extreme charging and discharging set-points.
It is found that the precision is about 50 W for both the extreme charging and discharging operation. This value justifies the choice of 50 W as manual discretization factor that has been utilized in the analysis of the linearity presented in Section 3.2.1. In case of zero-set-point, the precision was much higher, since the difference between maximum and minimum of the measured power was about 6 W.

4. Experimental Tests Discussion

Table 2 shows the summary outcome of the performance tests results for each identified flexibility product attribute, with the respective performance target defined by current technical standards. In particular, the requirements have been adapted from the Danish technical standard for FCR provision [14] and the newly released Danish technical regulation for grid connected battery plants, which applies also for a number of aggregated EV chargers providing V2G services [26]. Such requirements are then considered as benchmarks when evaluating the eligibility of EVs in FCR service provision.
Going through the seven attributes, firstly it can be seen that the symmetric power reserve bid requested by [14] applies to a bi-directional power flow capability, which is available due to the V2G technology. As for the set-point linearity, generally a linearity of 1% of the rated power is requested. It is found that the finest response has a granularity of 400 W, which represents the 4% of the rated power, thus not fulfilling the requirement. However, as this is the linearity for only one single unit, when managing an EV fleet the fleet operator should then apply smart logics, e.g., based on stochastic logics aimed at reaching—as proposed in [27]—the required target on an aggregated level. As for the activation time, the latencies due to remote control communication amount to about 3 s, while the mere hardware is characterized by an activation time of 4 s. Ref. [14] requires the activation of half of the full capacity within 15 s, which is then respected considering an instantaneous response. In reality, the response has an up-down ramping rate, which amounts to an average value of 3.3 kW/s. For the tested charger, this means that the total activation time for half of the reserve (5 kW) would be about 8.6 s, which is lower than the requested 15 s. Ref. [26] requires a ramping rate capability for the aggregated fleet within the range of 10–300 kW/s, which is out of the range of capabilities of the single units. This means that, considering again the average value of 3.3 kW/s, the minimum and maximum number of EVs to be employed for matching the required 10–300 kW/s ramping range will be 3 and 91, respectively. Finally, for accuracy and precision, Ref. [26] requires a response within ±5% of the set-point and ±0.5% of the rated power. The requirement on the precision is not available, whereas, for the accuracy, the limits at the two maximum charging and discharging levels are overcome. This issue may be dealt with proper calibration of the internal power electronics that should be tuned to avoid such inaccuracies. Furthermore, as the requirements refer to the overall battery plant, smart fleet management solutions could be implemented, to reduce the reserve provision error via appropriate individual control of the single EVs, e.g., as proposed in [27].

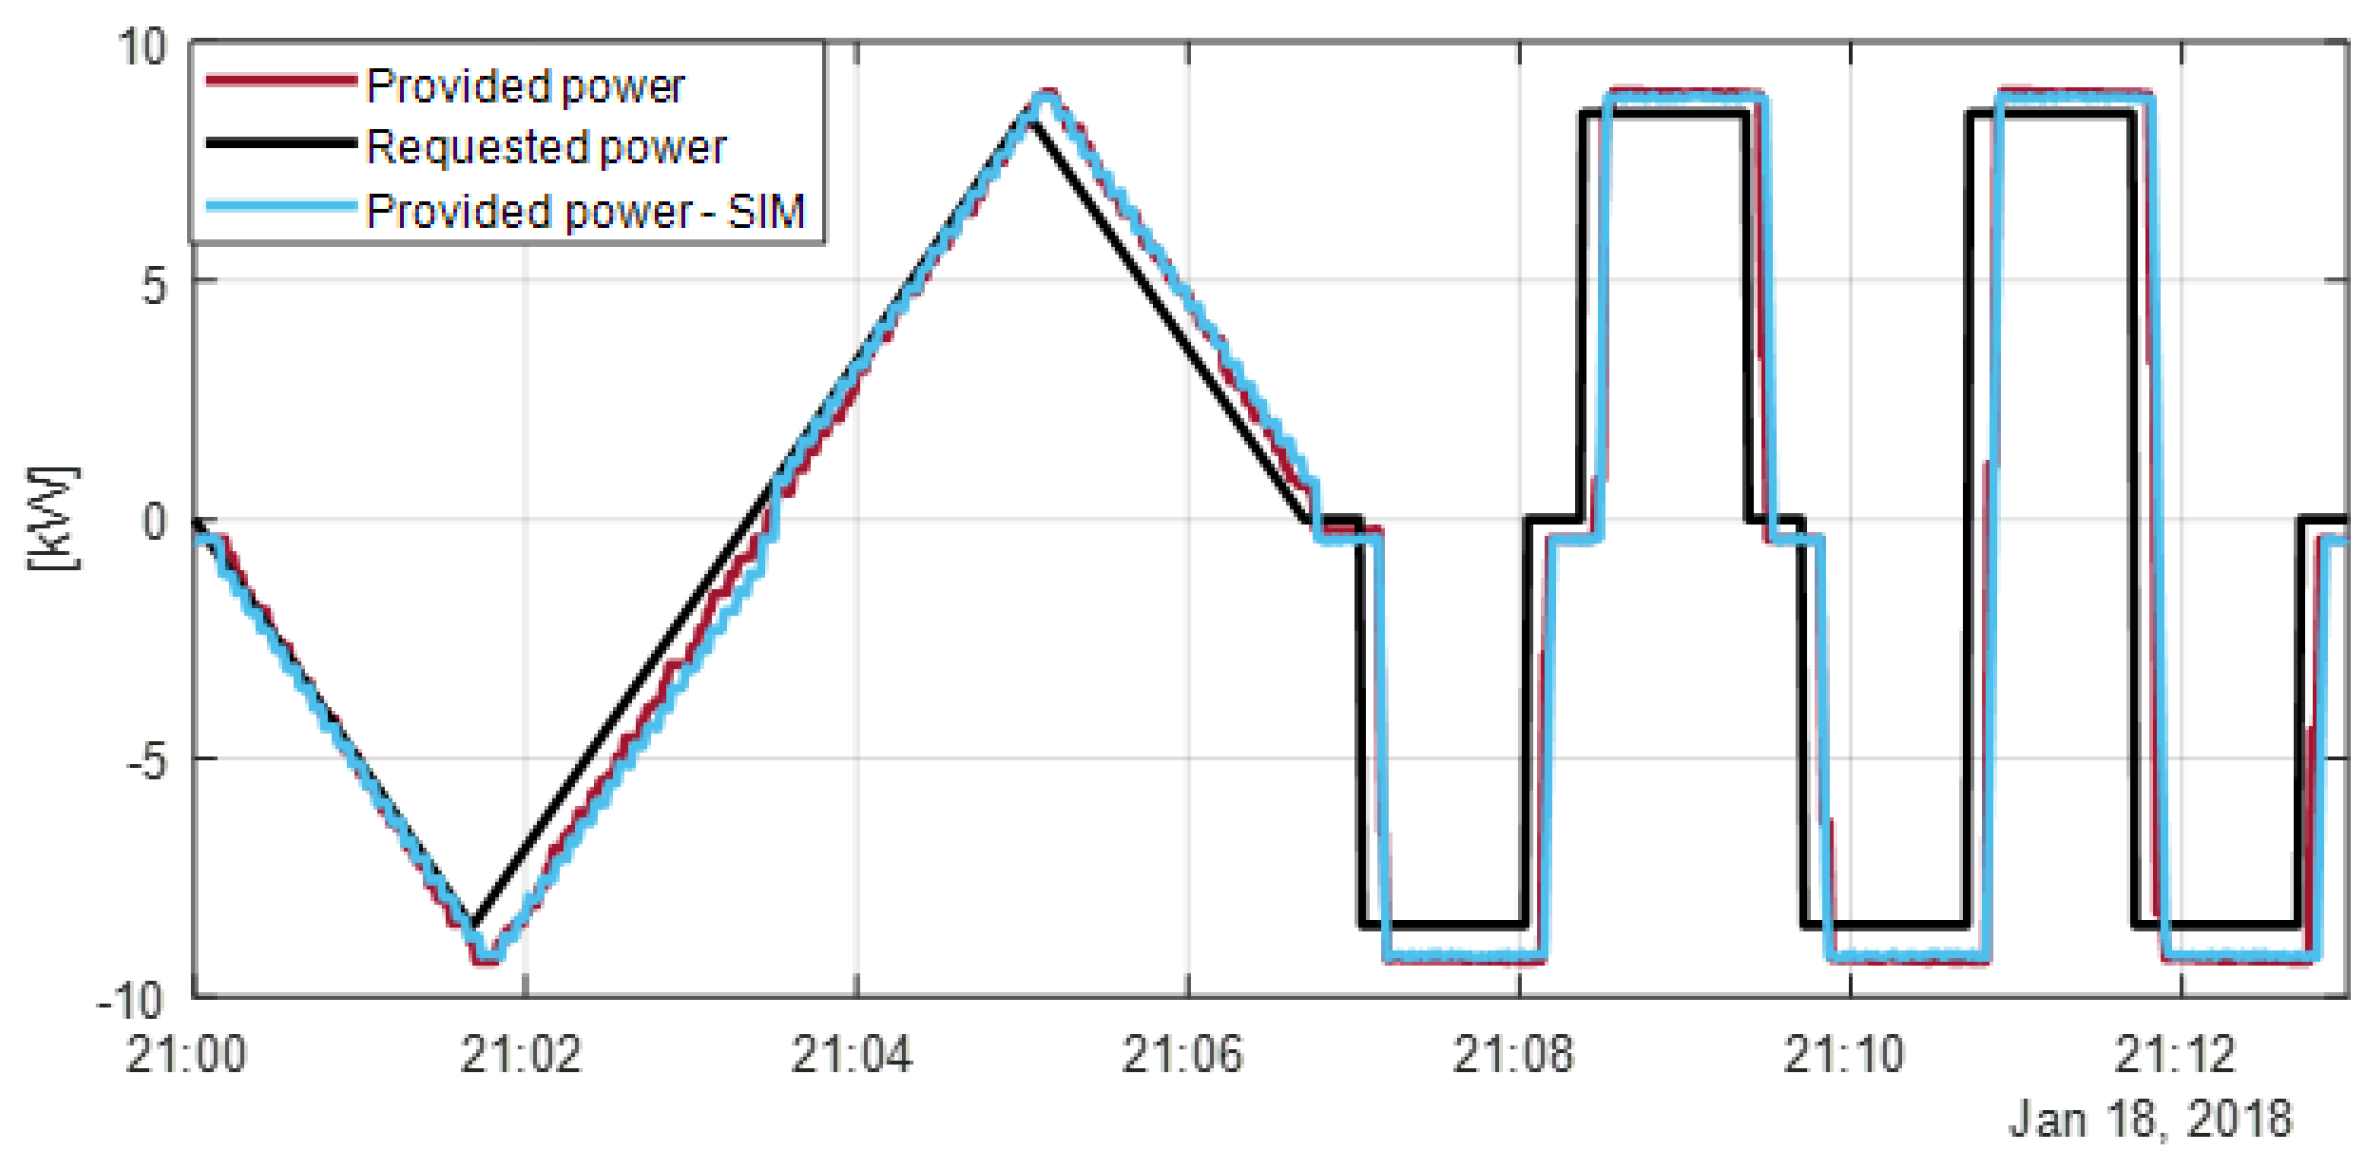
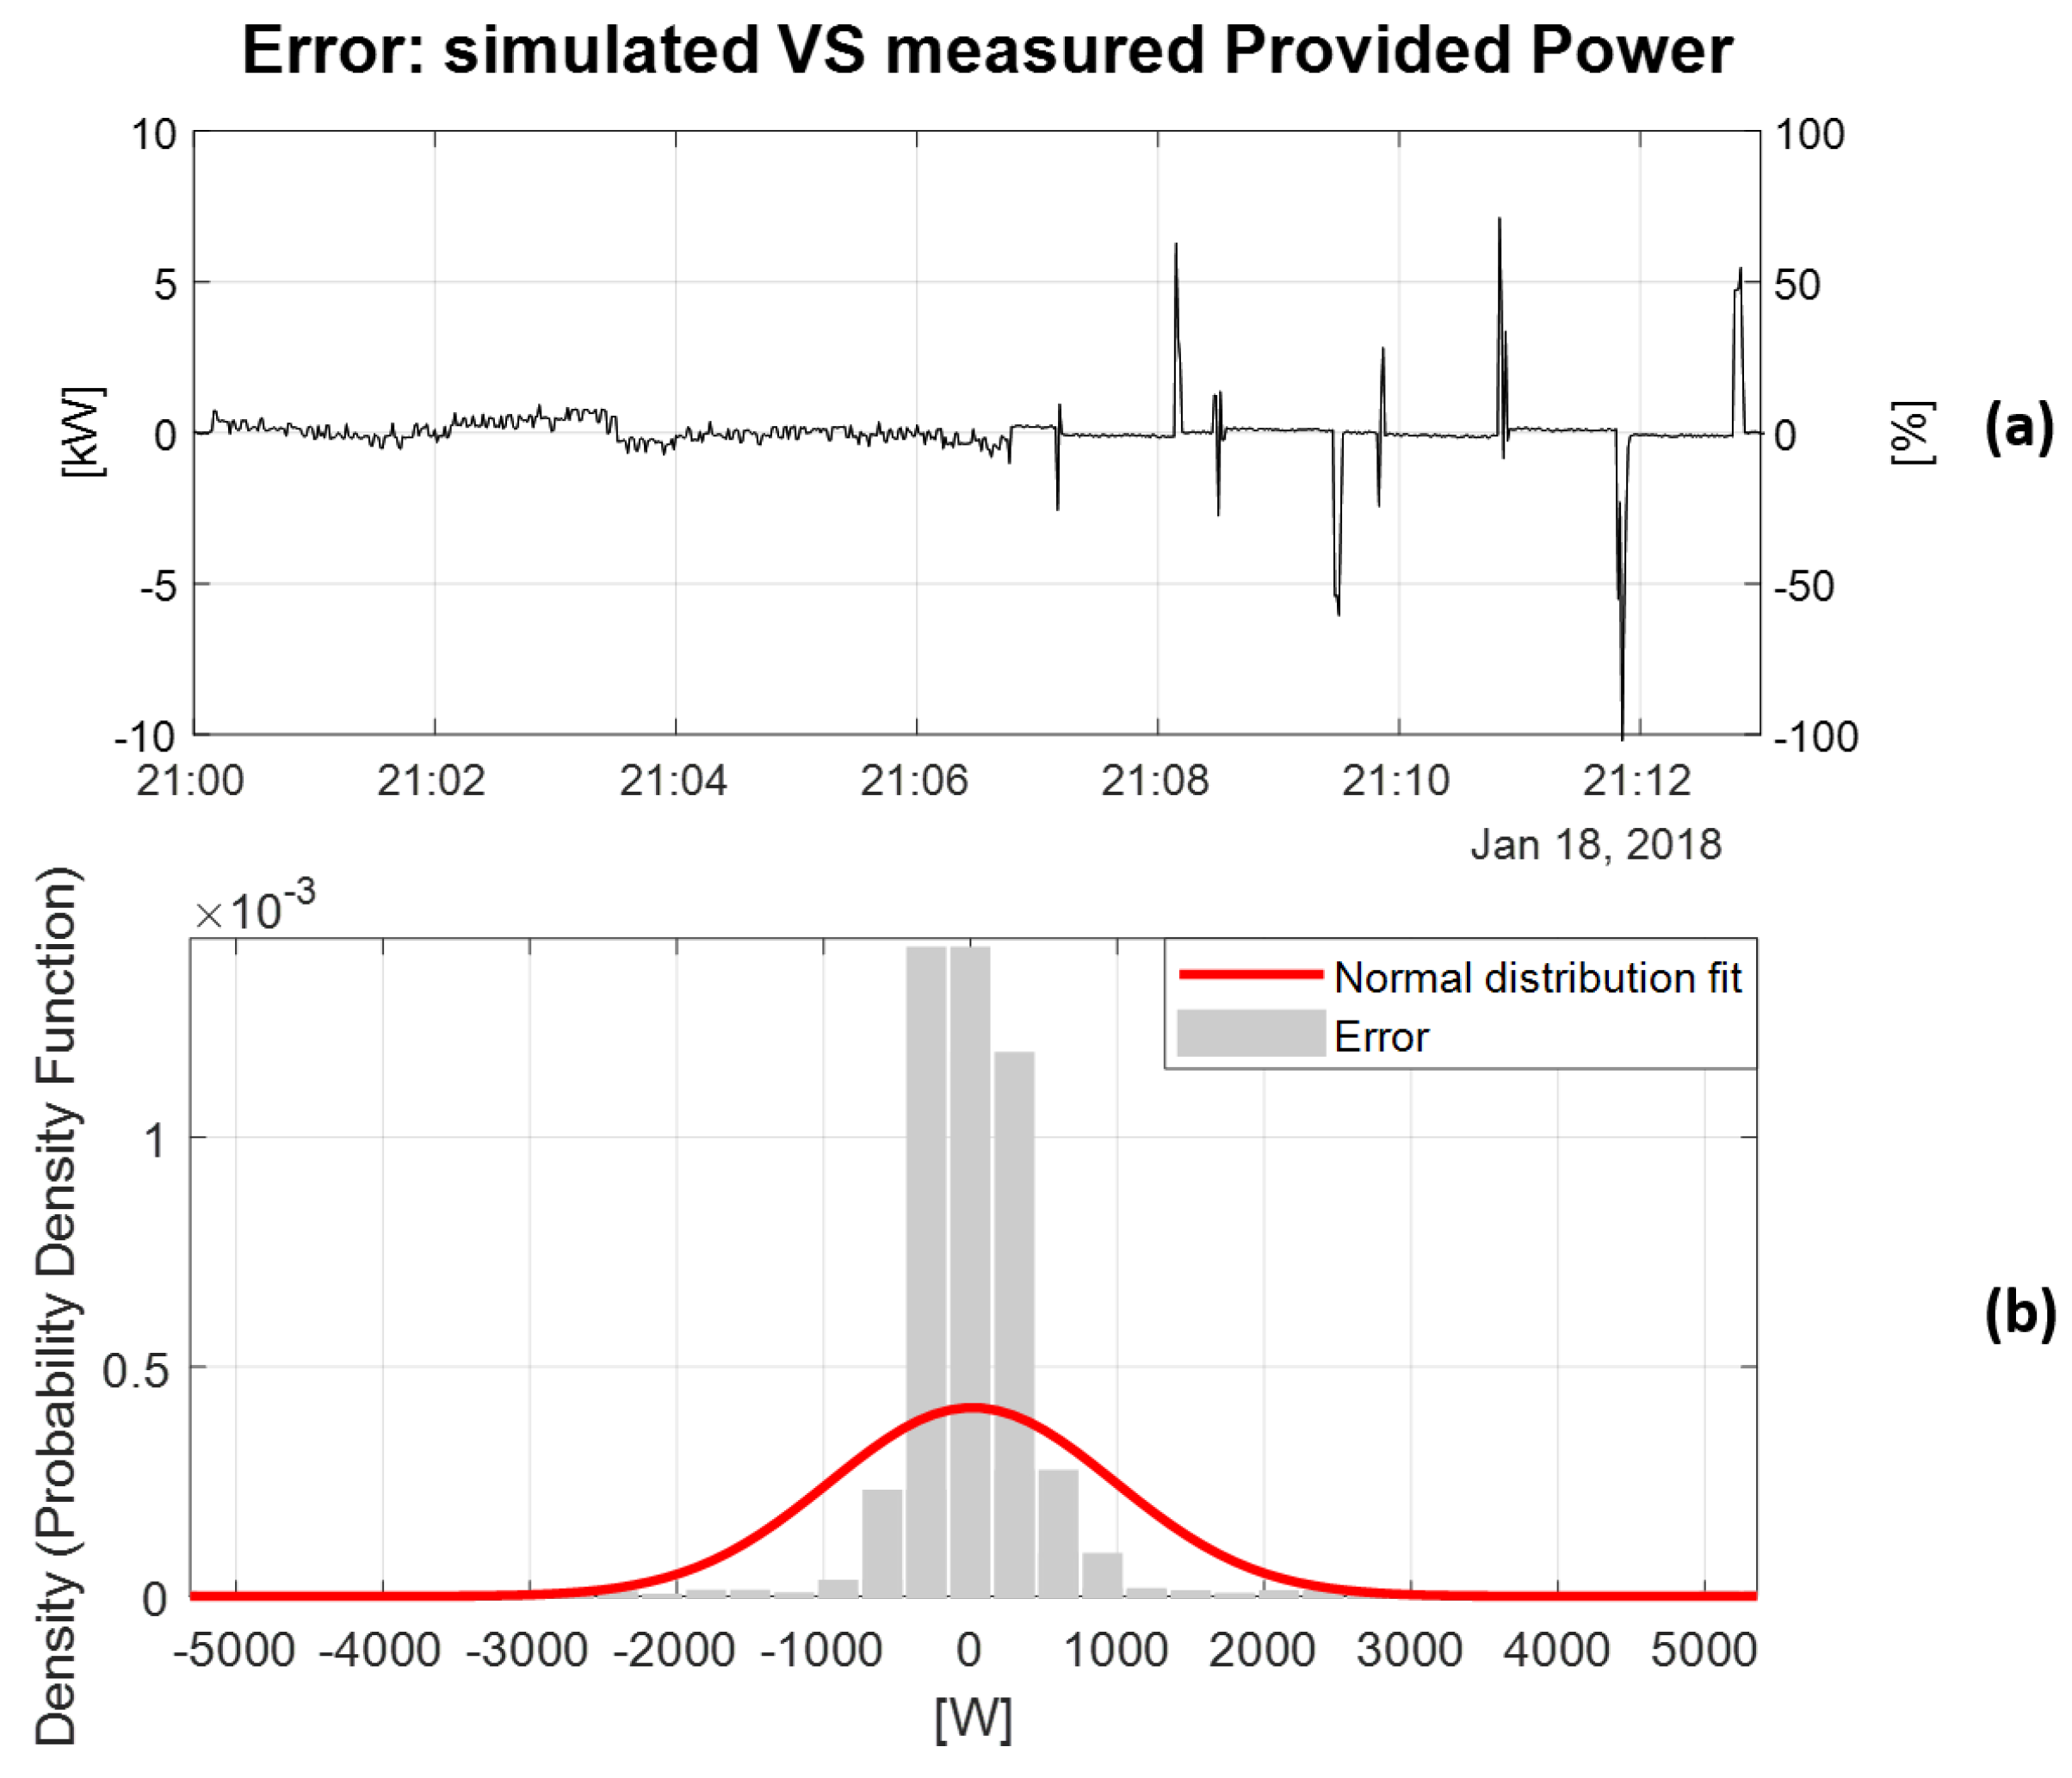
5. Modelling of the Tested Hardware

Given the tested EV flexibility product attributes, it is now of interest to design an appropriate V2G charger model, which takes into account the tests outcome. The proposed model is a direct example of how important hardware characterization tests are for the development of realistic simulation models that can be implemented for subsequent simulation studies for example when assessing the power system impacts of bi-directional EVs. The EV charger model is designed using the Simulink platform within the Matlab MathWorks 2018b software environment. A schematic representation is shown in Figure 11.
The model receives as input the desired power set-point PowerRequested and provides the signal PowerProvidedSIM, similarly to the real operation cases. The output signal is calculated by including appropriate actions that represent the charger’s real operation. In particular:
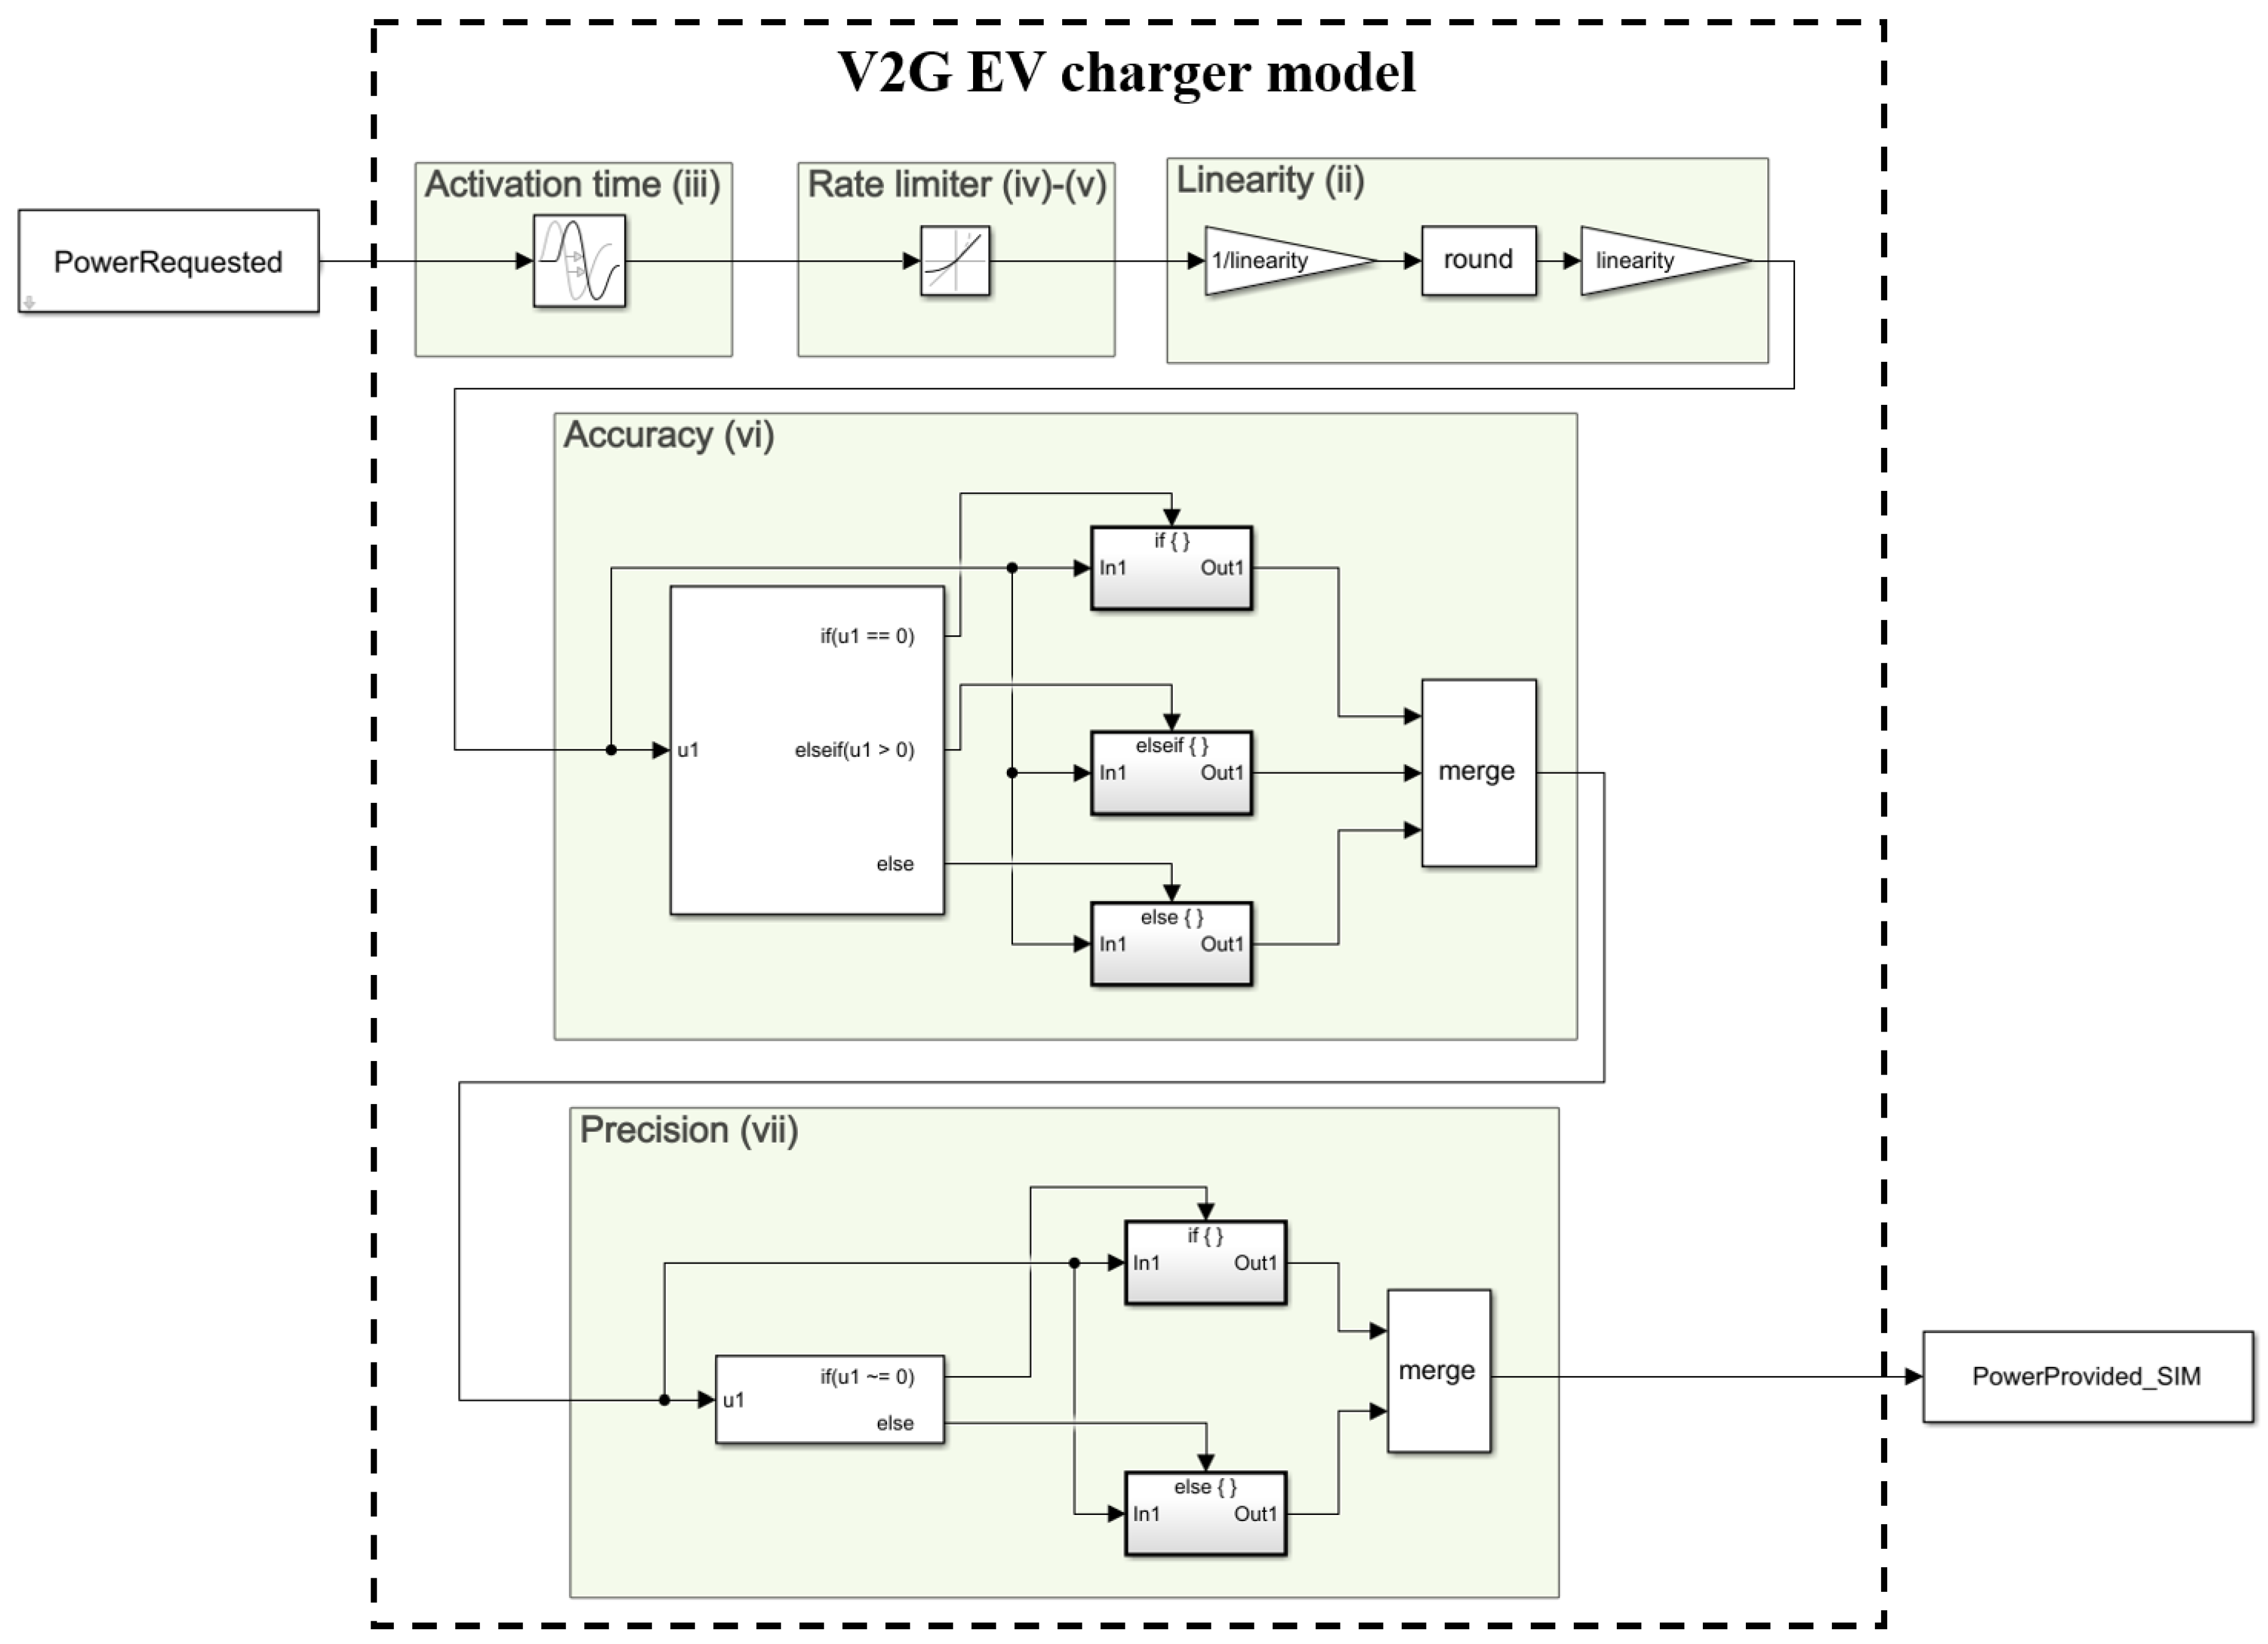
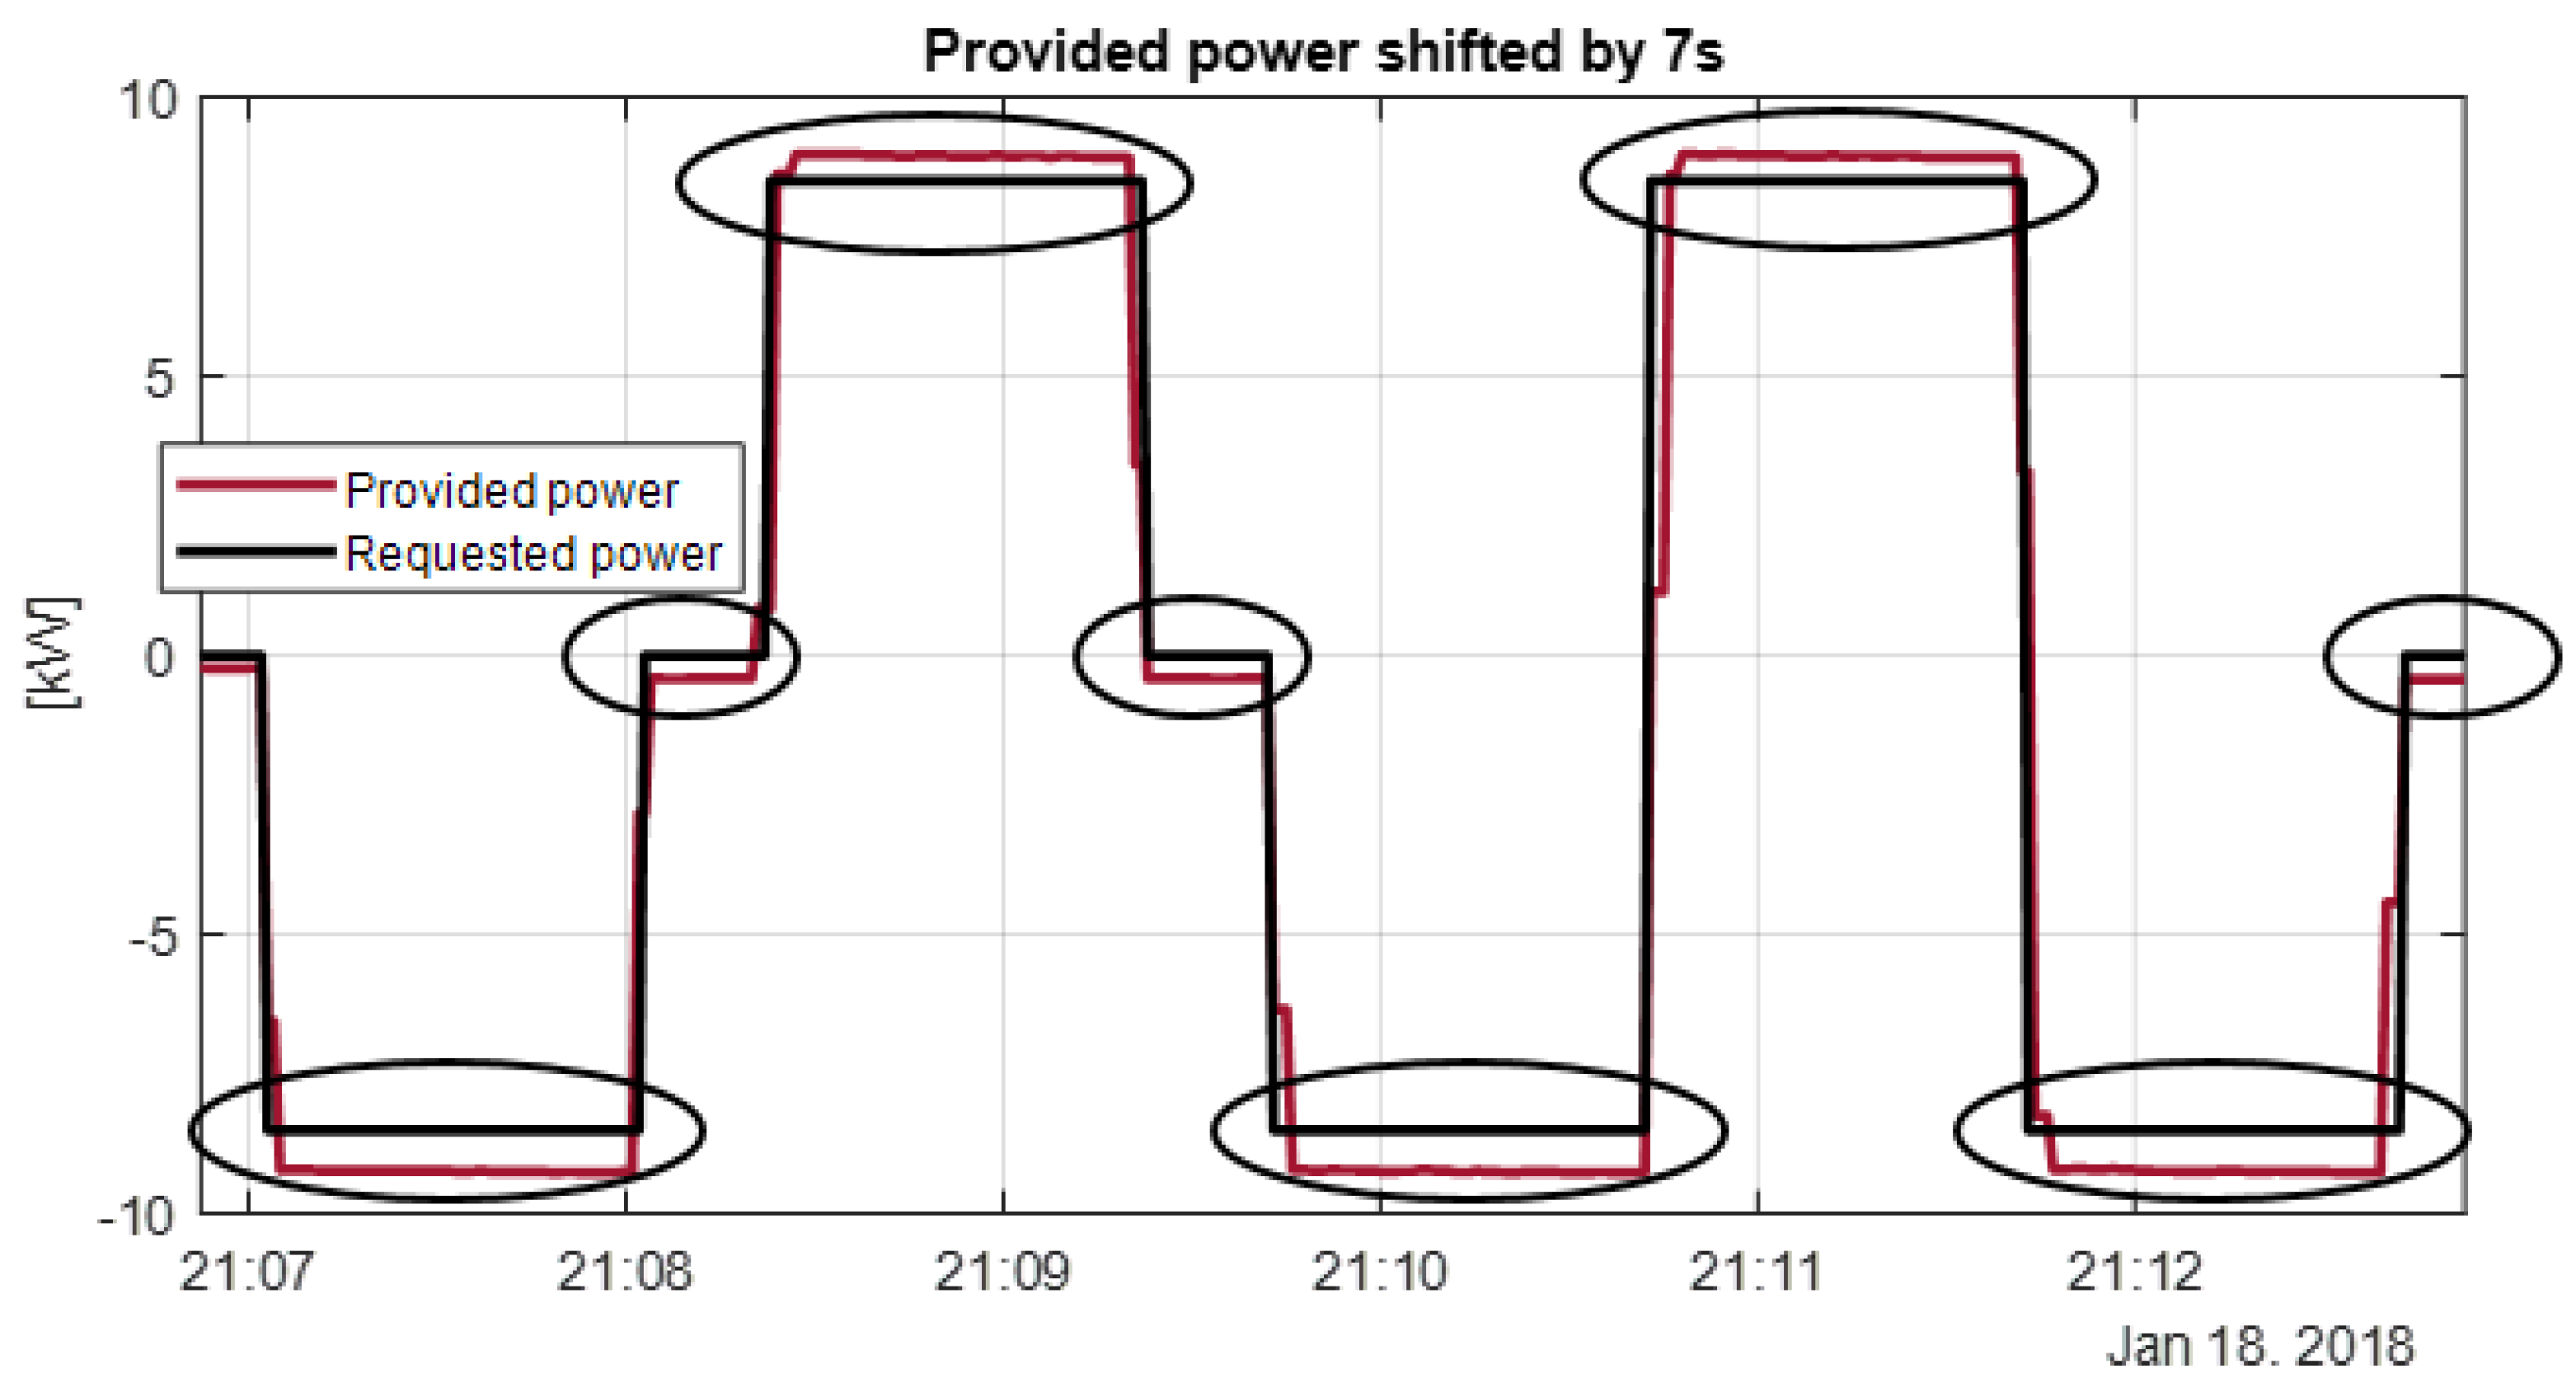
  • the Activation time (iii) is modelled as a transport delay, equal to 4 s or 7 s in case of local or remote control, respectively;
  • the Ramp-up/-down time (iv)–(v) is modelled with a rate limiter block, with the mean values 3.35 kW/s and 3.31 kW/s, respectively;
  • the Set-point linearity (ii) is obtained by implementing Equation (1):
    o u t l i n = ( l i n e a r i t y i n l i n ) round ( i n l i n / l i n e a r i t y ) ,
    where inlin and outlin are the non-rounded and the rounded power signals, respectively, whereas linearity is a constant parameter equal 400 W;
  • the Accuracy (vi) is implemented by adding to the power set-point the appropriate mean value of accuracy, i.e., 740 W, −440 W, and 420 W for negative set-point, positive set-point and zero set-point, respectively. The implementation is obtained according to Equation (2):
    o u t a c c = i n a c c + 440 W , i f i n a c c > 0 i n a c c + 420 W , i f i n a c c = 0 i n a c c 740 W , i f i n a c c < 0 ;
  • the Precision (vii) is implemented by adding a uniformly distributed noise to the calculated set-point. On average, the noise has a an amplitude of 50 W and 6 W for set-point ≠ 0 and for zero set-point, respectively. The implementation is obtained according to Equation (3):
    o u t p r e c = i n p r e c + r ( 50 / 2 W ) , i f i n p r e c 0 i n p r e c + r ( 6 / 2 W ) , i f i n p r e c = 0 ,
    where r is a random number uniformly distributed between −1 and +1 throughout the simulation.
The proposed EV charger model has been implemented and tested via simulations using as input the same Requested power signals that have been utilized in occasion of the remote control test on the real hardware, i.e., the black line in Figure 6. Although the full test pattern of four full cycles was simulated, for the sake of the visual simplicity, Figure 12 shows only one cycle, in line with the results in Figure 6. Results show that the simulated results (Provided power-SIM—light blue line) matches rather adequately the Provided power measured during the remote control test, provided that, for both the experimental and simulation remote control tests, the input signal was the same black test pattern.
Furthermore, Figure 13 shows the error that one can make by using the proposed Simulink model when assessing the actual response of the EV charger given a certain charging/discharging power set-point pattern. In particular, Figure 13a reports the error for the cycle shown in Figure 12, calculated as the difference between the two Provided power result signals. One can note that, in the continuous section of the test (first half of the cycle), the error is for most of the time contained within a very small band, i.e., ±0.5 kW (±5% of the charger rated power). In the second half of the cycle, the error is reduced to the band ±0.15 kW (±1.5% of the charger rated power) for the conditions of a stable set-point, whereas it presents some very punctual spikes corresponding to the large discrete set-point steps. The reason for such spikes are related to the implementation of mean values in the model, not only for the attributes in [W], but also for the Activation time, which plays a crucial role when the set-point is changed in a discretized way between the extreme set-points of the tested/modelled charger.
Ultimately, Figure 13b reports statistical results for the entire test pattern relying on the Matlab Statistical toolbox. One can note that the majority of the measured mismatches between tested and simulated provided power are within the band ±0.5 kW, for which the Density (calculated with the Probability Density Function) has higher values, as shown by the grey bar plots. To complete the analyses, the red curve represents the result of the fitting curve with the most suitable distribution. In particular, results show that the distribution of the errors can be well approximated with a normal distribution function with mean value μ = 12 W and standard deviation σ = 970 W.

6. Conclusions

In this paper, the technical capabilities of a commercial V2G CHAdeMO charger have been identified to assess the suitability of such technology for grid service provision. Specifically, the importance of the knowledge of the efficiency for all the possible operating conditions has been highlighted, along with the seven attributes of a flexibility product to be traded in the market. Moreover, two different test setups were utilized to investigate how the total activation time would change in case of local or remote control. This provided crucially valuable information when assessing the capabilities on the provision of time-critical power system services from aggregated small distributed energy resources. Furthermore, a detailed model of the V2G CHAdeMO charger has been designed and implemented in Simulink platform within the Matlab MathWorks 2018b software environment. The tested attributes of the flexibility product have been implemented, and a comprehensive simulation study showed the accuracy of the model. The proposed model is an example of a direct utilization of the outcome of hardware characterization tests in terms of designing realistic models that can be implemented for a number of subsequent simulation activities.
To conclude, in order to make the EV flexibility product a tradable asset, relevant regulations and requirements should be respected, and standardized tests for evaluating charger’s and EV’s performance as well as realistic models for assessing the impacts on the power systems should be established. In fact, a deep knowledge of the controllable hardware is needed to categorize the supplied EV flexibility product. On the one hand, insights into the charger’s efficiency for different set-points allow the calculation of the accumulated losses during a V2G session, which is a crucial information for the estimation of the actual state of charge of the controlled EV. On the other hand, the proposed investigation of the identified characteristics of the V2G unit provides valuable information for grid operators when performing grid regulation studies, assessing the impacts of FCR provided by such units with realistic models to emulate their behavior. Furthermore, it can be useful also when defining new requirements for grid connected V2G technologies, provided an indicative knowledge of the employed technology’s capabilities. Ultimately, the proposed investigation results provide insights also for the EV fleet operators in terms of actions needed for smart fleet management aimed at respecting the grid code restrictions.

Author Contributions

Data curation, A.Z., A.T.; Investigation, A.Z., A.T., P.B.A. and M.M.; Methodology, A.Z., P.B.A. and M.M.; Writing— original draft, A.Z.; Writing—review and editing, A.T., P.B.A. and M.M.

Funding

The authors would like to acknowledge the support of the EUDP project ACES—Across Continent Electric Vehicle Services (grant EUDP17-I-12499, website: http://aces-bornholm.eu) and the Danish research Parker project under ForskEL contract no. 2016-1-12410, http://parker-project.com.

Conflicts of Interest

The authors declare no conflict of interest.

References

  1. Knezović, K.; Martinenas, S.; Andersen, P.B.; Zecchino, A.; Marinelli, M. Enhancing the Role of Electric Vehicles in the Power Grid: Field Validation of Multiple Ancillary Services. IEEE Trans. Transp. Electrif. 2016, 3, 201–209. [Google Scholar] [CrossRef]
  2. Hu, J.; Morais, H.; Sousa, T.; Lind, M. Electric vehicle fleet management in smart grids: A review of services, optimization and control aspects. Renew. Sustain. Energy Rev. 2016, 56, 1207–1226. [Google Scholar] [CrossRef]
  3. Zecchino, A.; Knezović, K.; Marinelli, M. Identification of Conflicts between Transmission and Distribution System Operators when Acquiring Ancillary Services from Electric Vehicles. In Proceedings of the 7th IEEE PES Innovative Smart Grid Technologies Europe (ISGT Europe), Torino, Italy, 26–29 September 2017; pp. 1–6. [Google Scholar]
  4. Leemput, N.; Geth, F.; Juan Van, R.; Jeroen, B.; Johan, D.; Marinelli, M. Reactive power support in residential LV distribution grids through electric vehicle charging. Sustain. Energy Grids Netw. 2015, 3, 24–35. [Google Scholar] [CrossRef]
  5. Zecchino, A.; Marinelli, M. Analytical assessment of voltage support via reactive power from new electric vehicles supply equipment in radial distribution grids with voltage-dependent loads. Int. J. Electr. Power Energy Syst. 2018, 97, 17–27. [Google Scholar] [CrossRef]
  6. Arias, M.N.B.; Hashemi, S.; Andersen, P.B.; Træholt, C.; Romero, R. V2G Enabled EVs Providing Frequency Containment Reserves: Field Results. In Proceedings of the 2018 IEEE International Conference on Industrial Technology (ICIT 2018), Lyon, France, 20–22 February 2018; pp. 1–6. [Google Scholar]
  7. González Vayá, M.; Andersson, G. Combined Smart-Charging and Frequency Regulation for Fleets of Plug-in Electric Vehicles. In Proceedings of the 2013 IEEE Power & Energy Society General Meeting, Vancouver, BC, Canada, 21–25 July 2013; pp. 1–5. [Google Scholar]
  8. Bergaentzlé, C.; Boscán, L.; Skytte, K.; Rosenlund Soysal, E.; Olsen, O.J. Flex4RES - Framework Conditions for Flexibility in the Electricity Sector; Nordic Energy Research: Oslo, Norway, 2016. [Google Scholar]
  9. Borne, O.; Korte, K.; Perez, Y.; Petit, M.; Purkus, A. Barriers to entry in frequency-regulation services markets: Review of the status quo and options for improvements. Renew. Sustain. Energy Rev. 2018, 81, 605–614. [Google Scholar] [CrossRef]
  10. Kester, J.; Noel, L.; Zarazua de Rubens, G.; Sovacool, B.K. Promoting Vehicle to Grid (V2G) in the Nordic region: Expert advice on policy mechanisms for accelerated diffusion. Energy Policy 2018, 116, 422–432. [Google Scholar] [CrossRef]
  11. MacDonald, J.; Cappers, P.; Callaway, D.; Kiliccote, S. Demand response providing ancillary services—A Comparison Of Opportunities And Challenges In The US Wholesale Markets. In Proceedings of the Grid-Interop Forum 2012, Irving, TX, USA, 3–6 December 2012. [Google Scholar]
  12. SEDC Smart Energy Demand Coalition. Explicit Demand Response in Europe: Mapping the Markets 2017; SEDC Smart Energy Demand Coalition, 2016. [Google Scholar]
  13. Arentsen, M.G.; Juhler-Verdoner, H.; Møller Jørgensen, J.; Stougaards Kiil, U.; Holst, M. Market models for aggregators—Activation of flexibility. 2017. Available online: https://en.energinet.dk/-/media/Energinet/Publikationer-TLU/Markedsmodel/Market-models-for-aggregators.pdf?la=en (accessed on 23 April 2019).
  14. Energinet.dk. Danish Technical Standard: Ancillary Services to Be Delivered in Denmark—Tender Conditions. 2017. Available online: https://en.energinet.dk/-/media/Energinet/El-RGD/Dokumenter/Ancillary-services-to-be-delivered-in-Denmark.pdf (accessed on 23 April 2019).
  15. Zecchino, A.; Prostejovsky, A.M.; Charalampos Ziras, C.; Marinelli, M. Large-scale provision of frequency control via V2G: The Bornholm power system case. Electr. Power Syst. Res. 2019, 170, 25–34. [Google Scholar] [CrossRef]
  16. Moghadam, M.; Zhang, R.; Ma, R. Distributed Frequency Control via Randomized Response of Electric Vehicles in Power Grid. IEEE Trans. Sustain. Energy 2016, 7, 312–324. [Google Scholar] [CrossRef]
  17. Zhao, Y.; Noori, M.; Tatari, O. Vehicle to Grid regulation services of electric delivery trucks: Economic and environmental benefit analysis. Appl. Energy 2016, 170, 161–175. [Google Scholar] [CrossRef]
  18. ACES Project—Across Continents Electric Vehicle Services. 2017. Available online: http://aces-bornholm.eu (accessed on 23 April 2019).
  19. The Parker Project. 2016. Available online: http://parker-project.com (accessed on 23 April 2019).
  20. INVENT Project—Intelligent Electric Vehicle Integration. 2017. Available online: https://rmp.ucsd.edu/_files/sei/INVENT-Flyer.pdf (accessed on 23 April 2019).
  21. GridMotion Project—Reducing Electric Vehicle Usage Cost Thanks to Smartcharging Process. 2017. Available online: https://www.enel.com/content/dam/enel-common/press/en/1667129-2_PDF-1.pdf (accessed on 23 April 2019).
  22. Zecchino, A.; Thingvad, A.; Andersen, P.B.; Marinelli, M. Suitability of Commercial V2G CHAdeMO Chargers for Grid Services. In Proceedings of the EVS 31 & EVTeC 2018 The 31st International Electric Vehicles Symposium and Exhibition & International Electric Vehicle Technology Conference 2018, Kobe, Japan, 30 September–3 October 2018; pp. 1–7. [Google Scholar]
  23. NISSAN. Nissan, Enel and Nuvve Operate World’s First Fully Commercial Vehicle-to-Grid Hub in Denmark. 2016. Available online: https://denmark.nissannews.com/da-DK/releases/release-149191-nissan-enel-and-nuvve-operate-world-s-first-fully-commercial-vehicle-to-grid-hub-in-denmark (accessed on 23 April 2019).
  24. DEIF MIC-2. Available online: https://www.deif.com/products/mic2 (accessed on 23 April 2019).
  25. Thingvad, A.; Ziras, C.; Hu, J.; Marinelli, M. Assessing the Energy Content of System Frequency and Electric Vehicle Charging Efficiency for Ancillary Service Provision. In Proceedings of the 52nd International Universities’ Power Engineering Conference, Crete, Greece, 28–31 August 2017; pp. 1–6. [Google Scholar]
  26. Danish Technical Regulation 3.3.1 for Battery Plants. 2017. Available online: https://en.energinet.dk/Electricity/Rules-and-Regulations/Regulations-for-grid-connection (accessed on 23 April 2019).
  27. Ziras, C.; Zecchino, A.; Marinelli, M. Response Accuracy and Tracking Errors with Decentralized Control of Commercial V2G Chargers. In Proceedings of the 20th Power Systems Computation Conference (PSCC 2018), Dublin, Ireland, 11–15 June 2018; pp. 1–7. [Google Scholar]
Figure 1. Attributes (iii)–(vii) for an EV flexibility product.
Wevj 10 00021 g001
Figure 2. Test configuration for the local and the remote control tests.
Wevj 10 00021 g002
Figure 3. Active power test patterns: granular charging set-points modulation from 0 to −10 kW set-point with steps of 400 W utilized for the local control (a), and one cycle of the remote control test pattern (b).
Wevj 10 00021 g003
Figure 4. V2G charger efficiency calculation (a), and efficiency map for charging/discharging DC set-points from −10 kW to +10 kW with steps of 400 W (b).
Wevj 10 00021 g004
Figure 5. Analyses of the activation time for the local control test: time shift between the requested and the provided power (a), and correlation between requested and provided power (b). The correlation shows a maximum for a delay of 4 s, which can then be considered as the actual hardware response time.
Wevj 10 00021 g005
Figure 6. One cycle of the performed remote performance assessment test.
Wevj 10 00021 g006
Figure 7. Distribution of the observed granularities in terms of absolute and percentage observations. For the boxplots, the blue boxes indicate 50% of the observations, whereas the median is in red. Upper and lower quartiles (25% of the data) are located within the vertical black lines.
Wevj 10 00021 g007
Figure 8. The correlation between requested and provided power for remote control shows a maximum for a delay of 7 s, which can then be considered the total activation time when the tested V2G equipment is controlled via the centralized remote control setup.
Wevj 10 00021 g008
Figure 9. For each cycle of the performed performance assessment test, four events up and four events down are performed to calculate the ramping rate capability. For the step-wise portion, four cycles have been repeated.
Wevj 10 00021 g009
Figure 10. For both accuracy and precision the calculation is done during the constant set-point levels of the step-wise portion of the tested cycles. This means at zero set-point at the maximum charging (−8.5 kW) and discharging power (+8.5 kW).
Wevj 10 00021 g010
Figure 11. EV charger model.
Wevj 10 00021 g011
Figure 12. One cycle of the tested and simulated performance assessment test.
Wevj 10 00021 g012
Figure 13. Analyses of the error between the simulated results and the real remote control test results: calculated error for 1 cycle in [kW] and in percentage with reference to the 10 kW size of the charger (a), and statistical results for the entire test pattern (b).
Wevj 10 00021 g013
Table 1. Measured ramping rates up/down.
Cycle 1Cycle 2Cycle 3Cycle 4
up 18.84 kW in 3 s8.84 kW in 4 s8.82 kW in 3 s8.84 kW in 4 s
up 29.03 kW in 4 s9.04 kW in 4 s9.03 kW in 4 s9.04 kW in 5 s
up 317.87 kW in 6 s17.85 kW in 6 s17.88 kW in 4 s17.86 kW in 6 s
up 48.84 kW in 4 s8.84 kW in 1 s8.83 kW in 4 s8.84 kW in 3 s
Ramp-up AVG3.35 kW/s
down 18.99 kW in 3 s8.79 kW in 4 s8.79 kW in 4 s8.99 kW in 3 s
down 29.33 kW in 3 s9.16 kW in 1 s9.17 kW in 1 s9.16 kW in 4 s
down 38.79 kW in 4 s8.98 kW in 3 s8.97 kW in 4 s8.99 kW in 4 s
down 418.12 kW in 6 s18.14 kW in 7 s18.13 kW in 7 s18.14 kW in7 s
Ramp-down AVG3.31 kW/s
Table 2. Evaluation test results.
AttributeShort DescriptionUnitTarget for Primary
Reserve [14,26]
Test Result
(i) DirectionSupport of bi-
directional power flow
+/−/±±± i.e., V2G capable
(ii) Set-point linearity
Supported set-point
throughout the
power range
[W]Linear at 1%
<400 W (4%)
(1 A @ 400V DC)
(iii) Starting time and max. activation time
Time between
set-point request
and change in
active power
[s]<15 s
Local control: 4 s
Remote control: 7 s
(iv) Ramp-up timeSupported rate
of change in
power (increase)
[kW/s]For the aggregate:
10–300 kW/s

AVG = 3.35 kW/s
Max = 8.84 kW/s
min = 1.81 kW/s
(v) Ramp-down timeSupported rate
of change in
power (increase)
[kW/s]For the aggregate:
10–300 kW/s

AVG = 3.31 kW/s
Max = 9.17 kW/s
min = 1.98 kW/s
(vi) AccuracyDifference between
required and
delivered response
[W]±5% of set-point
&
±0.5% of rated pow.

Negative set-point: 740 W
(+8.7% of set-point)
(+7.4% of rated pow.)
Positive set-point: −440 W
(-5.2% of set-point)
(−4.4% of rated pow.)
420 W @ zero set-point
(4.2% of rated pow.)
(vii) PrecisionVariation of the
delivered response
[W]NA
≈50 W
(0.6% of set-point)
(0.5% of rated pow.)
6 W @ zero set-point
(0.06% of rated pow.)

