3.1. Selection of Evaluation Indicators
To comprehensively and accurately evaluate the performance of the proposed DNN-based network traffic analysis model, this paper adopts a standard evaluation framework based on the confusion matrix [
18]. This framework encompasses several critical evaluation metrics, including accuracy, recall, and the F1-score, which play a vital role in assessing the efficacy of traffic analysis models. The specific definitions and calculation formulas for these metrics are detailed in
Table 2.
TP (True Positive) is the number of samples that were actually positive and were correctly predicted to be positive by the model.
TN (True Negative) is the number of examples that are actually negative and are correctly predicted as negative by the model.
FP (False Positive) stands for false positives. This is the number of examples that were actually negative but were incorrectly predicted to be positive by the model.
FN (False Negative) stands for false negative, which is the number of examples that were actually positive but were incorrectly predicted to be negative by the model.
Accuracy refers to the proportion of the number of samples correctly predicted by the model to the total number of samples, and it is one of the most intuitive performance indicators, reflecting the accuracy of the model in classifying the overall sample. It is calculated as follows:
Recall, also known as the true-positive rate (TPR) or sensitivity, is the proportion of examples that are actually positive and are correctly predicted as positive by the model; it reflects the ability of the model to capture positive examples. In network traffic analysis, recall is particularly important for identifying abnormal traffic because missing abnormal traffic data may lead to serious security problems. If the model correctly identifies 80 out of 100 abnormal traffic samples, the recall is 80 ÷ 100 × 100% = 80%. It is calculated as follows:
The F1-score is the harmonic mean of precision and recall, which takes into account the balance between precision and recall. Precision refers to the proportion of samples predicted as the positive class that are actually positive, and it measures the accuracy of the prediction result, which is calculated by the following formula:
The F1 value ranges from 0 to 1, with 1 indicating perfect precision and recall, and a higher F1 value indicates better overall performance of the model. For example, when the precision is 0.8 and the recall is 0.7, the F1 value is approximately 0.74. It is calculated as follows:
Here, we introduce the false-positive rate (FPR) to measure the fraction of normal connection records that are incorrectly labeled as attacks. A low false-positive rate indicates that the model has few false positives and is defined as follows:
In network traffic analysis, these evaluation metrics complement each other and can comprehensively evaluate the performance of the model from different perspectives. Through the comprehensive use of these evaluation indicators, the effectiveness and reliability of DNN-based network traffic analysis models in practical applications can be more accurately judged.
3.2. Experimental Setup and Baseline Models
To validate the stability of the proposed model in terms of lightweight design and robustness, comparative experiments were conducted against three traditional baseline models. These baselines encompass both traditional machine learning algorithms and mainstream deep learning approaches.
Random Forest (RF) [
13]: Representing traditional machine learning algorithms, RF is widely applied in the field of intrusion detection due to its strong interpretability and high accuracy. In the comparative experiments, the number of estimators (decision trees) was set to 100, and Gini impurity was utilized as the criterion for splitting nodes.
One-Dimensional Convolutional Neural Network (1D-CNN) [
19]: This model represents the state-of-the-art deep learning methodology currently employed in traffic classification. CNNs are capable of automatically extracting local spatial features from traffic sequences through convolution kernels. For the comparative experiments, the 1D-CNN architecture comprises two convolutional layers (with 32 and 64 filters, respectively), coupled with a max-pooling layer and a fully connected layer. The objective of this comparison is to ensure that the proposed DNN can achieve equivalent or superior detection accuracy compared to the 1D-CNN in the training results.
Baseline DNN [
20]: This model possesses a depth similar to the proposed novel DNN (4 layers) but features a wider network architecture, with each hidden layer containing 64 neurons. It utilizes the conventional ReLU [
16] activation function alongside batch normalization, and it distinctly lacks both residual connections and attention mechanisms. This standard deep fully connected network serves as a baseline to explicitly validate the effectiveness of the architectural improvements introduced in our proposed model.
The experimental environment was constructed using the TensorFlow 2.6 framework. The hardware platform was configured with an Intel Core i7 CPU and 16 GB of RAM, and notably, GPU acceleration was disabled during the evaluation. This setup strictly simulates resource-constrained environments. The evaluation metrics encompass accuracy, precision, recall, and the F1-score. Crucially, inference time and parameter count were also evaluated, as these metrics are paramount for real-world deployment in IoT scenarios.
3.3. Experimental Data Analysis Performance Comparison Analysis
To comprehensively evaluate the performance of the proposed model, extensive tests were conducted on the CIC-IoT-2023 dataset.
Table 3 presents the detailed performance metrics of the various models evaluated in the multi-class classification task. Furthermore,
Table 4 illustrates the comparative performance data obtained when evaluating the models using the CICIDS2017 dataset.
Based on the empirical data presented in the two tables above, the following analytical conclusions can be drawn:
Superiority over Baseline DNN: The proposed model consistently outperforms the Baseline DNN across all four primary performance metrics: accuracy, precision, recall, and the F1-score. Notably, the detection accuracy exhibits a significant improvement of approximately 28.01%. This enhancement demonstrates that a simple stacking of fully connected layers, as seen in the Baseline DNN, is highly susceptible to information loss when processing high-dimensional traffic features. In contrast, the proposed model effectively mitigates the vanishing gradient problem by incorporating residual connections and a channel attention mechanism. These architectural innovations enhance the model’s ability to capture critical attack features while simultaneously demonstrating that the refined architecture significantly improves overall modeling efficiency.
Comparison with 1D-CNN: When compared to the 1D-CNN, the proposed model achieves a detection accuracy that is essentially on par with the Baseline CNN, showing no distinct disadvantage in precision. However, a critical advantage emerges when analyzing the model complexity: the parameter count of the proposed DNN is only approximately 5% of that required by the 1D-CNN. Achieving comparable performance with such a drastically reduced parameter footprint confirms that the “Narrow Bottleneck + Attention” design is exceptionally efficient for resource-constrained traffic analysis tasks.
Comparison with Random Forest (RF): While the random forest algorithm achieves the highest overall accuracy, its practical utility in IoT environments is severely limited by its substantial model size, as detailed in the subsequent analysis of
Table 5. The proposed DNN maintains a high level of accuracy that is only marginally lower than RF, yet it boasts an extremely compact file size of only 12 KB. Consequently, in real-world IoT deployment scenarios where memory and storage are at a premium, our proposed model represents a superior and more viable alternative.
For practical deployment in IoT and network environments, the proposed model must not only provide precise detection but also demonstrate superior computational efficiency. The objective is to minimize computational overhead while maintaining high detection performance, thereby achieving an optimal trade-off between accuracy and efficiency.
To evaluate the lightweight nature of the architecture,
Table 5 provides a comprehensive comparison of the spatial complexity (represented by parameter count) and temporal complexity (represented by inference latency) across the evaluated models.
The parameter count for the Random Forest (RF) model is denoted as "N/A" (Not Applicable) because RF is an ensemble of decision trees and does not optimize a fixed set of trainable weights and biases like neural networks. Instead, its complexity is determined by hyperparameters such as the number of trees and their maximum depth.
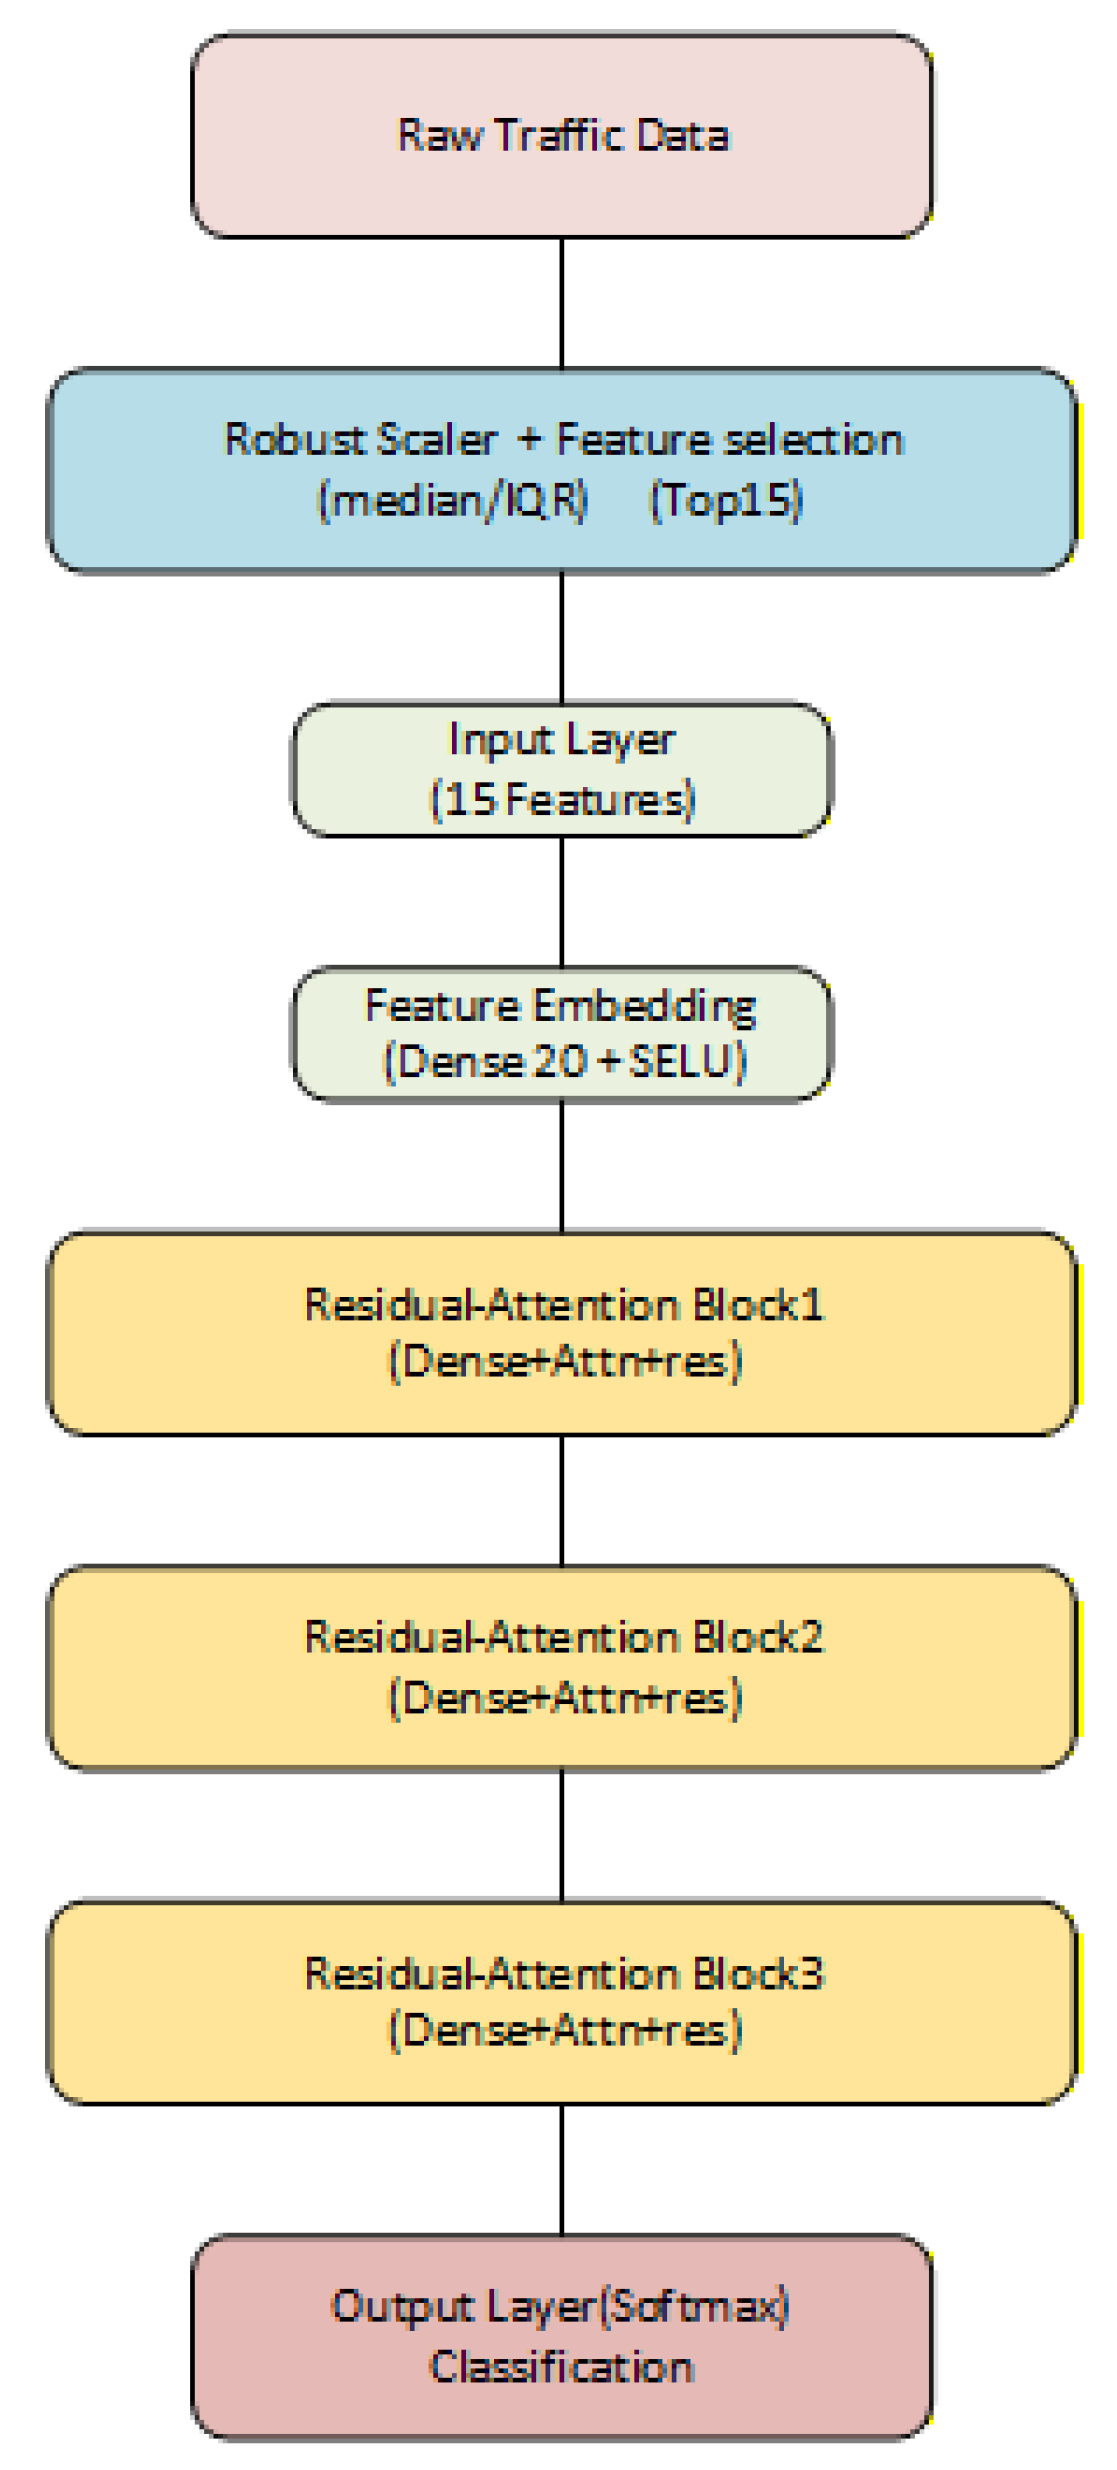
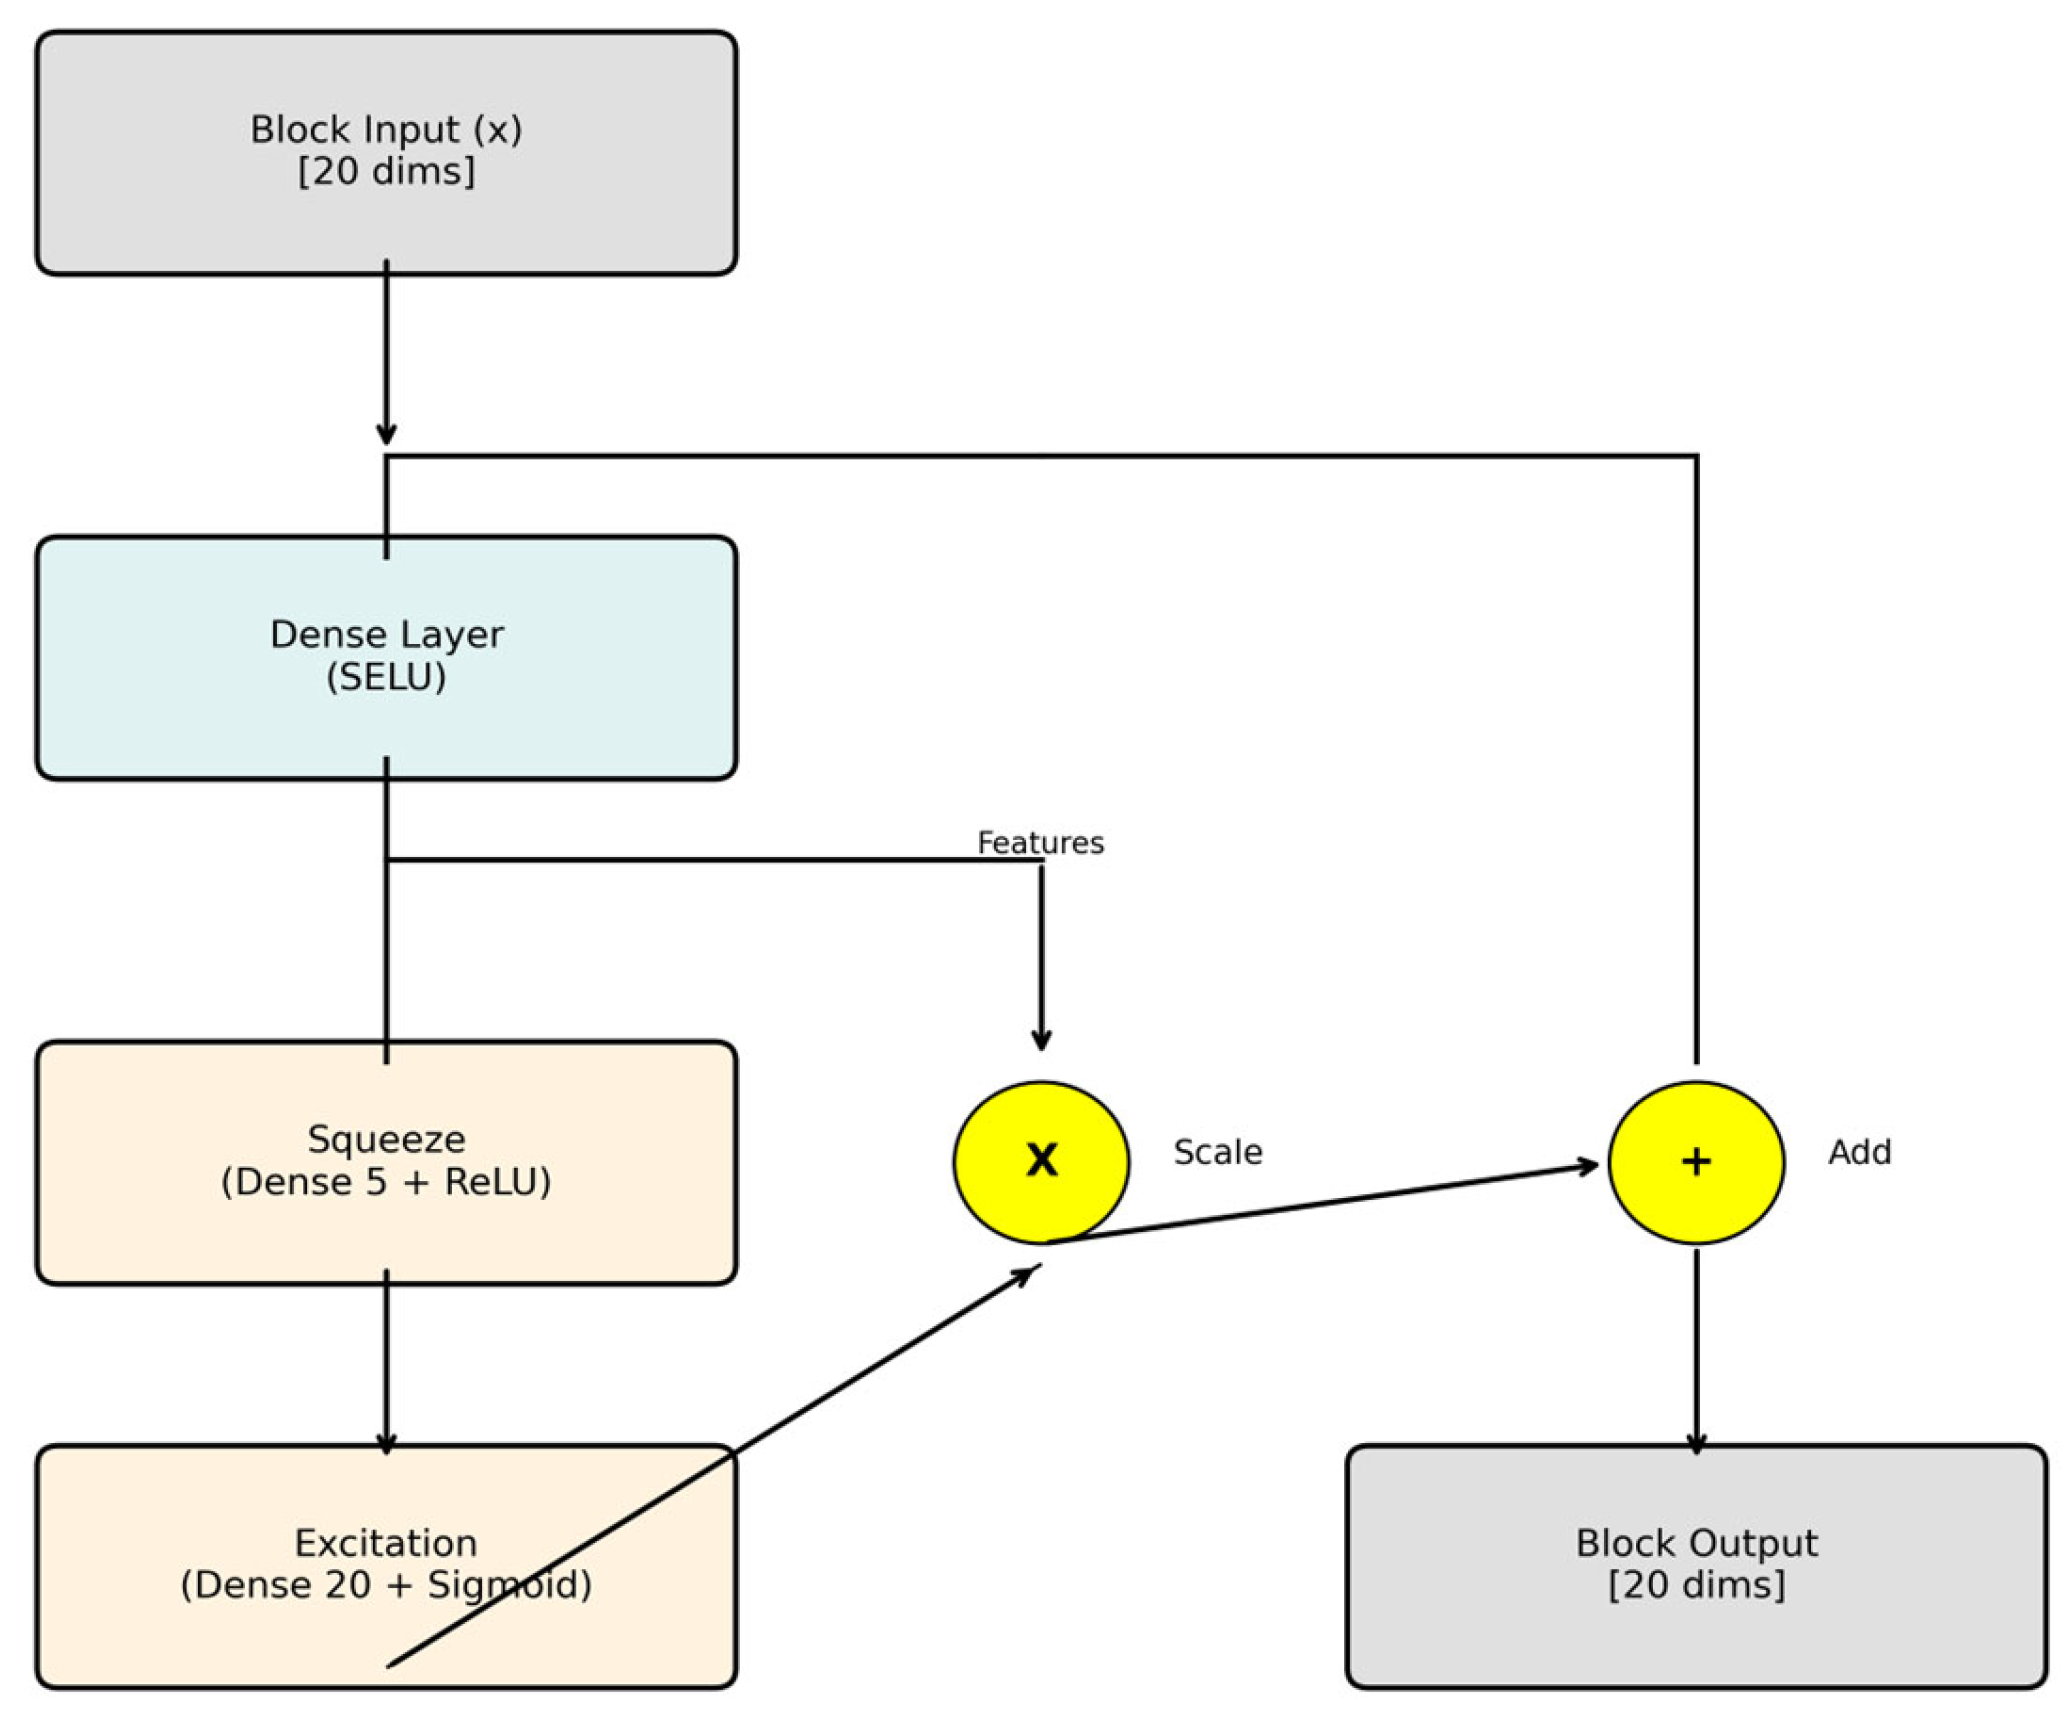
The parameter count of DNN is approximately 2339, which represents a reduction of about 91% compared to 1D-CNN and 77% compared to the Baseline DNN. This efficiency is primarily attributed to our bottleneck design, which strictly limits the hidden layers to 20 neurons. Such a minimal model size (only 56.91 KB) allows it to be easily loaded into the on-chip cache (L1 Cache) of a Raspberry Pi or even a microcontroller (MCU), significantly reducing memory access latency. In contrast, while random forest (RF) offers relatively fast inference, its model files typically reach several MBs—depending on the depth and number of trees—which is often unacceptable for memory-constrained IoT sensor nodes.
DNN achieves an inference speed of 30 μs/sample, which is 15% faster than 1D-CNN.
Contribution of SELU: Although the Baseline DNN has a simple structure, it requires additional computational steps during inference due to the inclusion of batch normalization (BN) layers. In contrast, DNN utilizes the SELU activation function to achieve self-normalization, effectively eliminating the need for BN layers and further shortening the computational path.
Comparison with RF: While random forest (RF) demonstrates competitive speed on CPUs, DNN exhibits superior throughput and possesses greater potential for hardware acceleration.
Synthesizing the results from
Table 3 and
Table 4, it can be inferred that DNN does not blindly pursue the highest possible accuracy. Instead, it minimizes computational costs while maintaining state-of-the-art (SOTA) detection precision (>99%). This optimal trade-off between accuracy and efficiency proves that DNN is the most suitable intrusion detection system (IDS) solution for deployment on IoT edge nodes in the future Internet.
The empirical results further validate our architectural choice. As demonstrated, the proposed DNN achieves an F1-score comparable to or even better than the computationally heavy 1D-CNN baseline, but with only a fraction of its parameter count and inference latency. This confirms our theoretical rationale: for pre-aggregated tabular traffic features, a well-optimized, narrow DNN combined with attention mechanisms is structurally superior to spatially or sequentially biased models like CNNs and LSTMs, achieving the ultimate trade-off between precision and computational efficiency.
3.4. Ablation Study
To validate the effectiveness of the individual components within the DNN framework—namely, robust preprocessing, the SELU activation function, residual connections, the channel attention mechanism, and the cosine annealing strategy—we designed a progressive ablation study. To guarantee a strictly fair comparison, all model variants were trained utilizing an identical set of input features and the exact same hyperparameter configurations. Commencing with a Baseline DNN, each architectural component was incrementally incorporated. The specific configurations of all model variants are detailed in
Table 6.
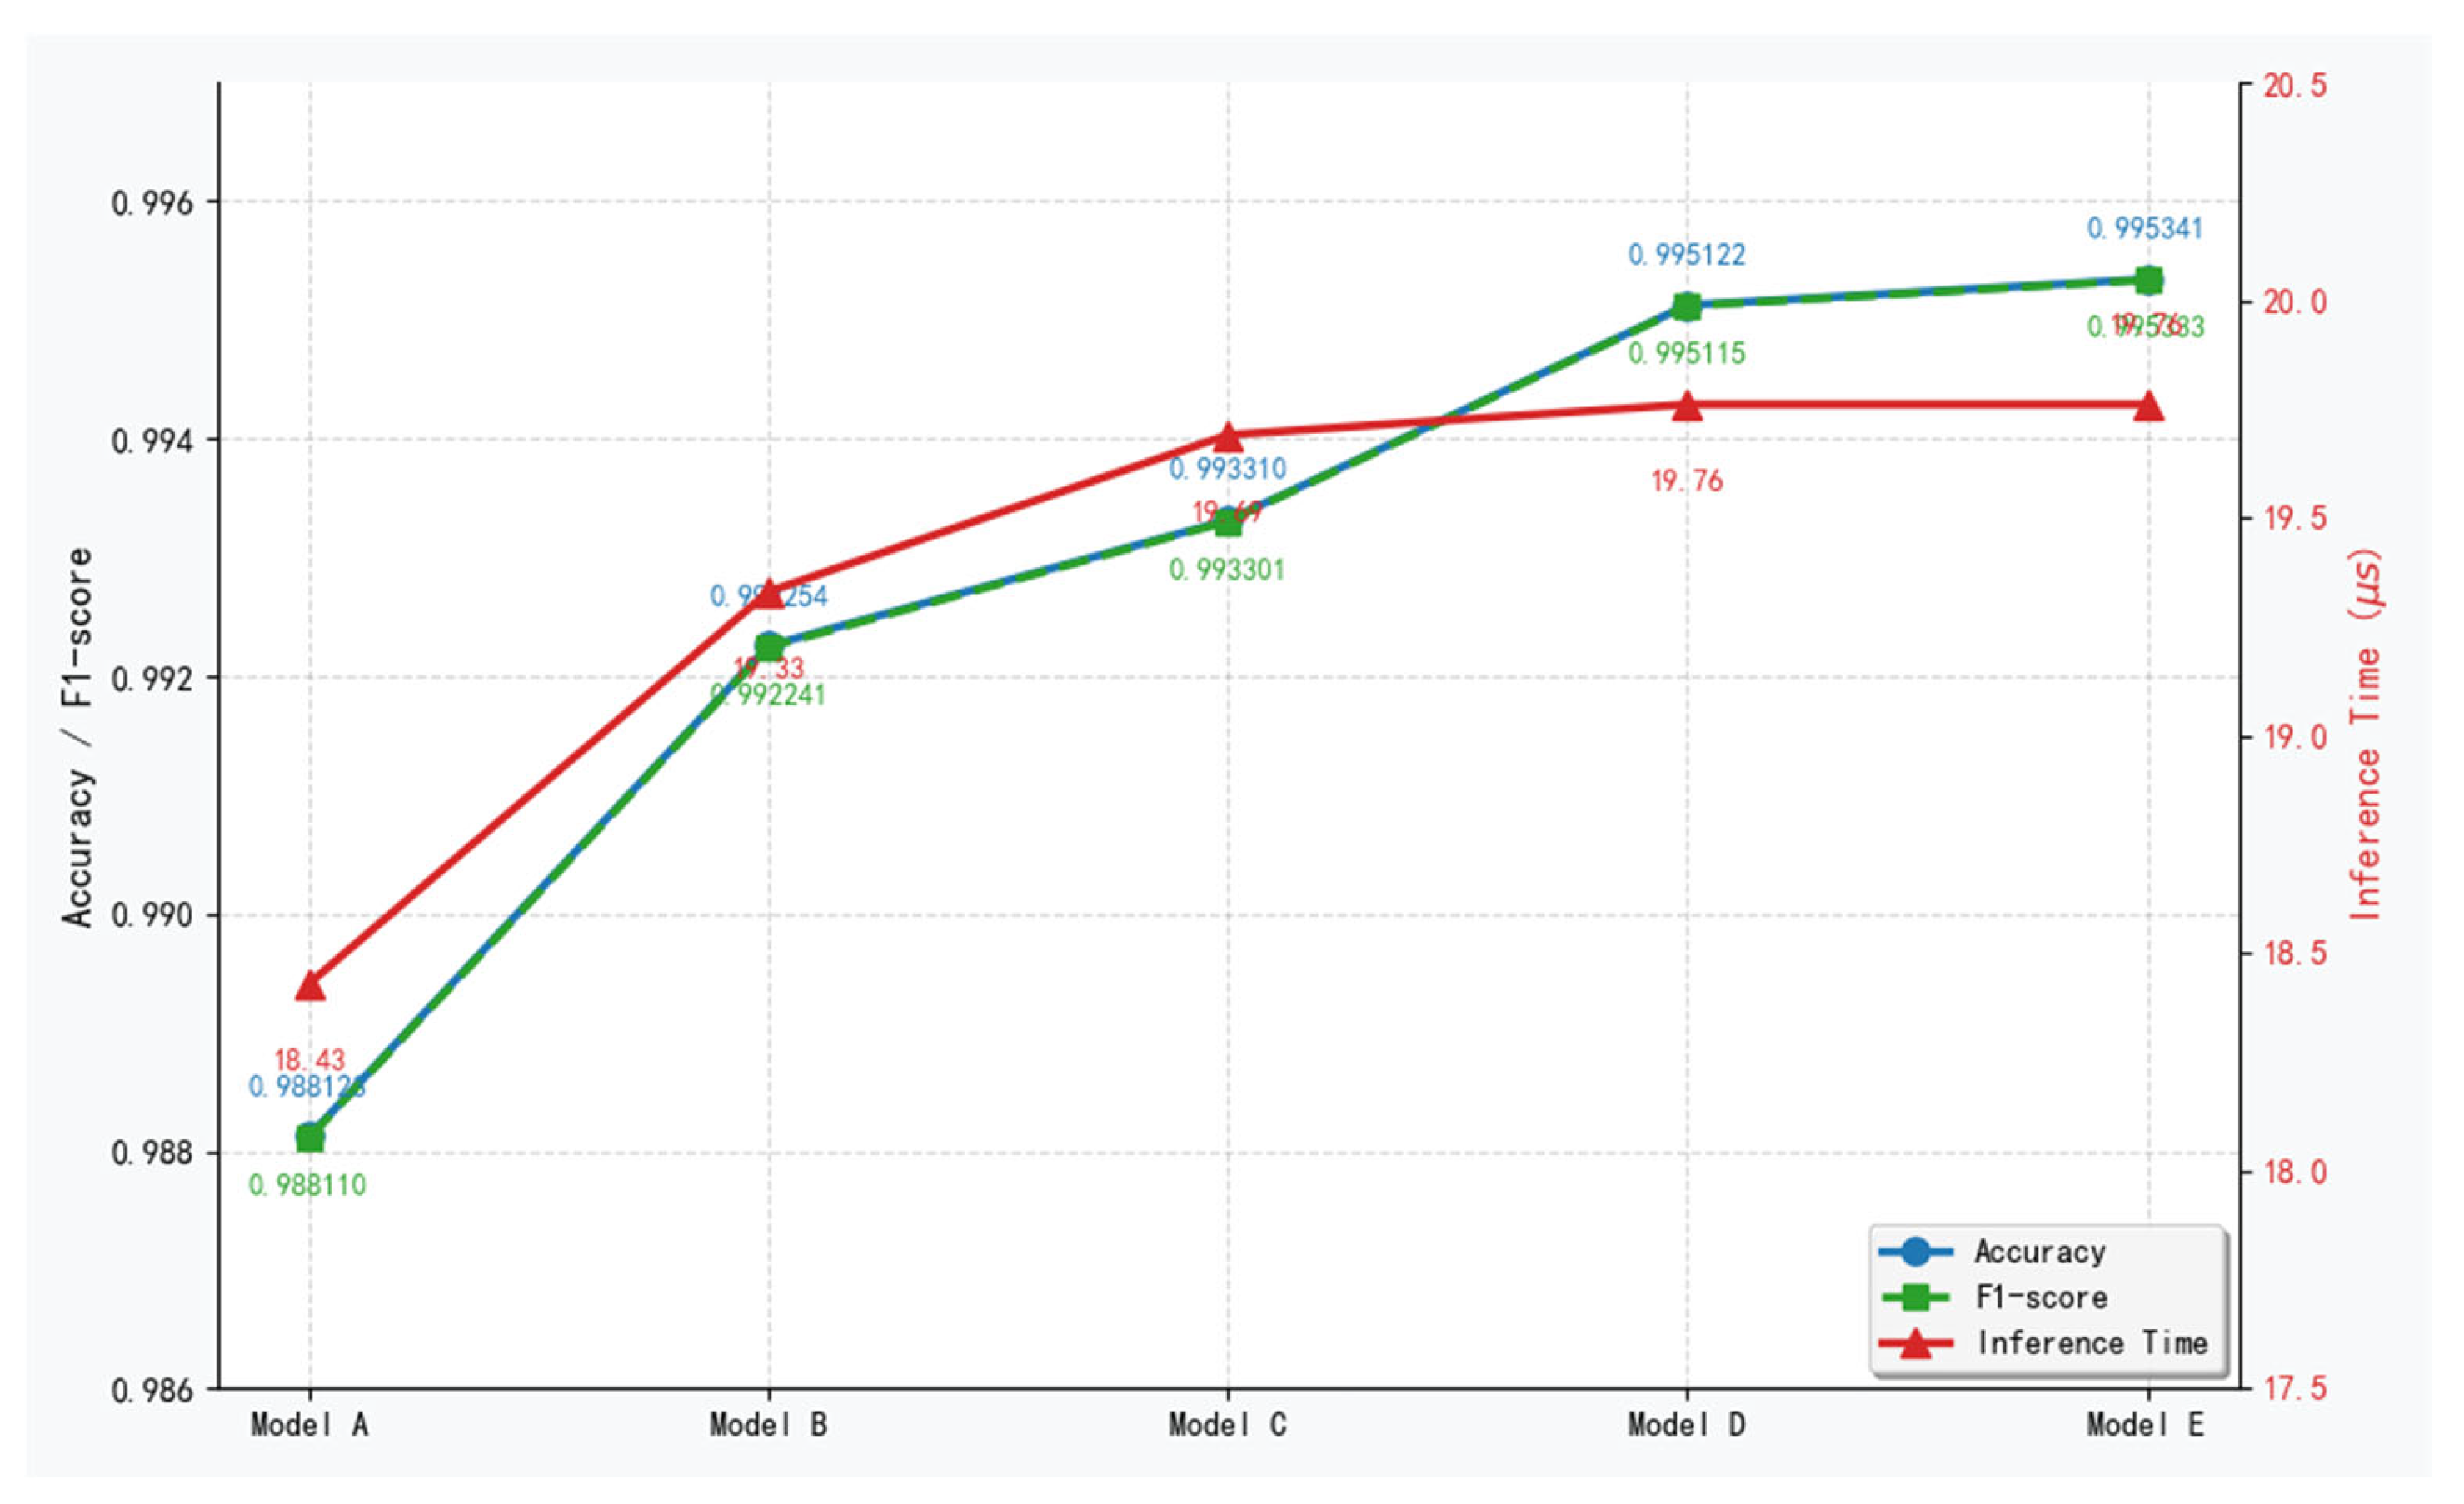
By systematically comparing three primary evaluation metrics—specifically, accuracy, F1-score, and inference time—across the five model variants, we quantitatively analyze the incremental performance gains achieved at each progressive stage of the architectural design. The detailed experimental results are delineated in
Table 7 and graphically illustrated in
Figure 3.
Based on the progressive performance gains observed in the ablation experiments, the specific impact and theoretical contribution of each architectural component are analyzed as follows:
Impact of Robust Preprocessing: As demonstrated by the comparison between Model A and Model B in
Table 7, replacing the standard Z-score normalization with the median and IQR-based Robust Scaler yields a 0.4% improvement in the F1-score. In IoT network traffic, DDoS attacks frequently generate extreme statistical outliers. Traditional Z-score scaling is highly susceptible to this mean shifting, which consequently compresses the majority of benign traffic features into an exceedingly narrow interval. Conversely, the Robust Scaler effectively preserves the underlying data distribution, enabling the model to delineate clearer classification boundaries.
Impact of the SELU Activation Function: The results from Model C indicate that within narrow hidden layers comprising merely 20 neurons, SELU significantly outperforms traditional ReLU. Given the “bottleneck” design of our network architecture, ReLU is prone to the “dying ReLU” (dead neurons) problem in negative regions, leading to the irreversible loss of already scarce feature information. The self-normalizing property of SELU not only prevents vanishing gradients but also ensures that all neurons remain active. Furthermore, the utilization of SELU eliminates the necessity for batch normalization (BN) layers. This maintains high detection precision while exerting virtually no negative impact on inference latency (and implicitly reduces memory access overhead).
Impact of Channel Attention Mechanism: Model E (the finalized DNN) achieves optimal performance through the integration of the channel attention mechanism. Although incorporating this attention computation module incurs a marginal inference time overhead of 1.33 μs, it delivers a substantial 0.7% enhancement in the F1-score. This substantiates that within a strictly constrained feature space (20 dimensions), explicitly weighting (recalibrating) feature channels is exceptionally crucial. It empowers the model to adaptively focus on the key fingerprint features of malicious attack traffic while suppressing irrelevant noise.
Impact of Cosine Annealing Optimization: Compared to a fixed learning rate (Fixed LR) strategy, Model E, which employs Cosine Annealing Warm Restarts, demonstrates a significantly faster convergence rate. During the initial training phases, the loss function descends much more rapidly. In the later stages, the periodic learning rate resets successfully, enabling the optimizer to escape sharp local optima, ultimately converging to a flatter and lower overall loss level. This confirms that the DNN framework is not only more accurate in anomaly detection but also highly efficient in its training process.
3.5. Performance Under Adversarial Evasion Attacks
To empirically validate the practical security contribution of the proposed framework, particularly its robustness against statistical evasion attacks, we conducted an adversarial noise injection experiment. In advanced persistent threats (APTs), attackers often inject extreme outlier packets (burst noise) to distort flow-level statistics and evade IDS detection.
We simulated this evasion tactic by randomly injecting extreme multiplier noise (scaling specific statistical features like packet length variance and inter-arrival time by a factor of 50) into 5%, 10%, and 20% of the malicious test samples. We compared the performance degradation of a standard DNN model (using standard Z-score normalization) against our proposed DNN framework (utilizing Robust Scaler based on median and IQR).
The specific values are shown in
Table 8.
The experimental results reveal critical insights into model security:
The Vulnerability of Traditional Machine Learning (RF): While the random forest (RF) model achieves a deceptively high initial F1-score of 0.9903 on clean data, it demonstrates severe vulnerability to adversarial noise. Its performance precipitously drops to 0.6289 under 20% evasion noise. This indicates that the 99% accuracy is largely a result of overfitting to clean datasets; its hard decision boundaries are extremely brittle and can be easily bypassed by attackers slightly modifying traffic patterns.
The Fragility of Standard Deep Learning (CNN & Baseline DNN): Conventional deep learning models also exhibit significant security flaws. The Baseline CNN drops from 0.8954 to 0.5514, and the Baseline DNN collapses completely to 0.4135. Standard architectures lack built-in mechanisms to filter out malicious perturbations, allowing noise to propagate and amplify through the network layers, ultimately destroying the classification logic.
The Robustness of the Proposed DNN: In stark contrast, the proposed DNN demonstrates exceptional adversarial robustness. It starts at a realistic, non-overfitted baseline of 0.9030 and maintains a high F1-score of 0.8293 even under severe 20% evasion noise. This graceful degradation is structurally guaranteed by the proposed components: the Robust Scaler effectively neutralizes extreme adversarial outliers using median and interquartile ranges, while the network design prevents the internal amplification of adversarial perturbations.
Consequently, the proposed RRA-DNN proves to be not only highly accurate but also structurally secure, making it highly reliable for deployment in hostile, real-world network environments where traffic obfuscation and evasion attacks are frequent.