Article

FLAME-VQA: A Fuzzy Logic-Based Model for High Frame Rate Video Quality Assessment

Faculty of Transport and Traffic Sciences, University of Zagreb, 10000 Zagreb, Croatia
*
Author to whom correspondence should be addressed.
Future Internet 2023, 15(9), 295; https://doi.org/10.3390/fi15090295
Submission received: 14 August 2023 / Revised: 25 August 2023 / Accepted: 29 August 2023 / Published: 1 September 2023
(This article belongs to the Special Issue QoS in Wireless Sensor Network for IoT Applications)

Abstract

:
In the quest to optimize user experience, network, and service, providers continually seek to deliver high-quality content tailored to individual preferences. However, predicting user perception of quality remains a challenging task, given the subjective nature of human perception and the plethora of technical attributes that contribute to the overall viewing experience. Thus, we introduce a Fuzzy Logic-bAsed ModEl for Video Quality Assessment (FLAME-VQA), leveraging the LIVE-YT-HFR database containing 480 video sequences and subjective ratings of their quality from 85 test subjects. The proposed model addresses the challenges of assessing user perception by capturing the intricacies of individual preferences and video attributes using fuzzy logic. It operates with four input parameters: video frame rate, compression rate, and spatio-temporal information. The Spearman Rank–Order Correlation Coefficient (SROCC) and Pearson Correlation Coefficient (PCC) show a high correlation between the output and the ground truth. For the training, test, and complete dataset, SROCC equals 0.8977, 0.8455, and 0.8961, respectively, while PCC equals 0.9096, 0.8632, and 0.9086, respectively. The model outperforms comparative models tested on the same dataset.

1. Introduction

1.1. Background and Motivation

In the past decades, video streaming services have experienced an unprecedented surge in popularity, becoming an integral part of both fixed and mobile networks. The ease of access to high-quality content and the proliferation of internet-connected devices have contributed to this exponential growth, transforming video consumption into a ubiquitous phenomenon [1]. Nowadays, video traffic constitutes a substantial share of total internet traffic worldwide. In Ericsson’s 2023 Mobility Report, video is identified as dominant content across all subscriber clusters, accounting for over 60% of total traffic in the sampled networks [2]. Moreover, the dynamic nature of video services has enabled them to evolve beyond mere entertainment platforms, emerging as a leading multimedia channel for product marketing across various industries, platforms, and user devices [3].
This rapid expansion of video streaming services has been accompanied by an increasing trend in the adoption of high video frame rates, aiming to enhance the overall viewing experience and immerse users in lifelike visual content. To this end, service providers strive to deliver content that aligns with users’ perceived quality expectations [1]. Consequently, the demand for accurate quality assessment tools has become paramount, as the user Quality of Experience (QoE) plays a pivotal role in shaping user satisfaction, loyalty, and retention. Understanding and predicting user QoE in the context of video services is critical, as suboptimal viewing experiences can lead to user churn [4,5].
In response to the escalating demand for precise QoE assessments, the research community has been engaged in the continuous pursuit of developing advanced models that can effectively anticipate user QoE in video streaming scenarios. The ITU-T P series of recommendations are at the forefront of this quest, often synthesizing the accumulated knowledge from this domain. Such video quality assessment (VQA) models not only serve as indispensable tools for optimizing video content delivery but also aid in efficient Quality of Service (QoS) management to meet user expectations [6]. Notwithstanding, predicting human perception of video quality is challenging due to the inherent complexity and subjectivity involved in the human visual and perceptual systems. Human perception is influenced by a myriad of factors, including individual preferences, cognitive biases, and contextual conditions, making it highly variable and difficult to model accurately. Additionally, different users may have diverse expectations and sensitivities, leading to variations in perceived quality [7,8]. Even subtle changes in video content, such as frame-rate adjustments or compression rates, can impact user perception [9,10].
Consequently, attaining a resilient and all-encompassing QoE assessment model necessitates a meticulous balance between objective technical metrics and subjective user evaluations, while considering the intricate nuances of human perception of video quality. The intricate interplay of these diverse influential factors compels researchers to formulate models that incorporate objective metrics alone, as well as those that synergistically blend objective metrics with subjective quality ratings.
The objective metrics, used for VQA modeling, are usually extracted directly from video sequences or traffic flow properties. These metrics typically encompass parameters such as bit rate, frame rate, resolution, encoding quality (i.e., compression), delay, jitter, packet loss, etc. The models that rely only on objective metrics use well-defined algorithms to compute the output, providing an automated and quantifiable approach to assessing video quality. To develop a model, a large dataset of video sequences with associated technical parameters is required and is used to train the model, where statistical and machine learning techniques are commonly employed. The main advantage of these types of models, relying solely on objective parameters, is their efficiency and ease of implementation, as they do not require human involvement in the assessment process. However, they may fall short in capturing the subjective and perceptual aspects of user experience, thus failing to meet the essence of the QoE concept [7].
On the other end of the spectrum, we have the models that incorporate subjective user ratings into their inference systems. These models take a different approach: human subjects are involved in rating the quality of video sequences based on their personal experiences and subjective judgments. These ratings are typically obtained through controlled experiments, where participants watch a set of video sequences and provide quality ratings, often using rating scales or scoring systems. The rating scales usually employ linguistic variables (e.g., bad, poor, fair, good, and excellent) to capture the user perception of the quality. To develop such models, a subjective testing dataset comprising video sequences and corresponding subjective ratings is collected. The model is trained to identify patterns and relationships between the video attributes and the ratings.
The resulting model, unlike its objective counterpart, directly addresses the human perceptual aspects of QoE. It can describe variations in user experiences that may not be reflected in objective metrics alone, making it more suitable for accurately assessing user QoE in complex and dynamic video streaming scenarios [11]. However, developing such a model requires significant effort in conducting subjective tests, involving a large number of participants and careful experimental design to obtain reliable and representative data.
In light of these challenges and opportunities, this research aims to address the pressing need for an accurate quality assessment model tailored explicitly for immersive high-frame-rate video streaming services. By leveraging a video database consisting of 480 video sequences, enriched with 19,000 quality ratings from 85 test subjects (LIVE-YT-HFR database available in [12] and presented in [9,13]), we propose a novel fuzzy logic-based approach that endeavors to model user perception of quality more effectively. Employing fuzzy logic for this task yields several advantages over alternative methods like machine learning and neural networks. One key strength of fuzzy logic lies in its adeptness at handling uncertainty and vagueness, both of which are inherent attributes of human perception [14]. Unlike traditional binary logic or crisp systems that enforce rigid true-or-false classifications, fuzzy logic allows for gradual transitions and nuanced decision-making, mirroring the way humans process information. This flexibility enables fuzzy logic to capture the intricacies of user QoE more effectively [7]. Additionally, it provides an intuitive and interpretable framework, allowing researchers to easily comprehend and analyze the relationships between various input variables, such as video characteristics, network conditions, user preferences, and social context, and their corresponding output assessments, specifically the video quality ratings in our case. Fuzzy logic’s innate ability to handle uncertainty and imprecision aligns with the subjective nature of human perception, making it an alluring choice for capturing the intricacies and subtleties that underlie user QoE.

1.2. Contributions

The primary focus of this research is to develop a consistent and reliable model for predicting the video quality as perceived by users, which is of vital importance when managing network performances in a wide range of streaming scenarios. We seek to contribute to the ongoing pursuit of enhancing user-centric video streaming experiences and empowering service providers with robust tools for content delivery optimization. The outline of the main scientific contributions of this research is as follows.
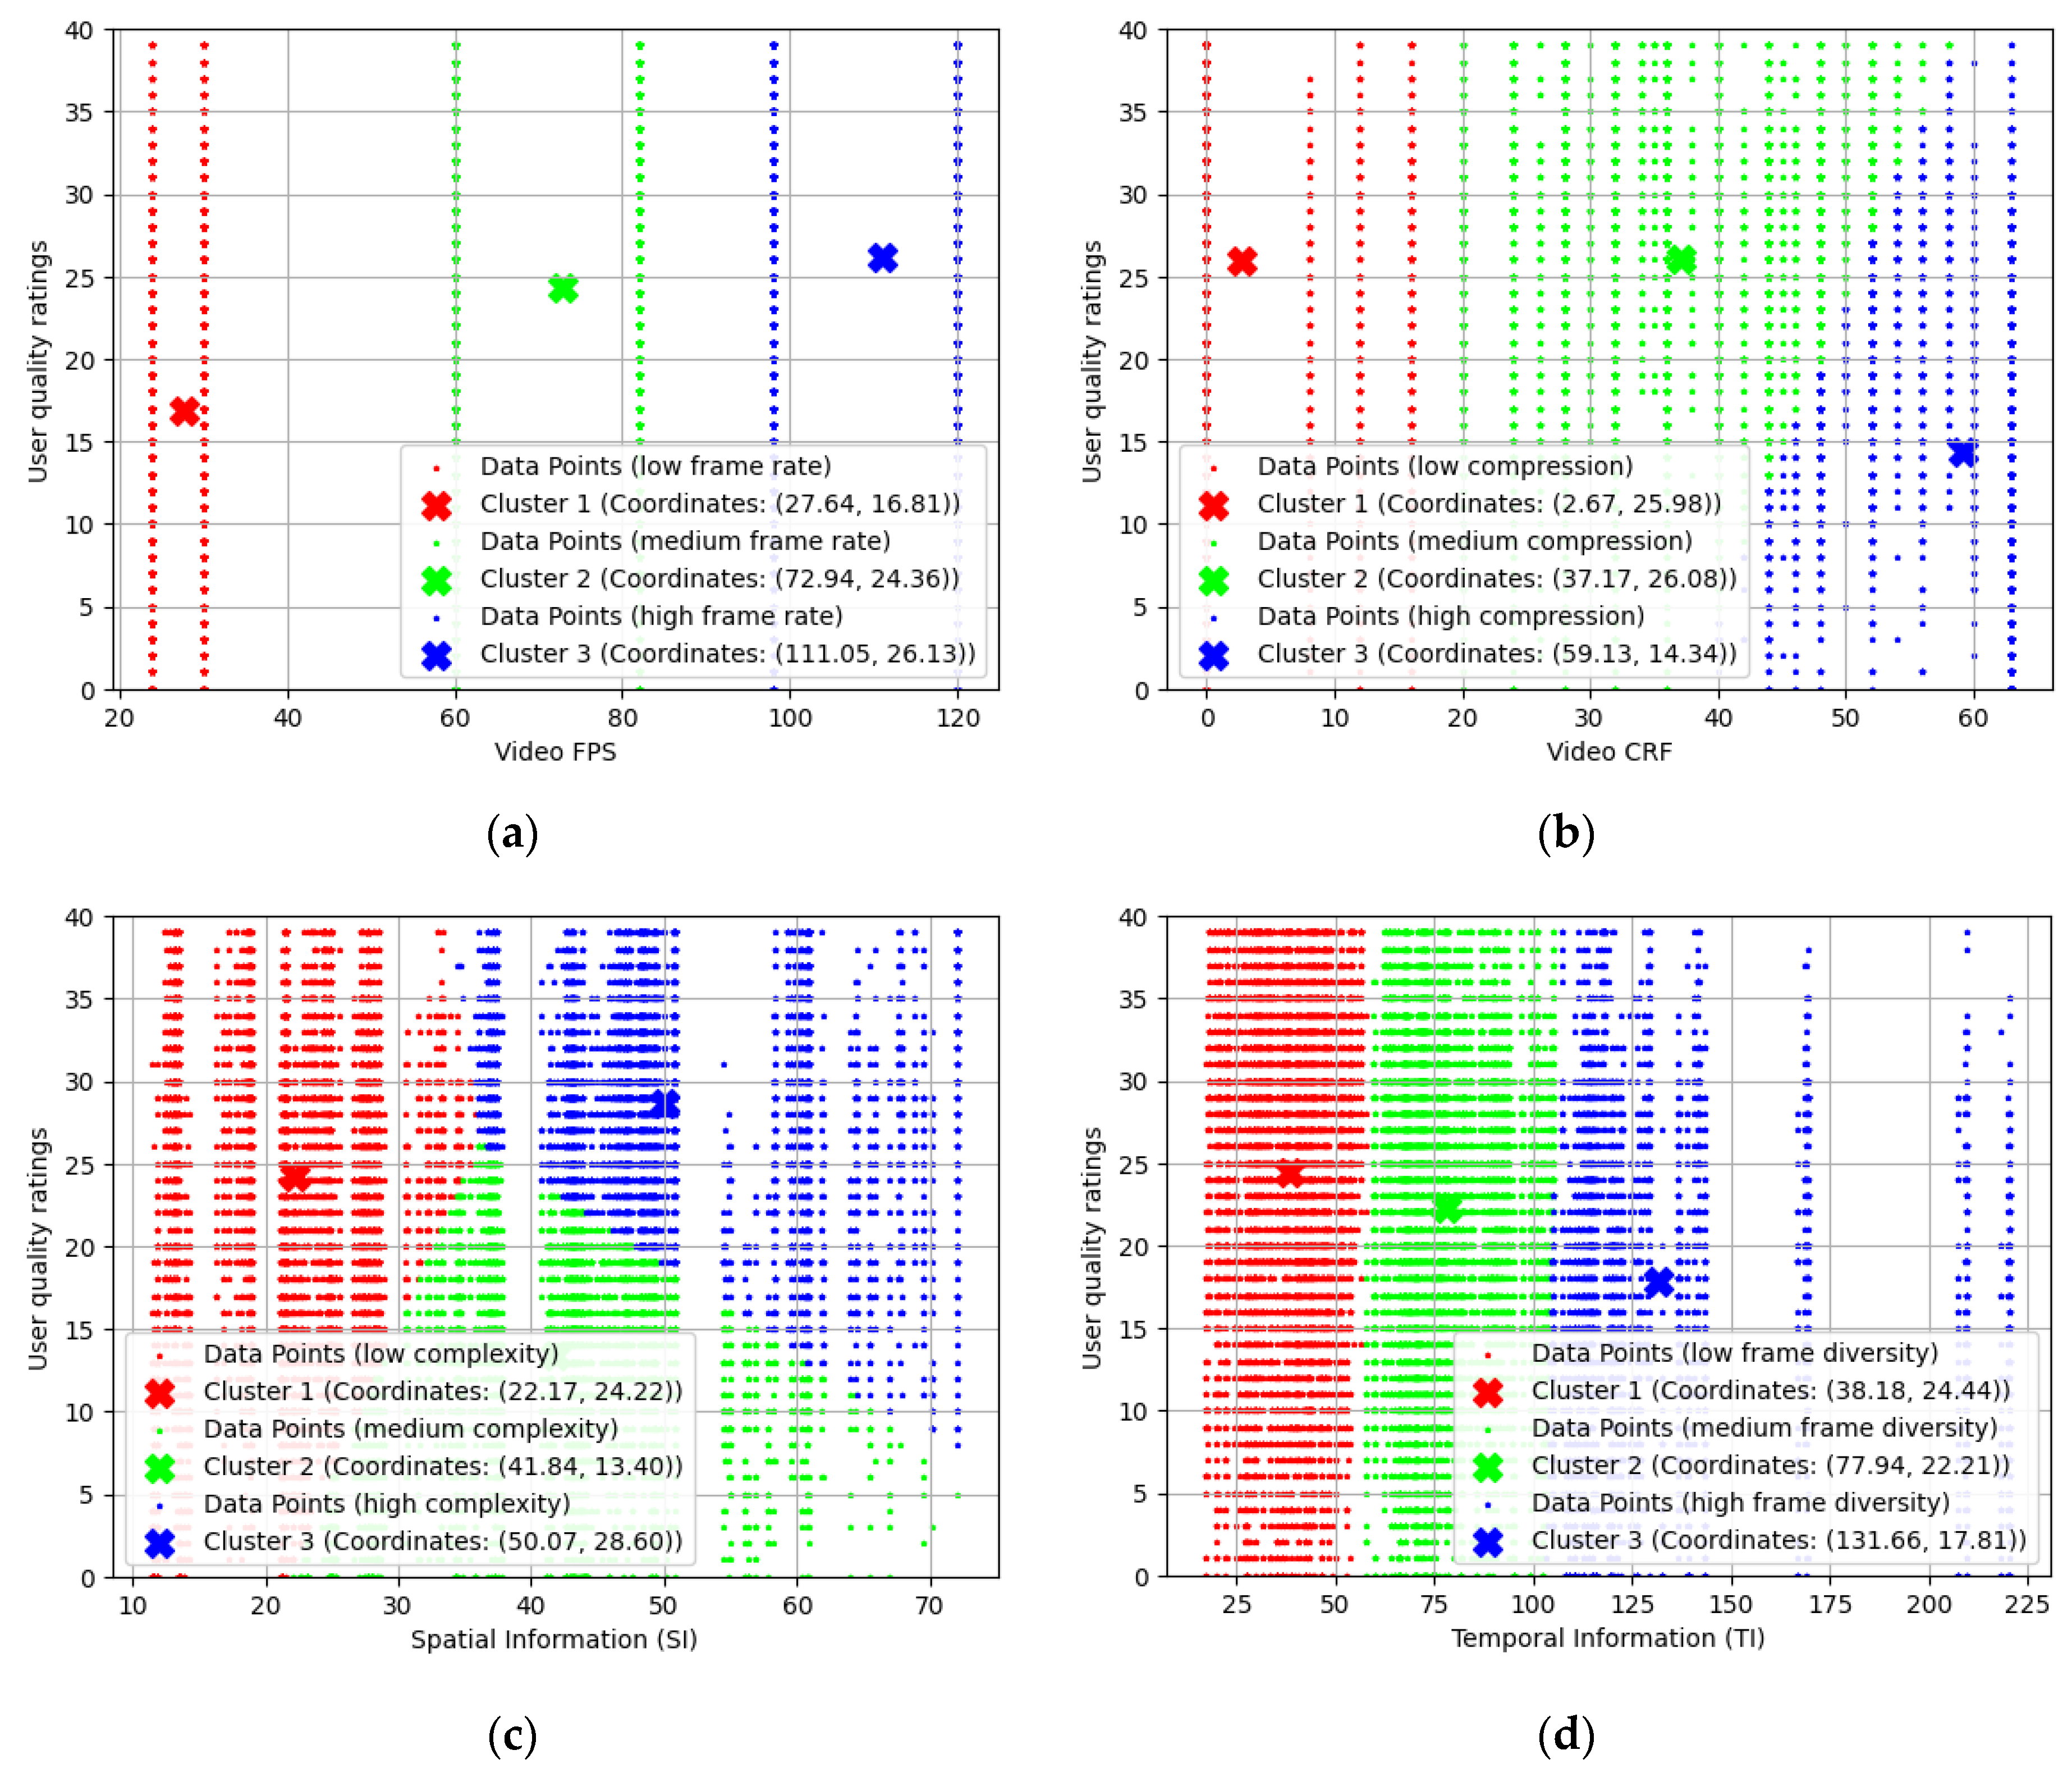
  • Our study involved an in-depth analysis of the dataset, revealing intricate relationships between four key video properties (video frame rate, compression rate, spatial information, and temporal information) and user subjective ratings;
  • We developed a fuzzy logic-based video quality assessment model (FLAME-VQA) capable of assessing the quality for a wide range of streaming scenarios based on the four video properties;
  • The model incorporates an inference system that effectively tackles uncertainty and vagueness in the data. By employing fuzzy clustering and membership functions, our model enables more human-like decision-making;
  • The proposed model successfully bridges the gap between objective and subjective evaluation and paves the way for more refined multimedia delivery systems that cater to users’ preferences and expectations.

1.3. Paper Structure

In the subsequent sections of this paper, we provide an in-depth overview of recent video quality assessment methods that also employ subjective ratings to deliver the output (Section 2). Next, we offer a concise explanation of the dataset [9] that we utilized for our modeling (Section 3). We then discuss the process of applying fuzzy logic in quality assessment, highlighting its effectiveness in handling uncertainty and vagueness in the data (Section 4). Furthermore, we present and verify the results obtained from our fuzzy logic-based video quality assessment model—FLAME-VQA (Section 5). Lastly, in Section 6, we conclude by discussing the implications of our findings, shedding light on the limitations of the model, and outlining potential directions for future research.

2. Related Works

As discussed in the previous section, video content has become the dominant form of media on modern networks. The demand for content is increasing rapidly, leading to the expansion of Internet traffic. Large-scale video streaming services like YouTube, Netflix, and Hulu play a significant role in contributing to this growth [15]. This sparked the development of numerous quality assessment models in parallel. These models have been designed to evaluate the quality of video-specific formats and properties, as well as for the specific network conditions and contexts in which the videos are delivered to end users. Some of these models are already well-established and frequently used, such as Peak-Signal-to-Noise-Ratio (PSNR), Structural Similarity (SSIM) index, Multiscale Structural SSIM (MS-SSIM) [16,17] respectively, Feature Similarity Index (FSIM) [18], the Spatio-Temporal Reduced Reference Entropic Differencing (ST-RRED) algorithm developed in [19], and the Spatial Efficient Entropic Differencing for Quality Assessment (SpEED-QA) model from [20]. It is important to note that delving into that extensive array of studies and well-established algorithms exceeds the confines of this review. Thus, our focus will be solely on recent developments in the field of predicting 2D video quality by incorporating subjective ratings into the inference systems of the models, since our research contributes specifically to that domain.
In [21], the authors propose a method to predict the subjective video quality based on the objective video quality measure (specifically, PSNR) using a sigmoid function model, allowing for the generation of a larger dataset without the need for costly and time-consuming subjective tests. Schiffner et al. present a method called Direct Scaling (DSCAL) for assessing the perceptual quality dimensions of video degradations, also aiming to reduce the experimental effort and allowing for more test conditions to be evaluated [22]. The linear quality prediction model based on the identified perceptual dimensions showed a strong correlation with subjective test results, indicating its potential for accurately predicting overall video quality. Pinson et al. [23] introduce a video quality model that takes into account the perceptual impact of variable frame delays in videos. The model uses perceptual features extracted from spatial-temporal blocks and a long edge-detection filter to predict video quality by measuring multiple frame delays. Factor analysis was used in [24] to analyze the QoS variables, bit stream, and basic video quality metrics to estimate and predict the subjective quality.
To showcase the vastness of subjective factors impacting the perception of video quality, we review [25], which delves into the assessment of user engagement within adaptive bitrate video streaming. The authors investigated the relationship between viewing time and video quality using two subjective evaluations. The findings revealed that, in the case of low-quality videos, the decline in viewership follows a logarithmic pattern over time. Interestingly, instances of video stalling prompted users to discontinue playback after a 5-s wait. The rate at which users ceased playback post-stalling was contingent on factors such as the stalling location, duration, and quality influenced by coding aspects. To further quantify these observations, the authors formulated a baseline model solely incorporating stalling attributes. Additionally, they proposed a predictive model aimed at estimating video completion rates. The effect of stalling the video playback is also studied in [26]. Adding to the number of factors influencing user QoE, Wang found that packet loss in Internet Protocol Television (IPTV) transmission significantly affects the perceived quality, with burst loss having a greater impact than random loss [27].
Bampis et al. [28] propose a variety of recurrent dynamic neural networks that can predict QoE using subjective QoE databases. They focus on two major impairments in streaming video: compression artifacts and rebuffering events. By combining multiple inputs such as video quality scores, rebuffering measurements, and memory-related data, the models aim to predict QoE on video streams impaired by both compression artifacts and rebuffering events. The experimental results showed that the proposed models approach human performance in predicting QoE. The research is continued in [29], where a large-scale crowdsourcing experiment is conducted to investigate how changes in screen size affect perceptions of video quality. The experiment involved rescaling video stimuli to different canvas sizes on participants’ devices and collecting ratings on distorted videos. The study evaluated subjective modeling techniques and benchmarked objective quality models across screen sizes. The findings highlighted the importance of screen size in perceived video quality and the limitations of existing objective quality models in capturing the effect of screen size changes. The issue of video compression and its relation to user perception is also studied in [30].
Another example of using neural networks for the evaluation of the perceptual quality of streaming video can be found in [31]. Using a deep convolutional neural network (DCNN), the authors assessed the perceptual quality of streaming videos, incorporating the spatio-temporal characteristics of the videos in their evaluation. Another example of how learning a human visual behavior, in conjunction with spatial and temporal effects, using neural network modeling can be found in [32], where the authors developed a Deep Video Quality Assessor (DeepVQA) that achieved high levels of assessment accuracy. Ghosh et al. [33] propose a framework that uses Multi-Feature Fusion (MFF)-based Optimized Learning Models (OLMs) to predict video quality. The framework uses a combination of objective quality metrics and impairment factors to predict subjective quality scores. Machine learning algorithms were used in [34] for modeling QoE in user interactions with video streaming services, which make up a significant portion of mobile internet traffic. The research was aimed at modeling the overall quality of user experience with different types of network traffic. Nguyen et al. [35] evaluate 13 existing QoE models for HTTP (Hyper Text Transfer Protocol) adaptive streaming. The models are evaluated using 12 different open databases with varying characteristics. The findings suggest that the performance of the models varies depending on factors such as video codec, session duration, and viewing devices. The Long Short-Term Memory (LSTM) model was identified as the best-performing model, but with still enough room for improvement, especially for different viewing devices and advanced video codecs.
In [7], fuzzy logic was used to model user QoE for streaming videos. The model used three input parameters (packet loss rate, number, and the length of the packet loss intervals) to compute the Mean Opinion Score (MOS). Fuzzy logic can often be combined with other inference mechanisms to obtain the results. To this end, Gao et al. [36] propose a fuzzy neural network to predict the opinion score distribution of image quality. A similar method could be applied to video quality assessment, but we must bear in mind the computational complexity of such solutions and their suitability for real-time QoS management. Recently, some researchers focused their attention on User-Generated Content (UGC), like Yu et al. [37] or Cao et al. [38]. In both works, the authors mainly concentrated on constructing the UGC databases suitable for future QoE research. Yet, both groups of researchers also proposed VQA models that can be used for QoE assessment [38] or for learning quality-aware audio and visual feature representations in the temporal domain [38]. Apart from UGC videos, another specific category of videos, demanding a unique approach to quality assessment, are nighttime videos, analyzed in [39], where the authors proposed a blind nighttime video quality assessment model based on feature fusion.
An attempt to develop a somewhat unified model for VQA can be found in [40], where the authors develop different instances of the AVQBits algorithm. The authors claim that the algorithm can be used to assess video quality in different contexts, such as video service monitoring, evaluation of video encoding quality, gaming video QoE, and omnidirectional video quality. The presented results show that AVQBits predictions closely match subjective ratings of video quality for videos of up to 4K-UHD resolution.
We can also report that, recently, there has been significant progress in developing open-access video databases containing diverse video content suitable for testing. Many of these databases also include subjective ratings, making them valuable sources of data for developing VQA algorithms. In turn, scholars from this domain are more frequently focusing on developing models that incorporate subjective ratings into the inference systems, as they can rely on already completed extensive and resource-consuming subjective experimentation. Based on the reviewed studies, we draw the following conclusions:
  • Inference systems of developed models primarily rely on machine learning, neural networks, fuzzy logic, or a combination of these techniques;
  • Models based on neural networks are content-domain-dependent and require application-specific training [41];
  • Video-related parameters, such as video frame rate, compression, and spatio-temporal properties, have been identified as crucial factors influencing the human perception of video quality;
  • Online video databases serve as excellent starting points for developing VQA models, offering rich, diverse, and subjectively rated video content, and adhering to international standards for conducting research in this field;
  • Given the abundance of diverse video content and streaming scenarios in various network contexts, it is challenging to create a universal VQA model.

3. Dataset Properties

The data used in this study (LIVE-YT-HFR database) come from [12], while the methodology for its creation and interpretation of the results obtained from the subjective study are presented in [9]. We discussed earlier that the video database contains 480 video sequences. The sequences were derived from 16 videos (with manipulated compression and frame rates) and were rated by 85 test subjects. For an in-depth insight into the database, its properties, and the applied methodologies, we urge the readers to visit the abovementioned resources. This section will only provide a brief overview of the data.

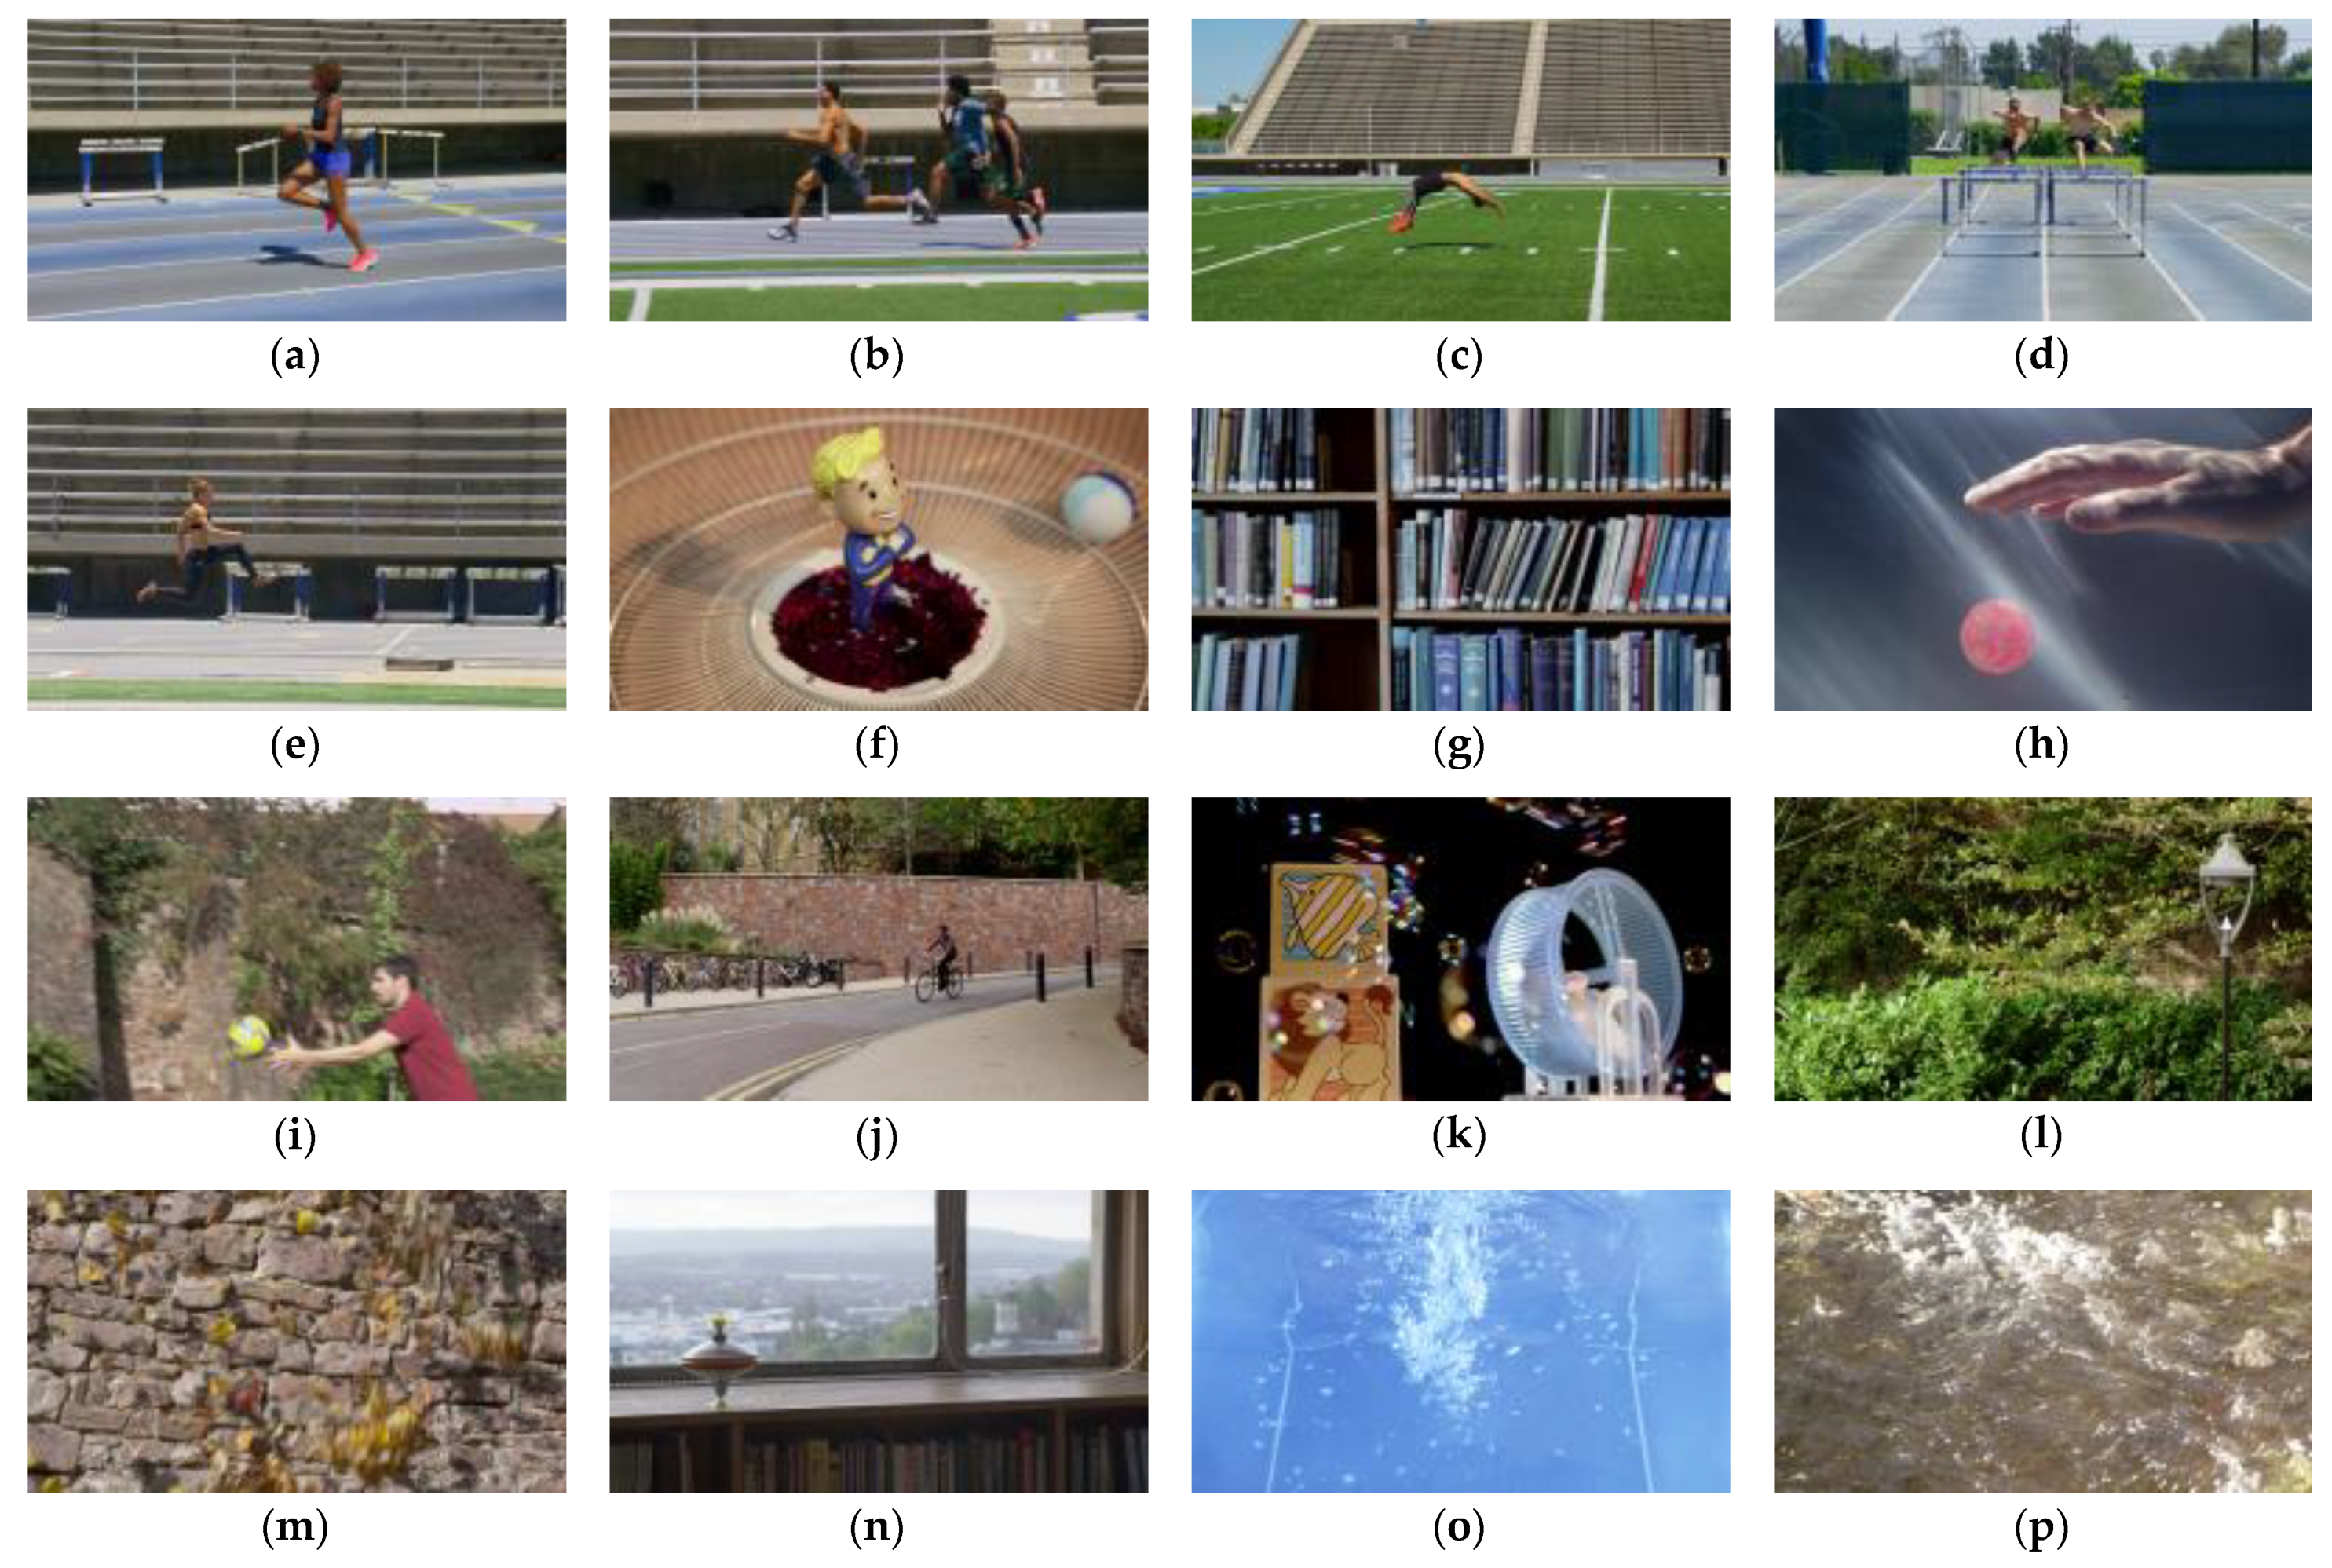
3.1. The Video Sequences

The database contains a set of 16 uncompressed source videos. This assortment encompassed 11 sequences procured from the Bristol Vision Institute High Frame Rate (HFR) video database [42] (recorded with a RED Epic-X video camera, at 3840 × 2160 pixels and 120 frames per second). The Institute’s public version of the database contained spatially downsampled videos in 1920 × 1080 (HD) YUV 4:2:0 8-bit format, lasting 10 s each. Additionally, five videos with high-motion sports content, captured by the Fox Media Group at 3840 × 2160 pixels, YUV 4:2:0 10-bit format, were also included, and each of them had a duration of 6 to 8 s. In Figure 1, we captured frames of each source video to showcase the genres of the sequences, which include sports, scenes from nature or urban areas, interior scenes, etc. To ensure a diverse range of scenes and motions in the selected source sequences, the authors calculated Spatial Information (SI), Temporal Information (TI), and Colorfulness (CF) measures for the videos. However, the results of the SI and TI measurements were not included in the public dataset; hence, we performed those calculations for 480 videos using the MSU Quality Measurement Tool (version 14.1) software package [43].
To generate test sequences featuring a range of frame rates, the authors employed a frame-dropping technique, sidestepping motion blur and yielding lower frame-rate videos that aligned more closely with their inherent capture rates. Subsequently, they undertook the subsampling of 30 test sequences from each source, across six distinct frame rates: 24, 30, 60, 82, 98, and 120 fps. These sequences were then exposed to five tiers of VP9 compression. Notably, frame-rate values of 82 and 98 were deliberately integrated, notwithstanding their relatively lesser popularity. This inclusion aimed to yield more intricate evaluations of video quality, particularly within the spectrum of 60 fps to 120 fps. This nuanced selection played a pivotal role in refining video quality assessment and consequently fostering the development of a more sophisticated model.
The compression procedure entailed the utilization of FFmpeg VP9 compression [44], employing single-pass encoding while manipulating five distinct Constant Rate Factor (CRF) values. This manipulation led to the generation of five distinct bit rates. The selection of these five compression tiers for a given source sequence unfolded in an ensuing manner. The primary and fifth tiers corresponded to the lossless (CRF = 0) and maximum (CRF = 63) feasible compression levels attainable within VP9, respectively. Conversely, the three intermediary bit rates were chosen to ensure that compression yielded approximately equitable bit rates across all frame rates, thereby engendering a tangible perceptual distinction among them. To that end, the CRF values for the remaining videos, emanating from the source sequence, were aligned with these stipulated bit rates. Consequently, every source content spawned a suite of 30 test sequences (arising from the multiplication of six frame rates by five compression tiers). This procedure was iterated for every source sequence within the database.
Note that we accepted the authors’ annotations, which impacted the naming convention of the input values of our model (discussed in Section 4.2.1).

3.2. The Subjective Experiment

The evaluation of subjective video quality for the prepared sequences utilized the Single-Stimulus Continuous Quality Evaluation (SSCQE) method, as outlined in [45]. Following the details presented in [9], a total of 85 volunteer undergraduate participants were engaged from the authors’ university. This group consisted of 14 females and 71 males, spanning an age range of 20 to 30 years. All participants possessed regular or corrected-to-normal color vision. Each participant evaluated a set of sequences in the same viewing conditions. The sequences were played on a 27-inch screen (3840 × 2160 pixels), using Venueplayer, and the viewing distance was set to 30 inches, (around 76 cm).
To mitigate potential biases, the video database underwent division into four distinct subsets, each encompassing 120 videos. Every participant assessed two out of the four sets across two sessions, thereby resulting in each subject evaluating 240 videos. For the sake of introducing randomness, playlists were curated for each participant by subjecting the 120 sequences to a randomized reordering process. This strategy ensured that sequential videos originated from distinct source sequences and frame rates, thereby effectively minimizing the influence of contextual and memory biases in the assessment of subjective quality. Furthermore, to prevent any prejudicial impact related to viewing order, unique playlists were individually tailored for each participant within every session. This measure was adopted to avert any potential bias arising from the sequence in which videos were presented.
During the evaluation process, an interactive continuous quality rating scale was presented on-screen following the conclusion of each video. The scale comprised five Likert indicators, ranging from bad to excellent, providing the participants with a guided framework for their rating task. Participants were explicitly instructed to evaluate the perceived quality of the content while disregarding any personal preferences or content-related interests. To combat potential subjective fatigue, a minimum interval of 24 h was mandated between successive rating sessions. The duration for each session was kept within 40 min, and each video was rated by a minimum of 42 users to ensure sufficient data for analysis. To validate the reliability of the subjects’ ratings, the authors undertook supplementary analyses to evaluate both inter-subject and intra-subject consistency.
In their work, the authors analyzed the obtained results from the subjective study, for instance, calculating MOS for each video sequence. But in our analysis, we use the raw data published on the GitHub page of the authors’ project (the link to the page is published also in [12]). Note that we divided the dataset randomly into two subsets. One was used for model training and the other for testing. The ratio between the training and test data subsets was 80:20, respectively, i.e., the ratings of the 68 test subjects were used for the model training, and the rest (17) were used for model testing. As discussed earlier, each test subject rated 240 videos, meaning both of our data subsets contained the ratings for every video in the database.

4. Fuzzy Logic in User Experience Assessment

In this section, we first provide an overview of the applicability of fuzzy logic in quality assessment algorithms, focusing on its advantages over other comparative approaches. Second, we continue this section by discussing the model development process, which involves the fuzzification of scalar input and output values, the development of the set of rules for the fuzzy inference system (FIS), and the defuzzification of the fuzzy output to obtain crisp results, i.e., VQA for specific input values (video properties).

4.1. Applicability of Fuzzy Logic

Fuzzy logic is a mathematical technique for dealing with uncertainty and imprecision systematically. It is based on the concept of fuzzy sets [46], which are sets that have degrees of membership rather than crisp boundaries. Fuzzy logic can be used to model complex phenomena that are difficult to capture with conventional methods, such as human perception, reasoning, and decision-making. One such phenomenon is the user QoE, since it is not a binary concept, but rather a continuum that can vary from bad to excellent.
When employing fuzzy logic, one can benefit from its advantages compared to other methods like machine learning and neural networks. One key advantage lies in its ability to handle and represent uncertainty and vagueness, which are inherent characteristics of human perception. Unlike traditional binary logic or crisp systems, fuzzy logic allows for gradual transitions between true and false states, mimicking human decision-making processes that involve shades of gray rather than strict yes-or-no choices. Moreover, fuzzy logic provides an intuitive and interpretable framework for capturing complex relationships between input variables (e.g., video characteristics, network conditions, user preferences, social context, etc.) and output assessments (quality rating, in our case). In contrast, machine learning and neural networks may achieve high predictive accuracy, but they often lack interpretability, making it challenging to understand why specific predictions are made. This “black box” nature can be problematic when modeling human perception, as the underlying factors driving the predictions may remain unclear.
Additionally, fuzzy logic-based models require less data for training compared to complex neural networks, making them more suitable for scenarios with limited datasets, such as subjective human ratings. The fuzzy-based models are computationally efficient and can be implemented with relatively simpler algorithms, making them practical for real-time applications, such as real-time QoS management and provisioning, where quick decision-making is essential. This ability to handle uncertainty, interpretability, and efficiency made it our favorable choice when modeling human perceptions of video quality.

4.2. The Model Development Process

The development of a typical inference system based on fuzzy logic involves:
  • Fuzzification. This step entails transforming crisp input and output values into fuzzy sets that describe the variable states. The grouping of the values into the fuzzy sets allows for handling uncertainty and vagueness in the data;
  • Defining a rule-based system to operate with the fuzzy states. These rules are typically in the form of “IF [condition] THEN [conclusion]” and use linguistic variables to express relationships between inputs and outputs. For instance, an example rule could be “IF [video fps IS low] AND [video compression IS high] THEN [quality IS bad]”;
  • Defuzzification. The final step involves converting the fuzzy output (e.g., quality IS bad) back into a crisp result. This process produces a clear and quantitative assessment based on the inference system of the model.

4.2.1. Fuzzification of the Scalars

The presented model in this contribution aims to assess video quality, as perceived by users, based on four video parameters: video frame rate (annotated with Video FPS), compression rate (dependent on the CRF, hence, Video CRF), SI, and TI. The model development process involves the fuzzification of scalar values for these parameters using the Fuzzy C-Means (FCM) clustering approach [14]. The method groups all data points into clusters based on their similarities. Unlike traditional hard clustering methods like K-Means, FCM assigns membership degrees to data points for each cluster rather than assigning a single cluster label. This enables data points to belong to multiple clusters with varying degrees of membership, reflecting the uncertainty and partiality of data points’ association with clusters. Therefore, i-th data point ( x i ) can be a member of several clusters ( j ) with different degrees of membership ( u i j ). Based on [14], to perform the fuzzification, the model minimizes the objective function J m , as given by Equation (1):
J m = i = 1 L j = 1 C u i j m · | | x i c j | | 2
where c j  represents the center of the d -dimension cluster, | | | | is a norm that expresses the similarity between the measured data and the center, and m is any real number greater than 1. In this study, m   = 2, which implies that a specific data point can belong to two fuzzy clusters. The iterative process of finding fuzzy clusters and their centers involves updating u i j and c j using Equations (2) and (3), respectively ( N represents the number of data points); the process continues until the stopping criteria ( ε ) is met (Equation (4); k are the iteration steps) [14]. In our case, we used the value of ε = 10−5.
u i j = 1 k = 1 C ( | | x i c j | | | | x i c k | | ) 2 m 1
c j = i = 1 N u i j m · x i i = 1 N u i j m
m a x i j { | u i j ( k ) u i j ( k 1 ) | } < ε .
The FCM clustering approach was implemented in Python (version 3.11.4) using the latest version of the skfuzzy package. The decision regarding the optimal number of clusters for the FCM algorithm initially involved a heuristic approach using two clustering validity indices, namely the FCM partition coefficient ( P C ) and partition entropy ( P E ). In this initial phase, we aimed to establish a foundational clustering structure using the PC and PE methods, which served as a starting point for further refinement. We executed the FCM algorithm for a range of cluster numbers ( c ), spanning from two to a user-defined maximum value that we initially set at five. For each iteration of clustering, both the PC and PE were calculated, employing Equations (5) and (6), respectively, as outlined in [47]. These indices allowed us to quantitatively evaluate the quality and coherence of the resulting partitions. The PC serves as a measure of cluster compactness, gauging how closely data points within each cluster are grouped. On the other hand, the PE offers insights into the fuzziness or overlap present among clusters, providing a sense of how distinct or intermingled the partitions are. By analyzing the PC and PE values, we could gain an initial understanding of the suitability of different cluster numbers in representing the underlying data distribution. In this initial phase, the data points for each input variable of the model were clustered into two fuzzy clusters.
P C = 1 N i = 1 N ( 1 c   j = 1 c u i j m ) 2 .
P E = 1 N i = 1 N j = 1 c ( u i j m · l o g ( u i j ) ) .
However, as our analysis progressed, we observed that the FCM partitions formed with two clusters per input variable did not fully capture the complexity and nuances of the video quality assessment task. Subsequently, we decided to refine our approach by introducing an additional cluster for each input variable, resulting in a total of three clusters for each. This adjustment was motivated by our recognition that a more detailed representation of the data through increased cluster granularity could yield more accurate and insightful quality assessments. This approach allowed us to iteratively adjust the cluster centers based on the distribution of data points, resulting in a clustering configuration that was tailored to the inherent characteristics of the dataset. By taking this approach, we aimed to strike a balance between capturing the underlying data structure and avoiding overfitting, thereby enhancing the generalization capabilities of the model. The resulting clusters and their respective centers, for the dataset discussed in Section 3 and used for the model development, are depicted in Figure 2.
In Figure 2 subplots, each data point represents the quality rating given by one test subject to one video, and the color codes indicate the membership of each point to a specific fuzzy cluster. Since the fuzzy rule-based system operates with linguistic variables to produce outcomes, we have named the derived clusters as shown in the figure captions. Furthermore, each subplot corresponds to one input variable of our model, and the number of clusters on the subplots represents the number of states a specific input can be in. For instance, video fps can be in three states: low, medium, and high video frame rate (Figure 2a).
The figure also shows that we used subjective ratings of video quality to fuzzify scalar values of the input parameters, which can be observed from the y -axes. We discussed in Section 3.2 that the dataset utilized for this study adopted a widely recognized user rating scale, consisting of the following ratings: 0 = Bad, 1 = Poor, 2 = Fair, 3 = Good, and 4 = Excellent. To maintain consistency with the approach followed in [9], where the ratings were multiplied by a factor of 10, we adopted the same methodology. In addition, before clustering, we multiplied the SI and TI metrics of each video sequence by a factor of 1000. This helped execute the FCM algorithm; otherwise, the algorithm returned the error, since the values were too small to determine the cluster boundaries.
The figure also underscores the dispersion of data points encompassing all MOS rating categories, thereby posing a challenge in elucidating the precise correlation between the inputs and the model output. It is important to recall that the clustering was executed on the training set, which contained 80% of the original data.
After completing the FCM process and obtaining the coordinates of the cluster centers, we created the membership functions for each cluster. The membership function serves as a quantitative indicator of the extent to which individual data points are associated with a particular cluster. To accomplish this, we employ Gaussian combination membership functions (Gauss2) for each cluster. The Gauss2 function is characterized by its utilization of two distinct Gaussian membership functions, a feature that facilitates fine-tuning of both the mean and sigma values, allowing for a more accurate representation of the data’s clustering behavior. The sigma of a function has to be defined so that the function tail reaches y = 0 at the x coordinate of the adjacent cluster center. The obtained membership functions for each cluster are depicted in Figure 3.
As in Figure 2, the x -axes values in Figure 3 correspond with the properties of the video sequences discussed in Section 3.1. Specifically, there were six different video frame rate values (24, 30, 60, 82, 98, and 120 fps), with CRF values ranging from 0 to 63, depending on the fps and the resulting bitrate. To compute the SI and TI values, we utilized the MSU Quality Measurement Tool (version 14.1) [43], calculating them for each of the 480 test sequences and then multiplying them by 1000 to enable clustering.
The Gaussian-shaped membership function is preferred in fuzzy clustering algorithms, such as FCM, due to its smoothness, centeredness, and decay properties. Centering the Gaussian function at the cluster center ensures that data points closer to the center have higher membership degrees, indicating a stronger association with the cluster. The decay property enables the function to capture the gradual decrease in membership as data points move away from the center. Additionally, the Gaussian function’s parameters have intuitive interpretations, making it more interpretable and facilitating the understanding of fuzzy assignments. Lastly, the mathematical tractability and efficiency of the Gaussian function simplify the optimization process during fuzzy clustering, making it computationally efficient for practical applications with complex data patterns and overlapping clusters.
As we delved deeper into the performance analysis of our model and extensively experimented with various rules, membership function shapes, and configurations, we identified a specific scenario that warranted a slight modification in our approach. For the medium compression cluster associated with the video crf input variable, we observed that the standard Gauss2 function did not fully align with the underlying data distribution. To address this challenge, we made a judicious adjustment to the membership function for that specific cluster. We introduced a subtle alteration that resulted in a trapezoidal-like shape, with a gentle rightward inclination (Figure 3b). This tailored modification allowed the membership function to better align with the characteristics of the data points associated with that particular cluster, enabling more precise modeling of the nuances within that region of the input space. The adjustment of the function engendered a heightened membership strength for CRF values exceeding the cluster center (37.17) yet remaining below or equal to 54, specifically directing them towards the Medium compression cluster. This contrasted with the behavior observed in the High compression cluster, where the same range of CRF values exhibited comparatively lower membership.
Finally, the process of fuzzification was applied to the output of the model, which represents the assessed video quality, quantified using MOS. We generated five distinct fuzzy clusters to represent the output, with each cluster center aligned to the corresponding numerical rating (Figure 4). In Table 1 we list the properties of the defined membership functions depicted in Figure 3 and Figure 4.

4.2.2. A Set of Fuzzy Rules and Defuzzification to the Scalar Result

In the preceding subsection, we delved into the procedure of transforming the crisp values of input and output parameters into fuzzy variables, a pivotal step in constructing the model’s inference system. Yet, to generate a measurable output, i.e., the quantified level of video quality rating in numerical terms (referred to as MOS), the fuzzy values must undergo a process of defuzzification (as illustrated in Figure 5). This entails establishing a set of fuzzy rules, choosing between a conjunctive or disjunctive rule system, and implementing a defuzzification technique to compute the output. Several widely used defuzzification methods include the max membership principle, centroid method, weighted average method, and center of sums, among others.
The model’s inference system relies on a set of 36 fuzzy rules, which can be found in Table A1 of Appendix A. The rules were defined using a hybrid method that combines multiple approaches. As domain experts, the authors formed an initial set of linguistic rules which were then iteratively fine-tuned using rule induction from the data. We used previously defined fuzzy cluster boundaries and tested each combination of input parameters to see the desired outcome, i.e., MOS value from the ground truth. We then compared the output of our model with the sought-after outcome and, when necessary, tweaked the rules to achieve error reduction. The connections between the linguistic values of the input and output variables are established using IF, AND, and THEN logical operators. The model was implemented using the widely used Mamdani inference system, where the output y k consists of a set of r propositions:
IF   x 1   is   A 1 k   AND   x 2   is   A 2 k   AND   x 3   is   A 3 k   AND   x 4   is   A 4 k   THEN   y k   is   B k   with   W k for   k = 1 ,   2 ,   ,   r .
x 1 , x 2 , x 3 and x 4 from Equation (7) are the inputs, A 1 k , A 2 k , A 3 k and A 4 k are the fuzzy sets representing the k -th input quadruplets and B k is the fuzzy set representing the k -th output. While experimenting with the FIS of the model, we found that adding certainty grade (i.e., rule weights W k ) [48] to the rules improves the accuracy and helps in capturing the ambiguity of the subjective ratings. The model adopts the widely used disjunctive system of rules. Hence, the output y is represented by the fuzzy union of all individual rule contributions y i , where i = 1 ,   2 , r , and r is the number of IF-THEN propositions, as follows:
y = y 1 y 2 y r
Finally, for defuzzification purposes, we used the centroid method. The method calculates the center of gravity, or centroid, of the fuzzy set’s membership function. This centroid represents the typical or representative value of the fuzzy number. It is calculated by finding the weighted average of the universe of discourse using the membership degrees as weights. The method can be described with Equation (9), where y is the defuzzified value and u ( y ) is the curve describing the fuzzy union derived from Equation (8). Note that Equations (7)–(9) are derived from [49].
y = u ( y ) · y   d y u ( y )   d y

5. Results and Discussion

In this section, we evaluate the performance of the developed model. First, we show the model output and use different metrics to quantify the correlation between the ground truth, i.e., MOS from the training, test, and complete datasets. Second, we show how our model performs when compared with other models that were previously tested on the same LIVE-YT-HFR dataset.

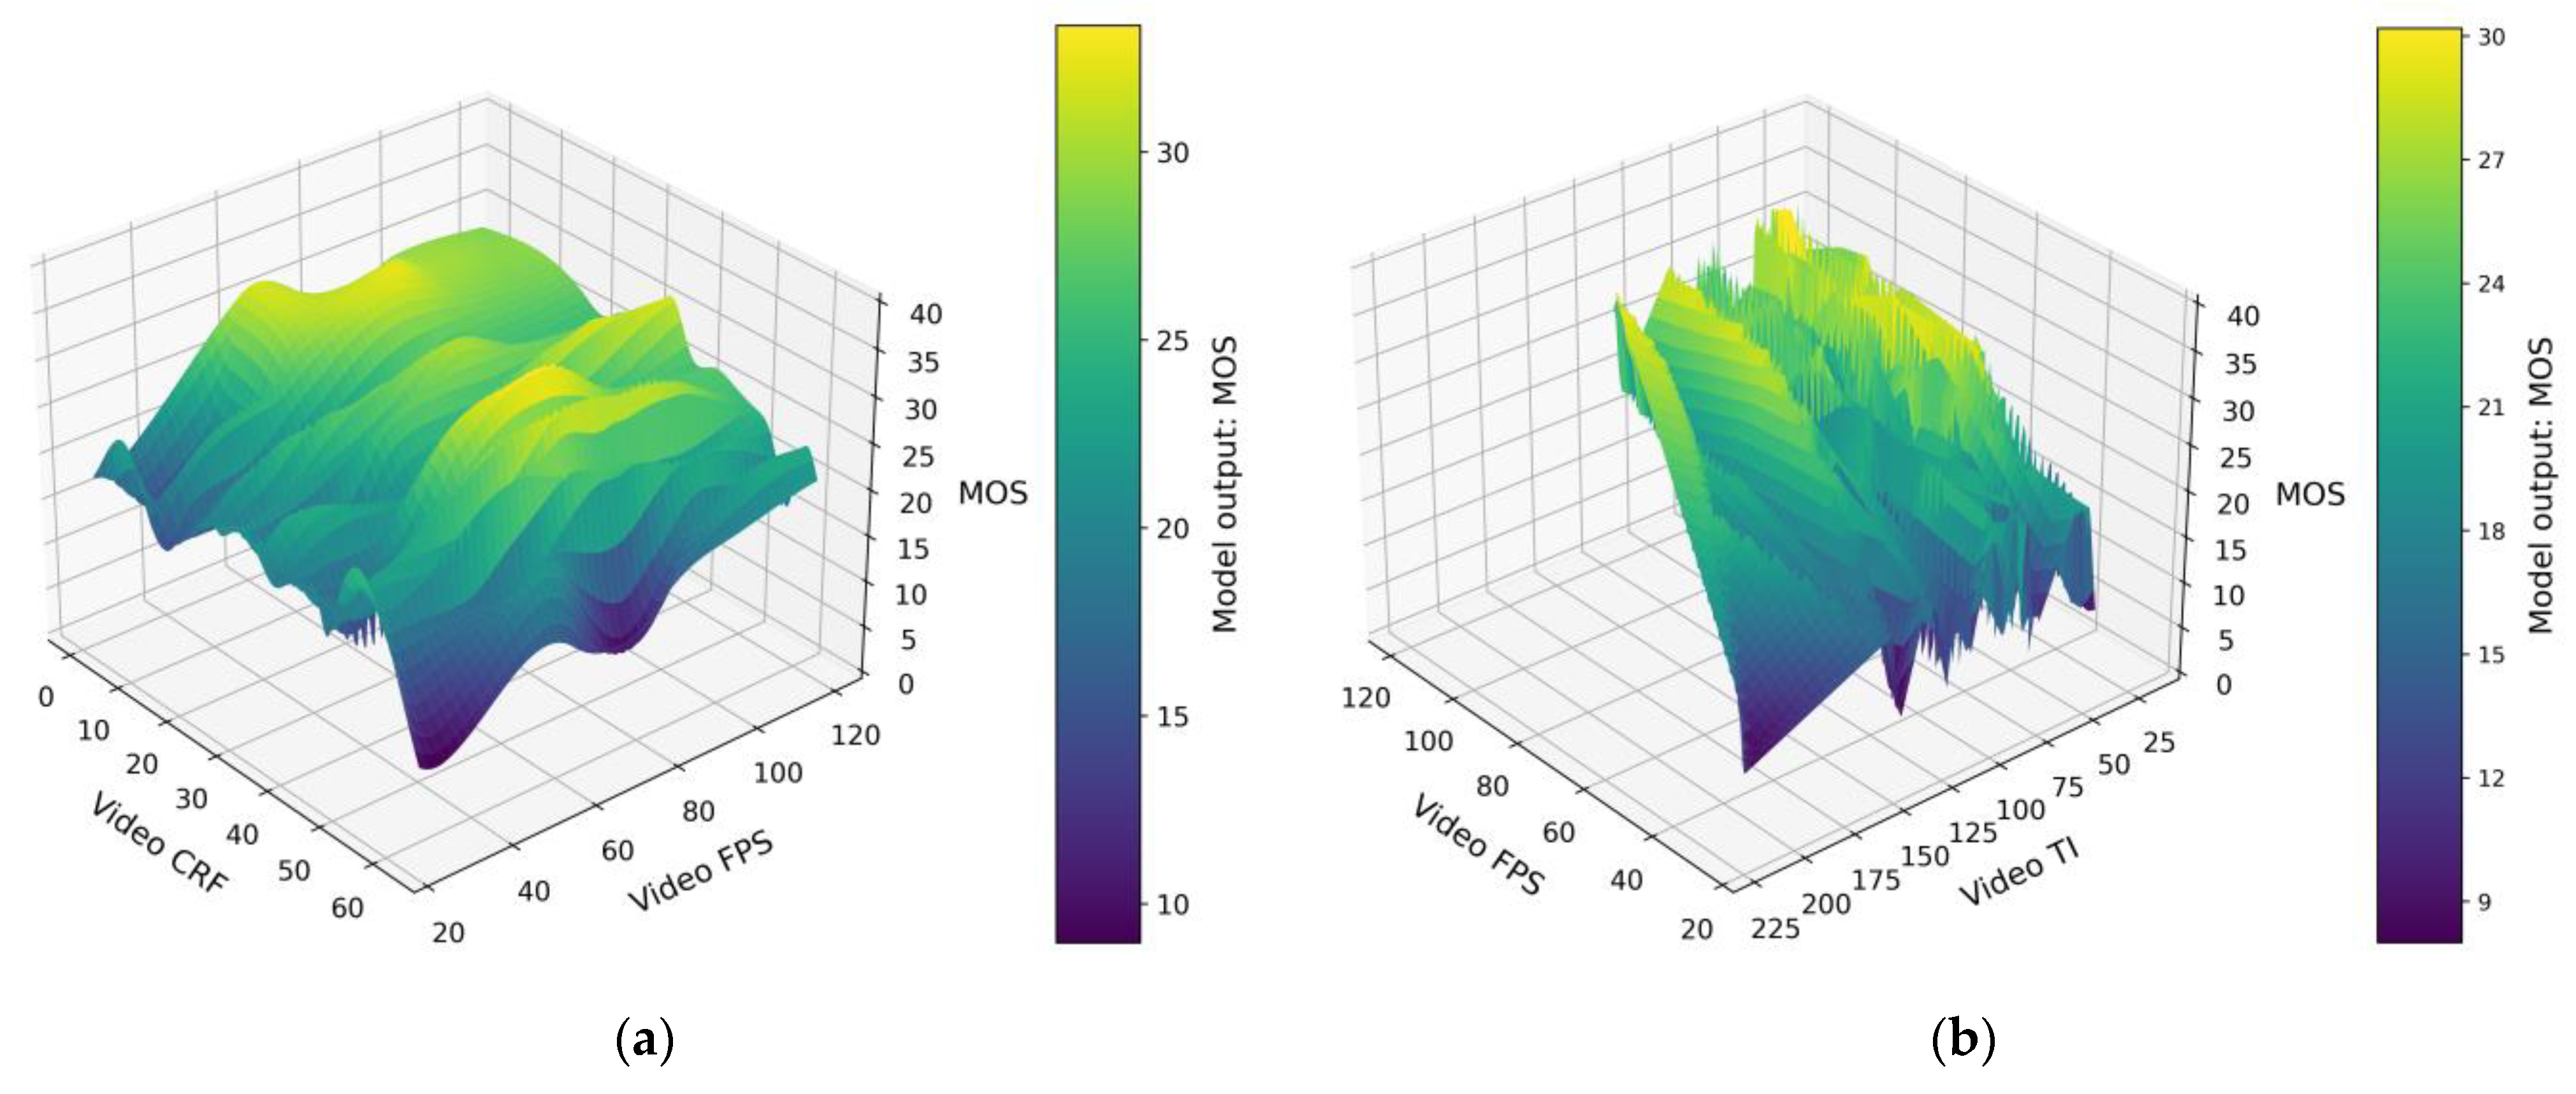
5.1. Evaluation of the Model Output

The evaluation of the performance of our proposed VQA model is carried out by comparing the obtained outputs with multiple data subsets, including the training, test, and complete dataset. We used common metrics for the evaluation of the output accuracy, namely, coefficient of determination (R2), Mean Squared Error (MSE), Root Mean Squared Error (RMSE), Spearman Rank–Order Correlation Coefficient (SROCC), and Pearson Correlation Coefficient (PCC). Figure 6 depicts the comparison between different MOS ratings, for every video in the LIVE-YT-HFR database (480), obtained from the datasets and our model, while the performance metrics can be found in Table 2.
The performance of the model on the training dataset shows a high level of correlation and accuracy. The R2 value indicates that about 82.7% of the variance in the output of the model can be explained by the variance in the training dataset MOS. The low MSE and RMSE values of 8.7819 and 2.9634, respectively, confirm the ability of the model to minimize assessment errors. In addition, the SROCC and PCC values of 0.8977 and 0.9096, respectively, demonstrate the strong positive monotonic and linear correlation between the assessments of the model and the MOS values from the training dataset. When evaluating the performance of the model on the independent test dataset, we find a slightly decreased but still significant level of predictive ability. The SROCC and PCC values of 0.8455 and 0.8632, respectively, illustrate a robust correlation between the assessments of the model and the test dataset MOS. The performance of our model over the entire dataset further underscores its effectiveness.
Comparison of performance across the three datasets provides valuable insights into the generalization capabilities of the model. The high R2 and correlation coefficients in all datasets indicate that the model has learned meaningful patterns from the training data and can make accurate predictions for unseen samples. The slightly higher assessment errors in the test dataset compared to the training dataset can be attributed to the inherent variability in the data, i.e., subjective quality perception ratings and fewer ratings per video in the test dataset. Nonetheless, the consistent and robust correlation observed in both SROCC and PCC metrics underscores the reliability of the model, especially when keeping in mind the different genres of the sequences (Figure 1).
The results also show how the utilization of fuzzy logic holds promise in addressing the inherent complexities of video quality assessment, as it acknowledges the multifaceted nature of visual perception. The model’s ability to encompass both objective technical attributes and subjective perceptual aspects within a unified framework offers a novel approach to VQA. Moreover, the incorporation of fuzzy logic introduces a level of interpretability and adaptability, allowing the model to effectively capture the intricate interdependencies and uncertainties that characterize human judgment.
Since the model is trained with HFR video content and built for its quality assessment, it makes sense to compare how different pairs of input parameters affect its output. To this end, Figure 7a shows the model behavior for a range of Video CRF and Video FPS values. Figure 7b does the same for another input pair, particularly of interest in HFR videos, namely, Video FPS and Video TI. As seen from the figures, a complex relationship between the input pairs and the predicted MOS exists. The subplot (a) shows how high frame rates cannot guarantee high MOS values if the level of video compression also remains high. This is somewhat expected, since the high compression levels introduce various video artifacts, adversely affecting the overall quality and user experience.
In high-frame-rate videos (over 60 fps), the relationship between frame rate and temporal information becomes interesting, hence the subplot (b). With higher frame rates, there are more frames captured and displayed in a given time interval. This increase in frames leads to smoother motion and a more accurate representation of high-speed actions. This can be particularly important in videos with fast-moving subjects, sports events, or action scenes, which were included in the LIVE-YT-HFR dataset. High frame rates enhance the temporal information because the shorter time gap between frames captures rapid changes and motion more accurately. Figure 7b portrays this behavior which allows us to conclude that this complex relationship was successfully captured by the FIS of the model.

5.2. Comparative Performance Analysis

In Table 3, we present a comparison between our FLAME-VQA model and several other established models commonly used for video quality assessment which were previously used to evaluate the video quality of the LIVE-YT-HFR dataset. The analysis is based on two key metrics, namely SROCC and PCC.
While examining the data presented in the table, it becomes evident that FLAME-VQA stands out prominently among the comparative models. It showcases higher SROCC and PCC values than the benchmark models, indicating its robustness across a wide range of scenarios. These results signify the model’s ability to capture and replicate human perception of video quality. Among the other models, a few exhibit notable performance as well. GSTI boasts a substantial SROCC of 0.7909 and an almost equally high PCC of 0.791, positioning it as a strong competitor. AVQBits|H0|s and AVQBits|M3 also demonstrate commendable correlation coefficients, highlighting their efficacy in assessing video quality. However, some models fall short in comparison to FLAME-VQA. Notably, DeepVQA exhibits lower SROCC and PCC values, of 0.3463 and 0.3329, respectively, indicating a weaker alignment with human perception. Similarly, SSIM and FRQM also display comparatively lower coefficients, suggesting limitations in accurately assessing video quality.
The performance of FLAME-VQA can be attributed to its utilization of fuzzy logic and its incorporation of four crucial input parameters—video frame rate, compression rate, spatial information, and temporal information. By leveraging these factors within a fuzzy logic framework, FLAME-VQA adeptly captures the intricate interplay of technical attributes and subjective perceptual aspects, resulting in quality assessments that closely resonate with human judgments.

6. Conclusions

By harnessing the resources of an open-access LIVE-YT-HFR video database and utilizing results obtained from a subjective experiment involving 85 participants who assessed the quality of 480 test sequences, we have successfully engineered a robust fuzzy logic-based model and named it FLAME-VQA. This model exhibits the capacity to evaluate video quality of low and high frame rates, as perceived by users. The framework operates based on four key input parameters intrinsic to the video: video frame rate, CRF, SI, and TI properties.
What distinguishes our model is its ability to perform evaluations without necessitating further human experimentation or imposing significant computational overhead. This aspect positions FLAME-VQA as a compelling alternative to approaches rooted in machine learning or neural networks. Notably, we have demonstrated that fuzzy logic shines particularly in scenarios marked by uncertainty and ambiguity, a characteristic inherent to subjective experimentation. Through the integration of fuzzy sets and the derivation of membership functions, we have effectively modeled intricate phenomena, showcasing the model’s high accuracy in conducting video quality assessments across a diverse array of streaming scenarios (the SROCC and PCC values higher than 0.89). Incorporating fuzzy logic as the underlying engine of our model not only validates its efficacy in reflecting human perception but also demonstrates a forward-looking approach to bridging the gap between technical metrics and subjective experience.
Looking ahead, our research trajectory will be devoted to the continual refinement and enhancement of this model, as well as testing the model performance on different datasets, i.e., video databases. Presently, the scope of the model is confined to four input parameters, and its applicability is limited to videos featuring a maximum of 120 frames per second. A promising avenue for future development involves the incorporation of video resolution as an additional input parameter within the model. This expansion promises to further enrich the FLAME-VQA capacity to accurately gauge user QoE across a broader spectrum of video streaming contexts.

Author Contributions

Conceptualization, Š.M. and M.M.; methodology, Š.M. and M.M.; software, M.M.; validation, Š.M.; formal analysis, Š.M. and M.M.; investigation, Š.M. and M.M.; resources, M.M.; data curation, Š.M.; writing—original draft preparation, Š.M. and M.M.; writing—review and editing, Š.M. and M.M.; visualization, Š.M. and M.M.; supervision, Š.M. and M.M. All authors have read and agreed to the published version of the manuscript.

Funding

This research received no external funding.

Data Availability Statement

The analyzed video database and the related subjective ratings used of the videos for the modeling can be found on this link: https://live.ece.utexas.edu/research/LIVE_YT_HFR/LIVE_YT_HFR/index.html (accessed on 5 June 2023).

Conflicts of Interest

The authors declare no conflict of interest.

Appendix A

Table A1 lists the fuzzy rules, describing the FLAME-VQA decision-making process.
Table A1. A set of fuzzy rules. The annotations for the input variables L/M/H denote low, medium, or high, respectively, levels of FPS, CRF, SI, or TI. The model output MOS can be bad, poor, fair, good, or excellent, which is annotated with a B, P, F, G, and E set of characters, respectively. Different outputs can have different rule weights ( W k from Equation (7)), indicated by the numbers in the B, P, F, G, and E columns. Some combinations of input parameters lead to the same consequence; hence, in such cases, we use the OR logical operator to connect different input combinations.
Rule NumberIF Video fps = l/m/h AND Video crf = l/m/h AND Video si = l/m/h AND Video ti = l/m/h THEN   mos = b / p / f / g / e   ( W k )   AND   mos = b / p / f / g / e   ( W k )
FPSCRFSITI BPFGE
1HighLowLowMedium 10.4
2HighLowLowHigh 10.3
3HighLowLowLow 0.61
4HighLowMediumHigh 0.51
5MediumLowLowHigh 10.3
6HighLowMediumMediumOR 1
HighLowHighMedium
HighMediumLowMedium
7HighMediumLowLowOR 10.4
HighHighLowMedium
8HighMediumLowHigh 10.8
9HighMediumMediumLow 10.5
10HighMediumMediumMedium 11
11HighMediumMediumHigh 10.6
12LowLowLowHigh 0.71
13MediumLowMediumHigh 0.61
14LowLowHighHighOR 0.51
MediumLowHighHigh
15HighHighLowLow 0.50,1
16LowMediumMediumLow 0.351
17LowLowMediumMediumOR 0.31
LowLowMediumHigh
MediumLowMediumMedium
18HighMediumHighLowOR 0.21
HighHighMediumHigh
19LowLowLowLowOR 1
LowLowLowHigh
MediumLowLowLow
MediumMediumMediumLow
MediumHighMediumLow
HighHighMediumLow
20LowLowLowMediumOR 10.3
MediumMediumLowMedium
21LowLowHighMediumOR 10.2
HighHighHighLow
22LowMediumHighHigh 10.7
23LowHighMediumLowOR 10.5
MediumMediumHighHigh
24MediumLowLowMediumOR 10.1
HighHighMediumMedium
25MediumLowHighMedium 10.05
26MediumMediumLowHigh 10.8
27MediumHighLowMedium 11
28MediumMediumMediumMedium 0.71
29LowMediumLowHigh 0.51
30LowMediumMediumMedium 0.41
31MediumHighLowLowOR 0.31
MediumMediumHighMedium
MediumHighMediumMedium
MediumHighHighHigh
32LowMediumLowLow 10.3
33LowMediumLowMediumOR 1
LowHighLowMedium
LowHighMediumMedium
LowHighHighHigh
MediumMediumLowLow
MediumHighHighMedium
34LowMediumHighMediumOR 10.5
MediumMediumHighLow
MediumHighHighLow
35LowHighHighMedium 10.2
36LowMediumHighLowOR 0.61
LowHighLowLow
LowHighHighLow

References

  1. Zeng, Q.; Chen, G.; Li, Z.; Jiang, H.; Zhuang, Y.; Hai, J.; Pan, Q. An Innovative Resource-Based Dynamic Scheduling Video Computing and Network Convergence System. In Proceedings of the 2023 International Wireless Communications and Mobile Computing (IWCMC), Marrakesh, Morocco, 19–23 June 2023; pp. 174–181. [Google Scholar]
  2. Ericsson. Ericsson Mobility Report. Available online: https://www.ericsson.com/en/reports-and-papers/mobility-report (accessed on 15 July 2023).
  3. Hubspot. The Video Marketing Playbook Trends & Tips to Create a Video Strategy in 2023. Available online: https://blog.hubspot.com/marketing/video-marketing-report (accessed on 27 July 2023).
  4. Sultan, M.T.; Sayed, H. El QoE-Aware Analysis and Management of Multimedia Services in 5G and Beyond Heterogeneous Networks. IEEE Access 2023, 11, 77679–77688. [Google Scholar] [CrossRef]
  5. Ramachandra Rao, R.R.; Borer, S.; Lindero, D.; Göring, S.; Raake, A. PNATS-UHD-1-Long: An Open Video Quality Dataset for Long Sequences for HTTP-Based Adaptive Streaming QoE Assessment. In Proceedings of the 2023 15th International Conference on Quality of Multimedia Experience (QoMEX), Ghent, Belgium, 20–22 June 2023; pp. 252–257. [Google Scholar]
  6. Ellawindy, I.; Shah Heydari, S. Crowdsourcing Framework for QoE-Aware SD-WAN. Futur. Internet 2021, 13, 209. [Google Scholar] [CrossRef]
  7. Matulin, M.; Mrvelj, Š. Modelling User Quality of Experience from Objective and Subjective Data Sets Using Fuzzy Logic. Multimed. Syst. 2018, 24, 645–667. [Google Scholar] [CrossRef]
  8. Mrvelj, Š.; Matulin, M. Impact of Packet Loss on the Perceived Quality of UDP-Based Multimedia Streaming: A Study of User Quality of Experience in Real-Life Environments. Multimed. Syst. 2016, 24, 33–53. [Google Scholar] [CrossRef]
  9. Madhusudana, P.C.; Yu, X.; Birkbeck, N.; Wang, Y.; Adsumilli, B.; Bovik, A.C. Subjective and Objective Quality Assessment of High Frame Rate Videos. IEEE Access 2021, 9, 108069–108082. [Google Scholar] [CrossRef]
  10. Lin, L.; Zheng, Y.; Chen, W.; Lan, C.; Zhao, T. Saliency-Aware Spatio-Temporal Artifact Detection for Compressed Video Quality Assessment. IEEE Signal Process. Lett. 2023, 30, 693–697. [Google Scholar] [CrossRef]
  11. Uhrina, M.; Bienik, J.; Vaculik, M.; Voznak, M. Subjective Video Quality Assessment of VP9 Compression Standard for Full HD Resolution. In Proceedings of the 2016 International Symposium on Performance Evaluation of Computer and Telecommunication Systems (SPECTS), Montreal, QC, Canada, 24–27 July 2016; pp. 1–5. [Google Scholar]
  12. Chennagiri, P.; Yu, X.; Birkbeck, N.; Wang, Y.; Adsumilli, B.; Bovik, A. LIVE YouTube High Frame Rate (LIVE-YT-HFR) Database. Available online: https://live.ece.utexas.edu/research/LIVE_YT_HFR/LIVE_YT_HFR/index.html (accessed on 3 July 2023).
  13. Madhusudana, P.C.; Birkbeck, N.; Wang, Y.; Adsumilli, B.; Bovik, A.C. Capturing Video Frame Rate Variations via Entropic Differencing. IEEE Signal Process. Lett. 2020, 27, 1809–1813. [Google Scholar] [CrossRef]
  14. Alata, M.; Molhim, M.; Ramini, A. Optimizing-of-Fuzzy-C-Means-Clustering-Algorithm-Using-GA. Int. J. Comput. Electr. Autom. Control. Inf. Eng. 2008, 2, 670–675. [Google Scholar] [CrossRef]
  15. Gupta, P.; Bampis, C.G.; Glover, J.L.; Paulter, N.G.; Bovik, A.C. Multivariate Statistical Approach to Image Quality Tasks. J. Imaging 2018, 4, 117. [Google Scholar] [CrossRef]
  16. Wang, Z.; Bovik, A.C.; Sheikh, H.R.; Simoncelli, E.P. Image Quality Assessment: From Error Visibility to Structural Similarity. IEEE Trans. Image Process. 2004, 13, 600–612. [Google Scholar] [CrossRef]
  17. Wang, Z.; Simoncelli, E.P.; Bovik, A.C. Multiscale Structural Similarity for Image Quality Assessment. In Proceedings of the Thrity-Seventh Asilomar Conference on Signals, Systems & Computers, Pacific Grove, CA, USA, 9–12 November 2003; Volume 2, pp. 1398–1402. [Google Scholar]
  18. Zhang, L.; Zhang, L.; Mou, X.; Zhang, D. FSIM: A Feature Similarity Index for Image Quality Assessment. IEEE Trans. Image Process. 2011, 20, 2378–2386. [Google Scholar] [CrossRef] [PubMed]
  19. Soundararajan, R.; Bovik, A.C. Video Quality Assessment by Reduced Reference Spatio-Temporal Entropic Differencing. IEEE Trans. Circuits Syst. Video Technol. 2013, 23, 684–694. [Google Scholar] [CrossRef]
  20. Bampis, C.G.; Gupta, P.; Soundararajan, R.; Bovik, A.C. SpEED-QA: Spatial Efficient Entropic Differencing for Image and Video Quality. IEEE Signal Process. Lett. 2017, 24, 1333–1337. [Google Scholar] [CrossRef]
  21. Alizadeh, M.; Sharifkhani, M. Subjective Video Quality Prediction Based on Objective Video Quality Metrics. In Proceedings of the 2018 4th Iranian Conference on Signal Processing and Intelligent Systems (ICSPIS), Tehran, Iran, 25–27 December 2018; pp. 7–9. [Google Scholar]
  22. Schiffner, F.; Moller, S. Direct Scaling & Quality Prediction for Perceptual Video Quality Dimensions. In Proceedings of the 2018 Tenth International Conference on Quality of Multimedia Experience (QoMEX), Cagliari, Italy, 29 May–1 June 2018; pp. 1–3. [Google Scholar]
  23. Pinson, M.H.; Choi, L.K.; Bovik, A.C. Temporal Video Quality Model Accounting for Variable Frame Delay Distortions. IEEE Trans. Broadcast. 2014, 60, 637–649. [Google Scholar] [CrossRef]
  24. García-Pineda, M.; Segura-García, J.; Felici-Castell, S. A Holistic Modeling for QoE Estimation in Live Video Streaming Applications over LTE Advanced Technologies with Full and Non Reference Approaches. Comput. Commun. 2018, 117, 13–23. [Google Scholar] [CrossRef]
  25. Lebreton, P.; Kawashima, K.; Yamagishi, K.; Okamoto, J. Study on Viewing Time with Regards to Quality Factors in Adaptive Bitrate Video Streaming. In Proceedings of the 2018 IEEE 20th International Workshop on Multimedia Signal Processing (MMSP), Vancouver, BC, Canada, 29–31 August 2018; pp. 1–6. [Google Scholar]
  26. Ghadiyaram, D.; Pan, J.; Bovik, A.C. A Subjective and Objective Study of Stalling Events in Mobile Streaming Videos. IEEE Trans. Circuits Syst. Video Technol. 2019, 29, 183–197. [Google Scholar] [CrossRef]
  27. Wang, C. IPTV Video Perception Quality Based on Packet Loss Distribution. In Proceedings of the 2023 3rd International Conference on Consumer Electronics and Computer Engineering (ICCECE), Guangzhou, China, 6–8 January 2023; pp. 502–506. [Google Scholar]
  28. Bampis, C.G.; Li, Z.; Katsavounidis, I.; Bovik, A.C. Recurrent and Dynamic Models for Predicting Streaming Video Quality of Experience. IEEE Trans. Image Process. 2018, 27, 3316–3331. [Google Scholar] [CrossRef]
  29. Bampis, C.G.; Krasula, L.; Li, Z.; Akhtar, O. Measuring and Predicting Perceptions of Video Quality Across Screen Sizes with Crowdsourcing. In Proceedings of the 2023 15th International Conference on Quality of Multimedia Experience (QoMEX), Ghent, Belgium, 20–22 June 2023; pp. 13–18. [Google Scholar]
  30. Xian, W.; Chen, B.; Fang, B.; Guo, K.; Liu, J.; Shi, Y.; Wei, X. Effects of Different Full-Reference Quality Assessment Metrics in End-to-End Deep Video Coding. Electronics 2023, 12, 3036. [Google Scholar] [CrossRef]
  31. Zhou, W.; Min, X.; Li, H.; Jiang, Q. A Brief Survey on Adaptive Video Streaming Quality Assessment. J. Vis. Commun. Image Represent. 2022, 86, 103526. [Google Scholar] [CrossRef]
  32. Kim, W.; Kim, J.; Ahn, S.; Kim, J.; Lee, S. Deep Video Quality Assessor: From Spatio-Temporal Visual Sensitivity to A Convolutional Neural Aggregation Network. In Proceedings of the European Conference on Computer Vision (ECCV), Glasgow, UK, 23–28 August 2018. [Google Scholar]
  33. Ghosh, M.; Singhal, C. MO-QoE: Video QoE Using Multi-Feature Fusion Based Optimized Learning Models. Signal Process. Image Commun. 2022, 107, 116766. [Google Scholar] [CrossRef]
  34. Banjanin, M.K.; Stojčić, M.; Danilović, D.; Ćurguz, Z.; Vasiljević, M.; Puzić, G. Classification and Prediction of Sustainable Quality of Experience of Telecommunication Service Users Using Machine Learning Models. Sustainability 2022, 14, 17053. [Google Scholar] [CrossRef]
  35. Nguyen, D.; Pham Ngoc, N.; Thang, T.C. QoE Models for Adaptive Streaming: A Comprehensive Evaluation. Futur. Internet 2022, 14, 151. [Google Scholar] [CrossRef]
  36. Gao, Y.; Min, X.; Zhu, Y.; Zhang, X.-P.; Zhai, G. Blind Image Quality Assessment: A Fuzzy Neural Network for Opinion Score Distribution Prediction. IEEE Trans. Circuits Syst. Video Technol. 2023, 1, 1–16. [Google Scholar] [CrossRef]
  37. Yu, X.; Ying, Z.; Birkbeck, N.; Wang, Y.; Adsumilli, B.; Bovik, A.C. Subjective and Objective Analysis of Streamed Gaming Videos. IEEE Trans. Games 2023, 1–14. [Google Scholar] [CrossRef]
  38. Cao, Y.; Min, X.; Sun, W.; Zhai, G. Subjective and Objective Audio-Visual Quality Assessment for User Generated Content. IEEE Trans. Image Process. 2023, 32, 3847–3861. [Google Scholar] [CrossRef]
  39. Da, P.; Song, G.; Shi, P.; Zhang, H. Perceptual Quality Assessment of Nighttime Video. Displays 2021, 70, 102092. [Google Scholar] [CrossRef]
  40. Ramachandra Rao, R.R.; Göring, S.; Raake, A. AVQBits—Adaptive Video Quality Model Based on Bitstream Information for Various Video Applications. IEEE Access 2022, 10, 80321–80351. [Google Scholar] [CrossRef]
  41. Lodha, I. Subjective and No-Reference Quality Metric of Domain Independent Images and Videos. Comput. Graph. 2021, 95, 123–129. [Google Scholar] [CrossRef]
  42. Mackin, A.; Zhang, F.; Bull, D.R. A Study of Subjective Video Quality at Various Frame Rates. In Proceedings of the 2015 IEEE International Conference on Image Processing (ICIP), Quebec City, QC, Canada, 27–30 September 2015; pp. 3407–3411. [Google Scholar]
  43. MSU Graphics & Media Lab. MSU Quality Measurement Tool. Available online: https://www.compression.ru/video/quality_measure/ (accessed on 3 August 2023).
  44. Mukherjee, D.; Han, J.; Bankoski, J.; Bultje, R.; Grange, A.; Koleszar, J.; Wilkins, P.; Xu, Y. A Technical Overview of VP9—The Latest Open-Source Video Codec. In Proceedings of the SMPTE 2013 Annual Technical Conference & Exhibition, Hollywood, CA, USA, 22–24 October 2013; pp. 1–17. [Google Scholar]
  45. ITU-R. Methodology for the Subjective Assessment of the Quality of Television Pictures, Document ITU-R Recommendation BT.500-11. 2000. Available online: https://www.itu.int/rec/R-REC-BT.500-11-200206-S/en (accessed on 15 July 2023).
  46. Zadeh, L.A. Fuzzy Sets. Inf. Control 1965, 8, 338–353. [Google Scholar] [CrossRef]
  47. Bezdek, J.C.; Ehrlich, R.; Full, W. FCM: The Fuzzy c-Means Clustering Algorithm. Comput. Geosci. 1984, 10, 191–203. [Google Scholar] [CrossRef]
  48. Ishibuchi, H.; Yamamoto, T. Rule Weight Specification in Fuzzy Rule-Based Classification Systems. IEEE Trans. Fuzzy Syst. 2005, 13, 428–435. [Google Scholar] [CrossRef]
  49. Ross, T.J. Fuzzy Logic with Engineering Applications, 4th ed.; Wiley: Hoboken, NJ, USA, 2016. [Google Scholar]
  50. Zhang, F.; Mackin, A.; Bull, D.R. A Frame Rate Dependent Video Quality Metric Based on Temporal Wavelet Decomposition and Spatiotemporal Pooling. In Proceedings of the 2017 IEEE International Conference on Image Processing (ICIP), Beijing, China, 17–20 September 2017; pp. 300–304. [Google Scholar]
  51. Netflix VMAF—Video Multi-Method Assessment Fusion. Available online: https://github.com/Netflix/vmaf (accessed on 12 August 2023).
Figure 1. Extracted frames from the sequences of the LIVE-YT-HFR database: (a) a person running; (b) three persons running; (c) a person doing flips; (d) runners jumping hurdles; (e) a long-jump video; (f) a bobblehead spinning; (g) a shelf filled with books; (h) underwater ball bounce; (i) two persons passing a ball; (j) a street cyclist; (k) a hamster running a wheel; (l) a lamppost in a park; (m) falling leaves; (n) a spinning top; (o) underwater bubbles; (p) water waves splashing.
Futureinternet 15 00295 g001
Figure 2. Results of the FCM clustering. For each input variable, three fuzzy clusters were used. (a) Video FPS cluster names: low, medium, and high frame rate; (b) Video CRF cluster names: low, medium, and high compression; (c) SI cluster names: low, medium, and high complexity; (d) TI cluster names: low, medium, and high frame diversity.
Futureinternet 15 00295 g002
Figure 3. Membership functions of our fuzzy clusters. (a) Video FPS; (b) Video CRF; (c) SI; (d) TI.
Futureinternet 15 00295 g003
Figure 4. Membership functions that describe the fuzzy output.
Futureinternet 15 00295 g004
Figure 5. FIS block diagram of the FLAME-VQA model.
Futureinternet 15 00295 g005
Figure 6. Comparison of the MOS values between the model output and: (a) training dataset; (b) test dataset; (c) complete dataset.
Futureinternet 15 00295 g006
Figure 7. Three-dimensional views of the model’s output in correlation with a pair of input parameters: (a) Video CRF and Video FPS; (b) Video FPS and Video TI.
Futureinternet 15 00295 g007
Table 1. Properties of the membership functions of the input and output parameters. For the input parameters, the Gauss2 types of functions were used; hence, their properties are listed as (sigma1, mean1, sigma2, mean2). For the output parameter, conventional Gauss functions were used; hence, their properties are listed as (sigma, mean).
Model ParameterFuzzy ClusterFunction Type and Properties
Video FPSHigh frame rateGauss2: (11, 111, 1 121)
Medium frame rateGauss2: (13, 72.94, 11, 72.94)
Low frame rateGauss2: (−1, −1, 13, 27.64)
Video CRFHigh compressionGauss2: (2.8, 59.13, 1, 64)
Medium compressionGauss2: (9.5, 37.17, 2.7, 50)
Low compressionGauss2: (−1, −1, 9.5, 2.67)
Video SIHigh complexityGauss2: (2.5, 50.07, 1, 81)
Medium complexityGauss2: (4.9, 41.84, 2.5, 41.84)
Low complexityGauss2: (−1, −1, 5.5, 22.17)
Video TIHigh frame diversityGauss2: (12.8, 131.7, 1, 226)
Medium frame diversityGauss2: (11, 77.94, 16, 77.94)
Low frame diversityGauss2: (−1, −1, 12, 38.18)
MOSBadGauss: (3, 0)
PoorGauss: (3, 10)
FairGauss: (3, 20)
GoodGauss: (3, 30)
ExcellentGauss: (3, 40)
Table 2. The evaluation of the predictive performance of the model.
MetricTraining DataTest DataComplete Dataset
R20.8270.74470.8253
MSE8.781913.62138.7605
RMSE2.96343.69072.9598
SROCC0.89770.84550.8961
PCC0.90960.86320.9086
Table 3. Comparison of performance of our fuzzy logic-based model (FLAME-VQA, on the complete dataset) with state-of-the-art models on the LIVE-YT-HFR dataset. The best and the second-best values in each column are marked in boldface.
Model NameSROCCPCC
PSNR0.6950.6685
SSIM [16]0.44940.4526
MS-SSIM [17]0.48980.4673
FSIM [18]0.52510.5008
ST-RRED [19]0.55310.5107
SpEED [20]0.48610.4449
FRQM [50]0.42160.452
VMAF [51]0.73030.7071
DeepVQA [32] 0.34630.3329
GSTI [13]0.79090.791
AVQBits|M3 [40]0.71180.7805
AVQBits|M1 [40]0.48090.5528
AVQBits|M0 [40]0.49470.5538
AVQBits|H0|s [40]0.73240.7887
AVQBits|H0|f [40]0.6740.7242
FLAME-VQA0.89610.9086
Disclaimer/Publisher’s Note: The statements, opinions and data contained in all publications are solely those of the individual author(s) and contributor(s) and not of MDPI and/or the editor(s). MDPI and/or the editor(s) disclaim responsibility for any injury to people or property resulting from any ideas, methods, instructions or products referred to in the content.

