1. Introduction
The advancement of the Internet of Things (IoT) has paved the way for new requirements for smart cities. This can be represented by a flexible/adaptable operation and an efficient data monitoring system for various real-world applications that may differ in the degree of mobility and performance quality, such as environmental monitoring and intelligent transportation in a smart city [
1,
2]. IoT-based wireless sensor network (WSN) events may, to some extent, lack flexible network operations, such as dynamic network events that are transient and require a real-time adaptive process. The flexible orchestration and reorchestration of such demanding dynamic networks plays an important role in monitoring the operation of the dynamic physical environment. Newer data gathering methods, processing, and communication frameworks can be arranged to accomplish effective and intelligent process management based on distinct physical process requirements. In this sense, a cloud-based architecture is a potential solution, as it includes a plethora of software-based computational capabilities, such as virtualization, data and knowledge repositories, and more involved operational and analytical tools [
3,
4]. Virtualization and softwarization are significant components of cloud architecture in this context, as they contribute to network flexibility of certain applications such as vehicular networks (VNs) and can address issues associated with reactions to any operational events [
5]. As a means to achieve this, an intelligent, self-organizing network structure, such as VNs and WSN ground networks seen in forests, can be used to enable rapid response, with the topology reorchestrated by software definition. This can be aligned with advances made in software-defined networking (SDN) when operating various operational network phases, such as self-healing mechanisms. This, in turn, encourages the conceptual development of software-defined wireless sensor networks (SDWSN), in which WSN functions are softwarized and integrated into the network. The three core functionalities are represented by the terms “leaf sensor node”, “router node”, and “IoT gateway node”, which can be modelled and tested on a virtual platform before physical deployment [
6]. Herein, cloud-based virtualization is used to develop and provide specified functional configuration parameters to physical nodes. As a result, the cloud can assist with performance analysis via the virtual unit, where possible reorchestration of network behavior can be deployed and tested prior to real-world implementation, paving the way for the cyber–physical system [
7,
8,
9].
This paper intends to focus on generic and adaptive testbed scenarios that can be used in a variety of advanced IoT applications. Herein, we shed more light on the subtleties of general design features of the IoT architecture, where a software-based virtual model can support physical network configuration prior to hardware implementation. The virtual platform represented by the Contiki Cooja network simulator also supports the softwarization concept utilized in this paper by offering the software specifications of the WSN nodes. Furthermore, it offers a network testing environment prior to actual network implementation using Texas Instruments CC2538 (TI CC2538) hardware. Herein, the Contiki firmware is used with both the Cooja tool and the TI CC2538. Mainly, in this paper, we aim to highlight and cover the components involved in the physical network (i.e., testbed) for any form of application. Furthermore, the paper explores use cases for dynamic and stationary networks, as well as how the suggested testbed could support various applications. The physical network implementation is evaluated in this paper as based on the suggested use cases wherein a virtual model is built and tested prior to hardware implementation. To examine the validity of having a virtual model testing in advance, virtual and physical network metrics such as network capacity and performance measures such as packet loss are employed. The proposed system looks into the design from the perspective of virtual and physical network parameters to offer an attempt towards interoperability.
The main contributions of this work are summarized as follows:
Applying the concepts of “SDWSN” and “virtualization” to dynamic and stationary networks for various IoT applications such as vehicular networks and environmental monitoring systems. Such networks can be designed and tested on a virtual platform with a variety of functional capabilities to offer network flexibility. A network with nodes that can act as leaf and/or gateway functions, for example, can support the network in rapidly responding to any event through the multiple functions embedded in the nodes.
Proposing a physical testbed with hardware components that use the same virtual network codes. The technique is a cost-effective solution since it takes advantage of virtual testing to test, evaluate, and recover from networks failures.
The key components for the leaf node and the coordinator node (i.e., router or cluster head) such as the communication rate are discussed, mirroring the core aspects employed in the virtual platform. This interactive collaboration between virtualization and physical implementation can support the efficient operation of networks such as dynamic networks. This paper delves into the aspects of physical network implementation design, including the number of nodes, sensing variables, and mobility. The RSSI sensing variable is utilized for the test, as it can represent the relative mobility of the nodes with the cluster depending on the communication quality. Also, the collected RSSI values based on node mobility can be utilized for detecting the possible failure/departure of a node from its related cluster based on its distance. This can be used by the virtual network to provide the best network reorchestration service when needed. The testing scenarios are designed to evaluate the capacity of the coordinator node based on scalability and sampling rate in terms of packet loss.
The remainder of this paper is structured as follows:
Section 2 discusses the state-of-the-art and related work.
Section 3 presents the system model.
Section 4 evaluates the testbed based on the proposed use cases. Finally, in
Section 5, the conclusion of this work is discussed.
2. Related Work
The system architecture and design criteria for real-world applications such as health and environmental monitoring were evaluated in relation to the WSN testbed. Several researchers have highlighted key testbed elements that can be customized to design specifications, such as hardware deployment capabilities [
10,
11,
12,
13,
14]. Some researchers have emphasized the use of different hardware components such as Raspberry Pi and Arduino [
15], as well as use cases such as sensor node distribution for environmental applications.
Considering a use case of data collection from scattered traps on the ground in New Zealand, the forest vegetation region is separated into four parts based on [
16] (Claverley, North Taupo, Leader Valley, Purakaunui). At these four sites, the density of effective traps ranges from two to four traps per hectare. The spacing between traps varies based on the species targeted, according to the New Zealand Department of Conservation [
17], and it determines the distance between traps in a trap line for rats, stoats, and possums. According to [
17], the initial spacing between possum traps is 20 to 40 m, but can be expanded to 100 m if possum population is low. The work in [
18] used 108 brushtail possum monitoring sites to estimate possum occupancy rates in wildlife, and the transect of traps is recognized at a distance of 200 m apart. Therefore, the distance between possum traps needs to be specified. At the node level, trap sensors capture field-level data before sending them to the central gateway via entry points such as unmanned aerial vehicles (UAVs).
According to Faiçal et al. [
19], the embedded hardware collects and processes data from each sensor using the Raspberry Pi single-board computer as a gateway. The work in [
20] employed ultralow-power TelosB nodes as ground sensor nodes distributed in the field to improve accuracy when spraying pesticides while lowering the risk of human exposure to these products. To reduce energy consumption, a precise and scalable data gathering scheme was designed to enable long-distance communication at low bitrates. In [
21,
22], the authors employed an Arduino-based data collection implementation for both WSN and UAV, as well as a Raspberry Pi at the base station to collect environmental data.
Owing to the high cost and risk of damage associated with hardware testing without prior operational and functional network design, virtualization has long been a widely accepted solution for performing software-based simulation testing and obtaining adaptations for use in physical networks. Efficient use of underlying physical functions is mainly achieved by abstracting them into logical or virtual functions [
23]. Software-driven virtualization offers a testing ground for conducting and analyzing soft trials of network scenarios, such as dynamic behavior. Such parallel co-simulation running in the cloud backend can significantly aid in leaning out the network configuration process by means of obviating the hardware requirement (during the testing process). For example, the network simulator Contiki Cooja was adopted as a virtualization platform for certain target hardware (Motes such as TI CC2538 Evaluation Module) [
24]. Acharyya et al. [
24] emphasized the importance of virtualization in driving towards a flexible IoT-based WSN organization. Herein, by accessing real physical data for the purpose of modelling and simulating virtual networks, the organization herein benefited from improved flexibility and reduced latency by deriving appropriate feedback generated by the virtualization unit. Cloud-based virtualization has been adopted to plan and test various WSN reorchestration scenarios when a dynamic event occurs prior to actual implementation. Network performance (i.e., packet loss, network downtime, etc.) can be analyzed so that the most appropriate reorchestration structure can be applied to the physical network [
3,
25]. This can support flexible network operation and lessen the impact of unexpected network behavior [
7].
Concepts such as SDN and network virtualization necessitate the use of tools that can model and test the capability of a network to be tested on a virtual platform before the actual implementation to avoid any major adjustments that need to be conducted in a physical network structure. Furthermore, dealing with the virtualization platform can facilitate dynamic planning for possible network reorchestration as demanded. The Contiki Cooja virtualization (network simulator) tool [
26] was utilized in the works of [
24,
25,
27,
28] to reflect some of the mentioned ideologies. Furthermore, with Cooja acting as a virtualization platform, virtual nodes are created by compiling and configuring the same Contiki operating system firmware that is used to configure the actual targeted hardware platform of the Texas Instruments CC2538 sensor nodes. From utilizing the tool for a given application point of view, Karegar et al. [
29] proposed a point-by-point air-to-ground communication system that considers the clustering structure for partitioning the ground network into small clusters of sensor nodes distributed over large spaces, through which efficient communication between sensor nodes and a UAV is supported. Herein, the UAV path flight was relaxed by using the possible dynamics in WSN orchestrations, as suggested in the approach. The Contiki Cooja simulator was utilized to establish a communication dialogue between the UAV and the ground WSN, the communication planning method being based on the distance between the sensor nodes and the UAV highlighted by the RSSI measurements.
From the compatibility of the suggested system’s point of view, the proposed system model offers interoperable compatibility between the virtual and physical system models. The method’s characteristic in [
30] is based on defining a range called compatibility rate that can decide the level of strictness and abstractness of the design, embracing SOA (service-oriented architecture) as the base of concept. This can help a service designer to decide on the level of strictness and abstractness of the design by adjusting the compatibility rate. Therefore, this method reduces the effort and time required for designing an IoT service. Our method is also based on designing dynamic and interoperable architecture once and applying that to multiple use cases due to offering flexibility of network orchestration adaptation based on the use case requirements. The proposed network adaptation capability offers full compatibility for the proposed system model.
Also, authors in [
31] used an interpretable architecture to offer communication among the SensorThings API and web processing service, enabling interconnection among environmental sensors, data, and applications. Although this integration may offer real-time access to sensor observations simulation results, it lacks the virtualization capabilities that enables a network testing environment prior to physical network implementation.
In summary, limited information is available pertaining to the generic design of a general-purpose testbed to support various applications ranging from low performance to high performance. Furthermore, the various states of network mobility and connectivity can influence the continual data flow relevant to the different applications. Although significant efforts have been made to develop WSN testbed schemes, the real-time configurability of modules that affect system performance, such as ground communication cost and packet delivery rate, as well as network parameters such as node capacity, has received less attention.
3. System Model
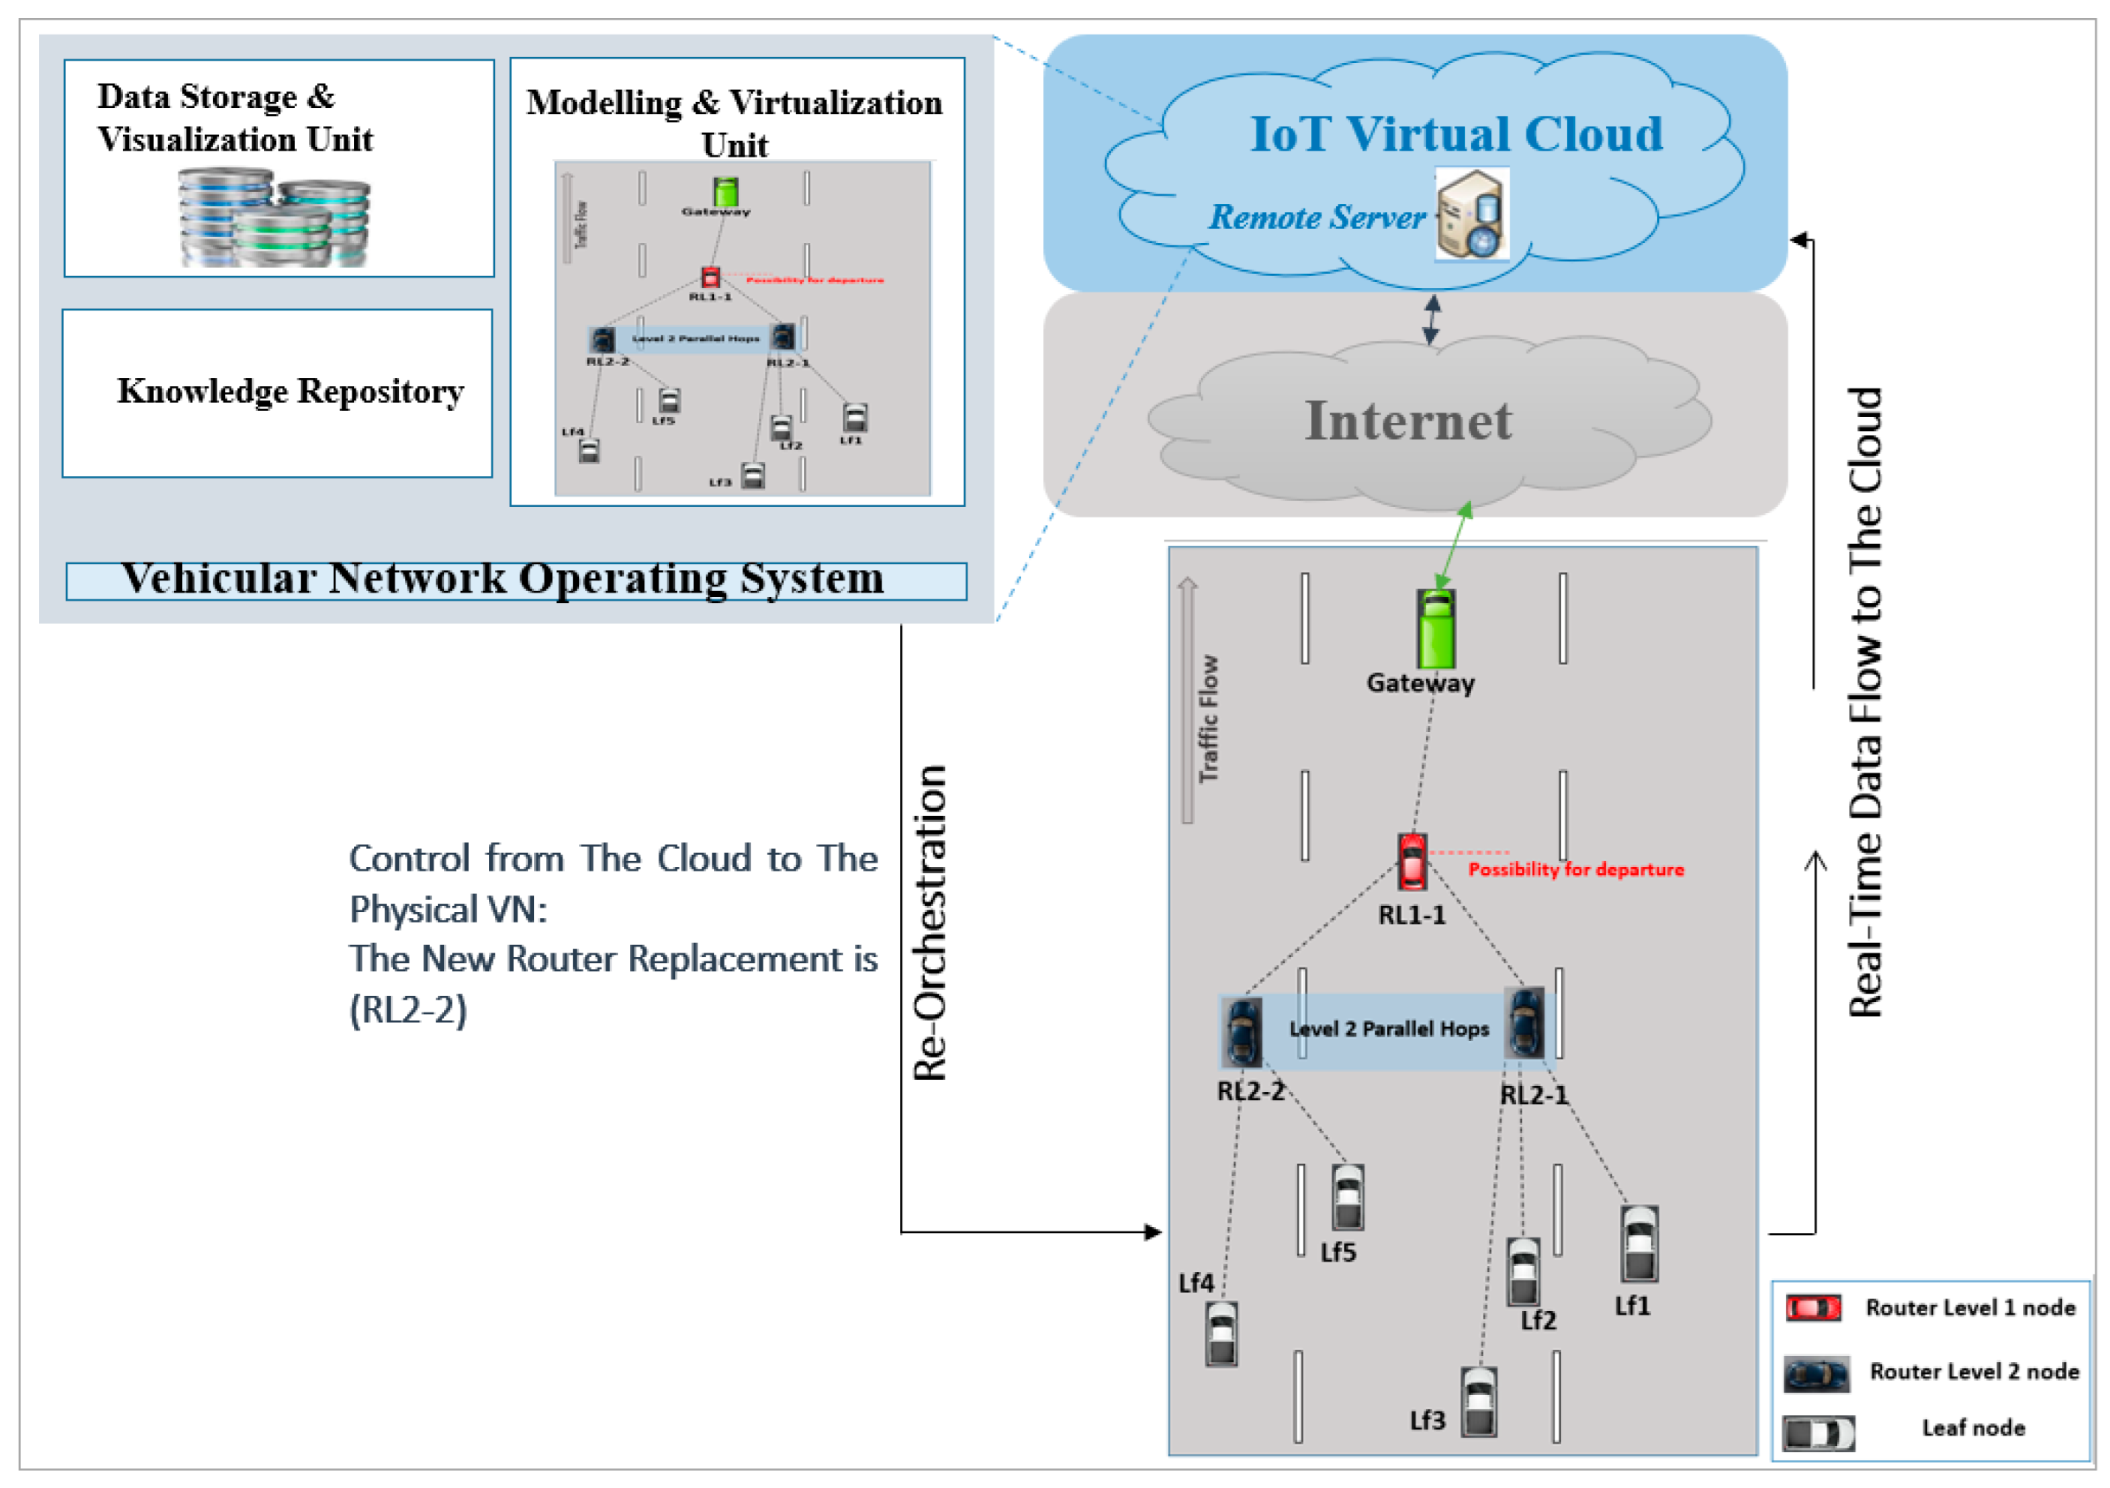
IoT-based WSN system architecture can be looked at based on the sensor node layer, the gateway layer, and the cloud layer. Each tier/layer of the system can offer solutions to the overall challenges of a given application while also making the system more robust and scalable. For instance, cloud interaction with the physical WSN can be utilized to explore future operational improvements with various software scenarios using virtualization, historical data, and learning methods. Considering a vehicular network (VN)-related application as an example,
Figure 1 shows the cloud-based architecture for a vehicular network, where the physical network of vehicles updates the cloud with data for real-time monitoring and reorchestration purposes. The acquired data from the physical VN is stored in the cloud database offered by the data storage unit, where access to historical real vehicle data is available. These data can be monitored and analyzed based on the knowledge repository to identify any changes in the data pattern and thus the possibility of dynamic change within the network. Therefore, the virtual platform and software resources are employed to respond to an event that necessitates network reorchestration. The virtual model implemented using the Contiki Cooja simulator tool offers the corresponding orchestration and reorchestration via the softwarization of the nodes involved in the network. The figure also reflects the possibility of a node departure and the cloud’s response to that event via the flow of control data to the physical network.
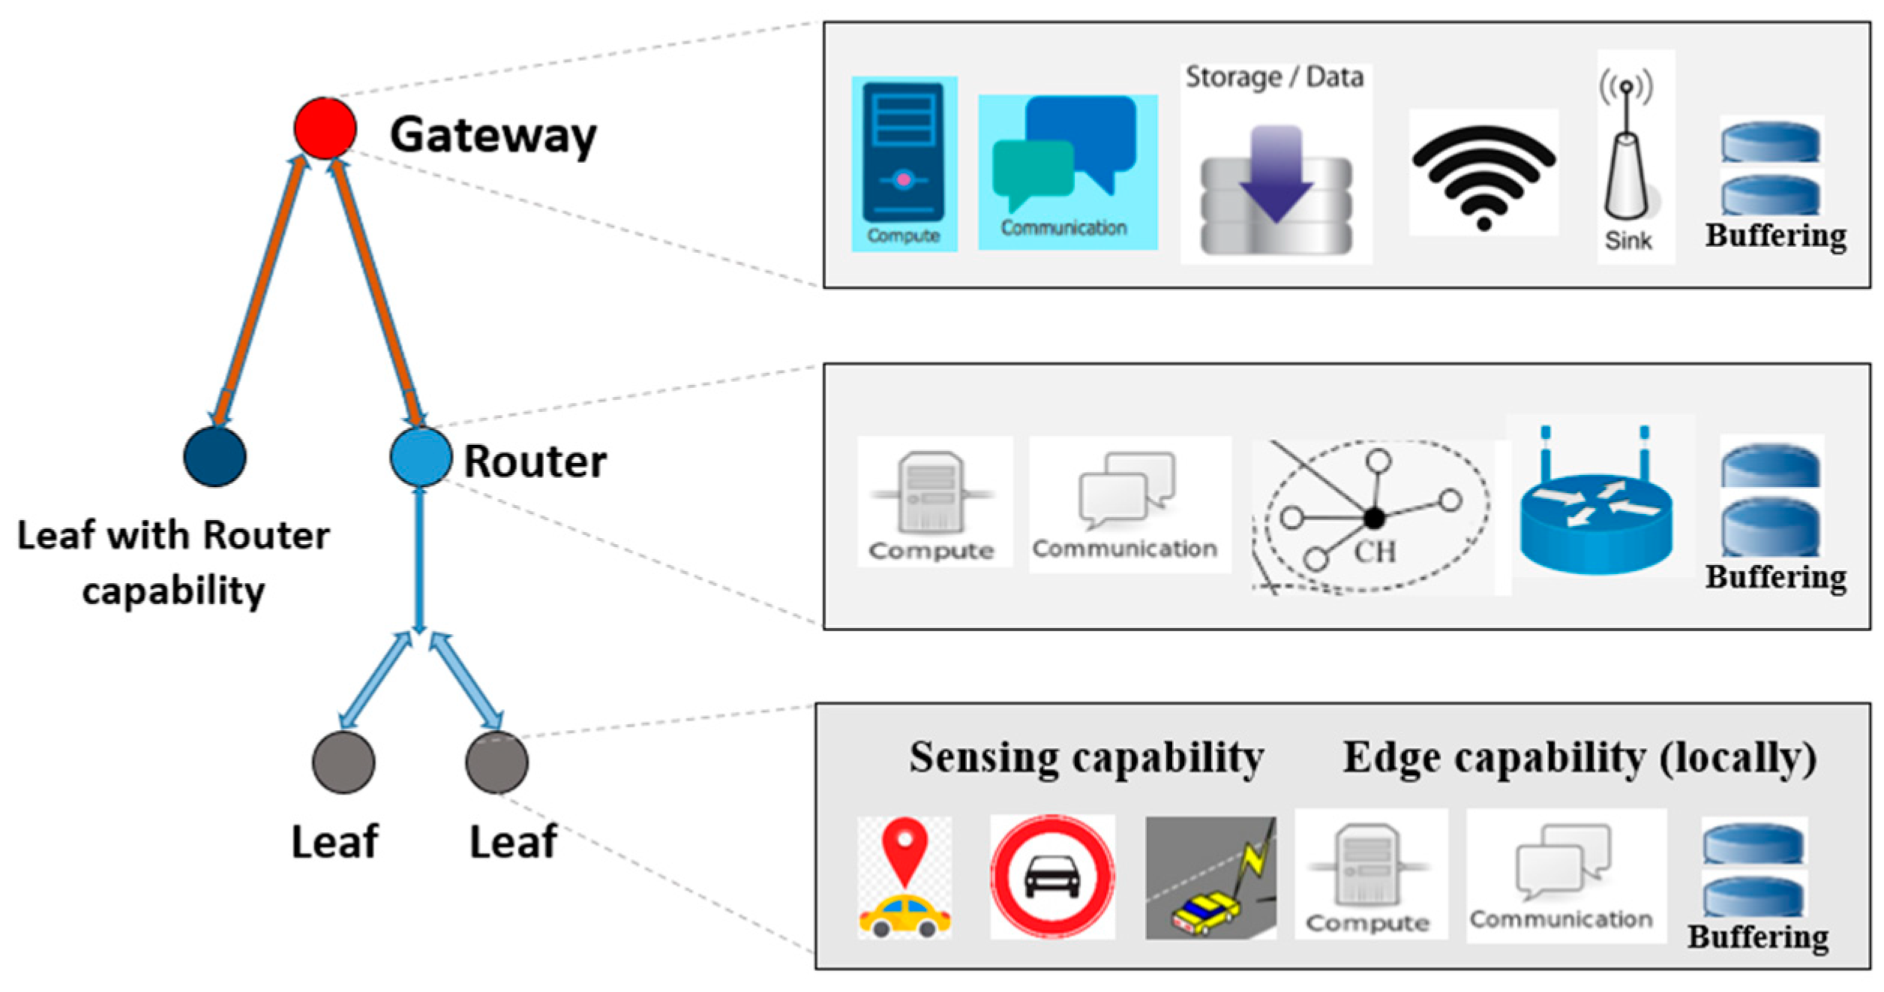
From the WSN’s point of view, the nodes in our approach can generally be configured with one or more functions. This functional configuration is basically a software component/module. This module is used to configure a specific physical sensor node by enabling the associated hardware libraries. The activities of these functions are presented in
Figure 2.
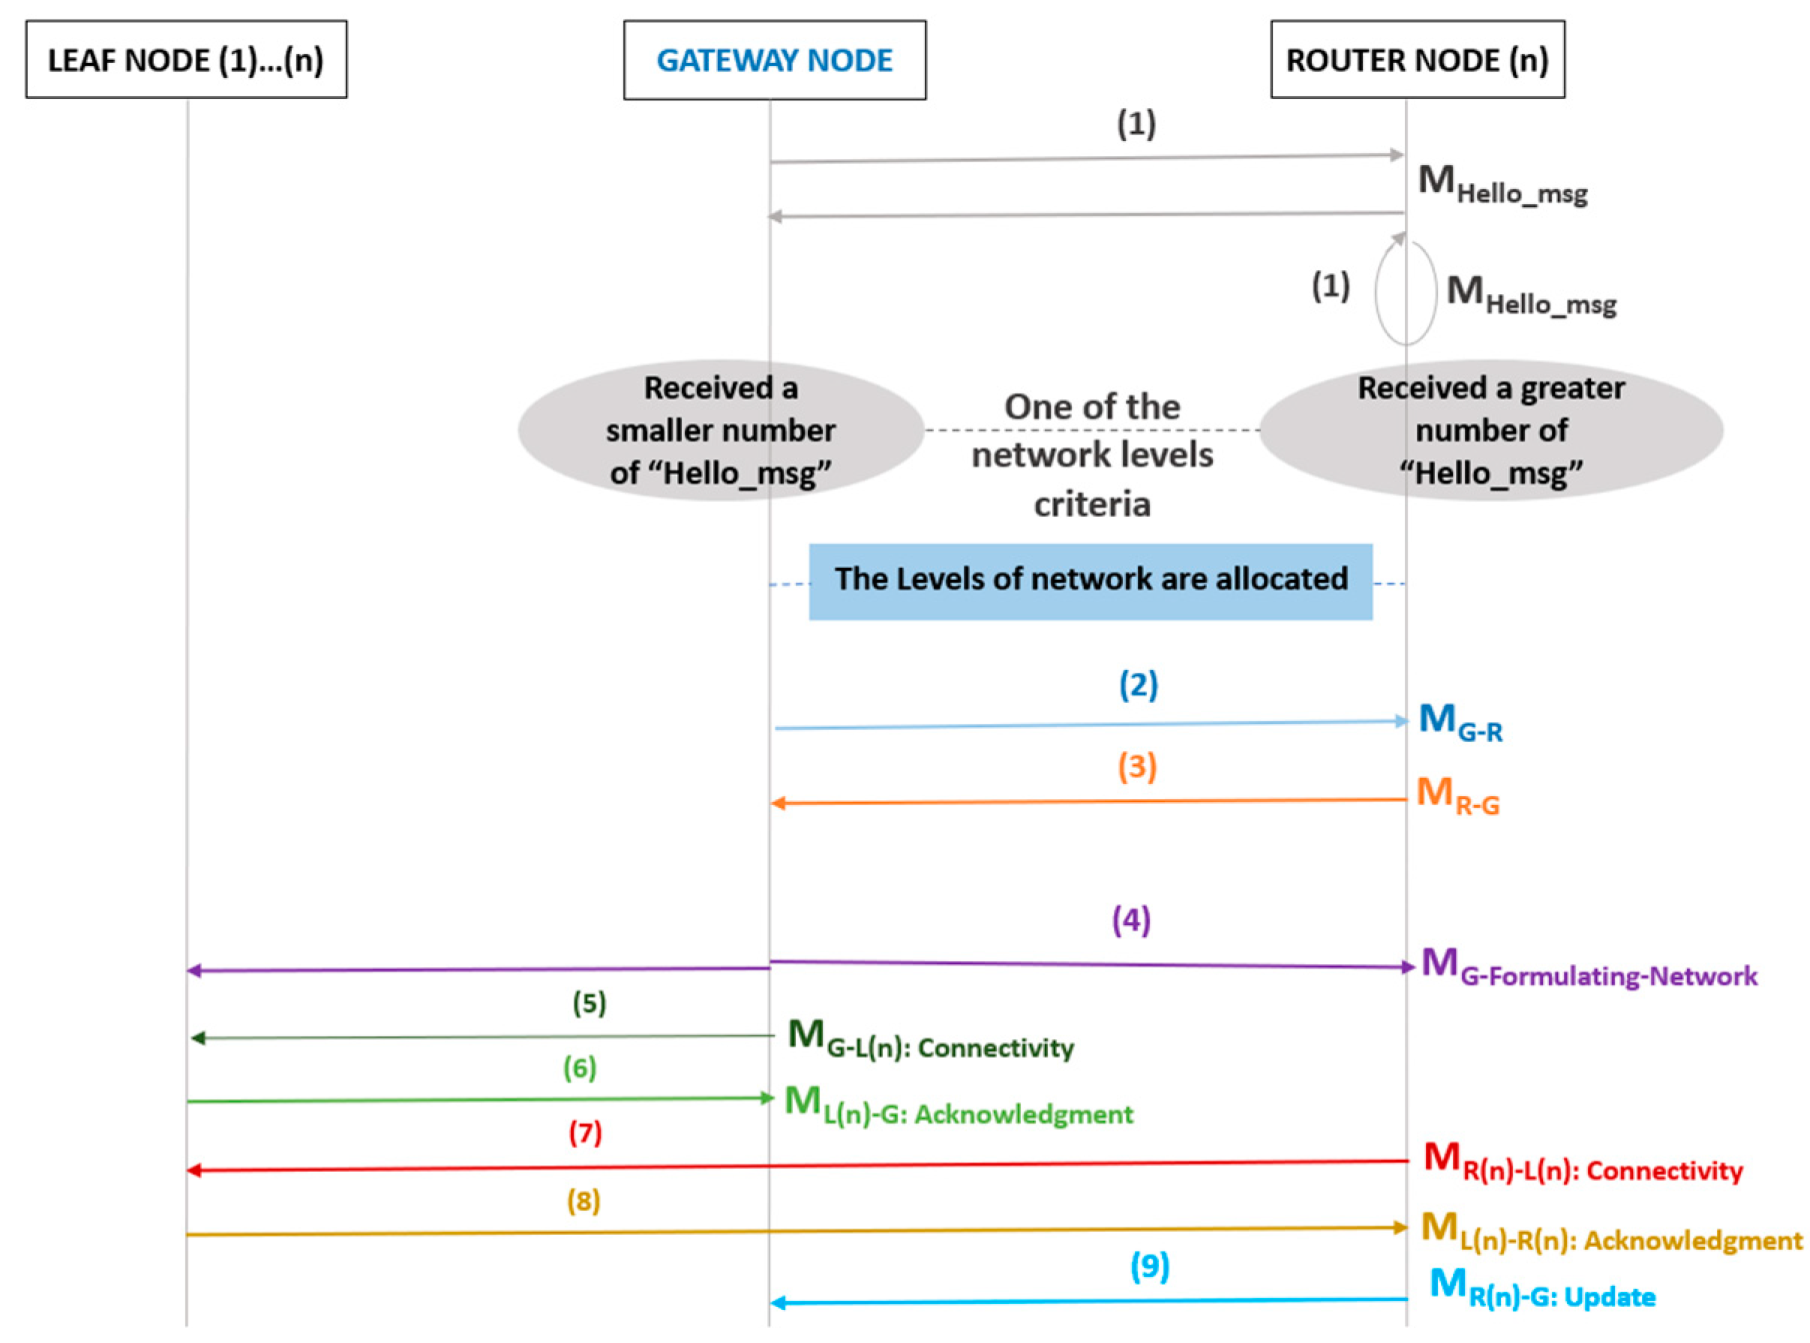
From the communication dialogue that is based on the role/function of the node’s point of view, the exchanged data between the nodes can result in the formulation of a star or tree structure depending on the use case. In one of our previous works [
7], we presented the communication messages for a self-healing vehicular network. In this paper, we present a general communication dialogue to serve the virtual model as well as the physical network implementation. The roles and communication messages of the participating functional nodes are displayed in a sequence diagram, as illustrated in
Figure 3. These are provided in detail as the following:
To avoid the broadcasting storm in the network, the nodes with routers (coordinator and/or gateway functions) within the LOS (line of sight) can be communicated with to formulate the star or layer(s) of tree structure in some use cases. These nodes are a beacon for message (1), MHello_msg, which is a data message that contains the node ID, node type/function, RSSI, etc. Based on these parameters and the number of received “Hello_msg” prompts, the network levels/hops can be allocated.
Upon allocation of roles to the nodes, the gateway node disseminates message (2), MG-R, to the router/coordinator node(s) within the LOS. This is an announcement message that indicates the allocation of the gateway node based on the number of received messages.
The other routers within the LOS disseminate message (3), MR-G (acknowledgment), to the gateway node.
Then, the gateway node disseminates a network formation to the other nodes that are connected it. The network structure could be a star or tree depending on the type of function of the nodes within the transmission range. The message is (4), MG-Formulating-Network.
After establishing the hierarchy of the network, the leaf node(s) can select its connection based on parameters of RSSI and number of connections that the router/gateway can have/already have. For this step, load balancing is required.
The gateway node disseminates connectivity message (5), MG-L(n): Connectivity, for the unconnected leaf nodes within the LOS. Herein, based on the criteria, the eligible leaf nodes for connectivity send the acknowledgment message (6), ML(n)-G: Acknowledgment.
The same procedure can be applied for the router/coordinator nodes in connecting to the other leaf nodes, which can discover better connectivity with those nodes. The messages MR-L(n): Connectivity, ML(n)-R: Acknowledgment are the related messages (7) and (8), respectively.
As the gateway node is the group head, the other router nodes need to reference or update the gateway with its new connections. Message (9), MR(n)-G: Update, is for the connectivity update.
The physical WSN testbed is designed to showcase various use cases that can validate the virtual testing available in our earlier works. The testbed for scenarios such as dynamic events and network capacity (size) is highlighted with the use of TI CC2538 due to its alignment with the virtual network, while scenarios such as node distribution with a focus on dual protocols have been seen to be aligned with components such as the TI CC1352R. The use cases as well as the general components of the testbed are further explained in this section.
3.1. The Key Hardware Components for Physical Testbed
The hardware, which represents the physical nodes within the physical network, plays an important role in supporting a given ideology and offering a testing environment for the network. The components that are generally used in testbed design to reflect various use cases and network scenarios are described in the next subsections.
3.1.1. Texas Instruments CC2538 Sensor Nodes
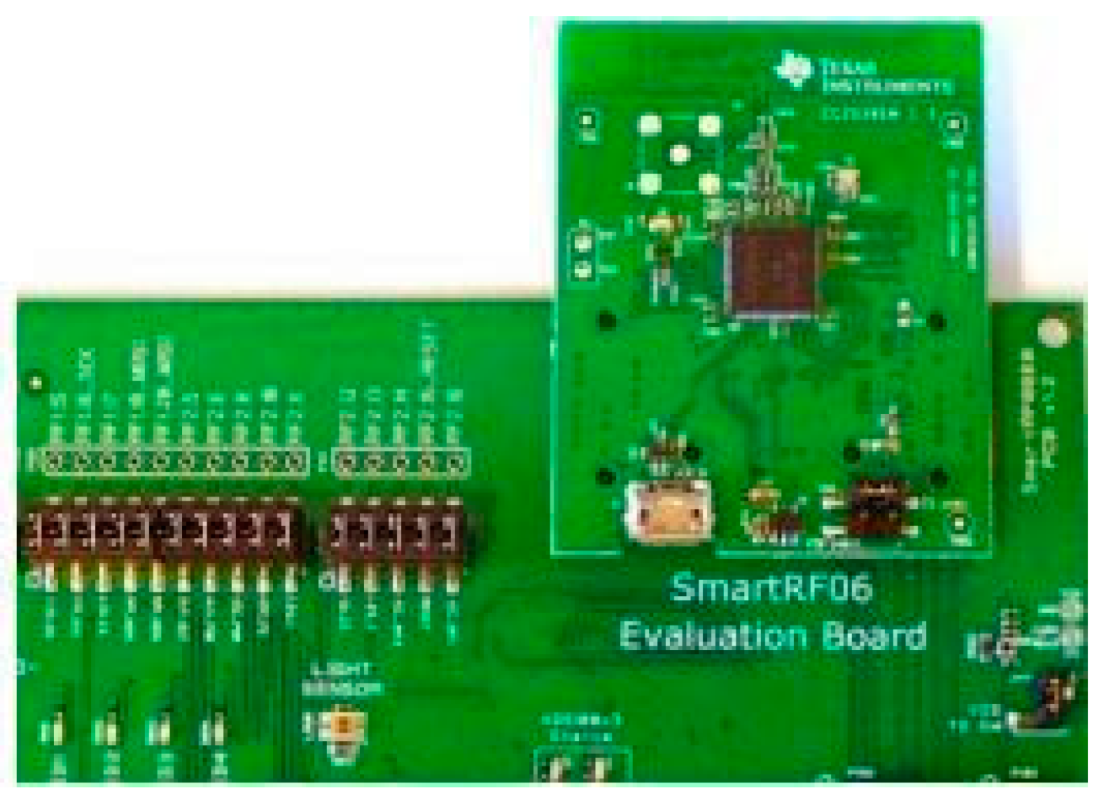
Texas Instruments CC2538 (TI CC2538) wireless transceiver chips consist of on-chip temperature and received signal strength indicator (RSSI) sensors to collect and transmit real-world data. It is an advanced chip with IP configurability. The CC2538 EM is used in conjunction with the SmartRF 06 evaluation board, as shown in
Figure 4, for programming purposes, consisting of two on-board sensors for the accelerometer and ambient light sensor. These sensing features, together with the flexibility to configure the TI boards with the same code used for the Cooja simulation motes (i.e., the virtual platform), offer advantages to a variety of use cases wherein network performance can be tested prior to testbed implementation.
These sensor nodes can be configured with either sensing, routing, or/and gateway functionalities through the Contiki IDE. The C code for hardware configuration “include” the related libraries that enable these chips to be configured, such as “#include ‘cpu.h’”, “#include ‘dev/uart.h’”, “#include ‘dev/adc-sensor.h’”, and “#include ‘dev/sys-ctrl.h’”. Each physical node needs to be assigned a unique ID by accessing the “contiki-conf.h” header file within the Contiki; for example, a coordinator node can have an ID of “0xDA”. A channel can also be assigned to the nodes for the purpose of regulating traffic within the shared communication medium by reading the same header file and assigning one of the available and desired channels to the nodes. As an example, channel 25 can be assigned as “#define CC2538_RF_CONF_CHANNEL 25”.
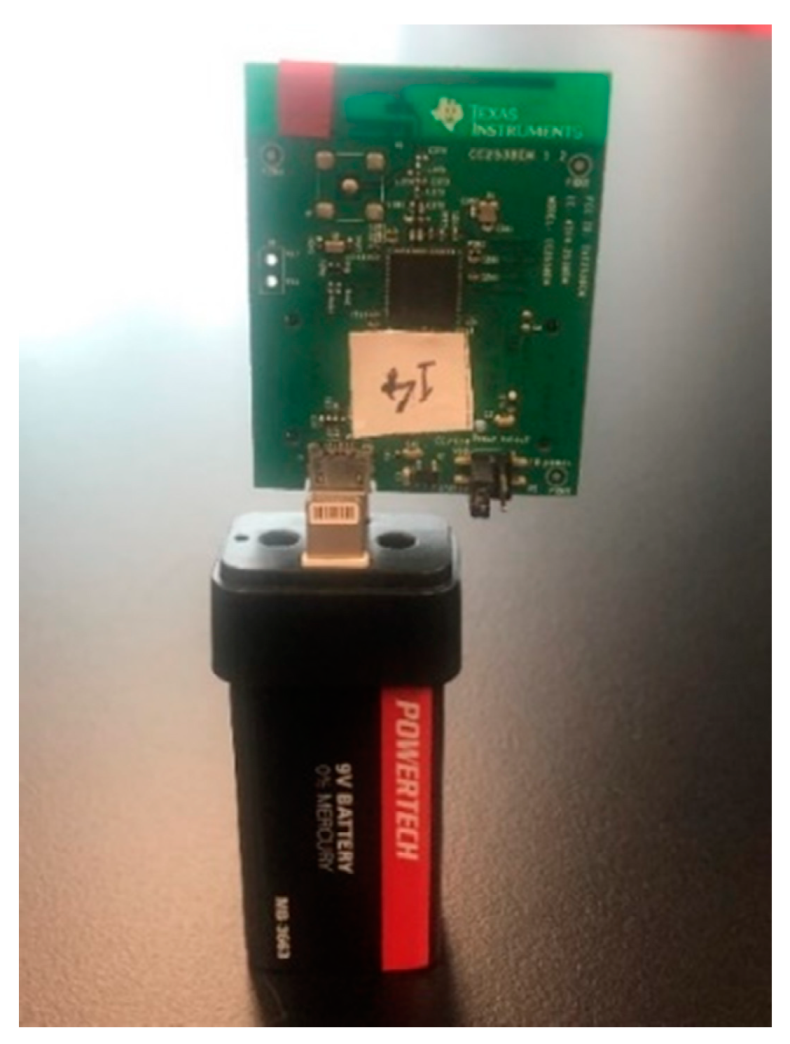
From the perspective of mobility, a scenario where one of the nodes is converted into a mobile node by plugging a micro-USB charger into the chip to provide the mobility for conducting outdoor experiments can be used to investigate the influence of RSSI on the physical network. The TI CC2538 evaluation module (EM) with micro-USB is shown in
Figure 5.
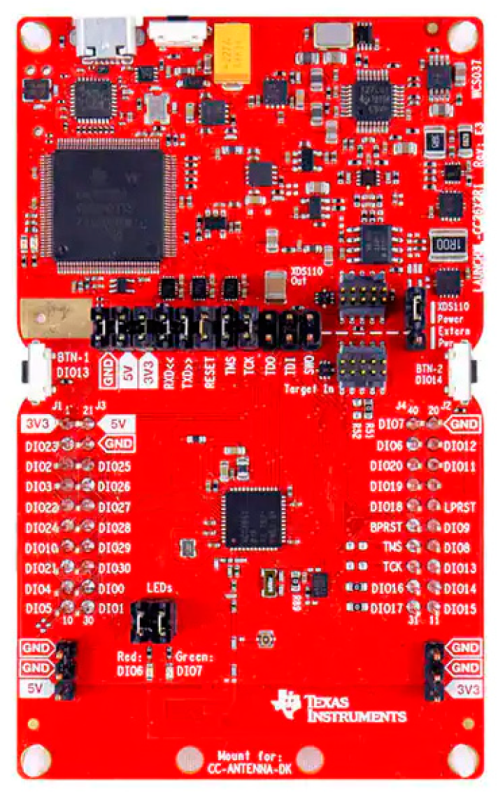
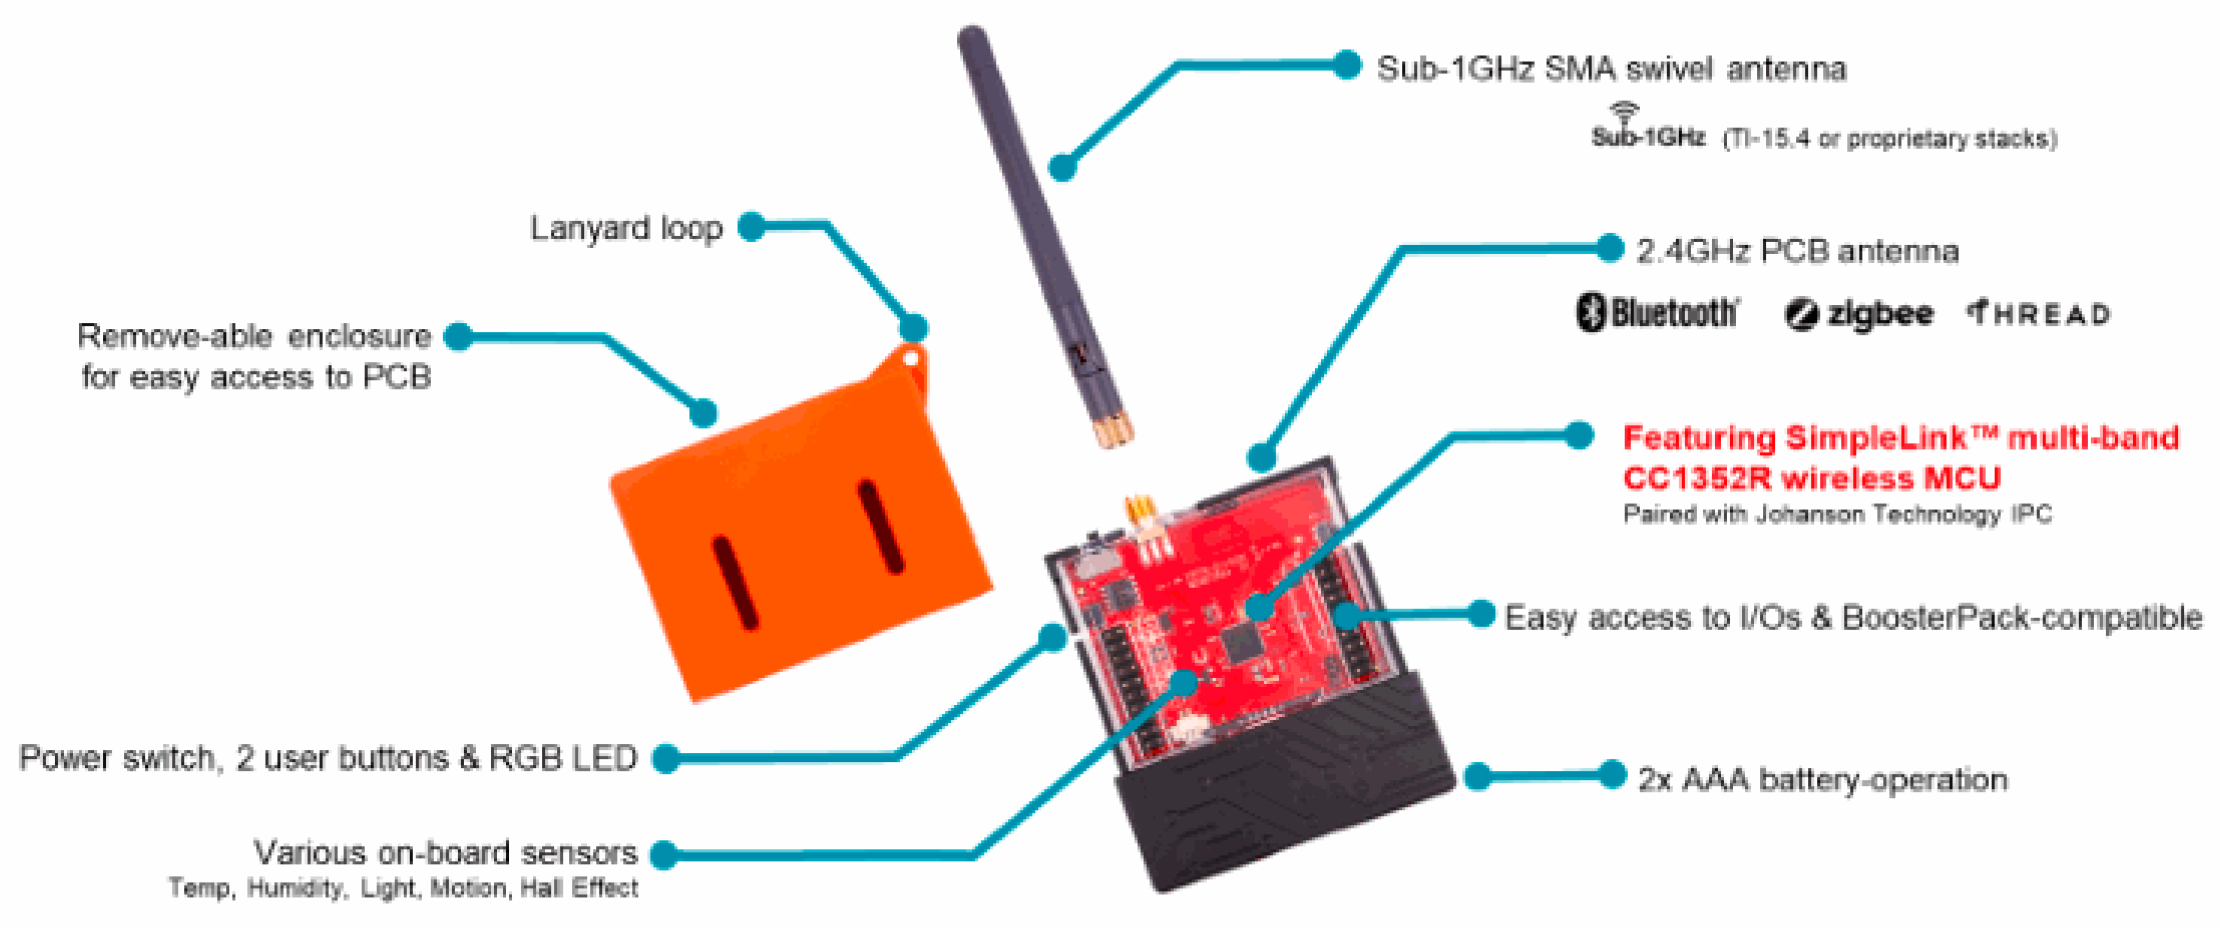
3.1.2. Texas Instruments CC1352R Sensor Nodes
The LaunchPad SensorTag kit CC1352R, also known as “LPSTK-CC1352R”, is a powerful Cortex-M4F MCU with integrated environmental and motion sensors, multiband wireless connectivity, and simple software for prototyping connected applications. Environmental sensors such as humidity and temperature sensors, ambient light and inertia sensors, a Hall effect switch, and a three-axis accelerometer are among the LaunchPad modules that can be used in use cases like trap monitoring in a forest. Mobility is provided by two AAA batteries or a CR2032 coin cell installed on the module. These batteries can provide power for the transmission of their readings in a variety of settings. The LaunchPad modules include a dual-band low-power radio kit that allows for sub-1 GHz (868 MHz/915 MHz) and 2.4 GHz to run concurrently with Bluetooth Low Energy (BLE) in a single-chip solution. The 15.4 Stack protocol offers star topology networks for applications operating at sub-1 GHz or 2.4 GHz. The sub-1 GHz version has several major advantages, including longer range and improved protection against in-band interference, as well as the ability to deliver Bluetooth Low Energy (BLE) beacon packets while running in dual-band mode on a sub-1 GHz 15.4 Stack network. In this case, the dual-band functionality provides the ability to adjust the functionality of a specific SensorTag via over-the-air debugging and BLE configuration. Alternatively, an external programmer–debugger known as the “CC1352R LaunchPad development board” can be used to reconfigure the SensorTag. The LaunchPad SensorTag CC1352R and LaunchPad development board CC1352R are depicted in
Figure 6 and
Figure 7, respectively.
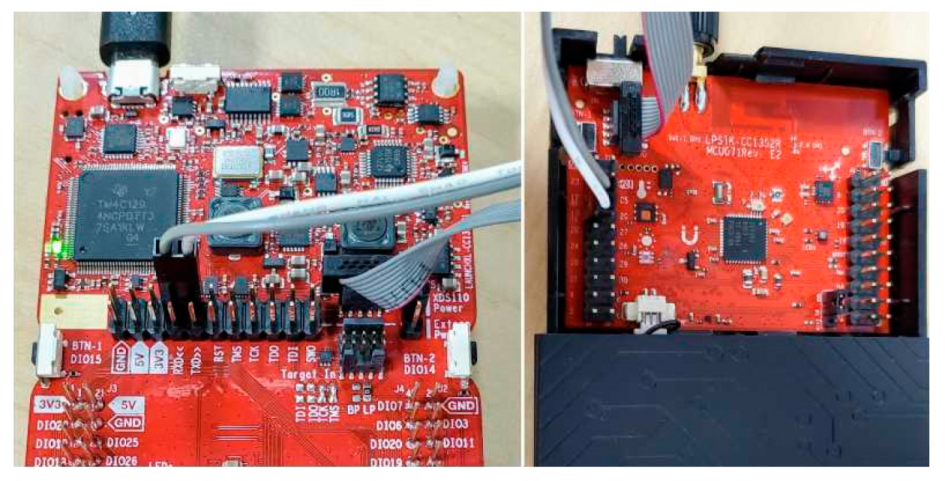
Code Composer Studio (CCS) software is used as an integrated development environment (IDE) that supports TI’s microcontrollers to enable debugging of the targeted module. The CCS provides a package of tools for running, debugging, and altering the functionality of the LPSTK modules, including a C/C++ compiler, source code editor, project build environment, debugger, and profiler. Each LaunchPad SensorTag requires a LaunchPad development kit to be debugged using an ARM 10-pin JTAG cable and a two-wire pair for UART. When the SensorTag is connected to the development board, it allows for full debugging, programming, and UART communication via CCS. The connection between the LaunchPad SensorTag and the LaunchPad development kit to enable debugging of the LaunchPad SensorTag is shown in
Figure 8.
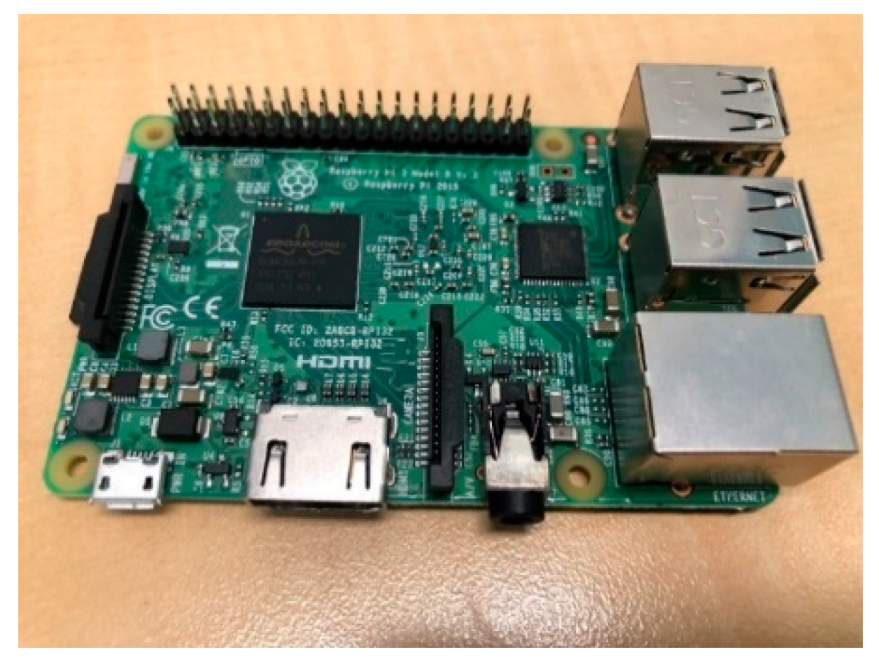
3.1.3. Raspberry Pi
The widely used Raspberry Pi (RPi) is a small single-board computer that is adaptable, affordable, fully customizable, and programmable with contemporary high-definition multimedia capabilities, as shown in
Figure 9, and is equipped with Internet connectivity. It can be seamlessly integrated within the domain of WSN applications for research and prototyping purposes. The RAM memory, CPU (central processing unit), power supply connector, USB ports (where a Wi-Fi USB dongle or adaptor can be attached), ethernet ports, GPU (graphics processing unit), and lower-level peripherals of general purpose input–output (GPIO) pins that can be used for I2C, UART, SPI-based serial communication buses or interfaces, among other components, are all found on a RPi board. It has a slot for an SD card, allowing it to be utilized for datalogging or large-scale data storage (in cases of Internet outage). Operating systems like Raspbian, NOOBS, and others can be used to run RPi. The board can be used as an IoT gateway-capable node to collect, store, and process the data received from sensor nodes in a local database within RPi called SQLite or to communicate the received data from the sensor nodes to a remote database such as MySQL depending on the application. Herein, the stored real data in a remote database can be retrieved and fed into the virtual platform, i.e., the Contiki configuration unit, within the cloud using the appropriate database interface. Contiki can use the real-time data stored in the database from the most recent test of the physical network to compile and configure a given virtual Cooja mote (i.e., the simulation). This can be placed in the simulation window within the simulation platform for virtual testing purposes, thus virtualizing an established physical network. This approach can offer better virtual network testing wherein real data from a physical network is used. The RPi board can also be used as a mobile node by being connected to a portable battery HAT that can be placed on top of the RPI to provide a 5v regulated power supply to the RPi, allowing the board’s mobility to meet a specific requirement, mainly for VN scenarios.
3.2. Physical Network Setup for WSN-Based Clustering
The TI CC2538 wireless module is one of the hardware targets for developing a physical network structure. The main parameters of sensor data size, sampling rate, network topology, node function, and node mobility all have an impact on physical network performance and possible cloud interaction. This is mainly critical for dynamic networks due to its critical events.
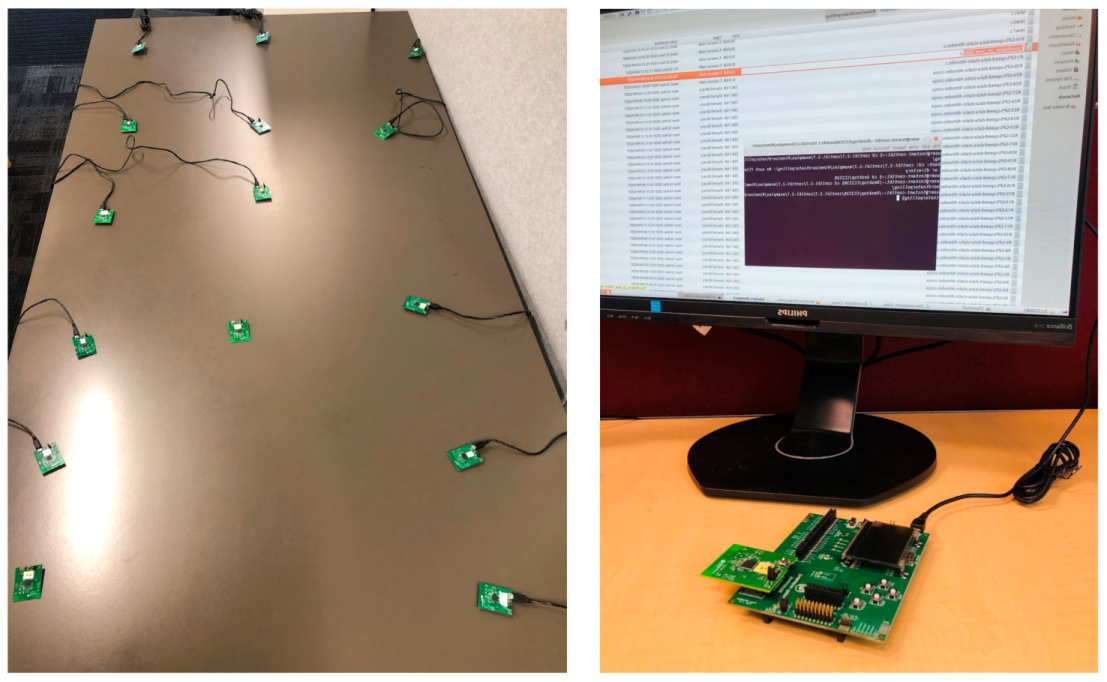
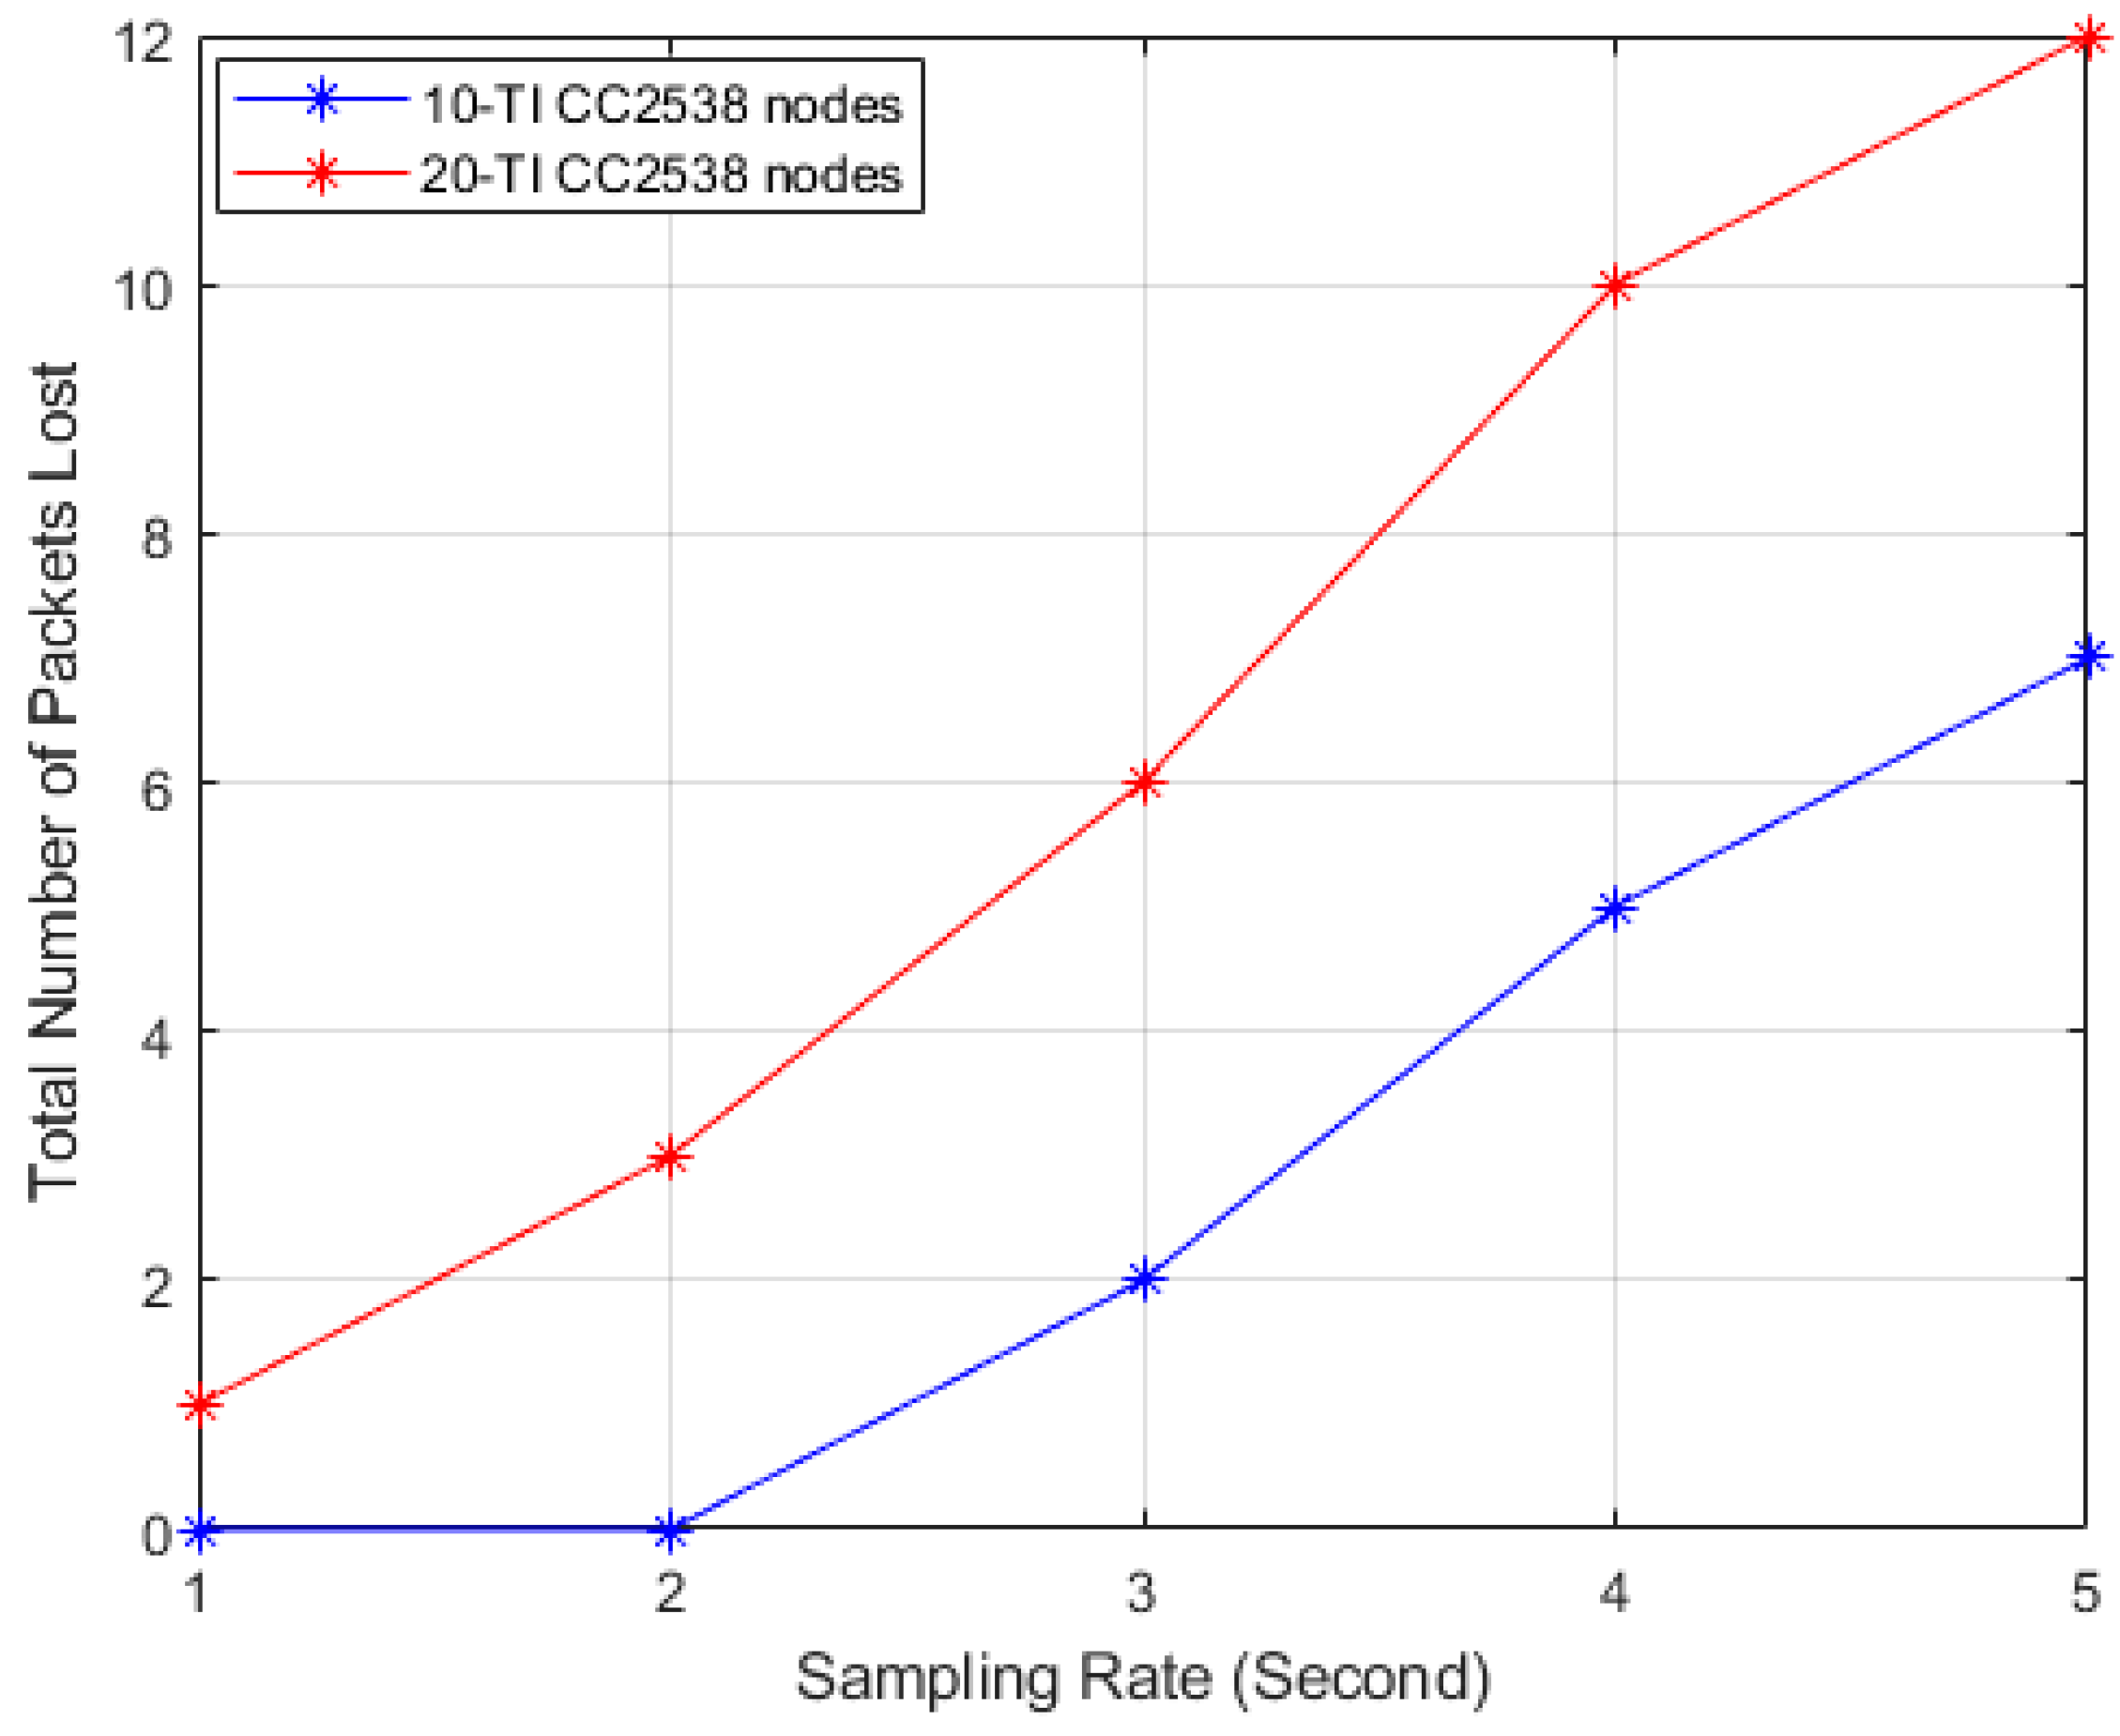
At the Auckland University of Technology (AUT) WZ building, a testbed representing the physical network was deployed to reflect the main functionality of a given topology, e.g., star or tree network scenarios. Within the network, 33 TI CC2538 wireless sensor nodes were configured using the Contiki operating system (OS), with 30 nodes configured as leaf nodes reporting RSSI sensing values within a defined sampling rate and 3 nodes configured as coordinator nodes (cluster heads). The physical network setup is depicted in
Figure 10. The physical network setup was designed to log RSSI data for each coordinator node for 24 h to allow for data analysis. Considering that both the hardware and the Cooja motes use the same Contiki firmware, the analysis of the collected data was used to fetch the minimum and maximum RSSI data for the Cooja virtual model in order to update the model based on real data.
The modified values of the RF transmission power of the sensor nodes based on designed indoor and outdoor scenarios can reflect the mobility aspect in the network. Additionally, mobility can be reflected by using a battery attached to one of the nodes to measure RSSI values based on distance, as shown in
Figure 11. In addition, the RSSI data are collected at different sampling rates with various number of node scenarios to test the delivery of packets and determine if there is any packet loss. This is mainly to evaluate the capacity of the coordinator (cluster head) node, tested virtually [
8,
9].
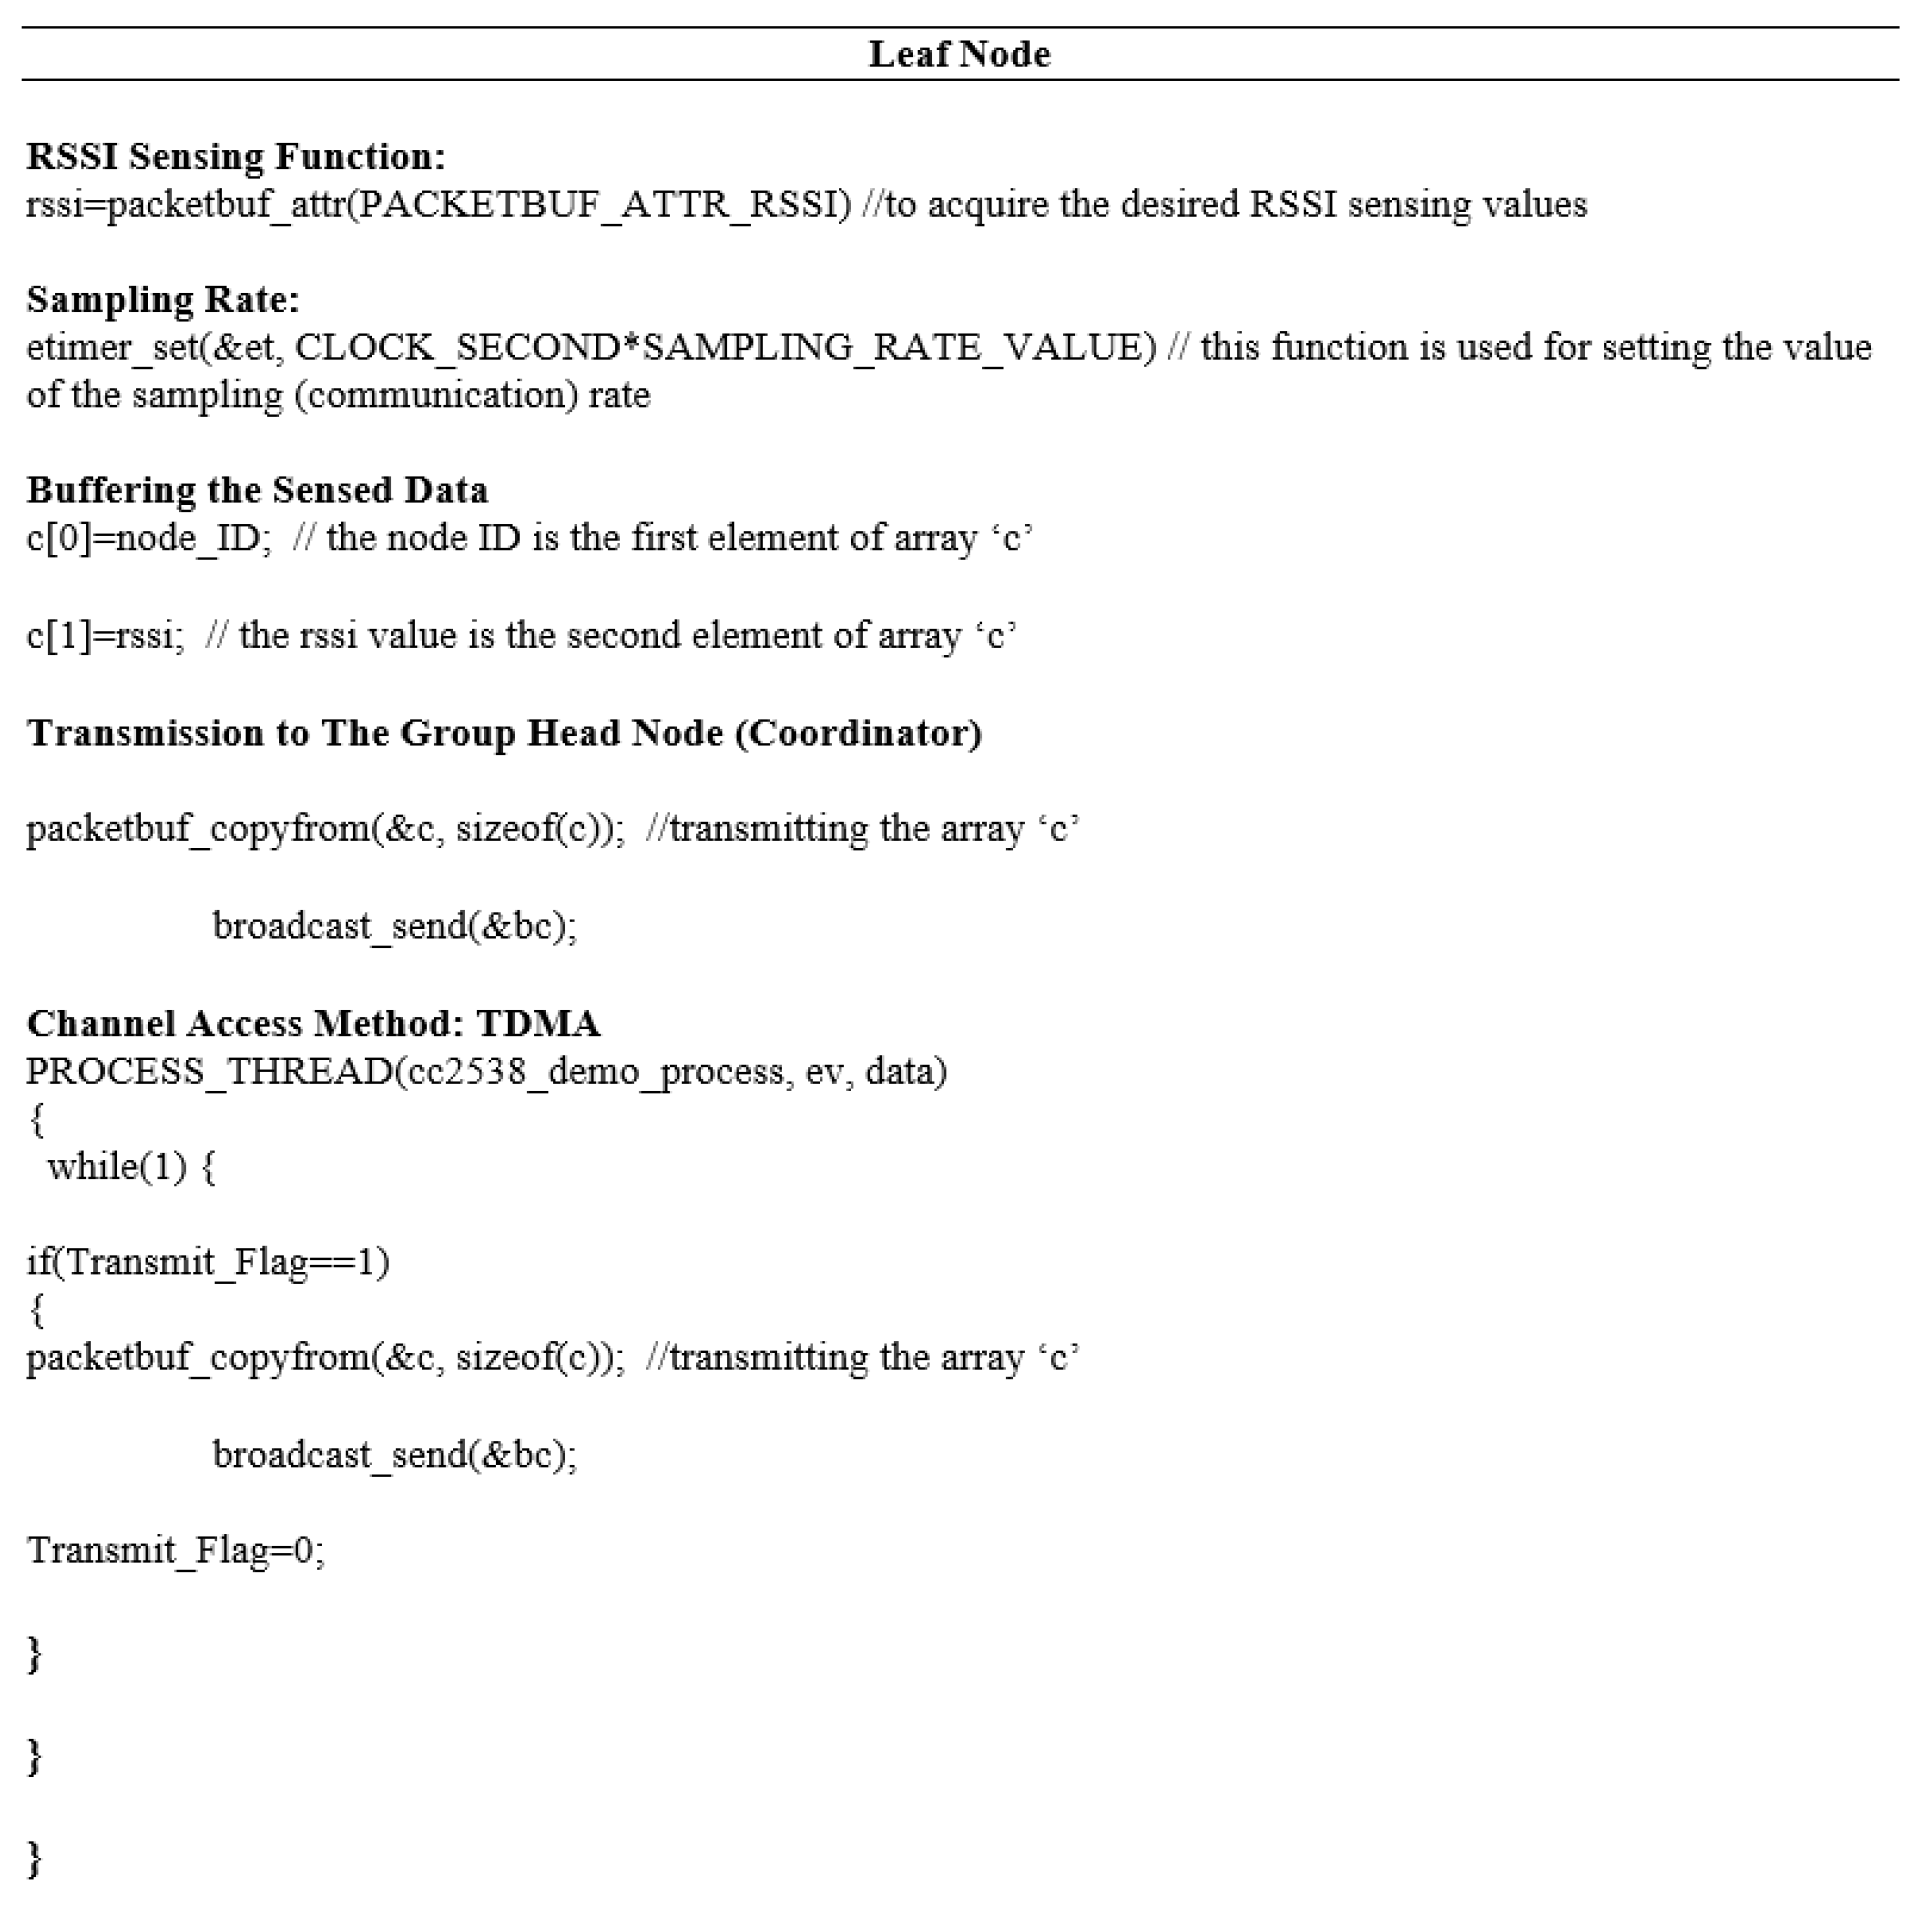
3.2.1. Leaf (End Device) and Coordinator Nodes’ Main Components and Data Collection
The same “Contiki OS”-generated codes that are used for compiling and configuring the physical nodes represented by TI CC2538 are used for compiling and constructing virtual nodes. As a result, the logical component of the physical environment’s operational dynamics can be accurately reproduced virtually. This allows for flexibility in accessing the physical node code prior to implementation via the virtual mote code. The main components that differ from the virtual mote are the header files, channel allocation, and node ID.
Figure 12 and
Figure 13 illustrate the pseudocodes for some of the key configuration components of the TI CC2538 leaf node as well as the cluster head (coordinator) node.
According to
Figure 12, the RSSI sensing function, communication/sampling rate that can be set using the same function as for the virtual leaf mote, buffering, and the channel access method at the MAC layer (using the TDMA method in the leaf node as an example) are the main components that reflect the configuration of the leaf sensor node in the established testbed. It is worth noting that the variable “transmit_flag” is not accessible for transmitting the buffer while using the CSMA method.
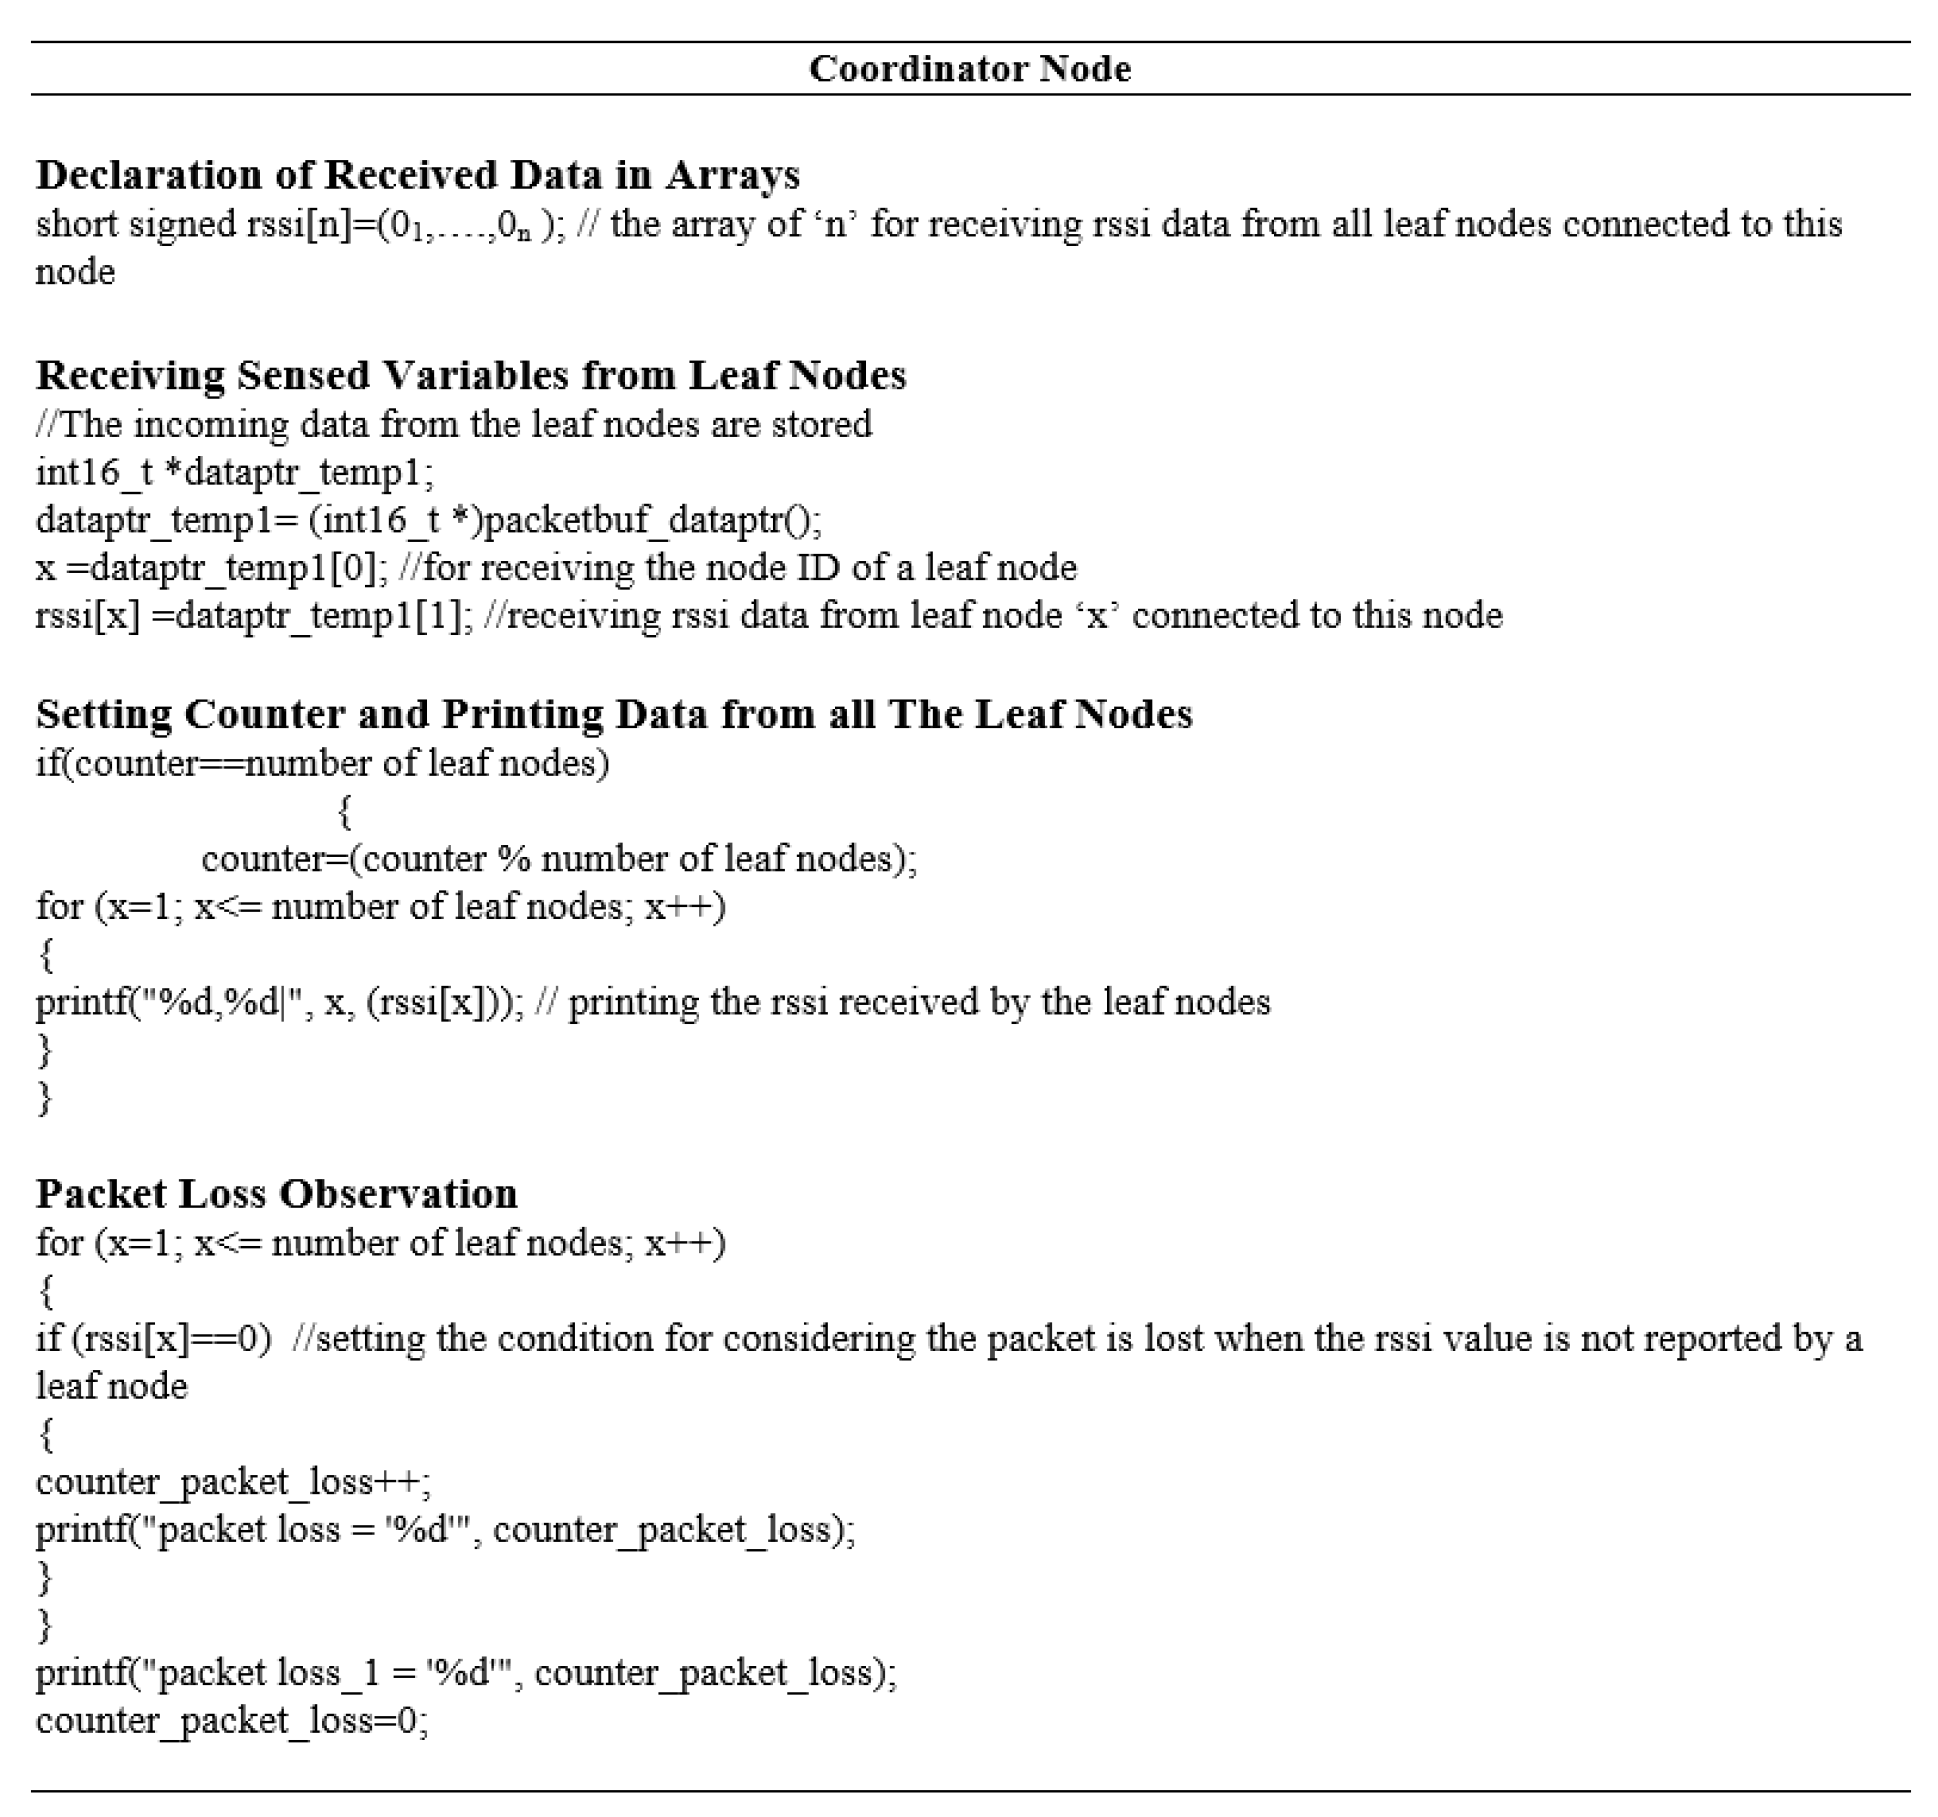
The declaration of data received from the nodes connected to the coordinator node is shown in an array format in
Figure 13. Then, each received sensing datum as well as the node ID of the transmitter node is stored individually. Depending on the number of connected nodes, a counter can be set to print out the data received from the transmitter nodes. In addition, packet loss can be added to the coordinator node by setting any condition that can indicate the loss of a packet.
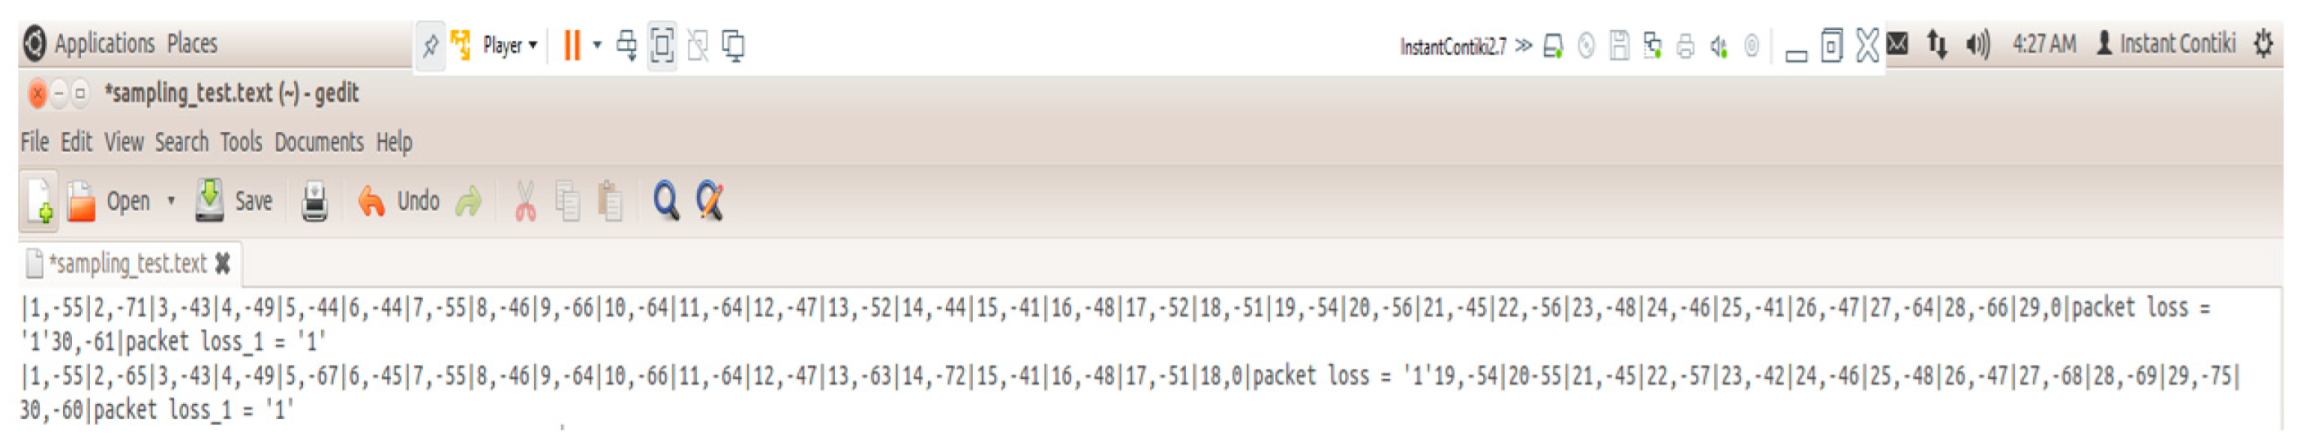
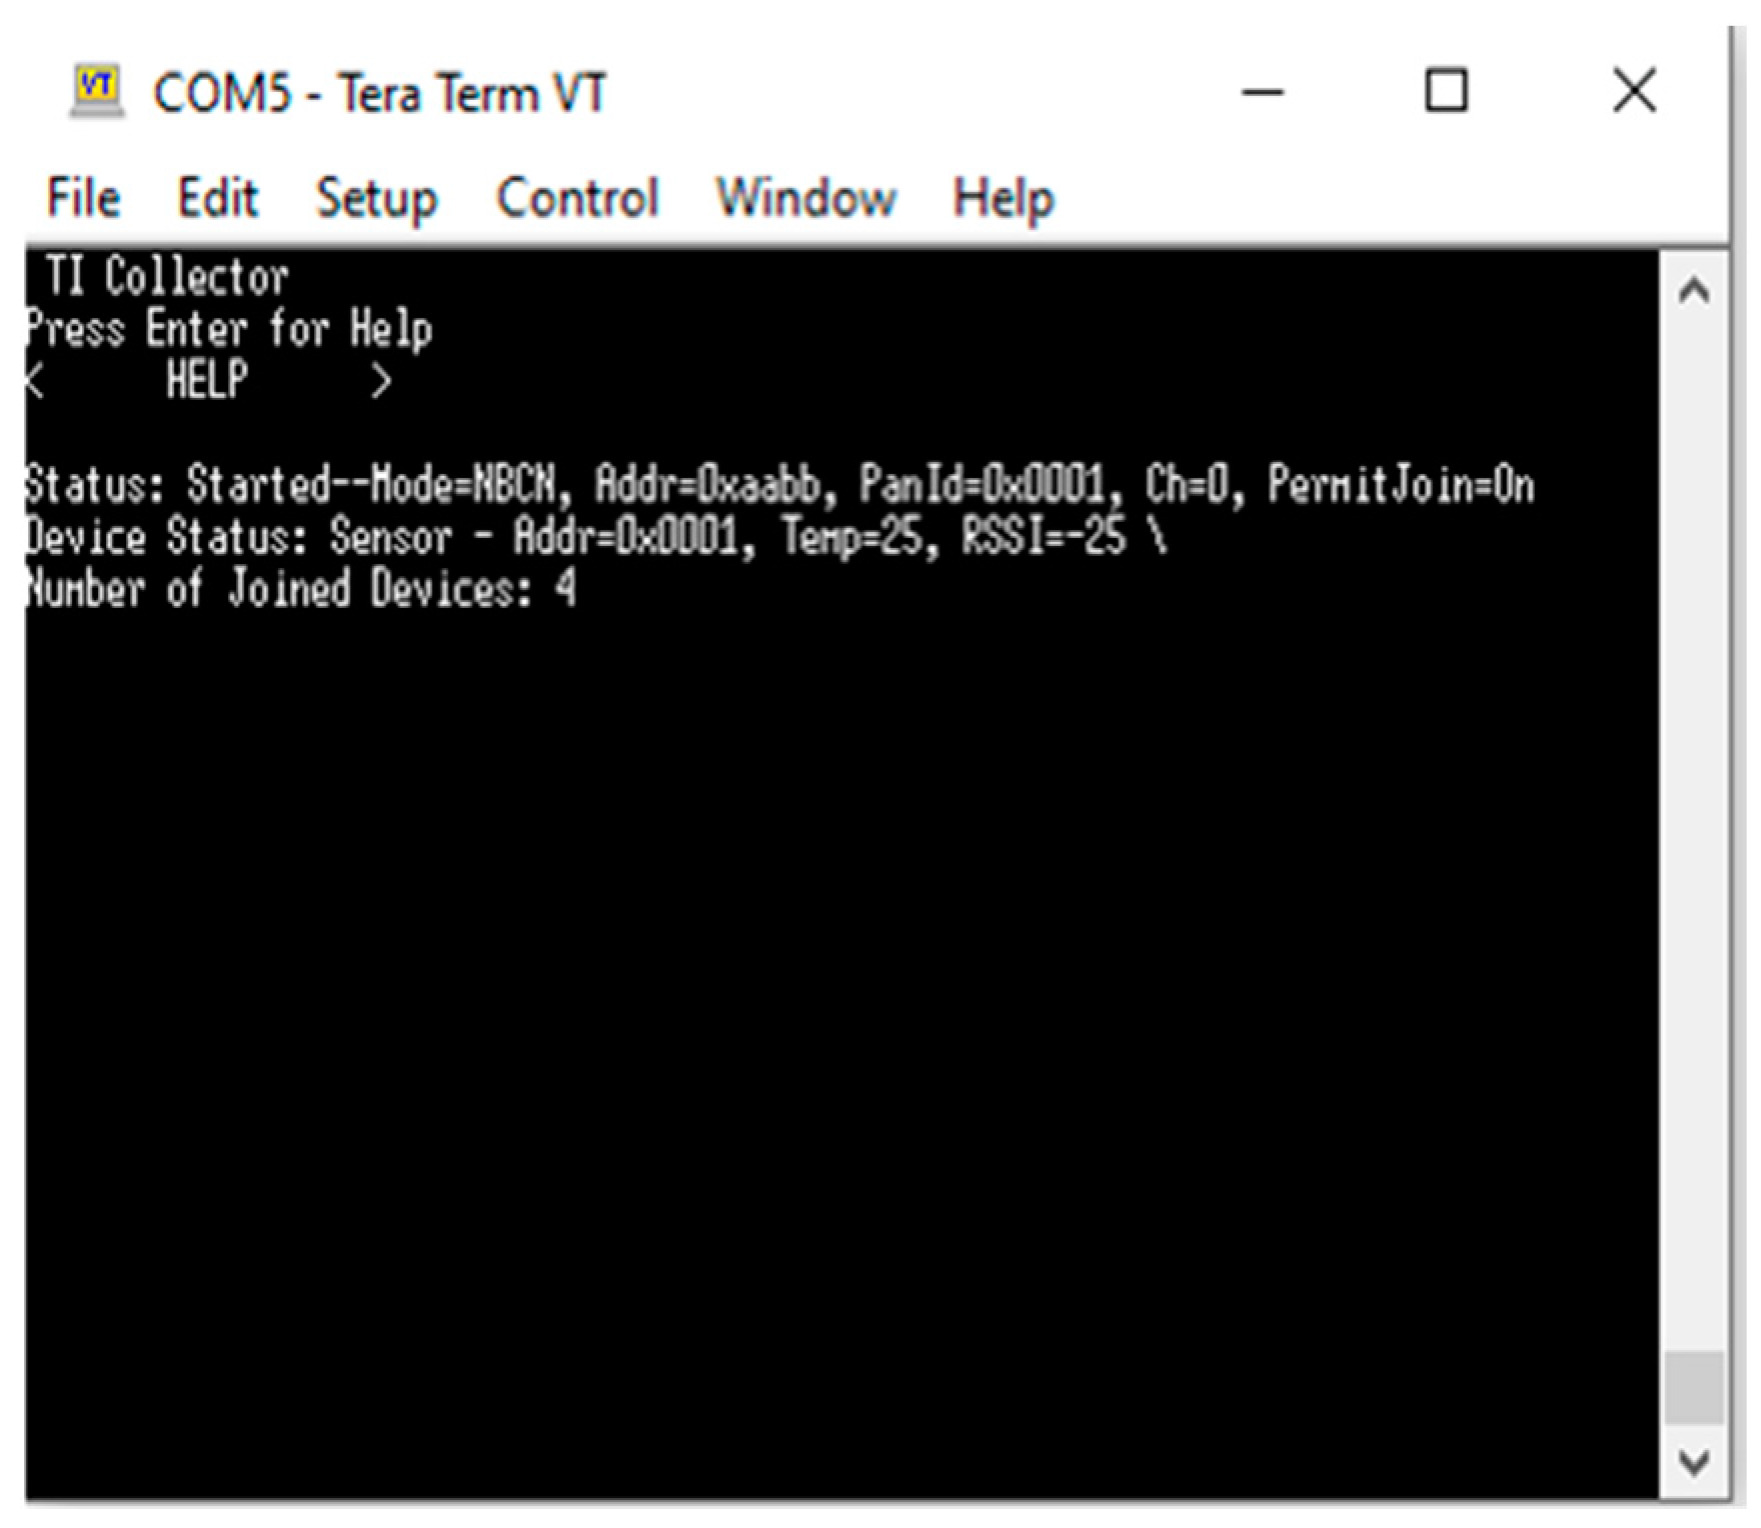
For RSSI data logging, the data can be sent and received based on the sample codes shown in
Figure 12 and
Figure 13. A sample of some of the data collected in Contiki in text format is shown in
Figure 14. The data received by the coordinator node are displayed, represented by the connected leaf node ID and its RSSI value, along with the amount of packet loss experienced in each round.
3.2.2. Mobility Scenario Using Transmission Power
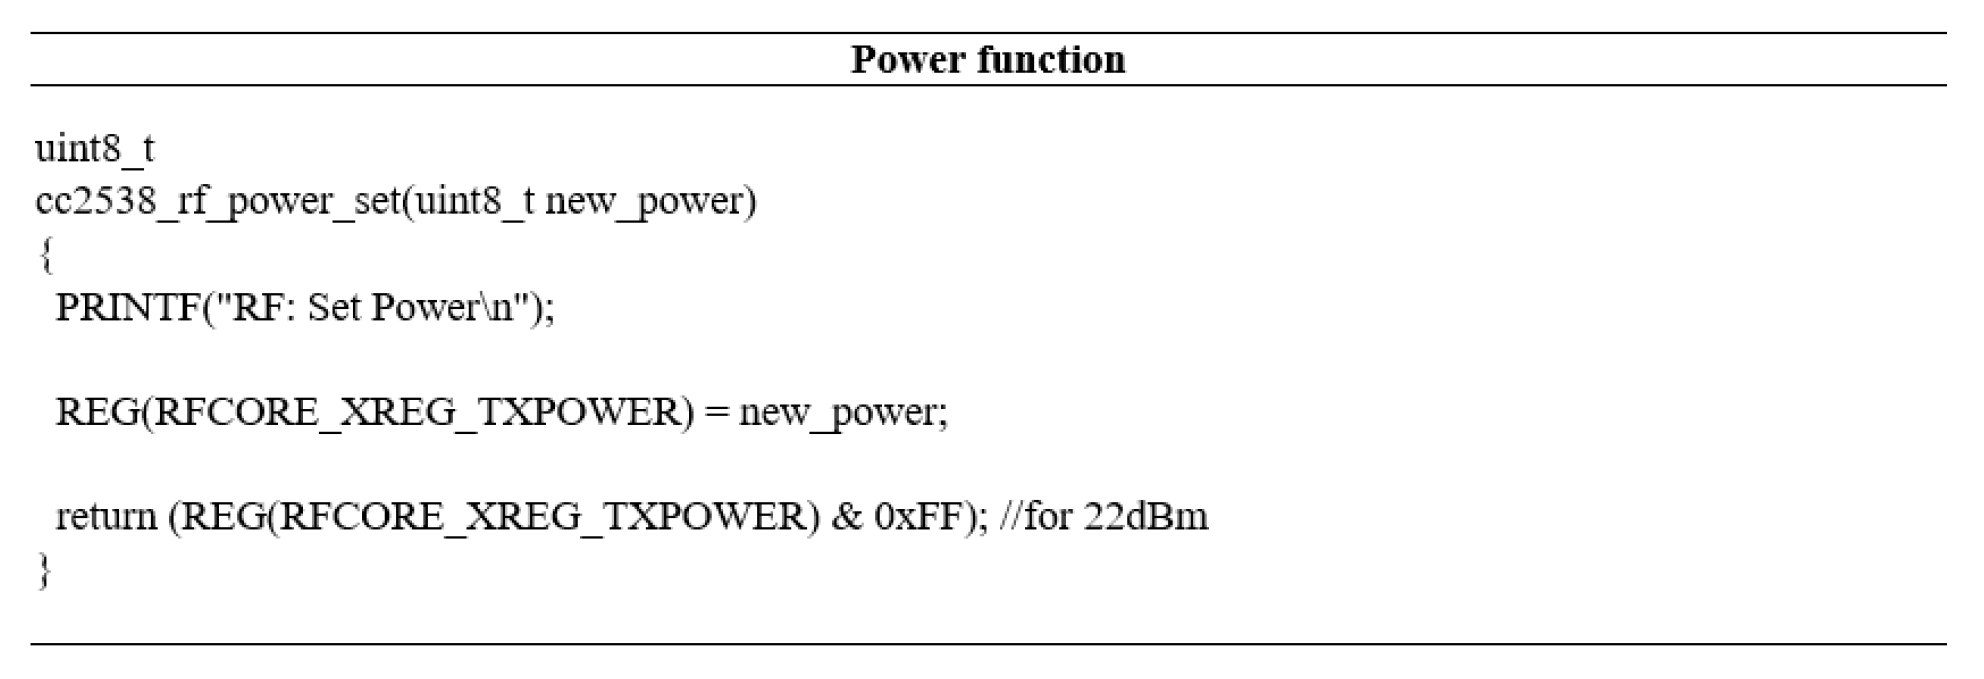
One of the tests involved changing the radio frequency (RF) transmission power output of the TI CC2538 end devices (leaf nodes) based on an indoor scenario (WZ AUT) and an outdoor scenario (around AUT in Auckland) to offer different RSSI values and reflect signal quality. The dynamic alteration of a given node’s transmission power output via the C code can be used to evaluate the reliability of communication between the nodes. The hexadecimal value assigned to the selected power mode within the C code can be used to set the intended radio transmission power for the TI CC2538. The power output values used for the indoor and outdoor tests are 22 dBm RF output power with the hexadecimal value 0xFF set in the power function in C code, and 7.5 dBm output power with the hexadecimal value 0 × 42 set in the power function.
Figure 15 depicts the power function in C code.
The RSSI values for the indoor and outdoor scenarios were logged for three rounds based on the selection of the RF transmission power values modified in the TI CC2538, as shown in
Table 1. The signal strength was below −65 dBm in both scenarios (indoor and outdoor), as transmission power was increased. This reflects the reliability in communication as well as the impact of altering transmission power to assume the distance between nodes.
3.2.3. Mobility Scenario Using Rechargeable Battery
The RSSI sensing data collected from the physical network are of high importance to dynamic networks as they indicate a node’s possible departure when it ventures outside the communication range of the other nodes. The collected RSSI data can be analyzed to observe any variations in the sensed values. A test scenario based on the TI CC2538 network was performed to collect RSSI data from a mobile coordinator node in relation to its leaf node. Herein, the coordinator node was powered using a rechargeable battery to flexibly move away from the leaf node. When the coordinator node moves outside the testing room, the RSSI values range from −72 to −94 dBm, indicating that the node signal strength is degraded. It is worth mentioning that the RSSI-sensed values collected from the physical network can be fed into the virtual network to test any potential network reorchestration.
Table 2 shows the RSSI values of the departing coordinator node, which are equivalent to the departed node’s distance in meters.
3.3. WSN Physical Network Setup for Node Distribution on the Ground
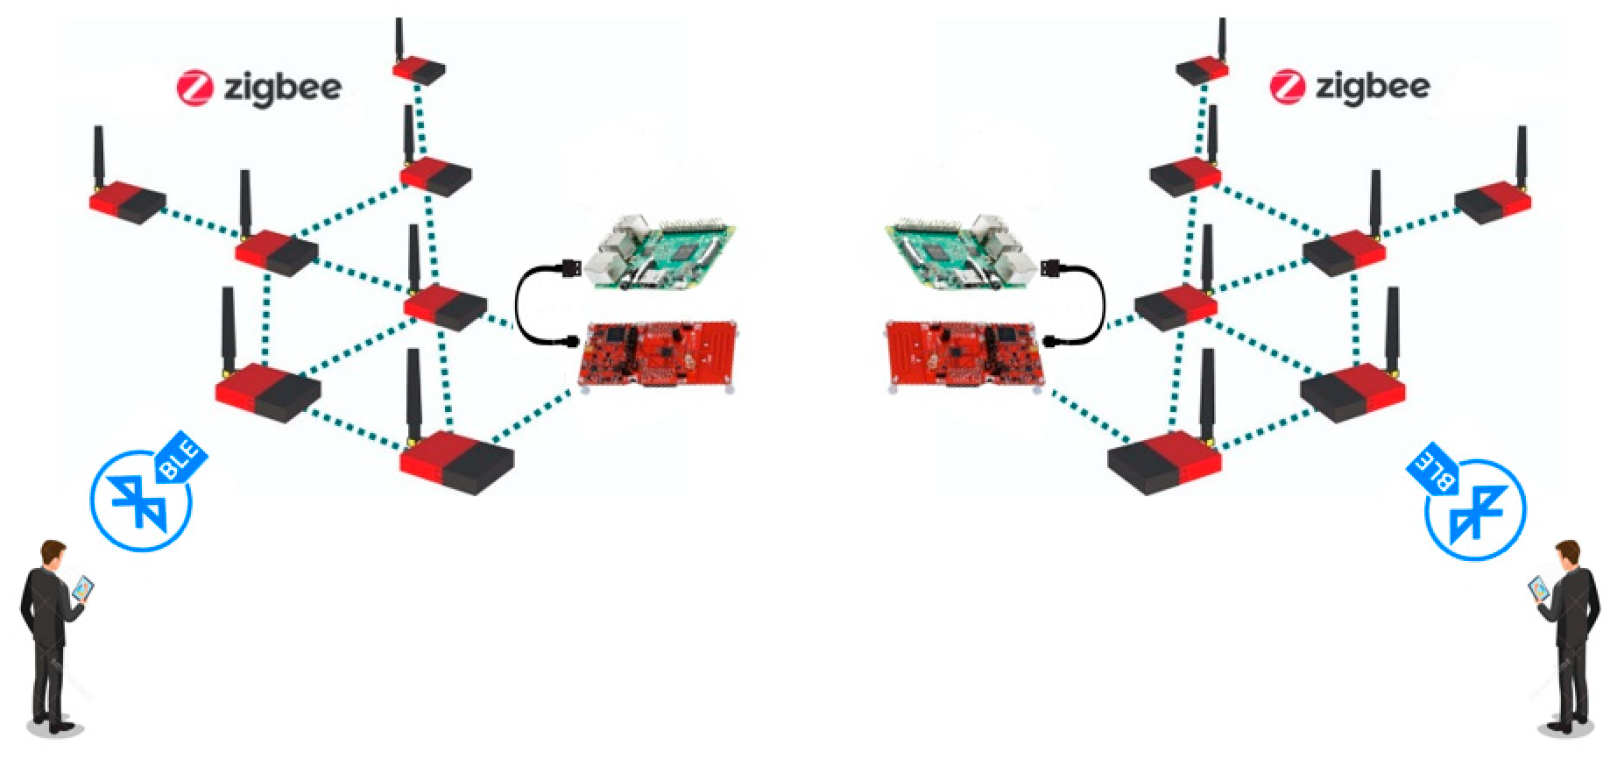
The TI CC1352R can be used for physical network implementation in a variety of applications to allow for sensor node functionality to be modified over the air via cellphone configurability to change some module settings such as bitrate, capture rate, packet size, polling intervals, power, and so on, or to change the entire functionality of a sensor node. The physical network system is softwarized and implemented using LaunchPad SensorTag CC1352R and development boards, as well as Raspberry Pi (RPi). The LaunchPad modules contain a dual-band, low-power radio kit that allows for the coexistence of 15.4 Stack and Bluetooth Low Energy (BLE) on a single chip. The 15.4 Stack is an IEEE 802.15.4e/g RF communication stack that supports star topology networks in either sub-1 GHz (868 MHz /915 MHz) or 2.4 GHz applications. The sub-1 GHz 15.4 Stack is used for ground network connectivity in this paper. The motivation behind this is that the sub-1 GHz version offers numerous advantages, including longer range and improved in-band interference prevention, as well as the ability to broadcast BLE beacon packets while running on a sub-1 GHz 15.4 Stack network in dual-band mode.
The proposed physical ground network topology with the intended dual-band communication functionality is depicted in
Figure 16.
The LaunchPad SensorTag CC1352Rs are configured with leaf node firmware, which enables the modules to sense and transmit sensing data to the upper-level coordinators (CC1352R development boards). The gateway nodes are Raspberry Pis with CC1352R development boards connected. The development boards are configured with “Collector firmware” to collect the sensing data from the leaf nodes, while the Raspberry Pi is used for data storage and buffering and is connected to the development board using a USB cable. This physical network topology design has the advantage of enabling dual-band connectivity, allowing the client to reconfigure each physical node using over-the-air debugging (OAD) functionality, which aligns with the softwarization concept. As a result, this network design not only allows for reconfigurability of ground network entities, but it also allows for regular data collection from the ground network within the central RPi station.
3.3.1. Energy Consumption Model for Communication Network
The energy consumption model for enabling communication among the ground network components is calculated based on the proposed model. Hence, the amount of each network components’ power consumption for this purpose is as in Equation (1):
This means the average power consumption of each node is the summation of the average power consumption of a node in four modes: idle mode, low power mode (LPM), and receiving and transmitting modes. The idle mode () is activated whenever the node is listening (the time interval during which the CPU is inactive prior to the radio transmitter or receiver becoming active). LPM mode () is activated when the sensor node goes to low power mode. Rx mode () is activated in radio receive mode and finally Tx mode () is activated in transmission mode.
Sensor nodes operate in either active mode or sleep mode. The ratio of the time spent in active mode to a total data period is defined as the duty cycle. In general, sensors mainly consume energy during data receiving and transmitting, and idle listening when they are in active mode. The proposed energy model uses the Contiki power tracker to measure the time intervals that each node spends in these four modes [
32]. Hence, the overall energy consumption per node can be calculated considering the equivalent consumed energy for these intervals as in Equation (2):
where
represents the value of consumed power within each power mode,
is the time spent during a specific mode
i.
Power calculation analysis was conducted based on the information explored from the CC2538 datasheet for values of current usages, once the module is in active receiving, transmitting, idle, and low power modes, as shown in
Table 3.
3.3.2. Small-Scale Physical Network
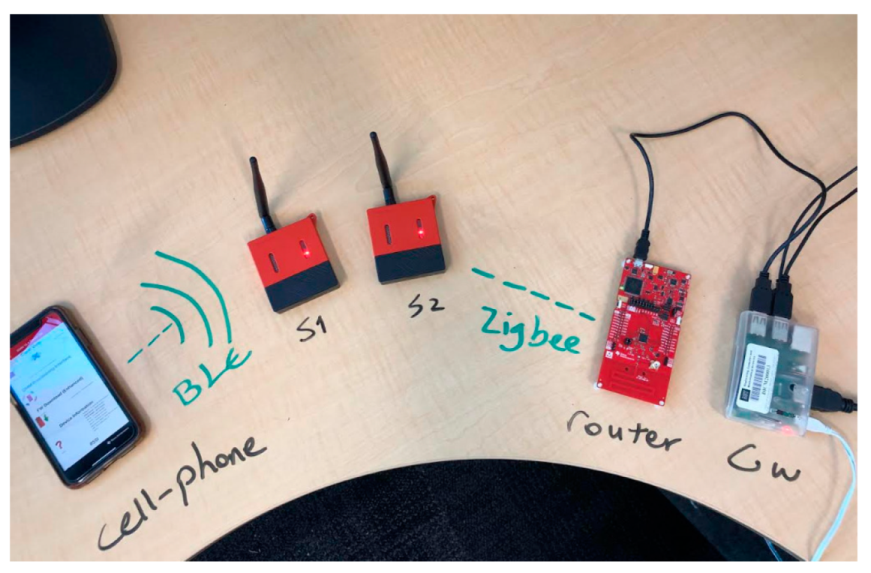
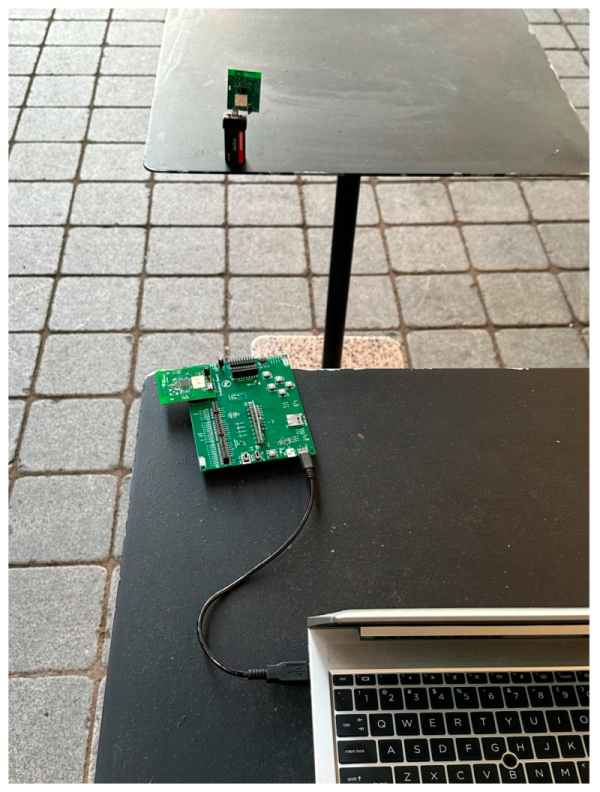
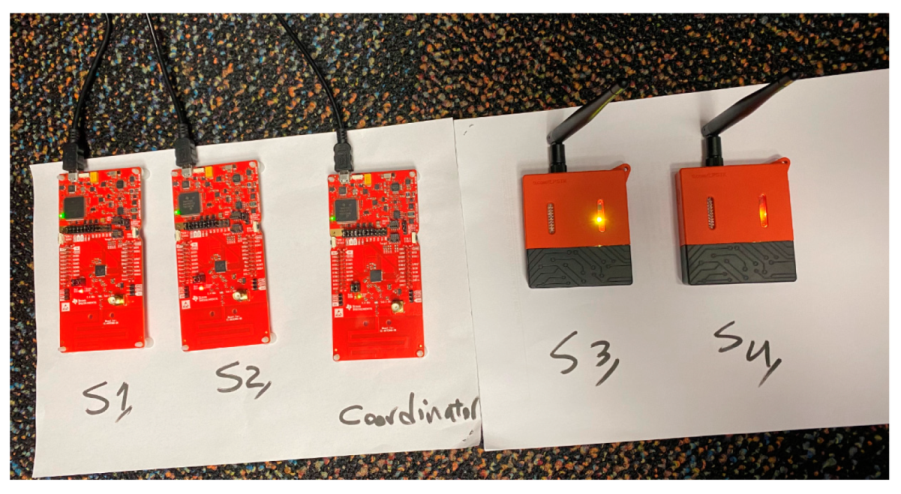
This network implementation focuses on non-RPi and RPi network design. The design focuses on the LaunchPad modules, which transfer sensing data such as temperature, RSSI, humidity, accelerometer, and so on to a development board as part of a data collection effort and modifies the functionality of network entities in real time as part of the softwarization process for the network of SensorTags and development boards only. As leaf nodes,
Figure 17 displays two sets of modules that include two development boards and two SensorTags. One development board is also assigned the role of coordinator. The SensorTag CC1352R modules are programmed using OAD functionality via Bluetooth Low Energy (BLE) using a smartphone. The leaf nodes provided multiprotocol and dual-band communication over the TI 15.4 Stack and BLE protocols simultaneously. The TI 15.4 Stack is used for communication between leaf nodes and the coordinator, while BLE is used for communication between each module and the smartphone.
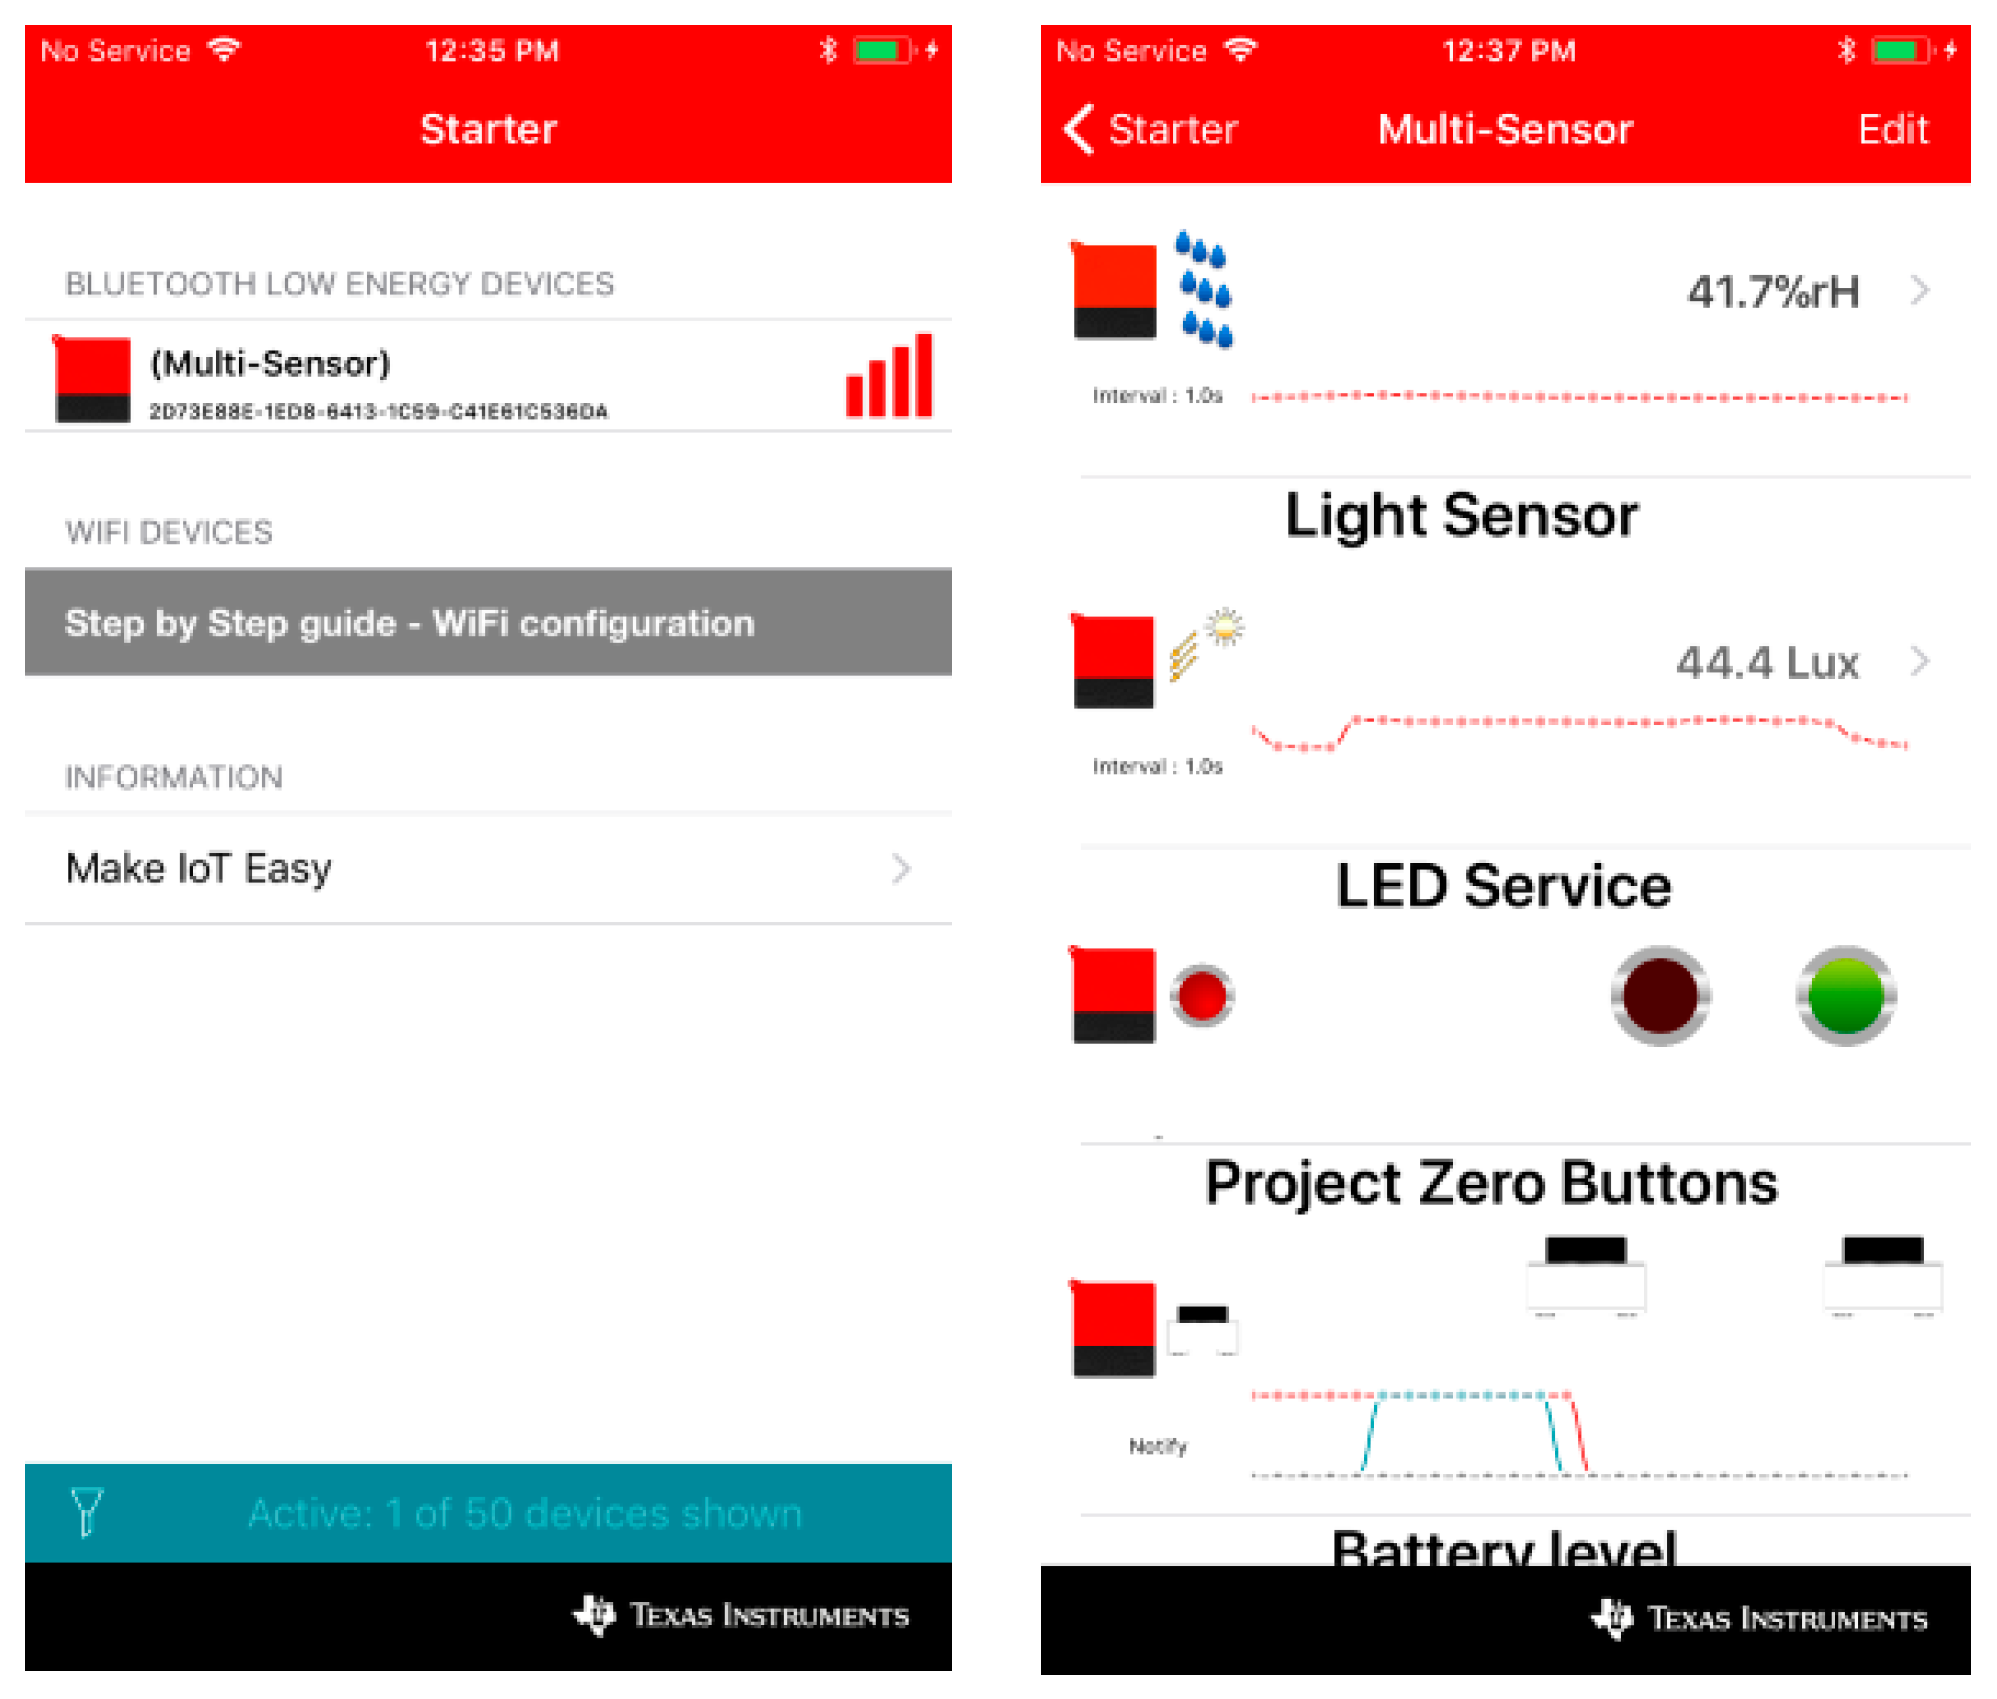
The SimpleLink Starter app for iOS and Android offers significant support for the CC1352R LaunchPad modules, which are used for configurability in this paper. Hence, this app facilitates the OAD to modify the functionality of LaunchPad modules. This app connects the LaunchPad modules to a smartphone through Bluetooth Low Energy (BLE) and supports reading LaunchPad button states, controlling LEDs, and receiving real-time sensing data such as RSSI, temperature, humidity, and accelerometer. It also allows for MQTT cloud communication to the IBM Quickstart server or any other cloud service. This enables a cloud view in which the LaunchPad module can be controlled from any web browser.
Figure 18 displays the environment of the Starter application.
To program the LPSTK development board as a coordinator, debugging in CCS using the “Collector” program is required. “Tera Term” is used to display the real-time received values after receiving sensing values from various leaf nodes in a coordinator’s terminal window using TI 15.4 Stack. The received data from multiple leaf nodes in the coordinator’s console is shown in
Figure 19. The RSSI and temperature readings regarding this experiment are displayed in the coordinator’s console.
Figure 20 depicts the physical network design with RPi using two SensorTags programmed as leaf nodes and one development board as a coordinator/router node. The development board is connected via USB cable to the RPi. A smartphone is also available to either reconfigure the SensorTags via OAD functionality or to monitor the real-time data of each SensorTag. BLE and TI 15.4 Stack communication protocols are utilized for smartphone–SensorTags and SensorTags–development board interaction, respectively.
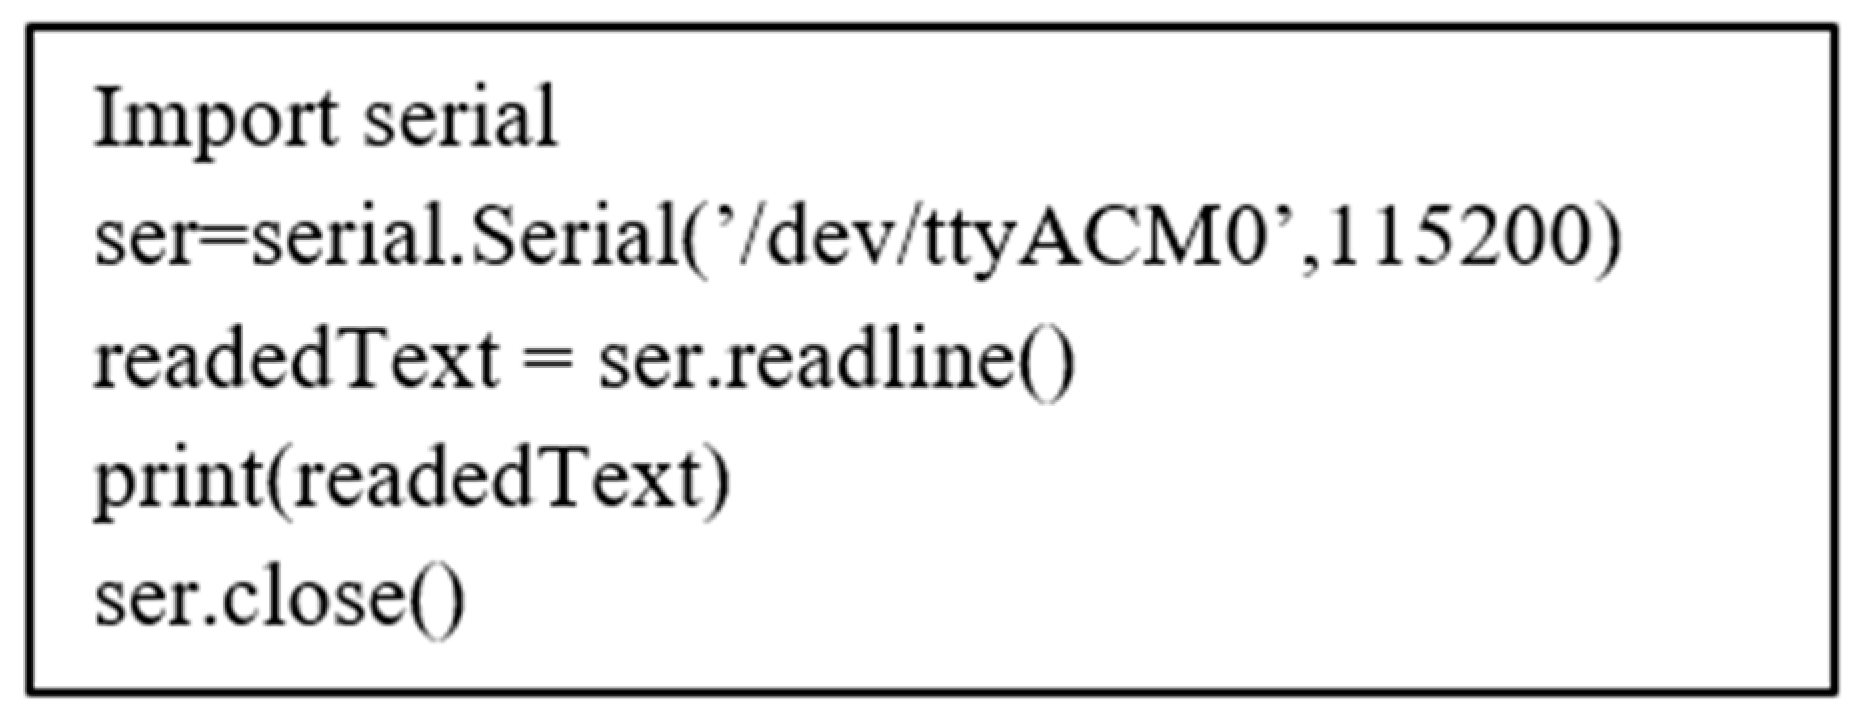
To gain access to the USB port of the RPi and display the real-time outcome on a terminal screen such as “Putty”, building a Python script following the Putty installation on “Raspbian” is required, as shown in
Figure 21.
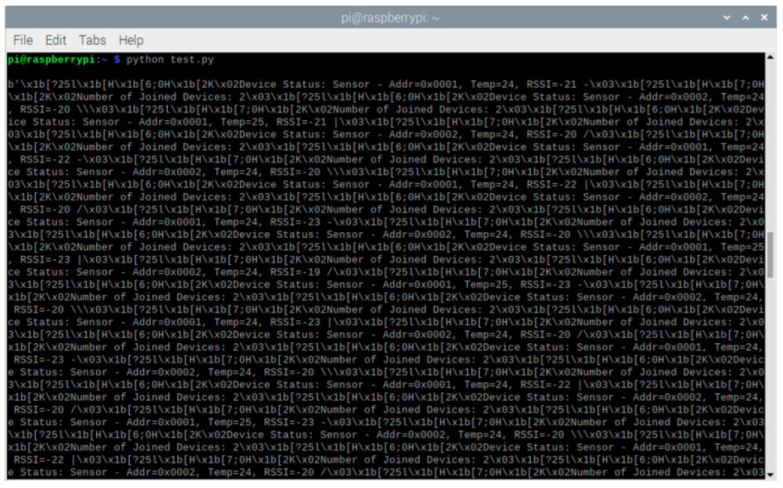
The results of running the code in the terminal window, which include the received sensing data from SensorTags on the development board and then on the RPi, are shown in
Figure 22.
3.3.3. Large-Scale Physical Ground Network
The data gathering method using the softwarization concept for a ground network [
34] is used in the physical network implementation. Herein, the orchestration data gathering phase is validated using a real-world implementation that can be manipulated to be used in applications such as trap monitoring applications. The factor that reflects the dispersing aspect of elected gateway nodes within the ground network after each reconfiguration election process is called sparsity, obtained as in Equation (3):
wherein
is the sparsity factor after the election process of
,
are the coordinates of the elected gateway nodes,
is the average coordinate of the elected gateway nodes,
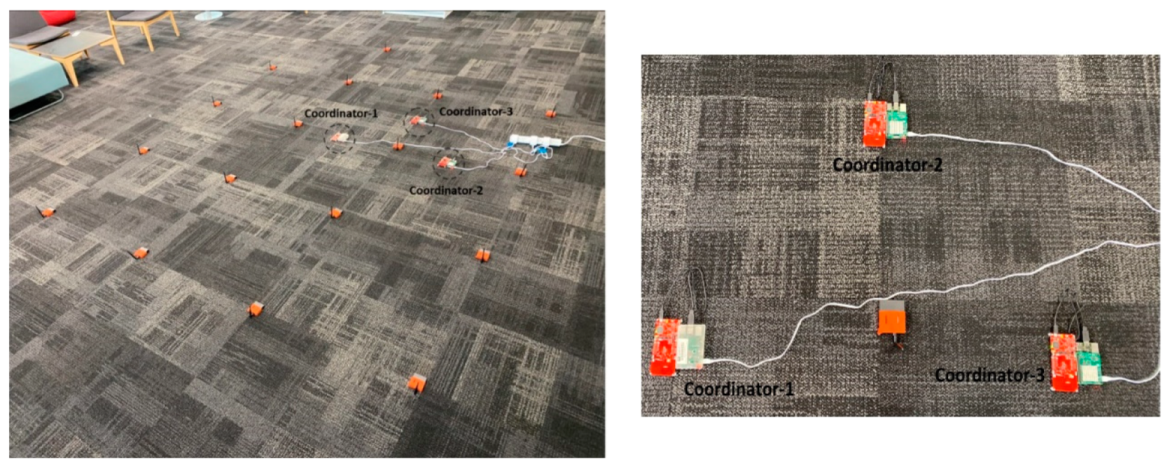
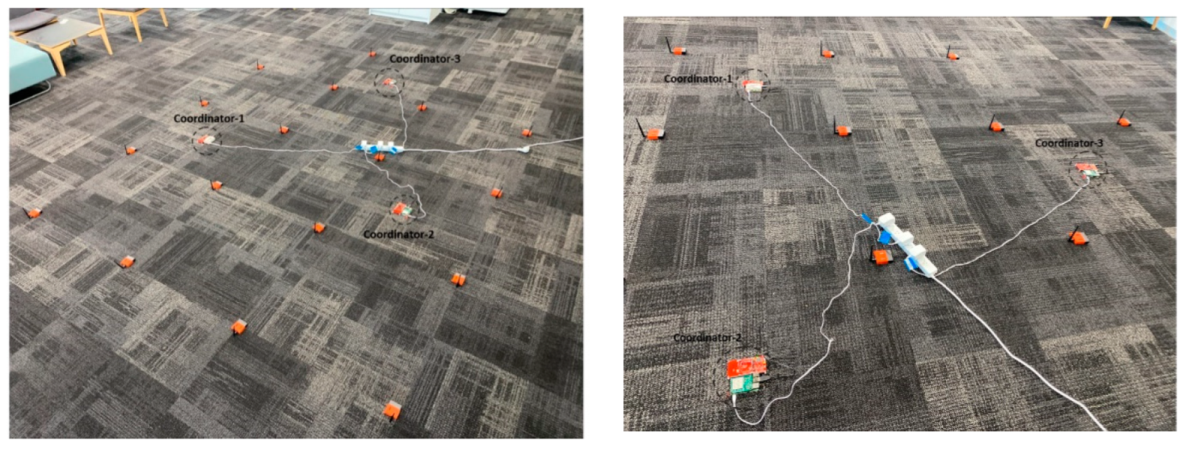
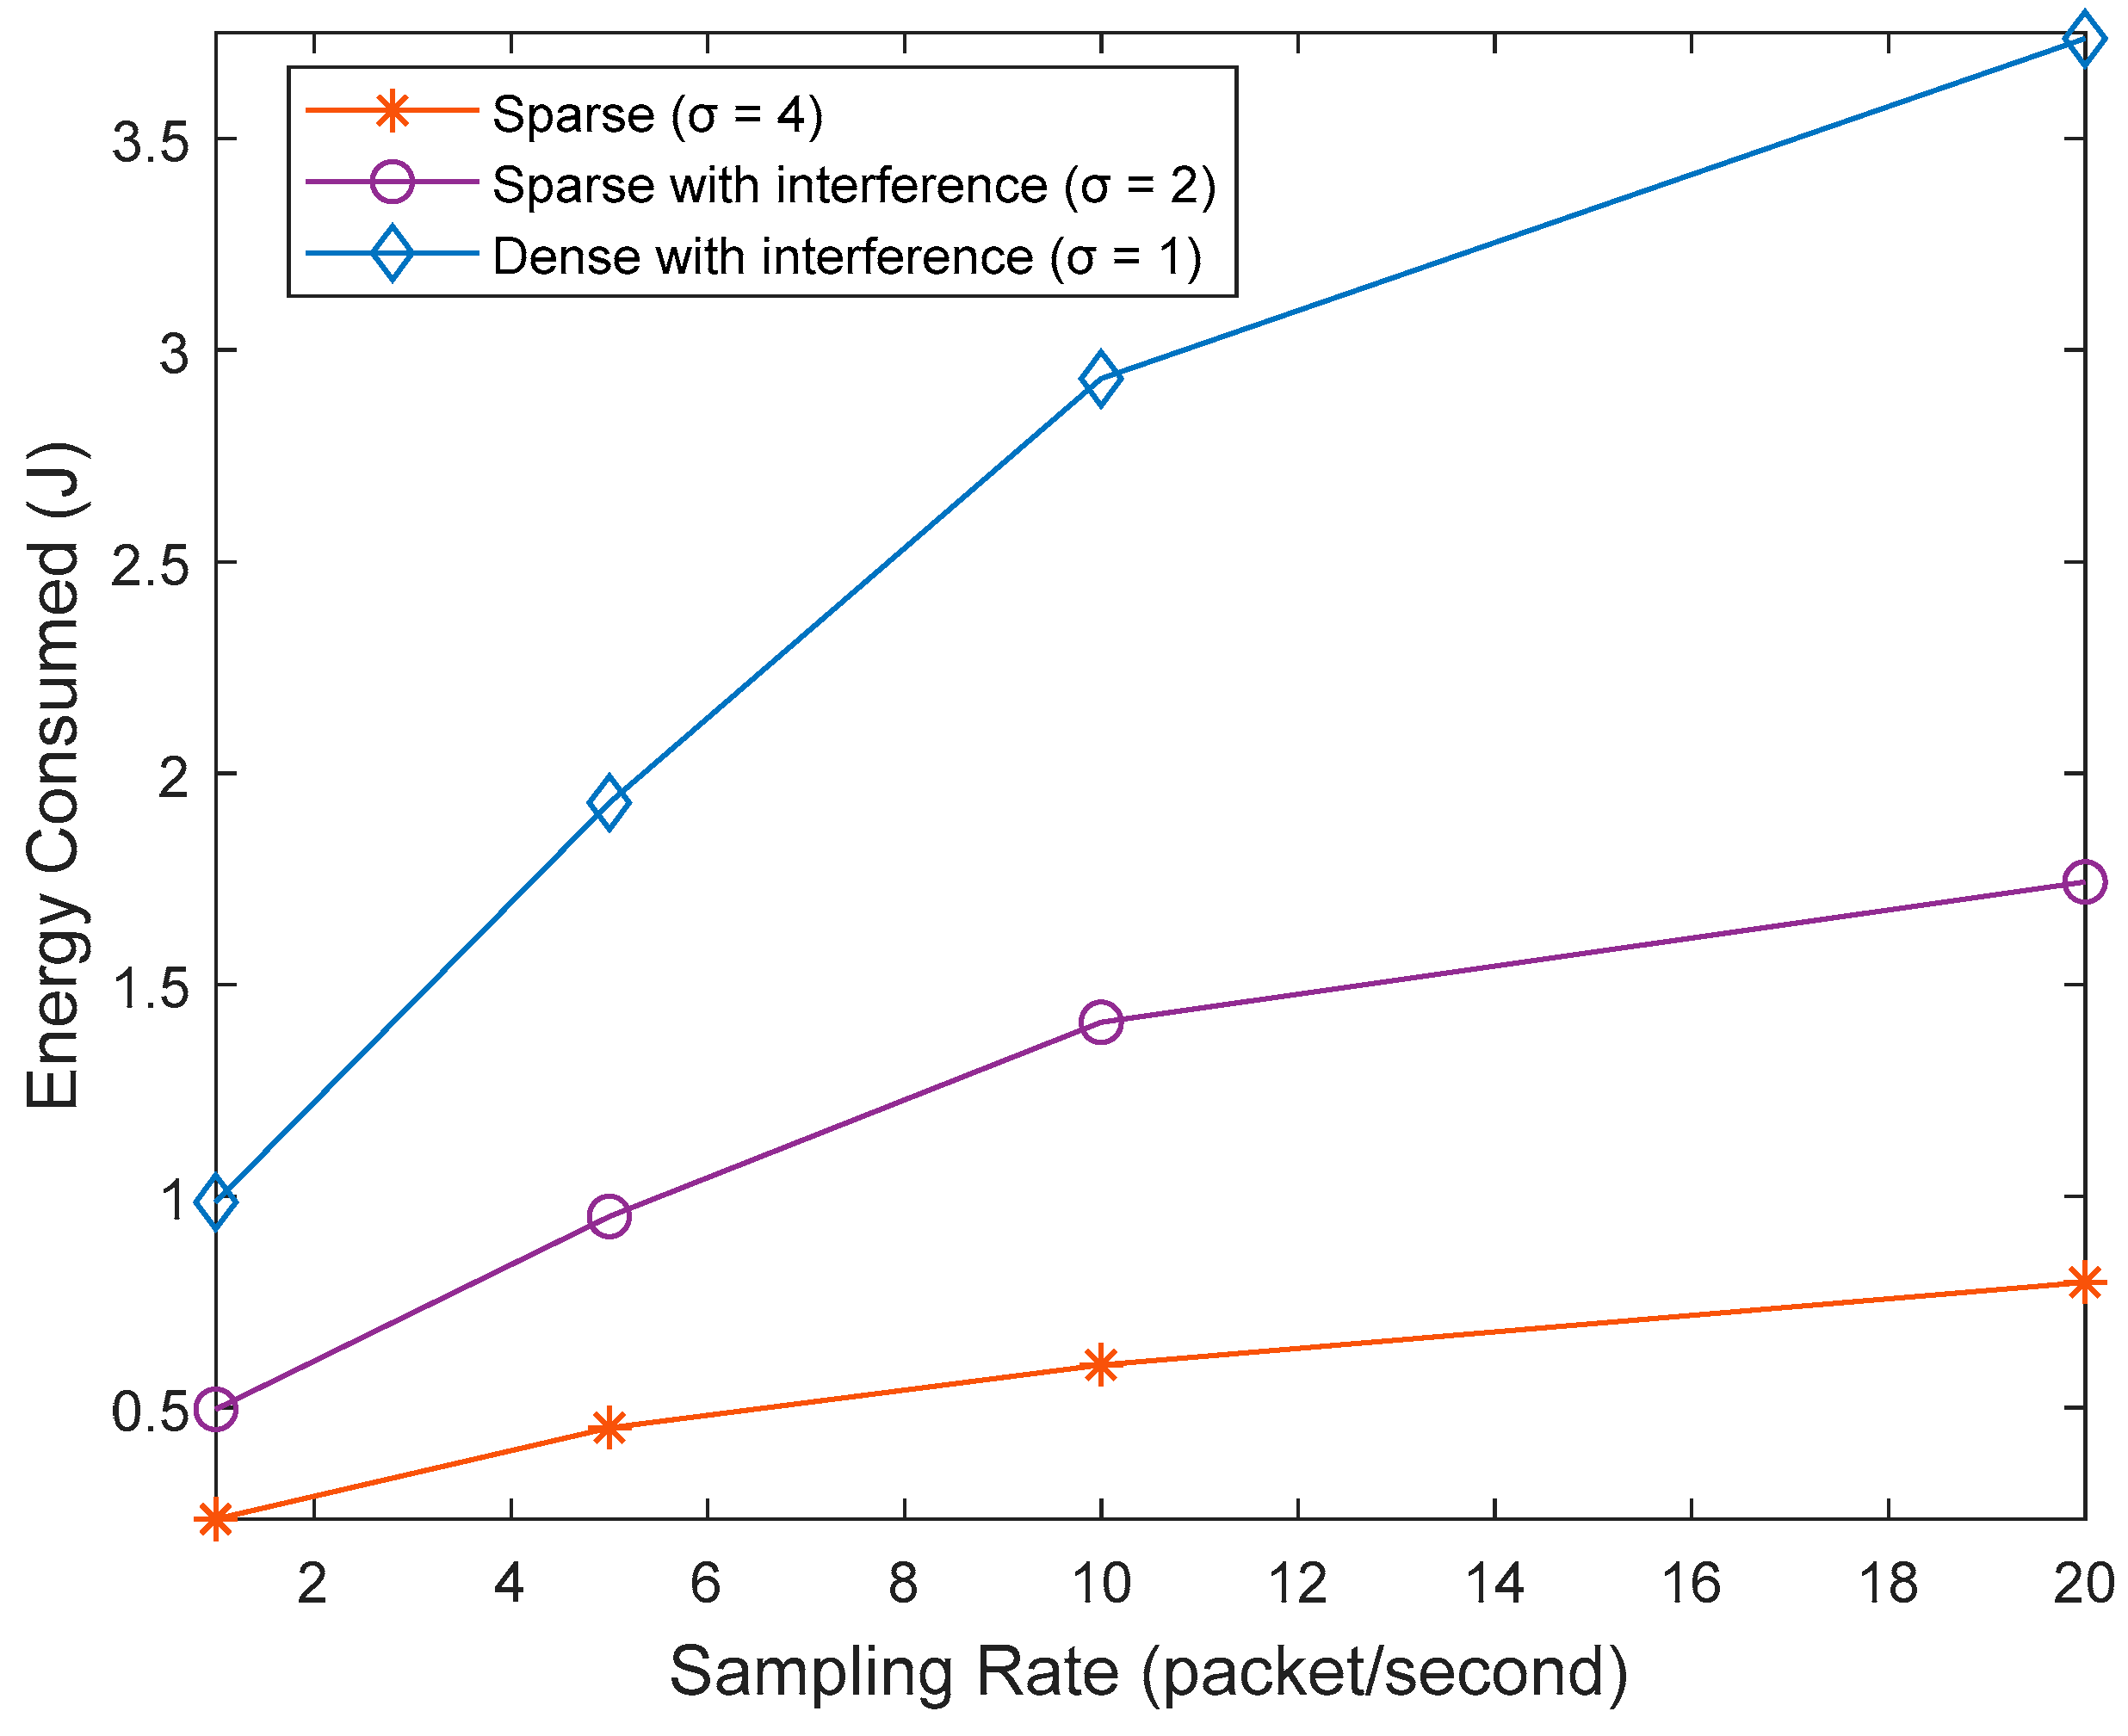
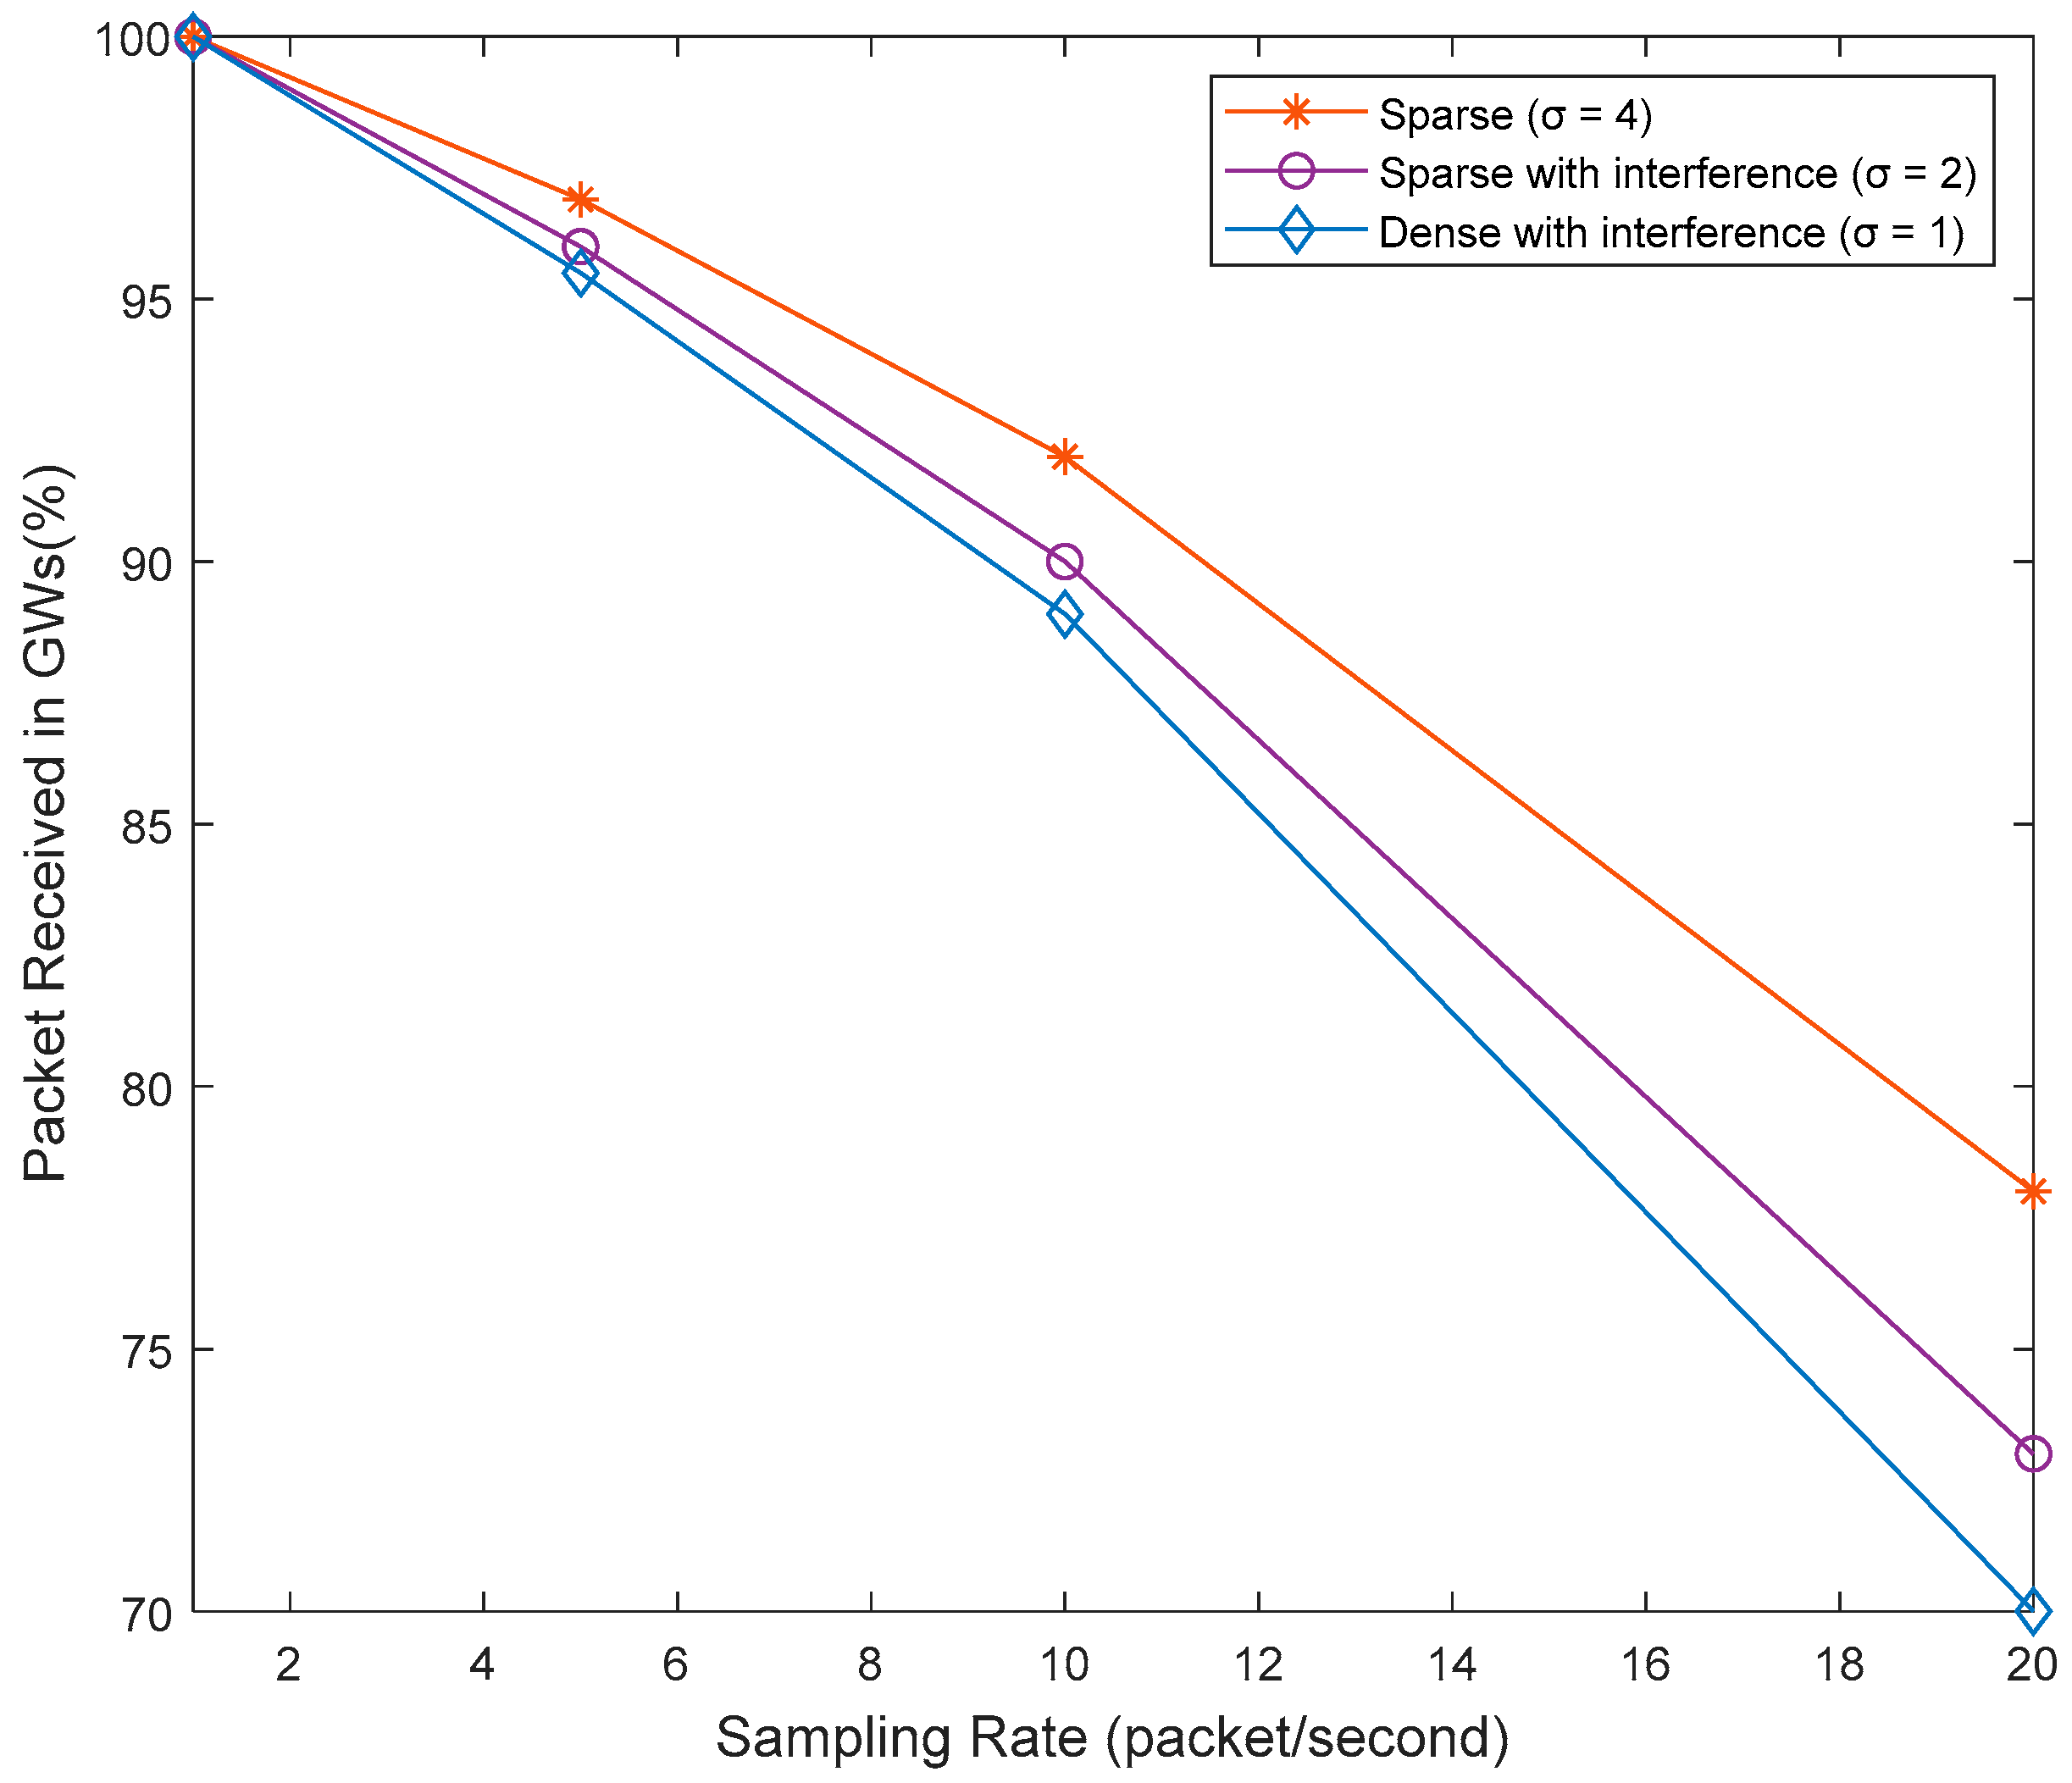
is the number of gateway nodes. The simulated post-orchestration data gathering phase is structured to observe the impact of varying the density spread factor parameter on the network’s performance. In this section, the same network parameters are used to analyze the physical ground network’s performance. Hence, out of 20 nodes distributed on the ground, 17 SensorTags are programmed as leaf nodes, while 3 development boards are programmed as coordinator nodes. Each development board is connected via a USB cable to the RPi node as a gateway. The network organization is based on star network structure. Also, the TI 15.4 Stack communication protocol is used for interaction between the SensorTags and the development board. To validate the softwarization concept in a real-world scenario, 3 coordinator nodes along with 17 leaf nodes were distributed in scenarios with varying densities of gateway nodes, as shown in
Figure 23 (
= 1) and
Figure 24 (
= 2). The data gathering time for each density scenario was set to
. The message rate was also increased from 1 to 20
. The packet delivery and power consumption were utilized to evaluate the communication performance of the proposed physical network model.


