
Autism Screening in Toddlers and Adults Using Deep Learning and Fair AI Techniques

Abstract
:1. Introduction
2. Materials and Methods
2.1. Related Works
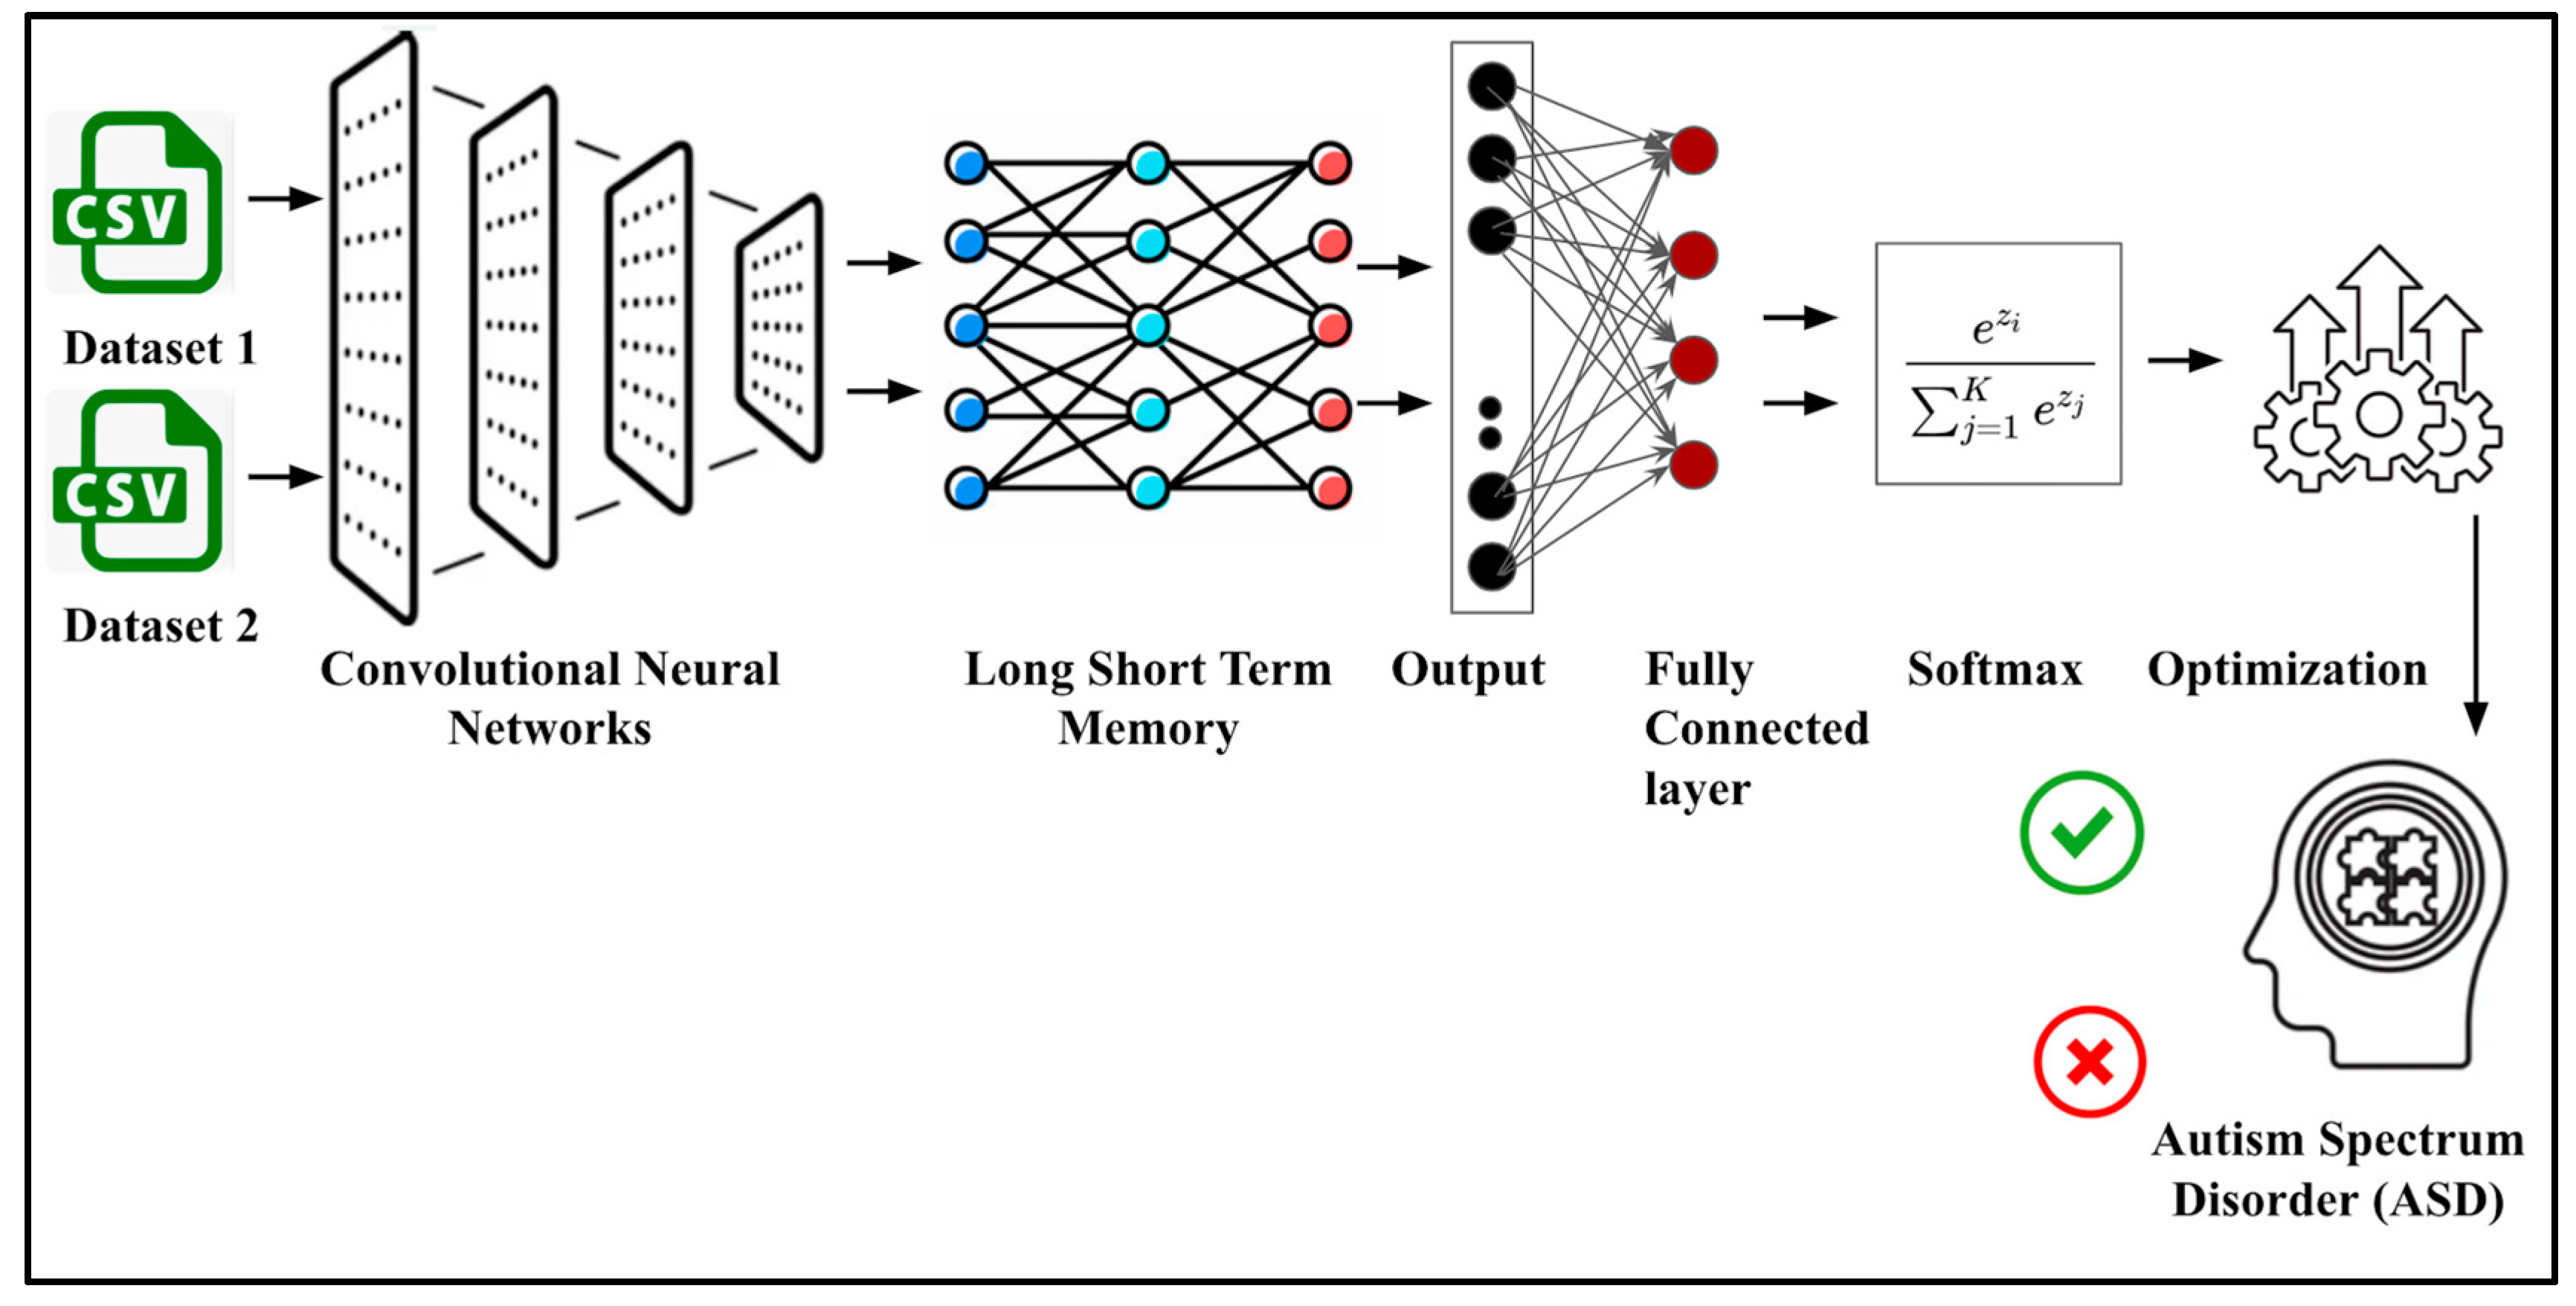
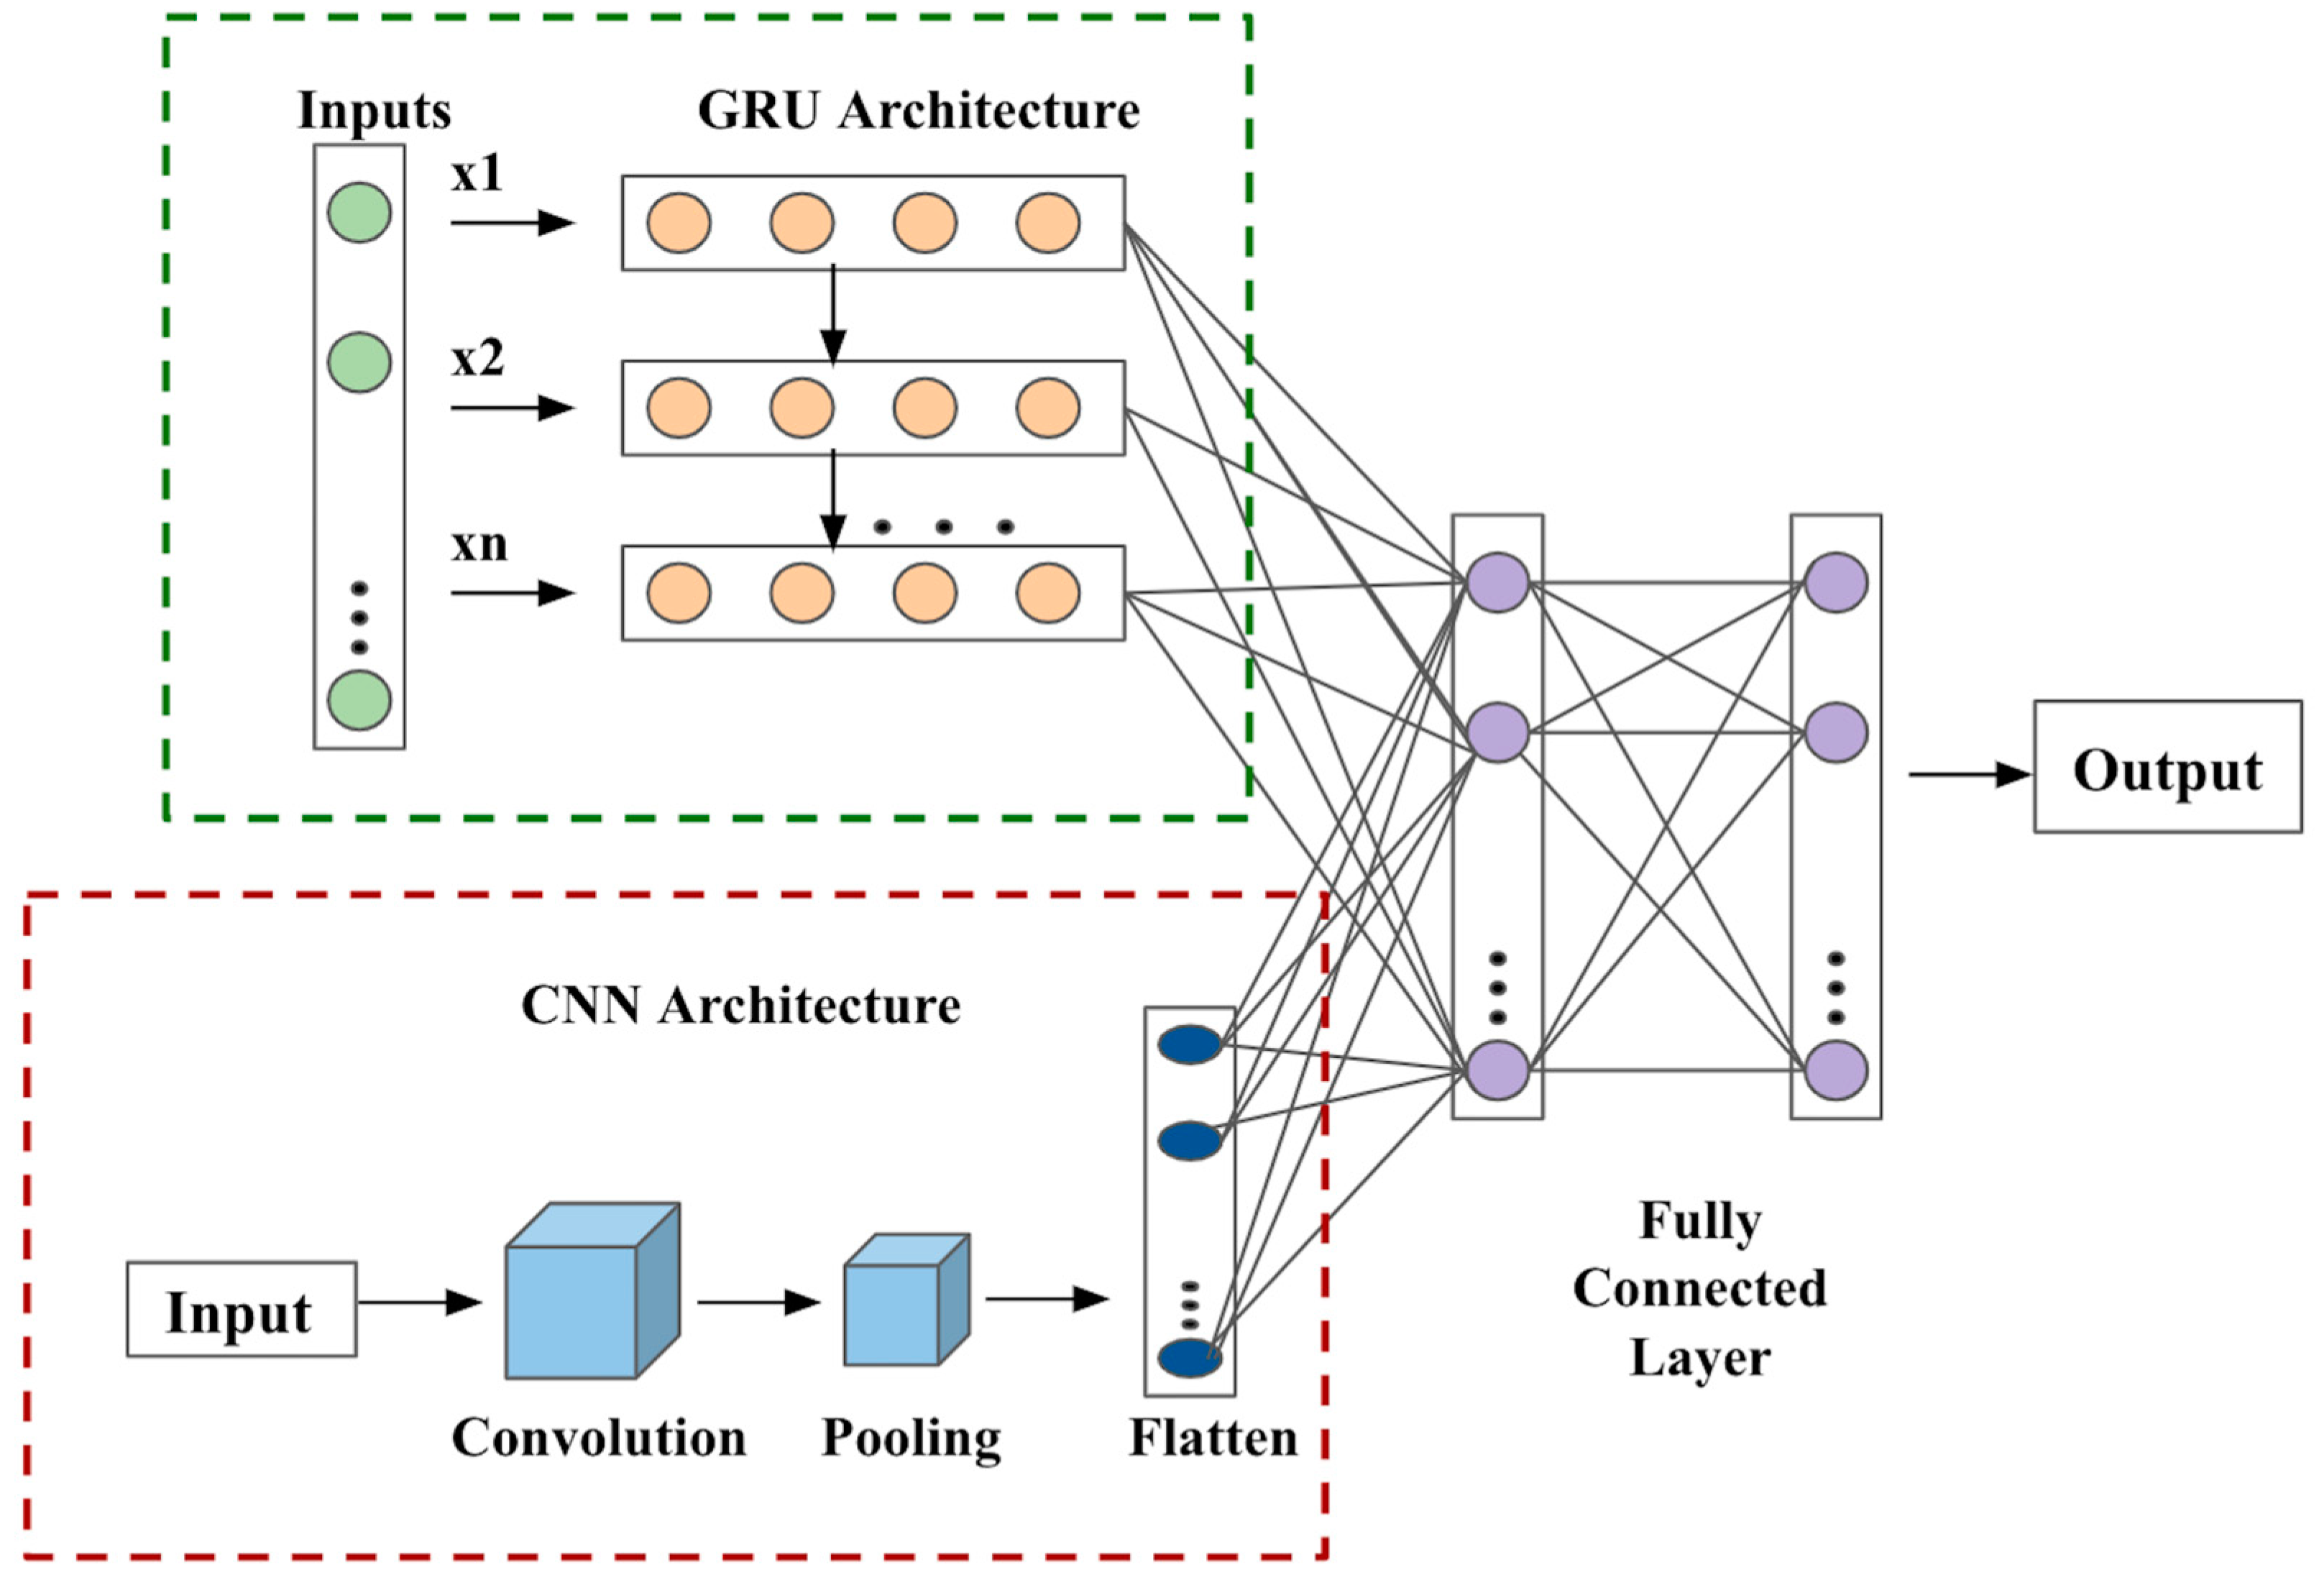
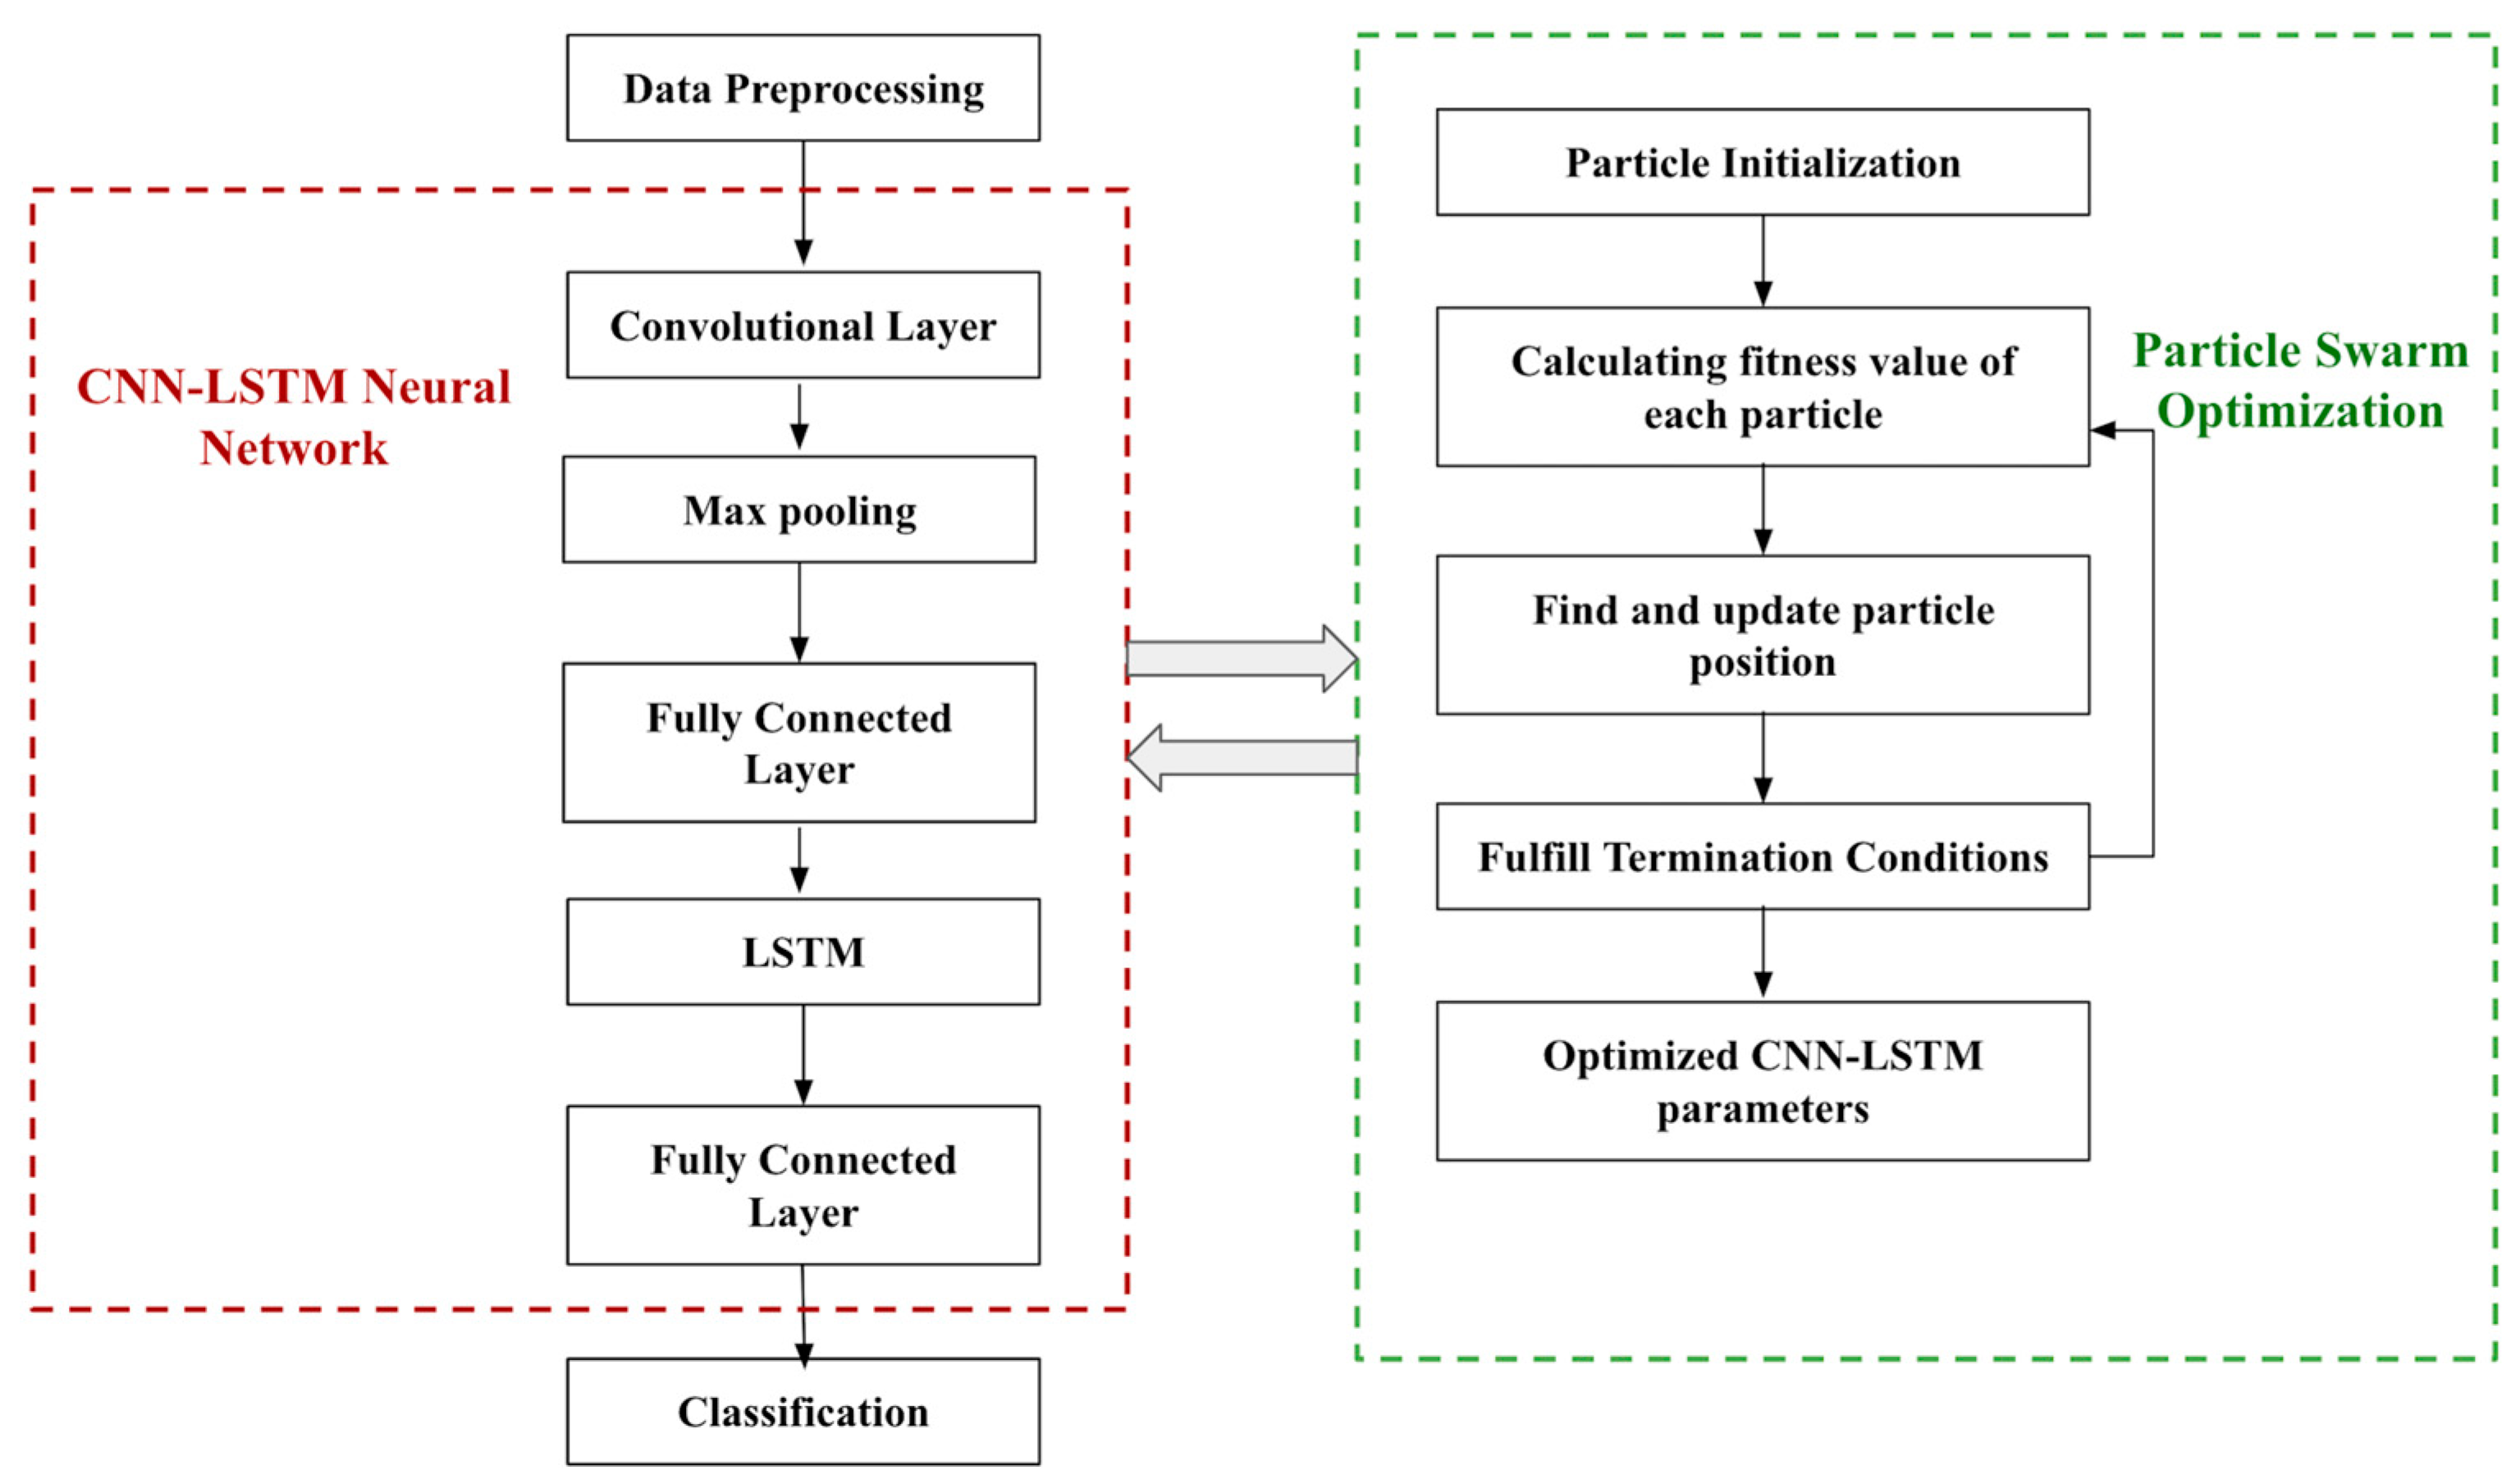
2.2. Methodology
2.3. AI Fairness Techniques
- Handling outliers: Outliers depict significantly high and low values in the dataset and can affect the classification problem. The main techniques for handling outliers are removing, replacing the values, capping, and discretization. Outliers may be eliminated from a distribution; however, removing a large chunk of outliers may be the direct consequence of outliers over multiple variables. Often, outliers can be treated as missing values and imputed using appropriate methods. Maximum and minimum values can be capped and replaced with random values;
- Transformations: Transformation techniques are applied to skewed data that do not exhibit a normal distribution. These popular techniques include logarithmic, Square Root, and Box–Cox transformations. Logarithmic transformation is capable of squashing large numbers and expanding small numbers;
- Scaling and normalization: Machine-learning algorithms are often sensitive to the scale of input values. Min–max scaling and Standardization/Variance scaling are popular normalization methods. Min–max scaling rescales values between 0 and 1, while standardization/variance scaling ensures that the distribution has a mean of 0 and a variance of 1. This is particularly useful when variables are on a different scale and, therefore, treated differently. Normalization and standardization techniques ensure that the scale is modified to eliminate bias while retaining meaningful information;
- SMOTE: Imbalance dataset can lead to flawed classification. The Synthetic Minority Oversampling Technique (SMOTE) is a technique of oversampling minority classes to handle the class imbalance problem. The data points in the minority class are duplicated while not adding new information to the dataset, thereby synthesizing new data from existing data. The algorithm takes samples of the feature space for each target class and its nearest neighbors. The features of the target class are combined with the features of the neighbors to generate new data. The technique generates additional data and makes the samples more general by increasing the percentage of minority samples only;
- Optimization using PSO: This study introduces a primary optimization technique as a proposed hybrid neural network architecture component. Particle Swarm Optimization (PSO) is a stochastic optimization technique miming swarms’ social interaction and behavior. Each particle in the swarm is denoted by positional coordinates, updating according to the best solution. Finding the optimal solution in high dimensional space primarily involves minimizing the cost function to reduce error. The heuristic model works as follows:
- Optimization using Adam: The Adam optimizer improves the Stochastic Gradient Descent for updating network weights iteratively during the learning process. It is easy to implement and computationally efficient. It requires little training for the hyperparameters and does not need a lot of memory to run. Adam incorporates the Adaptive Gradient Algorithm (AdaGrad) and the Root Mean Square Propagation (RMSProp). AdaGrad is responsible for maintaining a pre-parameter learning rate to reduce error and improve overall performance. In contrast, RMSProp maintains the learning rates based on an average of recent magnitudes of weights. Adam uses an average of second moments of the gradient and calculates the exponential moving average of the gradient and squared gradient. It also takes into account parameters that are essential for controlling decay rates (beta1 and beta2). Adam has several parameters:
- Focal Loss: Focal Loss functions and an extension of cross-entropy are used for handling class imbalance problems by applying a modulating term to the class entropy loss. More weights are assigned to hard or easily misclassified images, which could be imaged with noisy data, partial images, or background images. As the loss contribution from easy examples is reduced, misclassified images get corrected. It is a method of dynamically scaling the cross-entropy loss such that the scaling factor decays to zero. This leads to an increase in confidence in the correct classes. The scaling factor hence weights the impact of easy examples while training, ensuring that the model is focused on hard examples;
- Focal Tversky Loss: Neural networks often deploy Tversky loss for image segmentation problems. It is a loss function that is used to handle an imbalance in images, specifically when the number of positive pixels is orders of magnitude smaller than the number of negative pixels. The function is capable of comparing and predicting the outputs of neural networks with the true output. For image segmentation problems, the segmented image acts as the predicted output, whereas the ground truth segmentation of the same image is the true output. Unlike other loss functions like binary cross-entropy loss and dice coefficient, the Tversky loss allows more control over the relationship between precision and recall. It is possible to penalize false negatives more heavily than false positives, and vice versa by adjusting the hyperparameters. Focal Tversky loss is more like a generalized Tversky loss that applies the concept of focal loss for focusing on hard cases with low probabilities.
3. Experimental Analysis
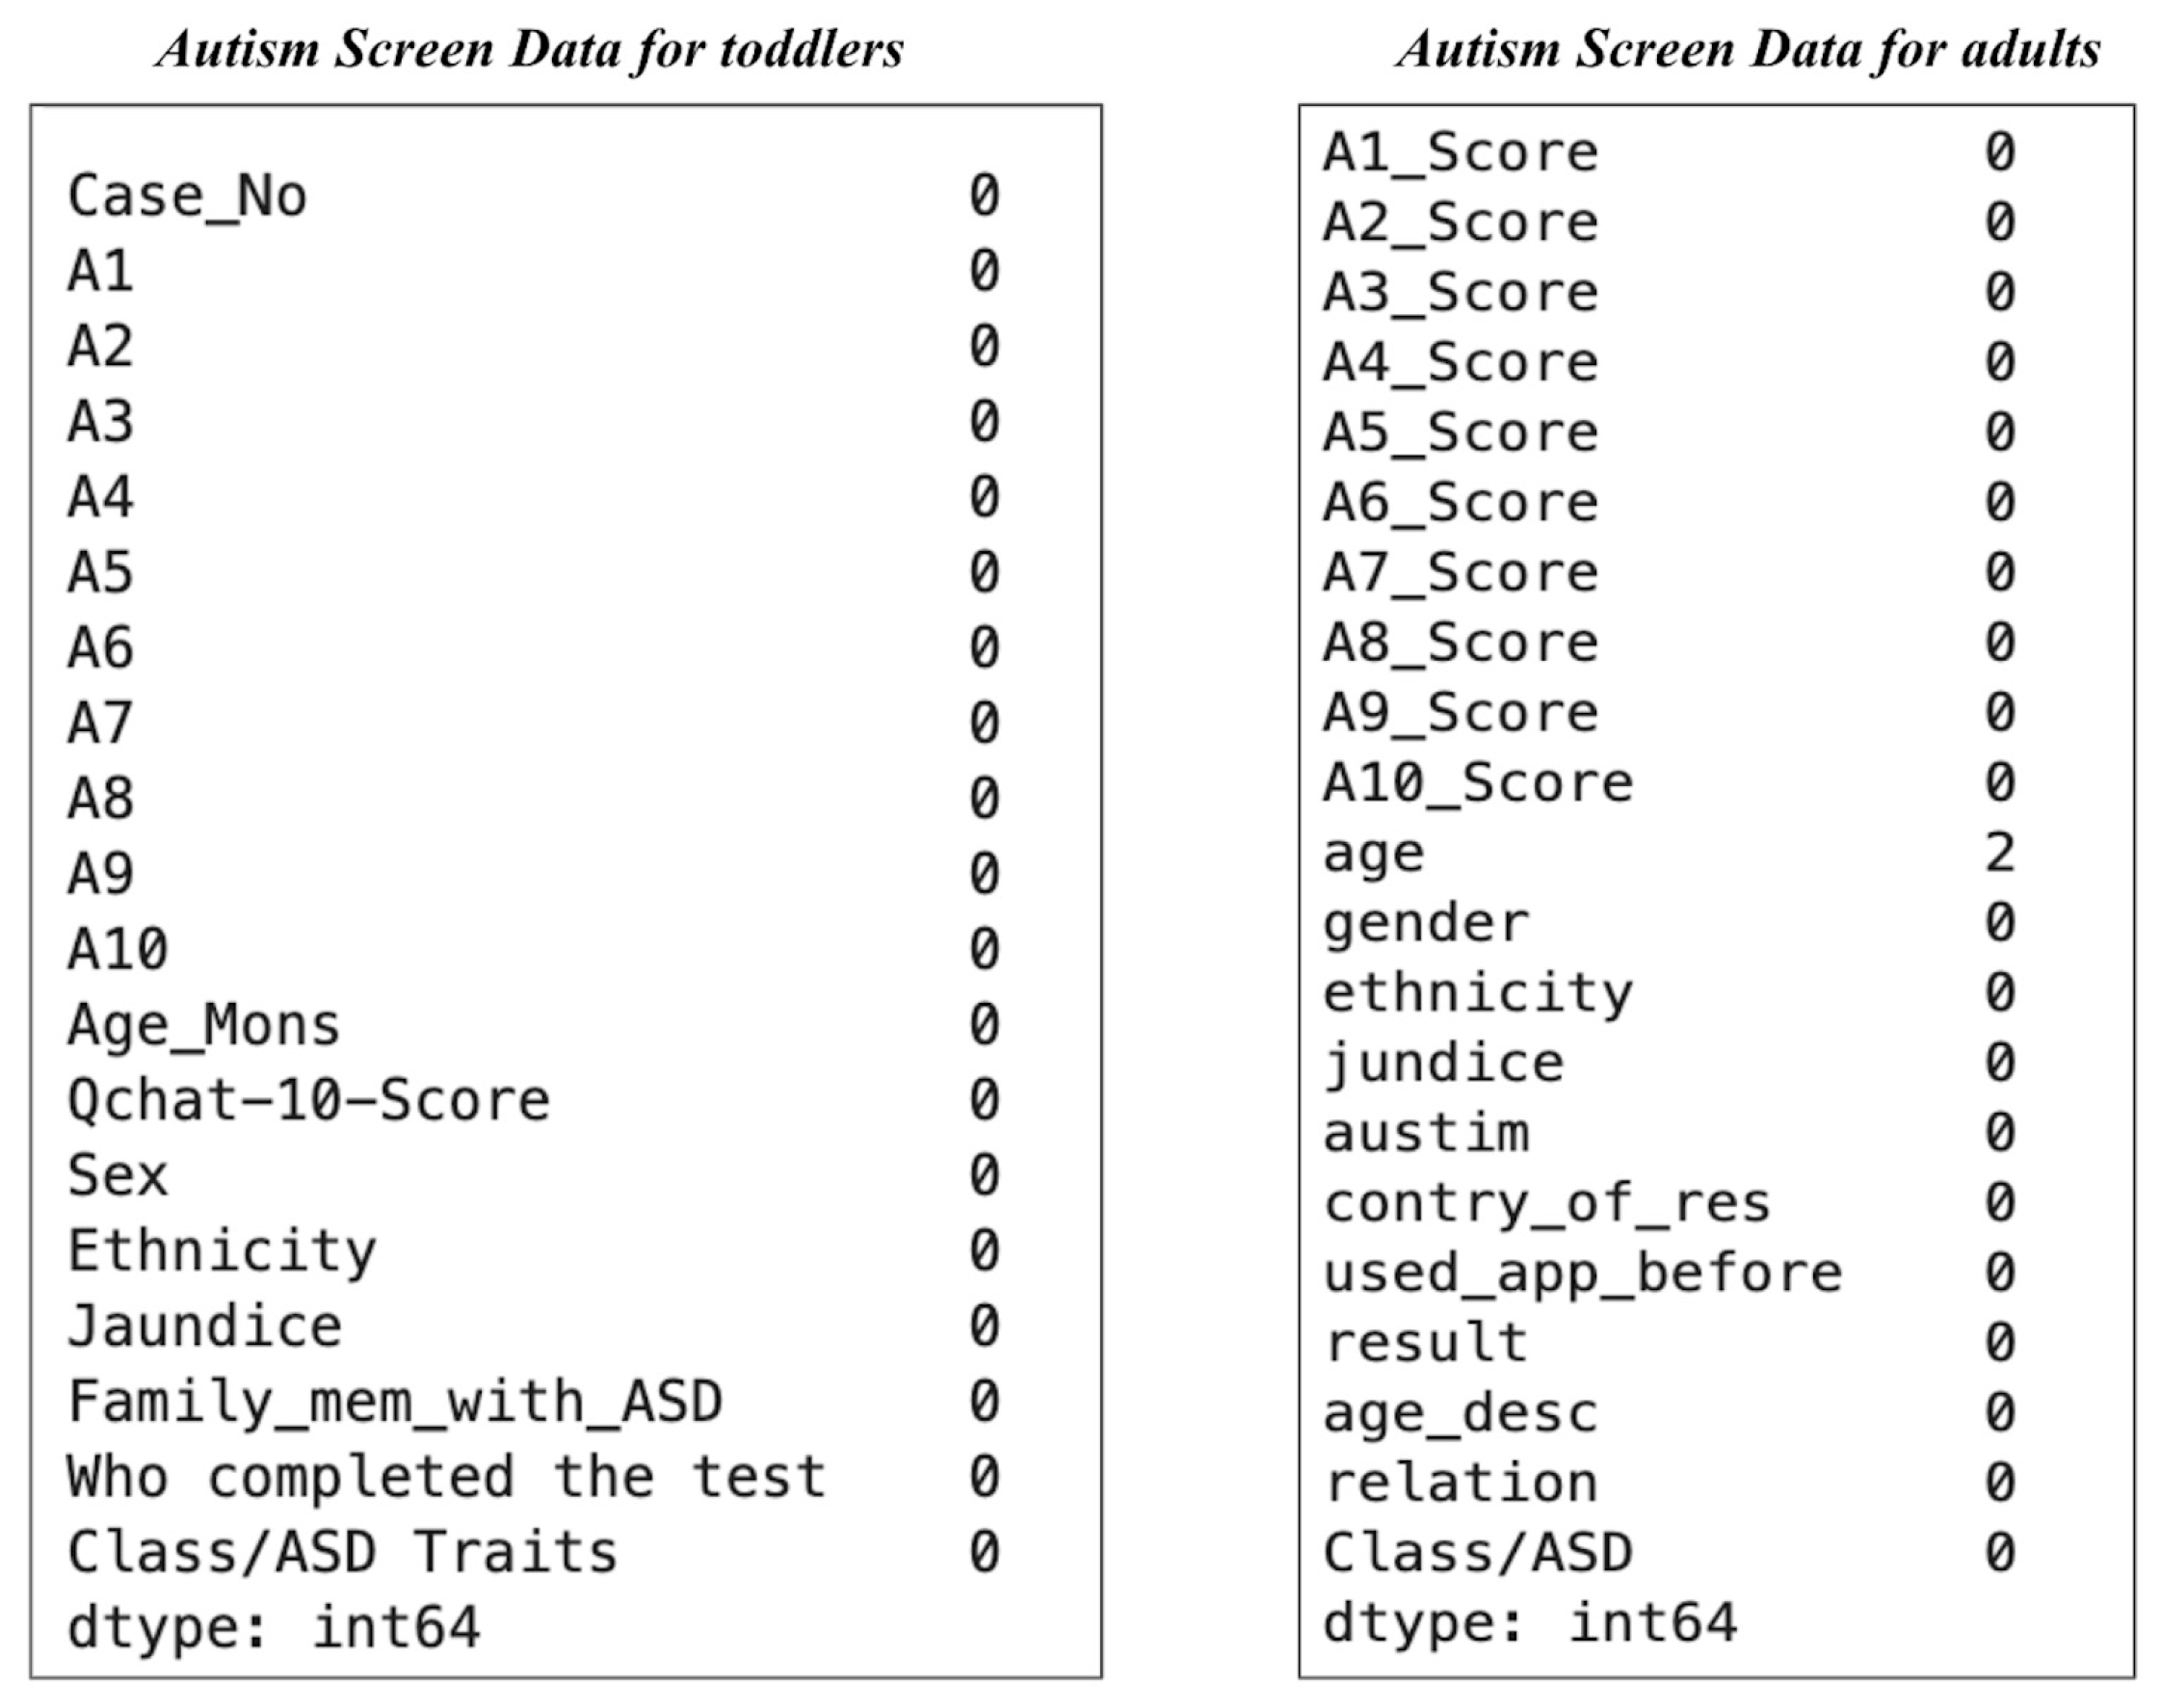
3.1. Datasets
3.2. Evaluation Metrics
- a.
- Accuracy: accuracy represents the summation ratio of true positives and true negatives divided by all possible prediction outcomes
- b.
- Precision: The precision score determines the ratio of correct positive predictions. The positive predictive value measures quality and can determine the success of prediction in the case of imbalance classes.
- c.
- Recall: Recall identifies correctly predicted positives out of actual positives. It can determine how good the model is at identifying actual positives given all positives in a dataset. It is also referred to as a true positive rate or sensitivity.
- d.
- F-1 Score: F-1 score is a function of precision and recall, as it considers both precision and recall for measuring the model performance. It is used when model optimization is the primary concern.
4. Results and Observations
4.1. Data Visualization
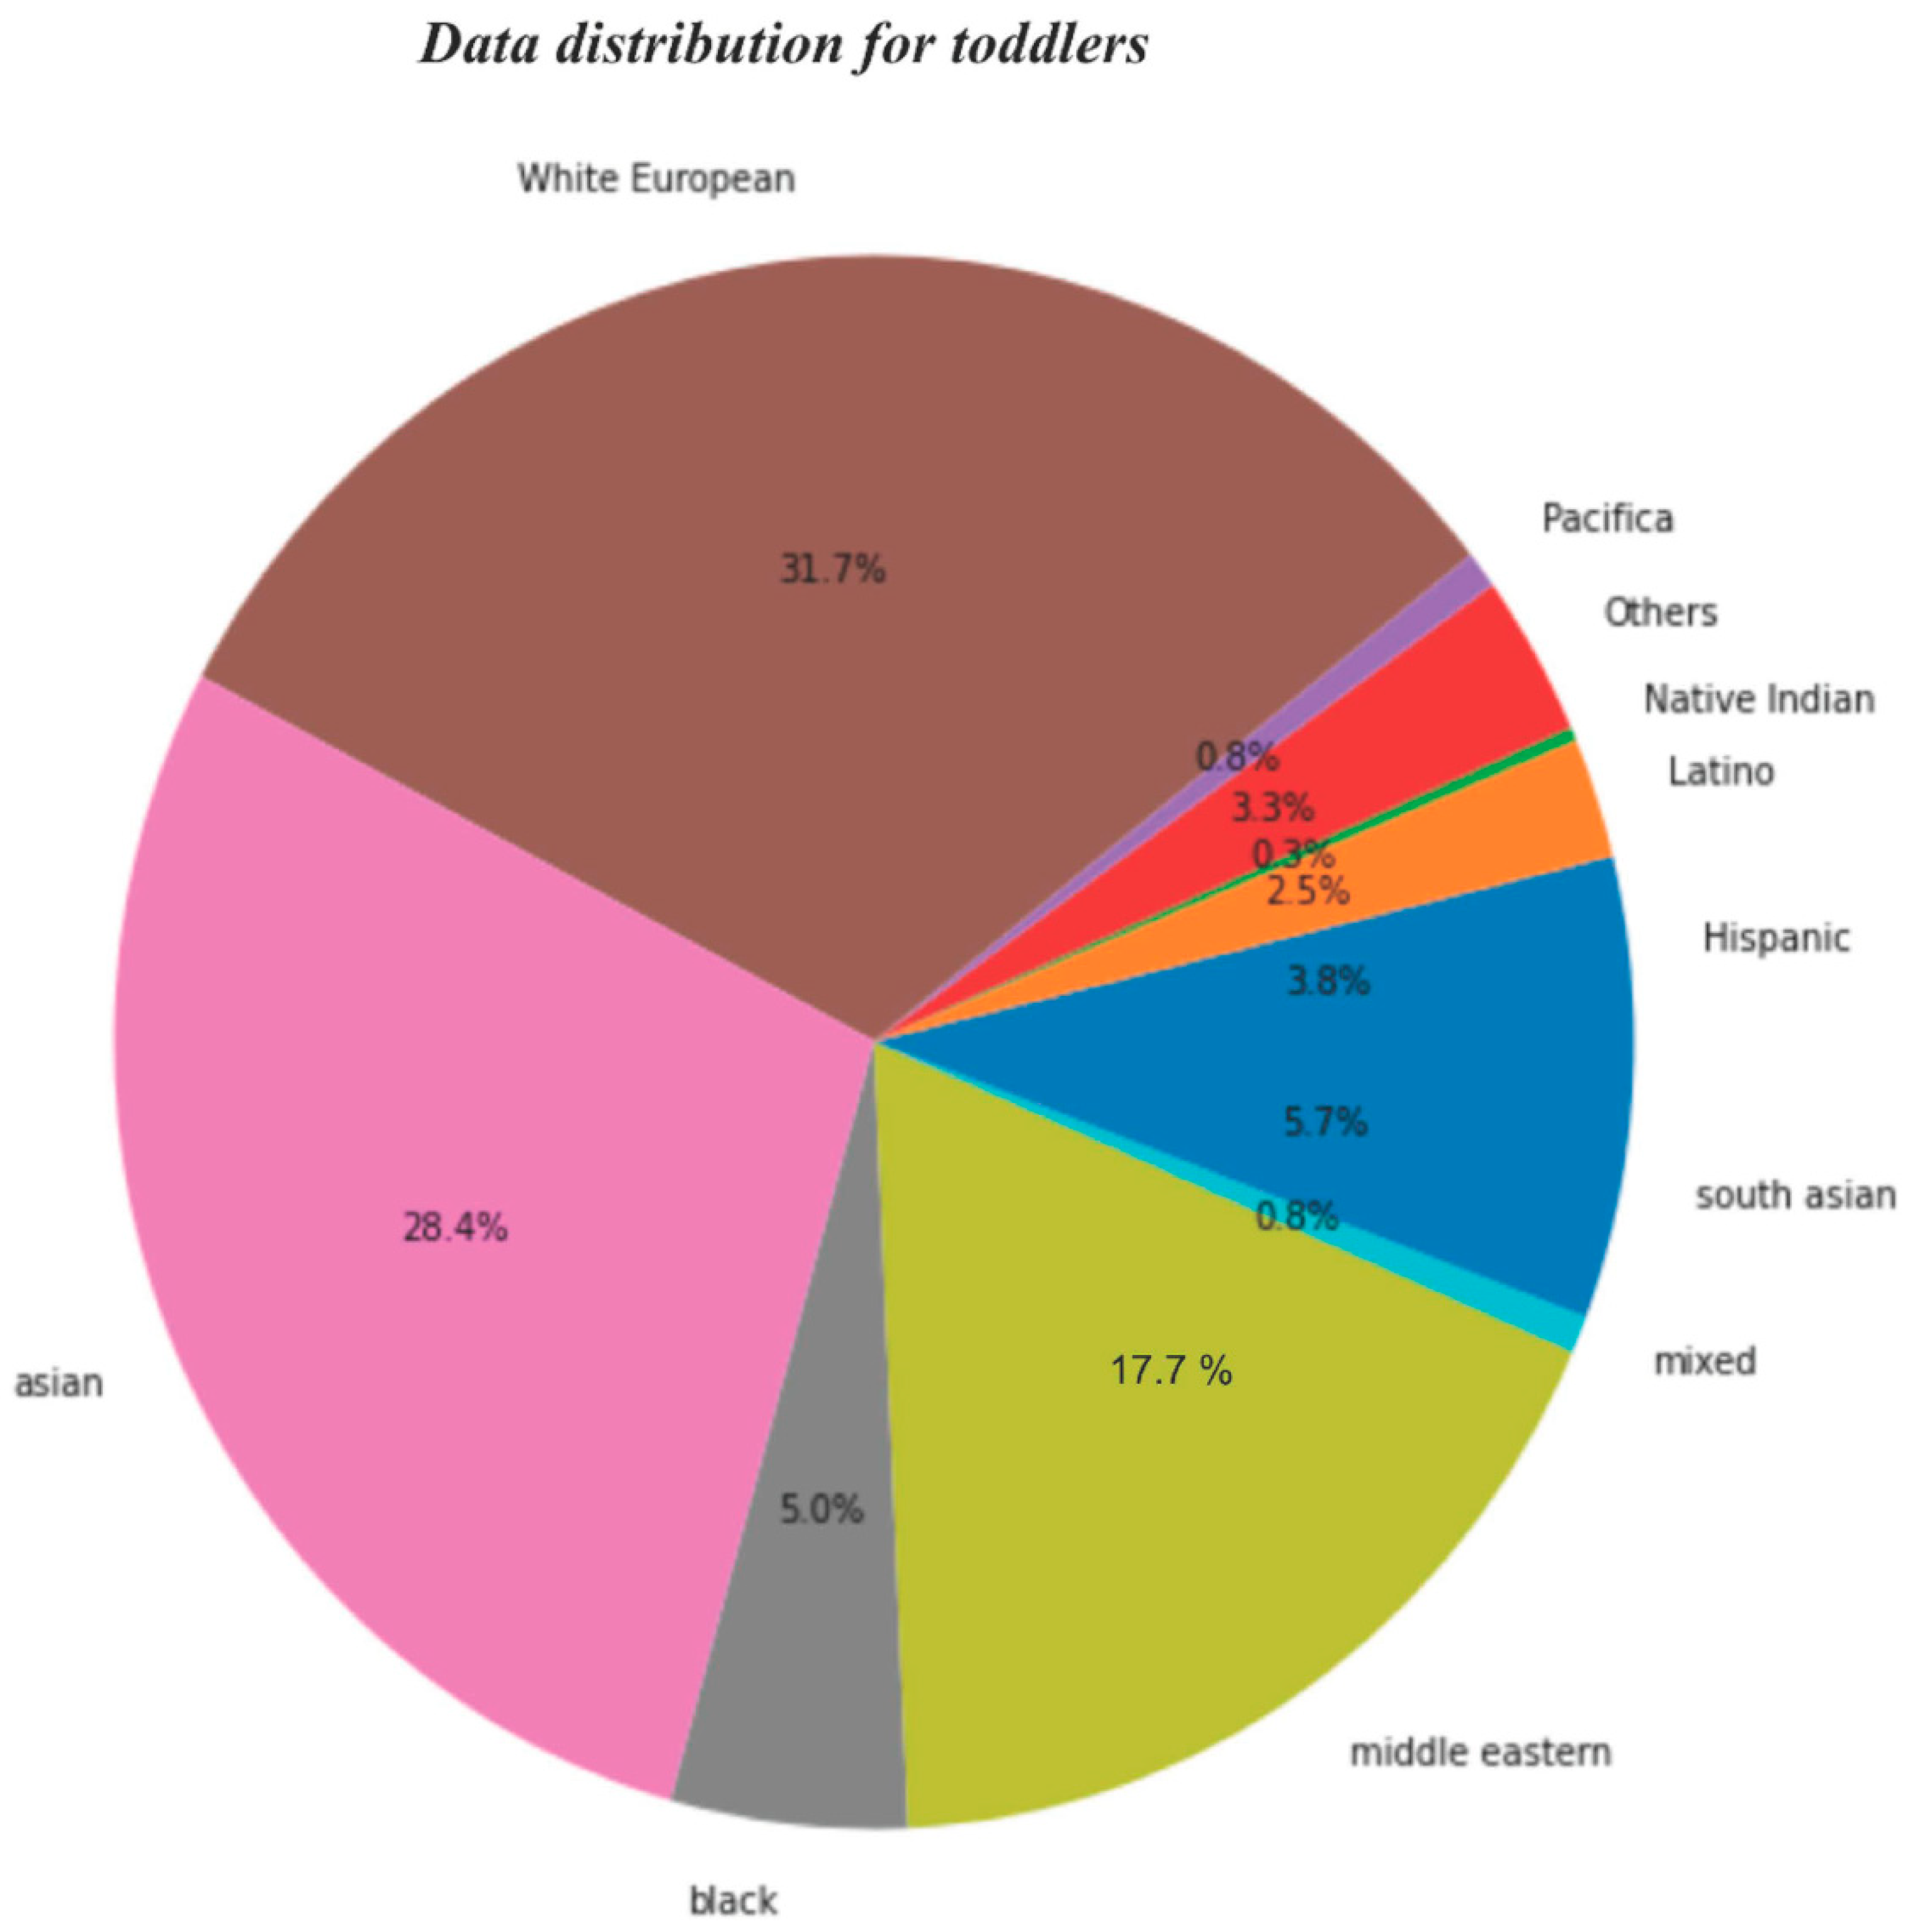
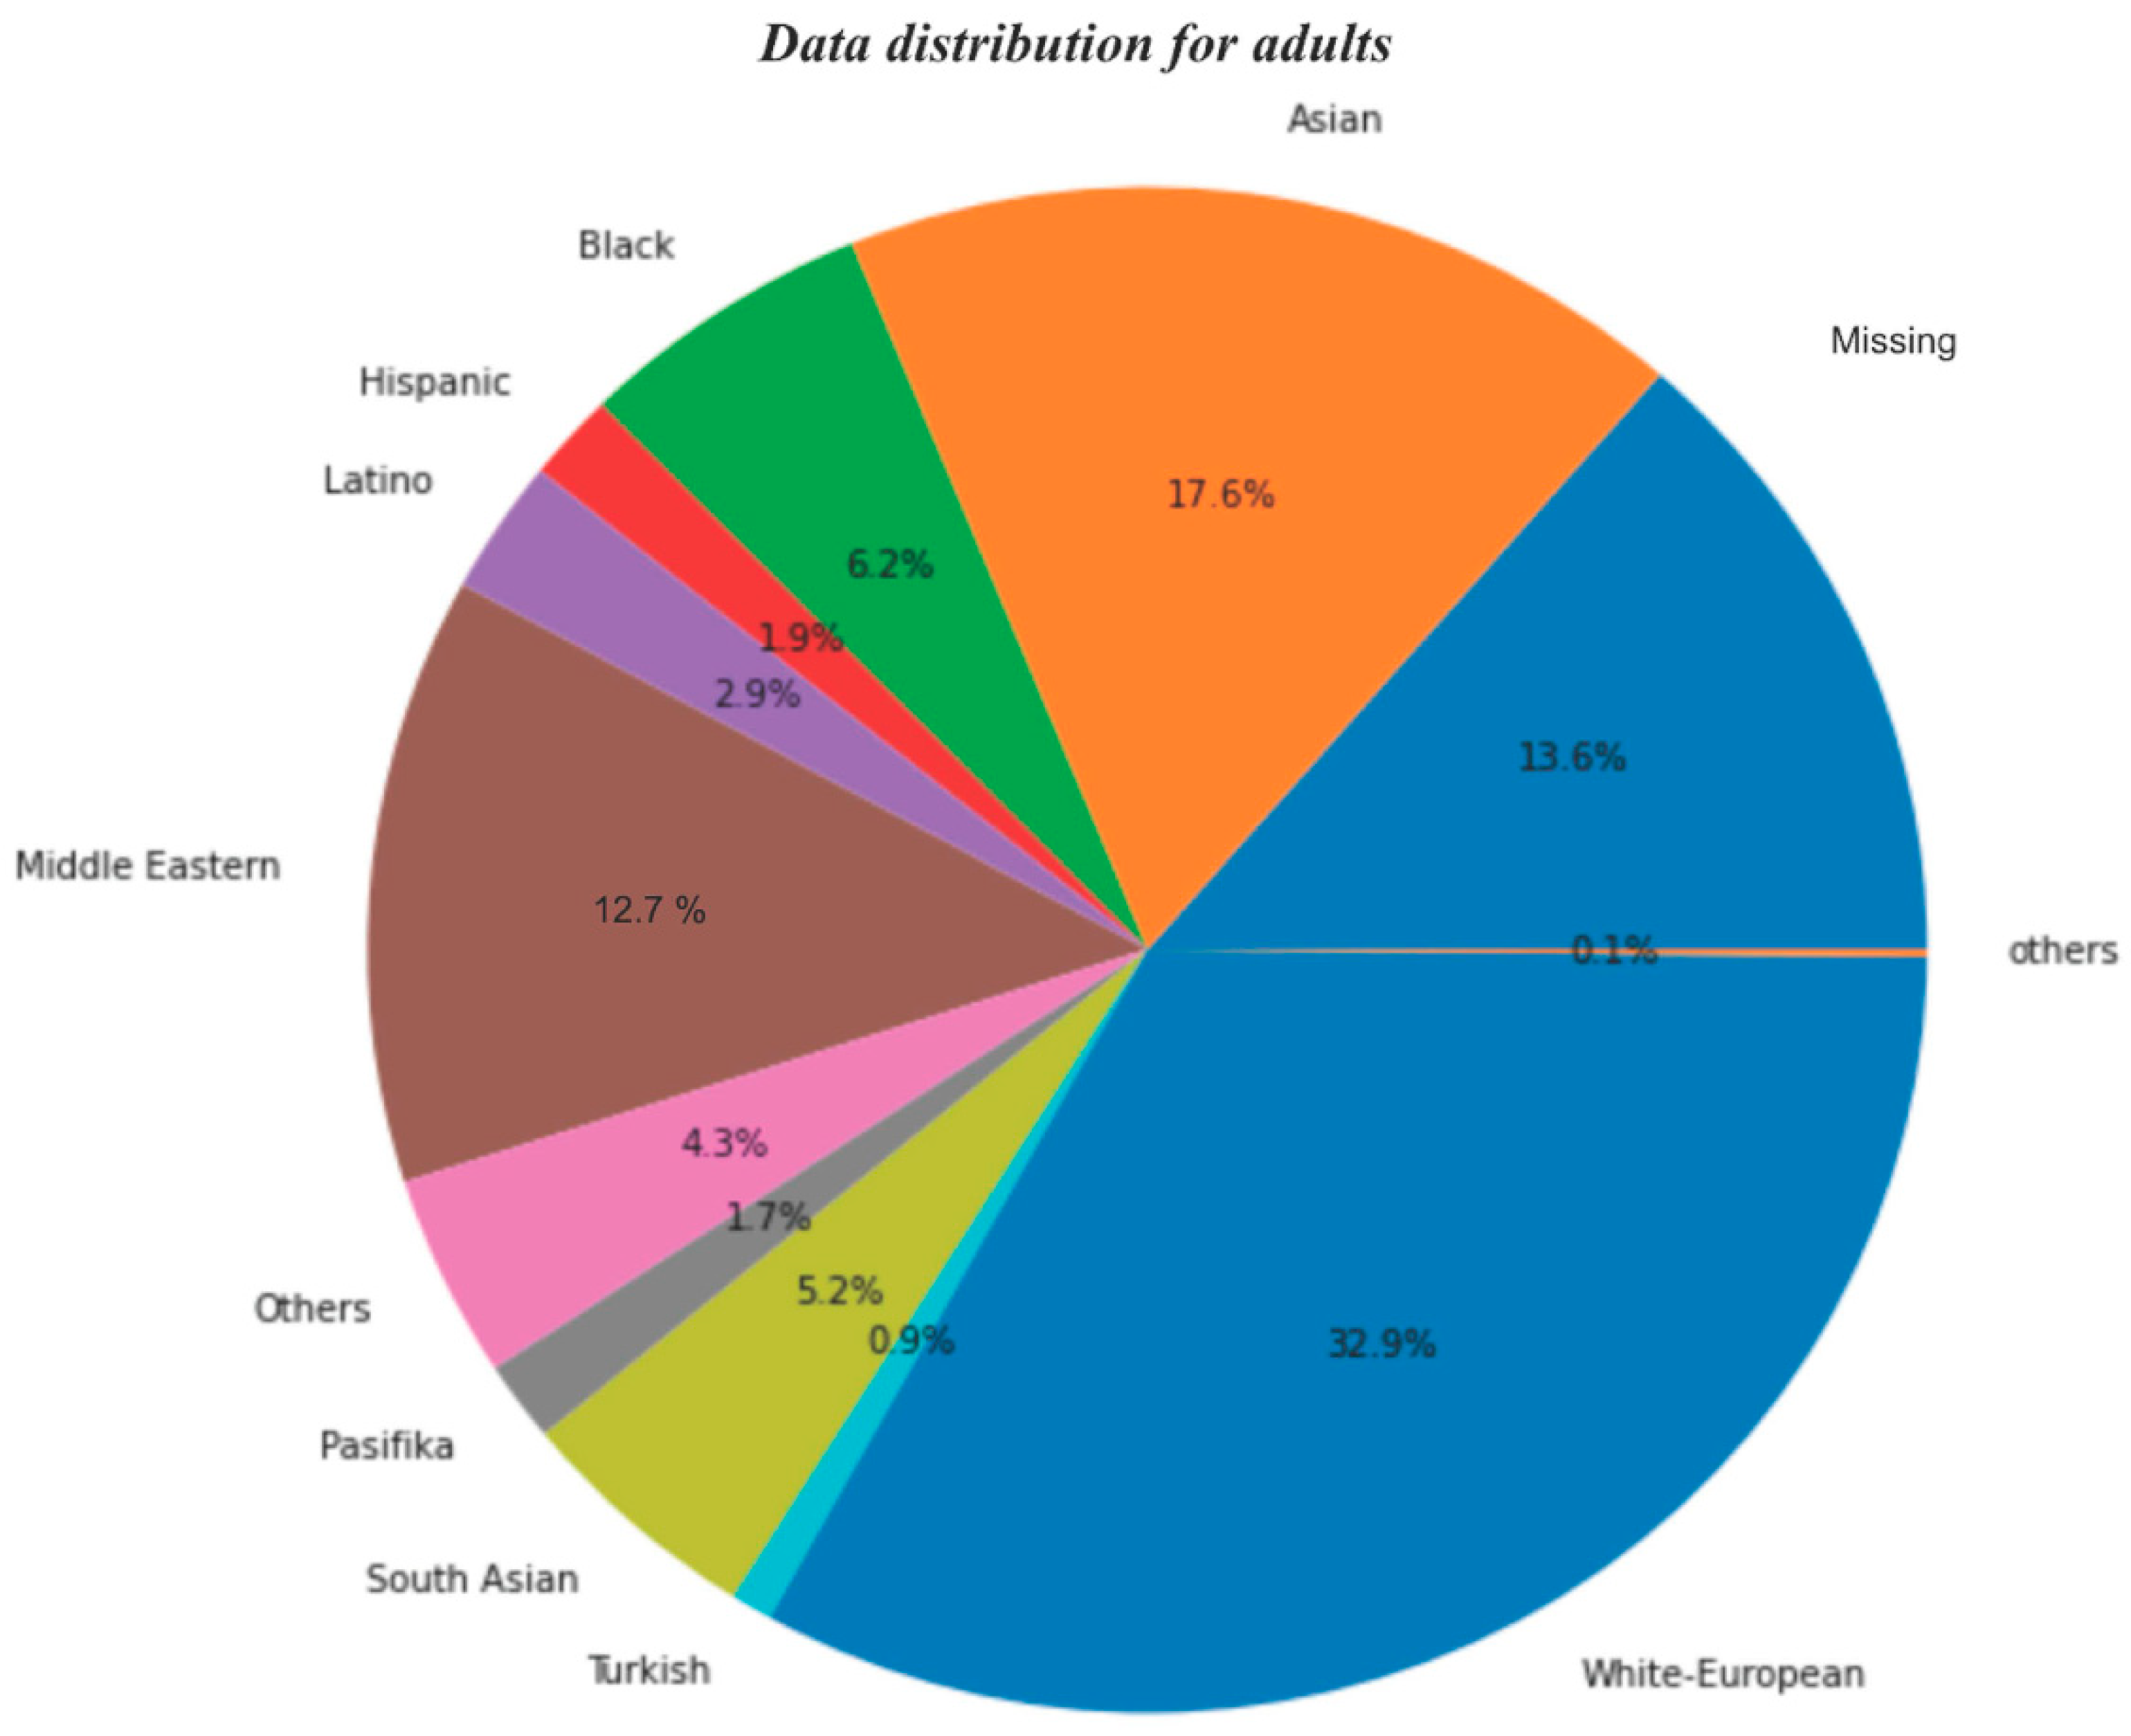
- Data distribution for ethnicity
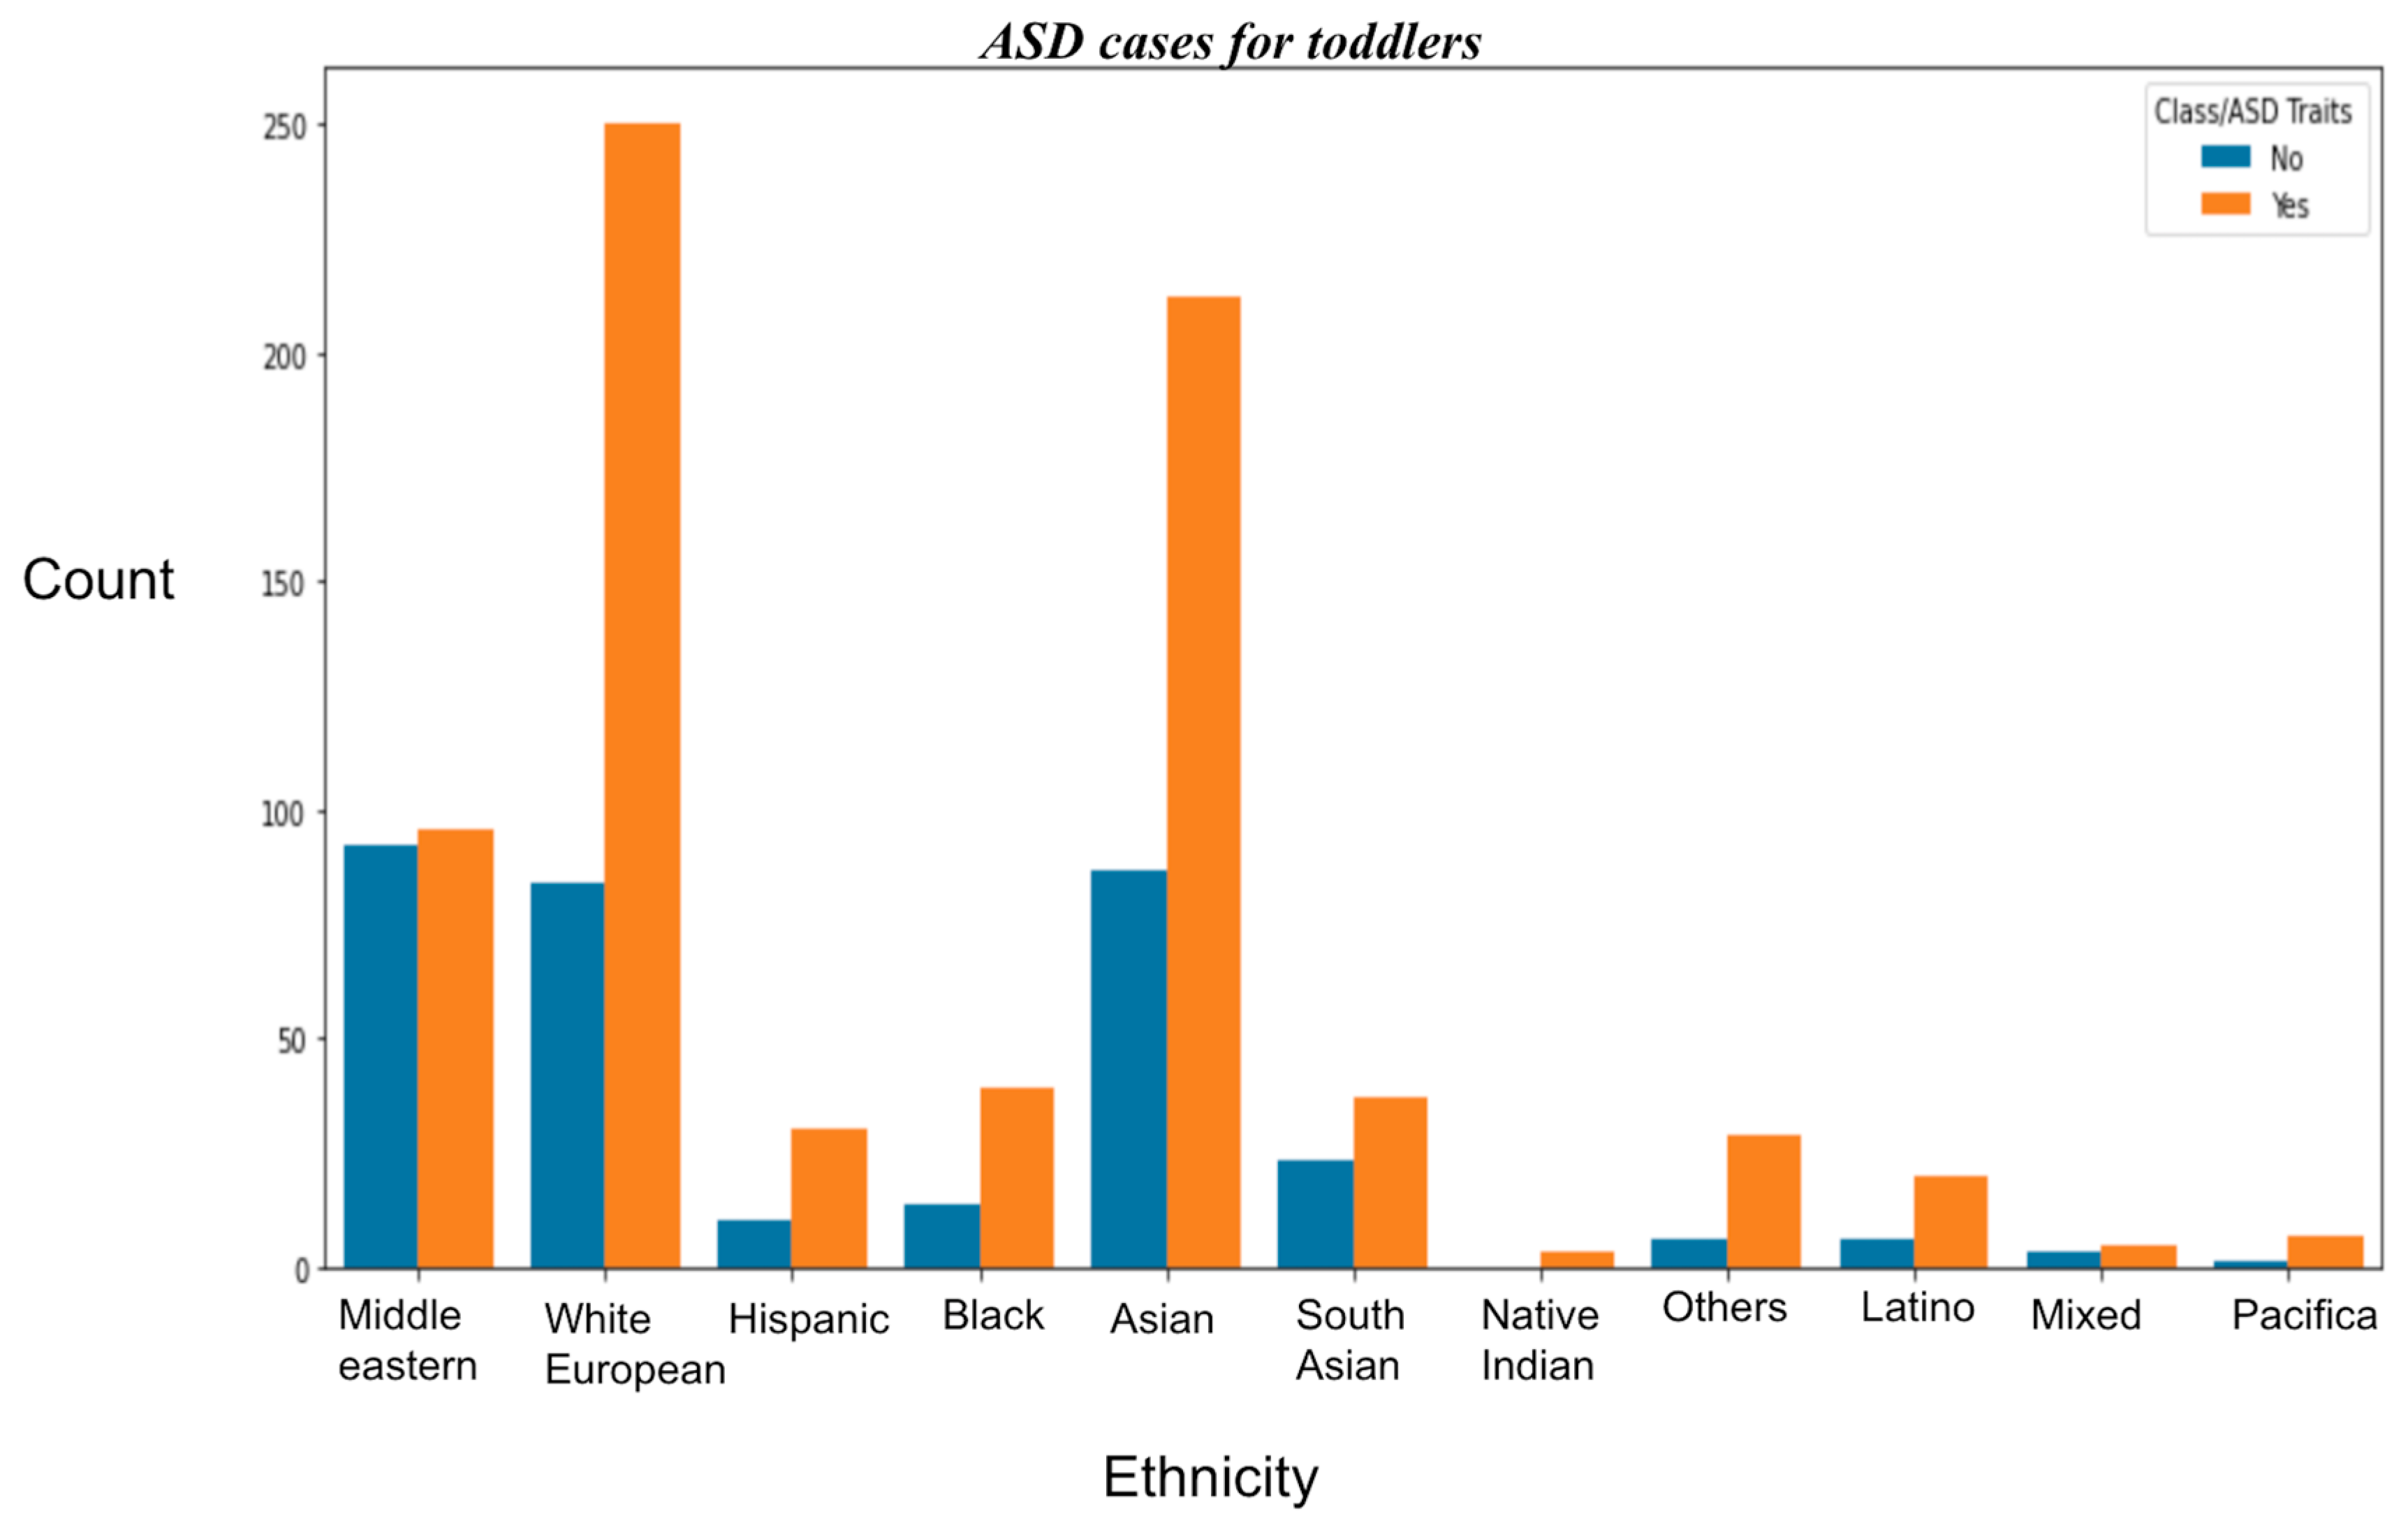
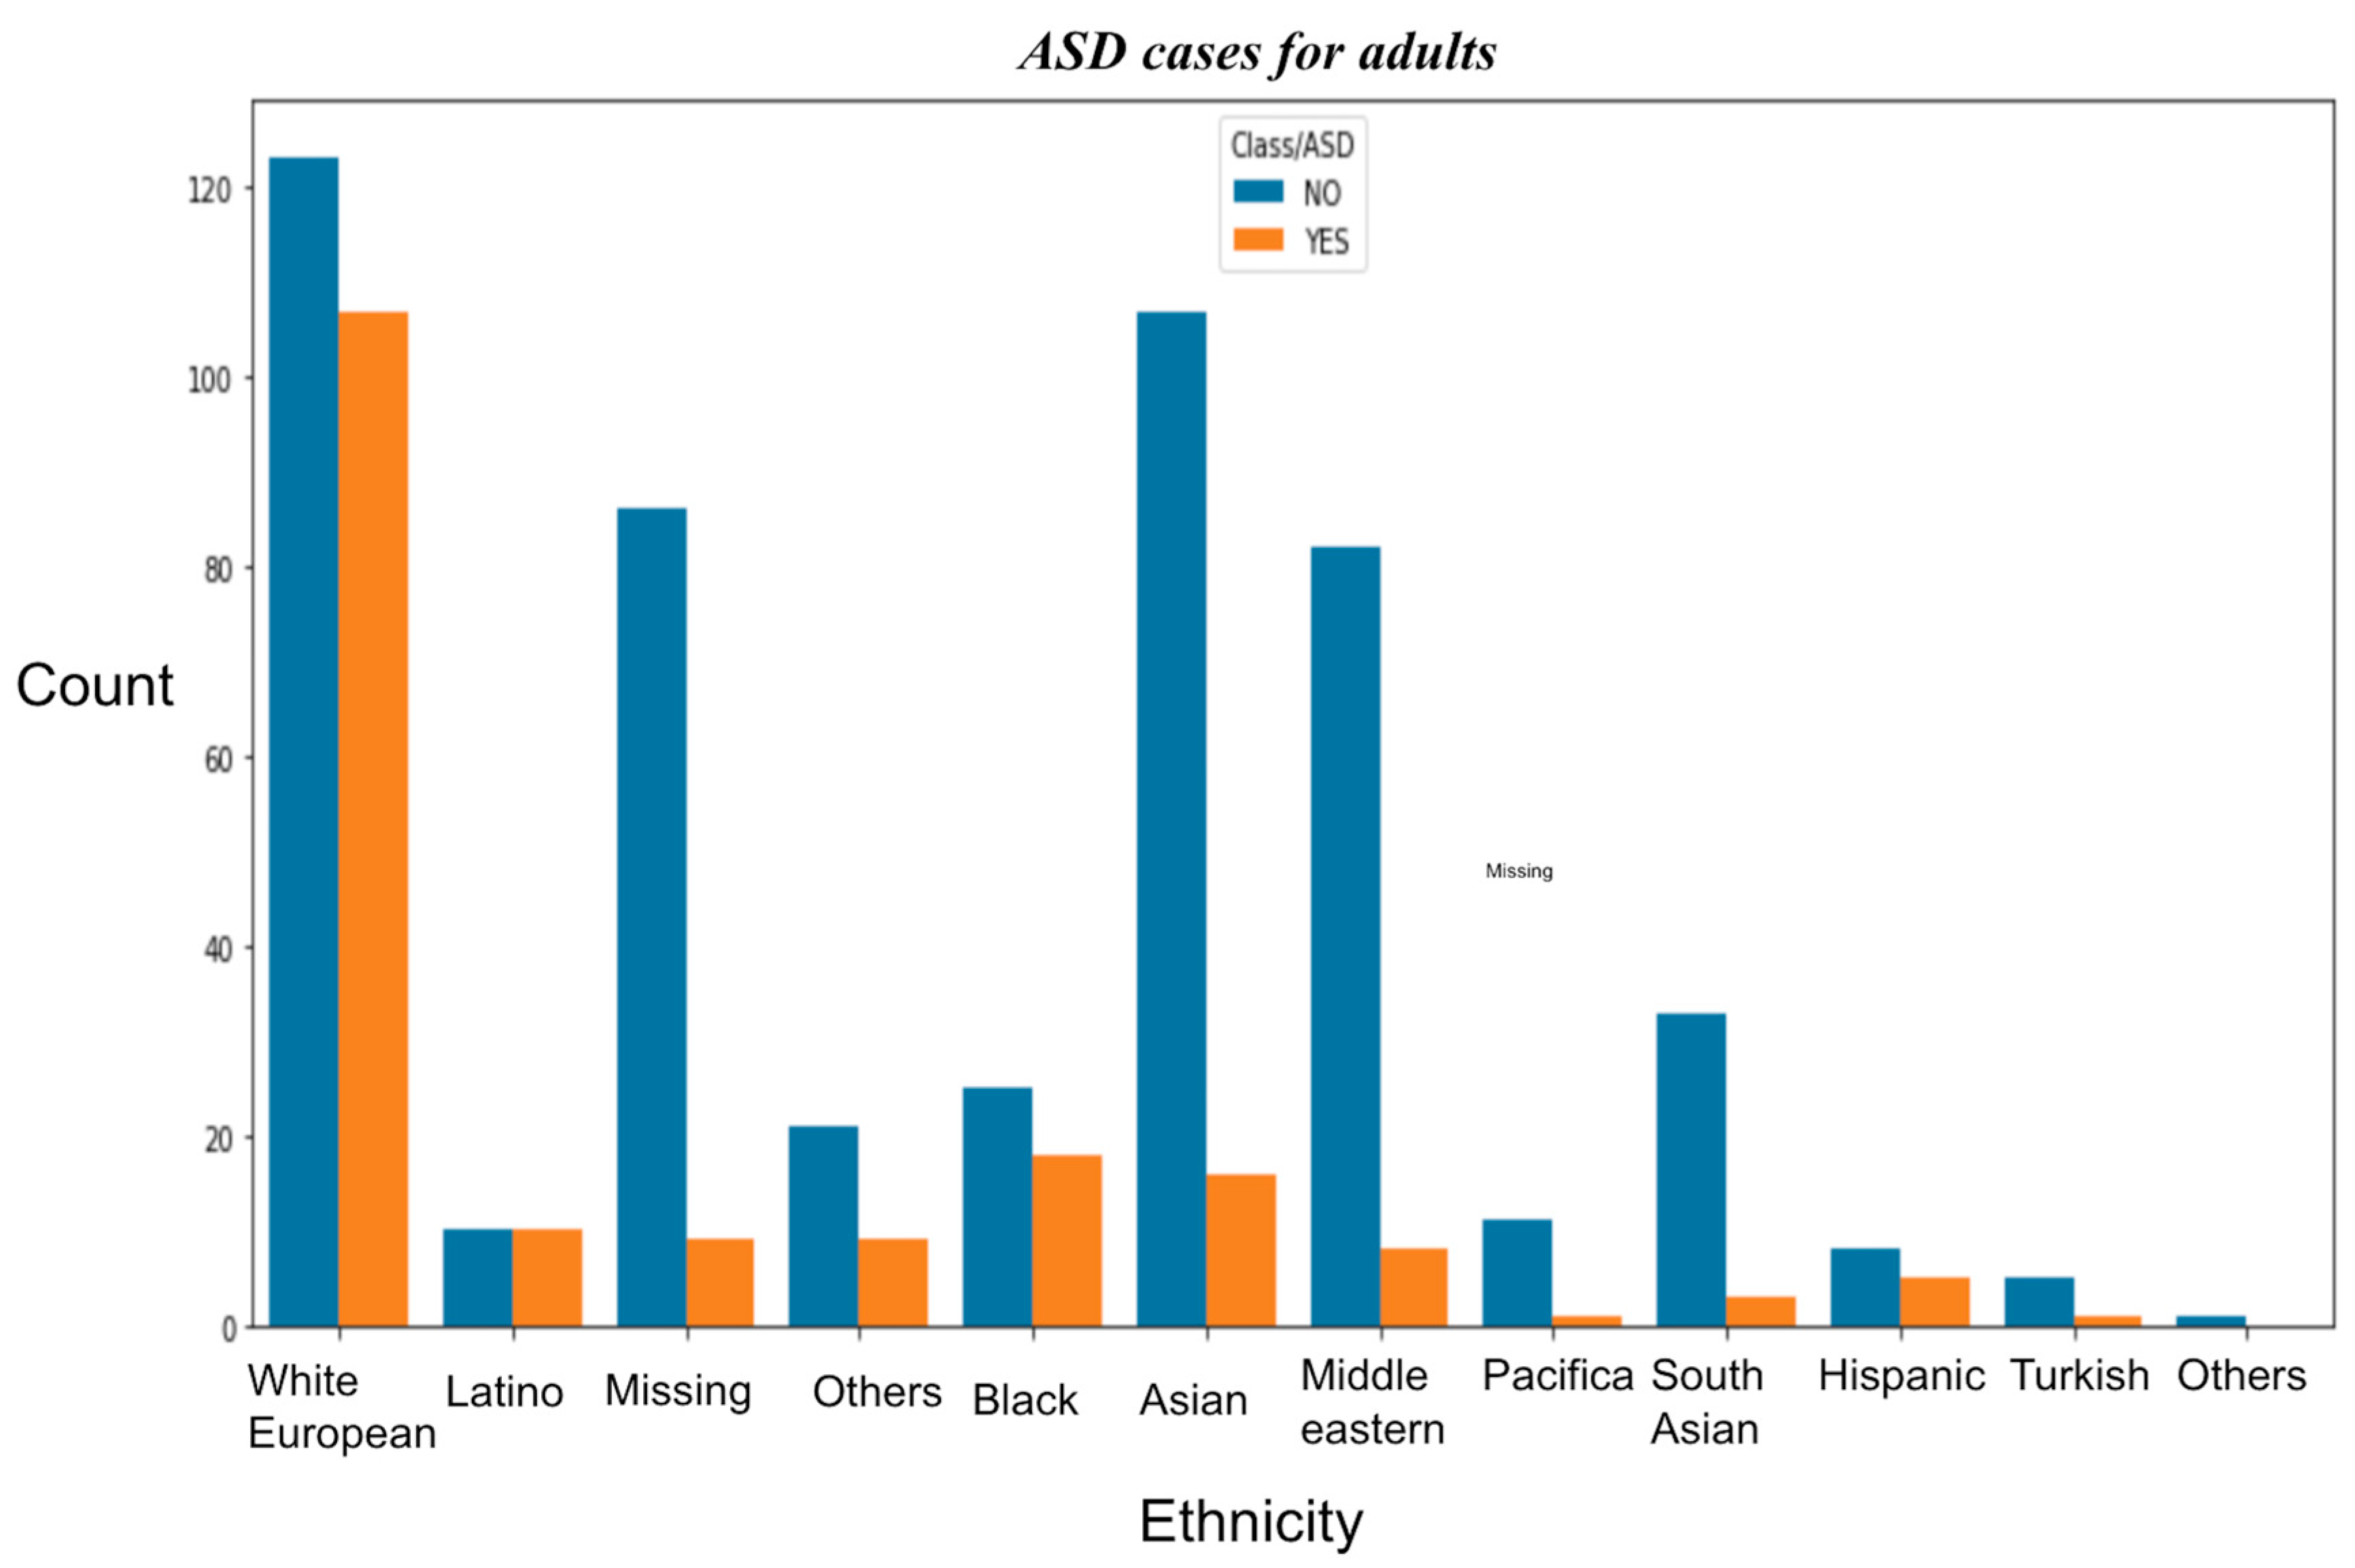
- Data distribution showing ethnicity vs. ASD traits.
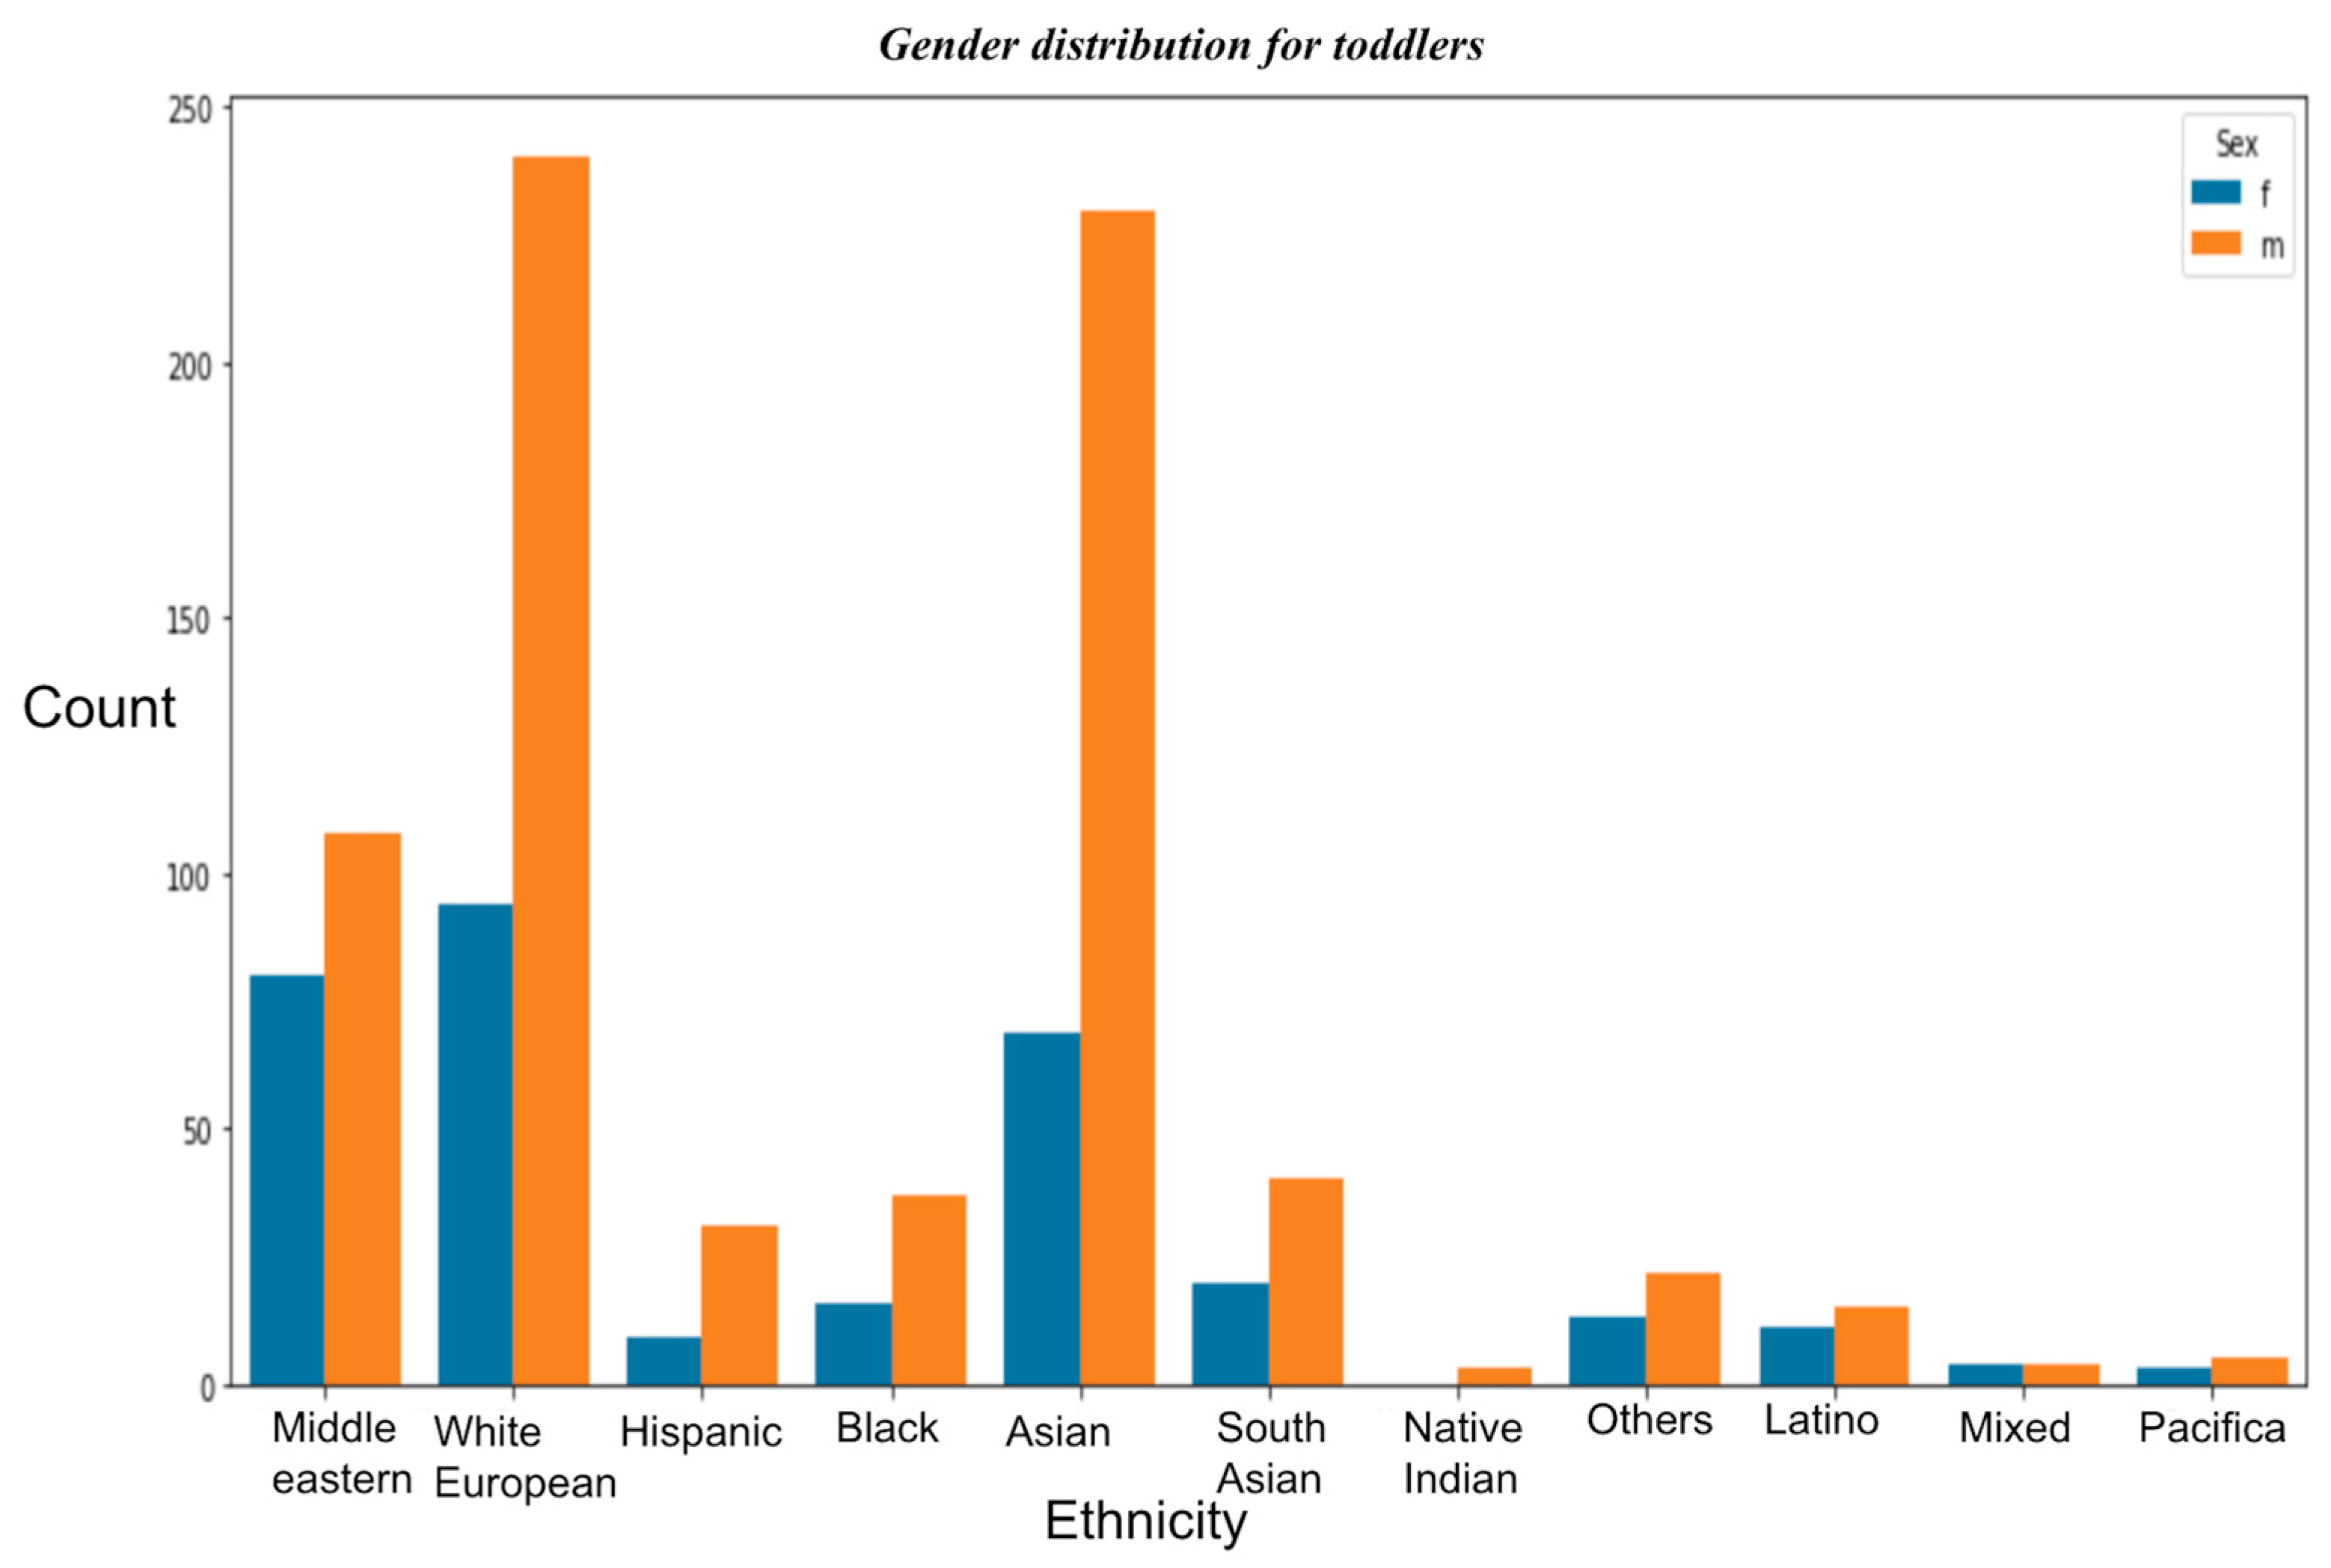
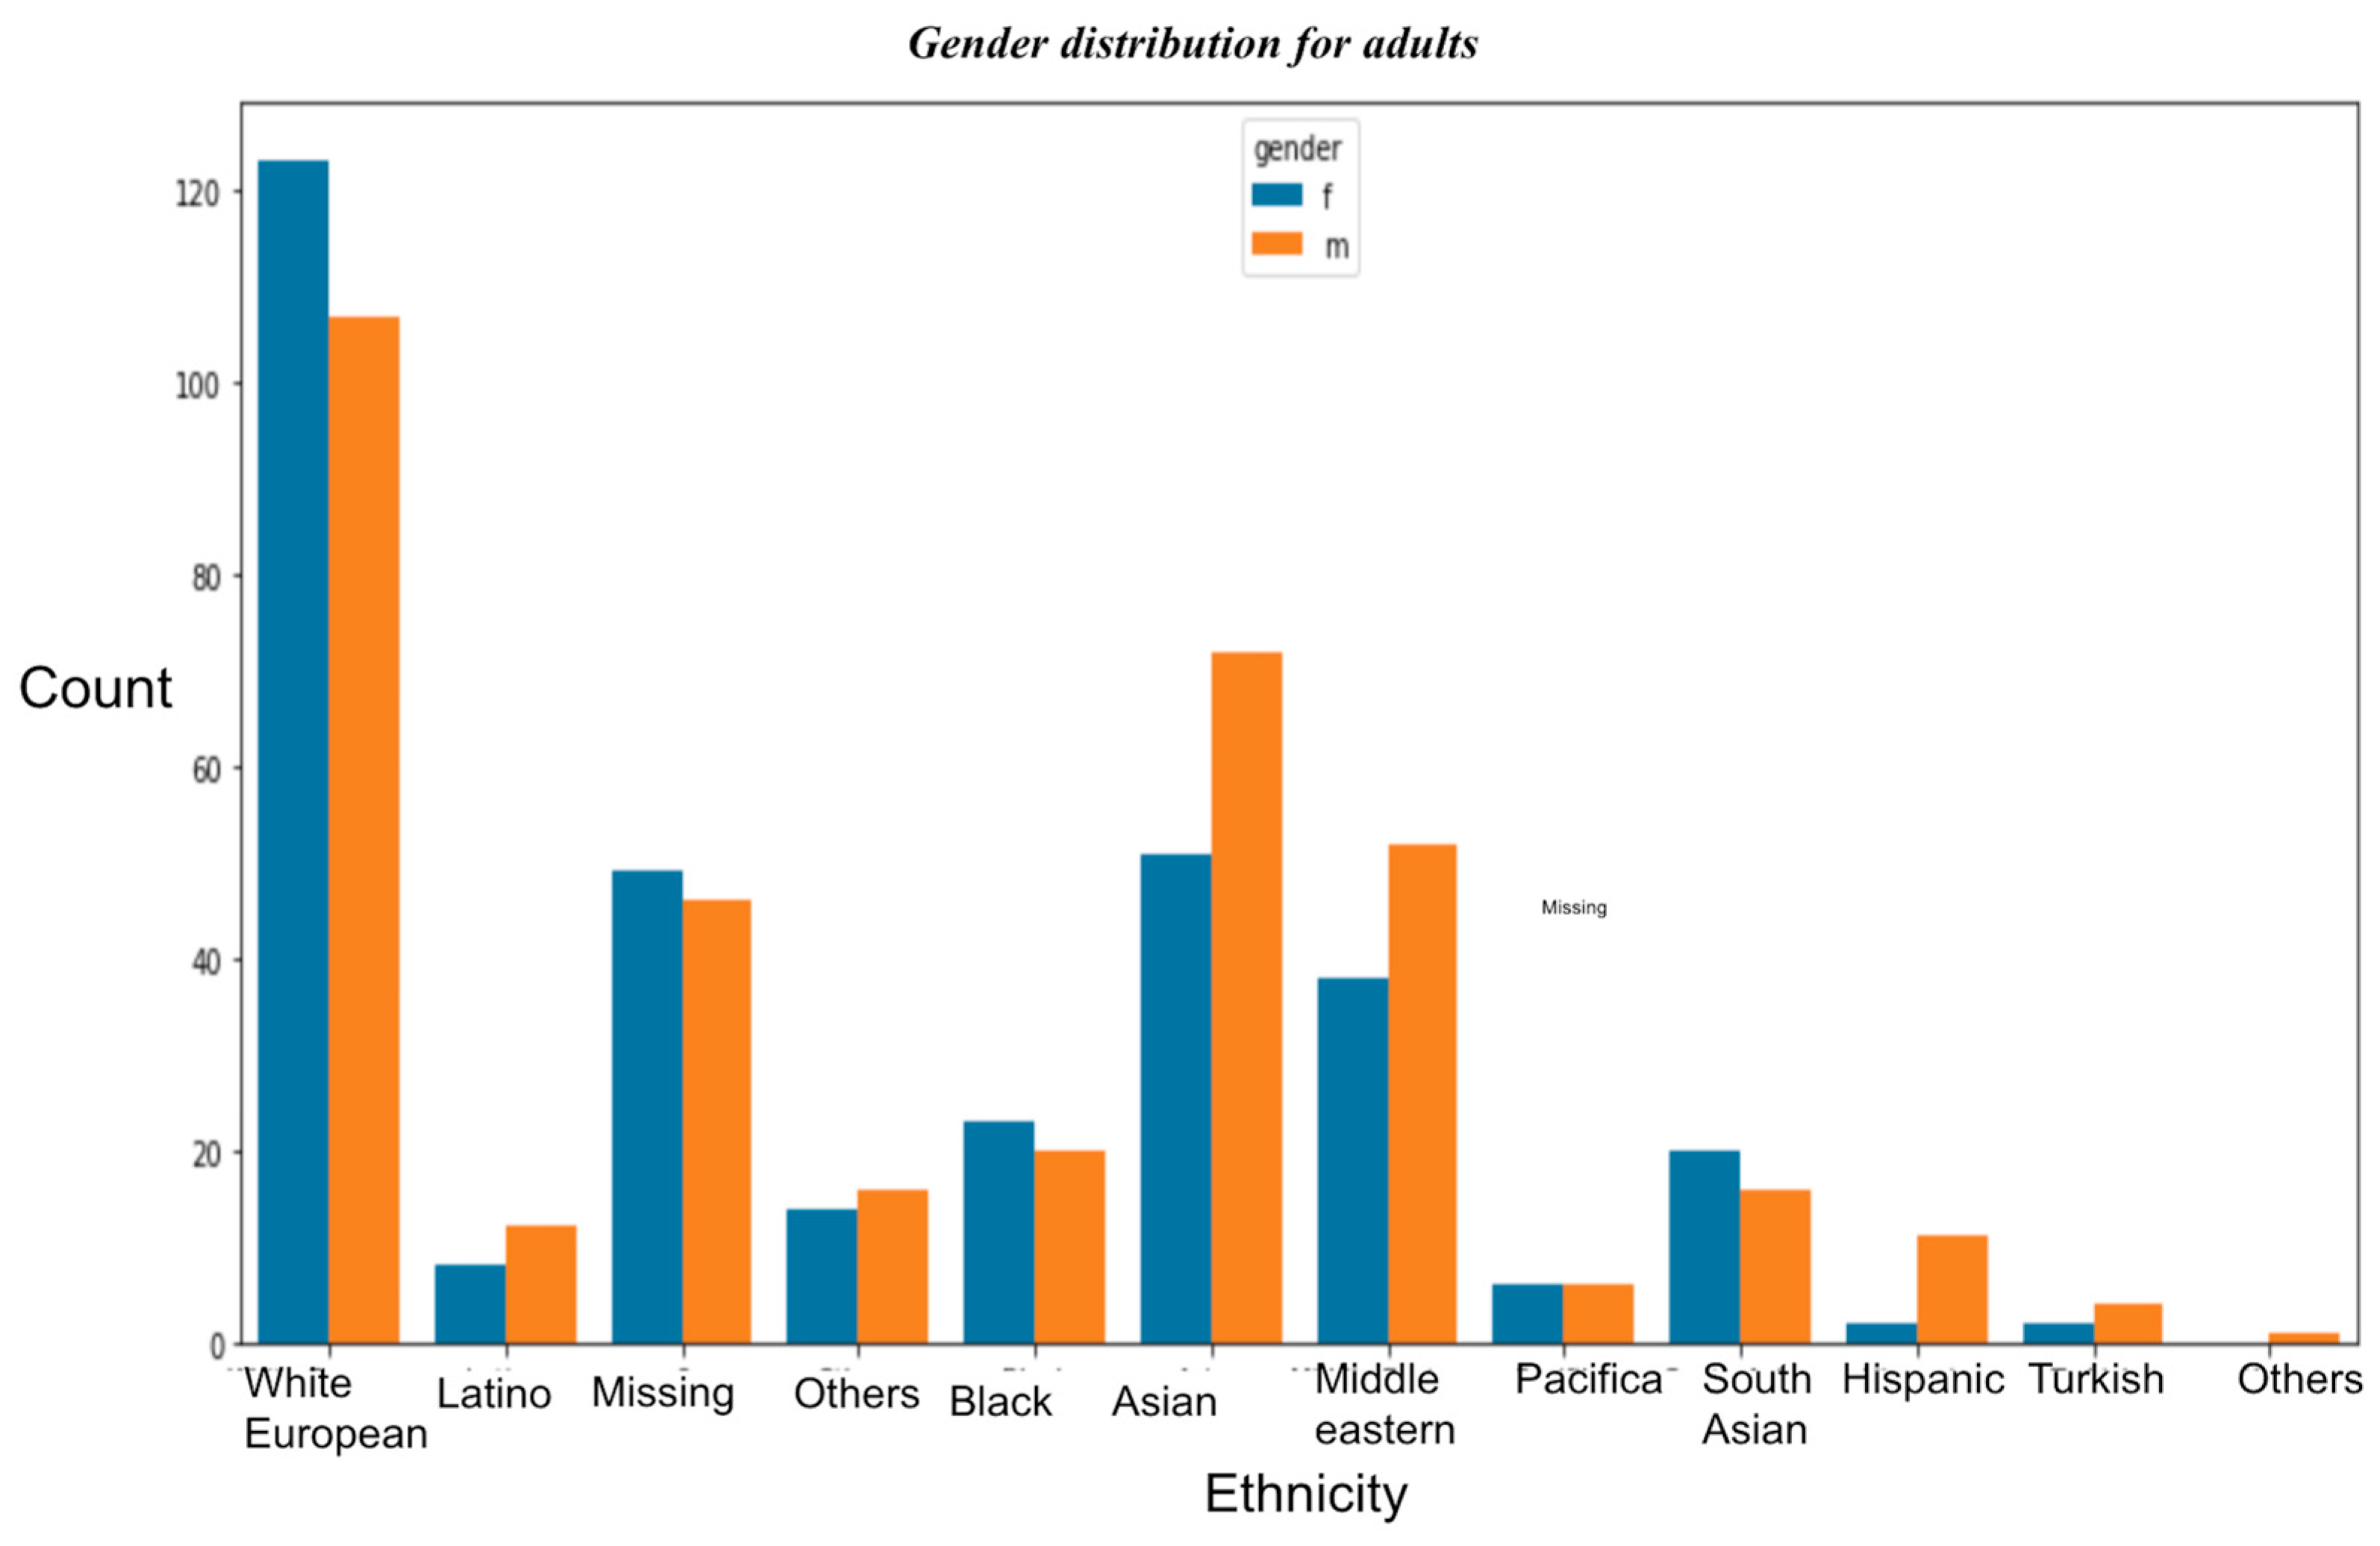
- Data distribution showing ethnicity vs. gender.
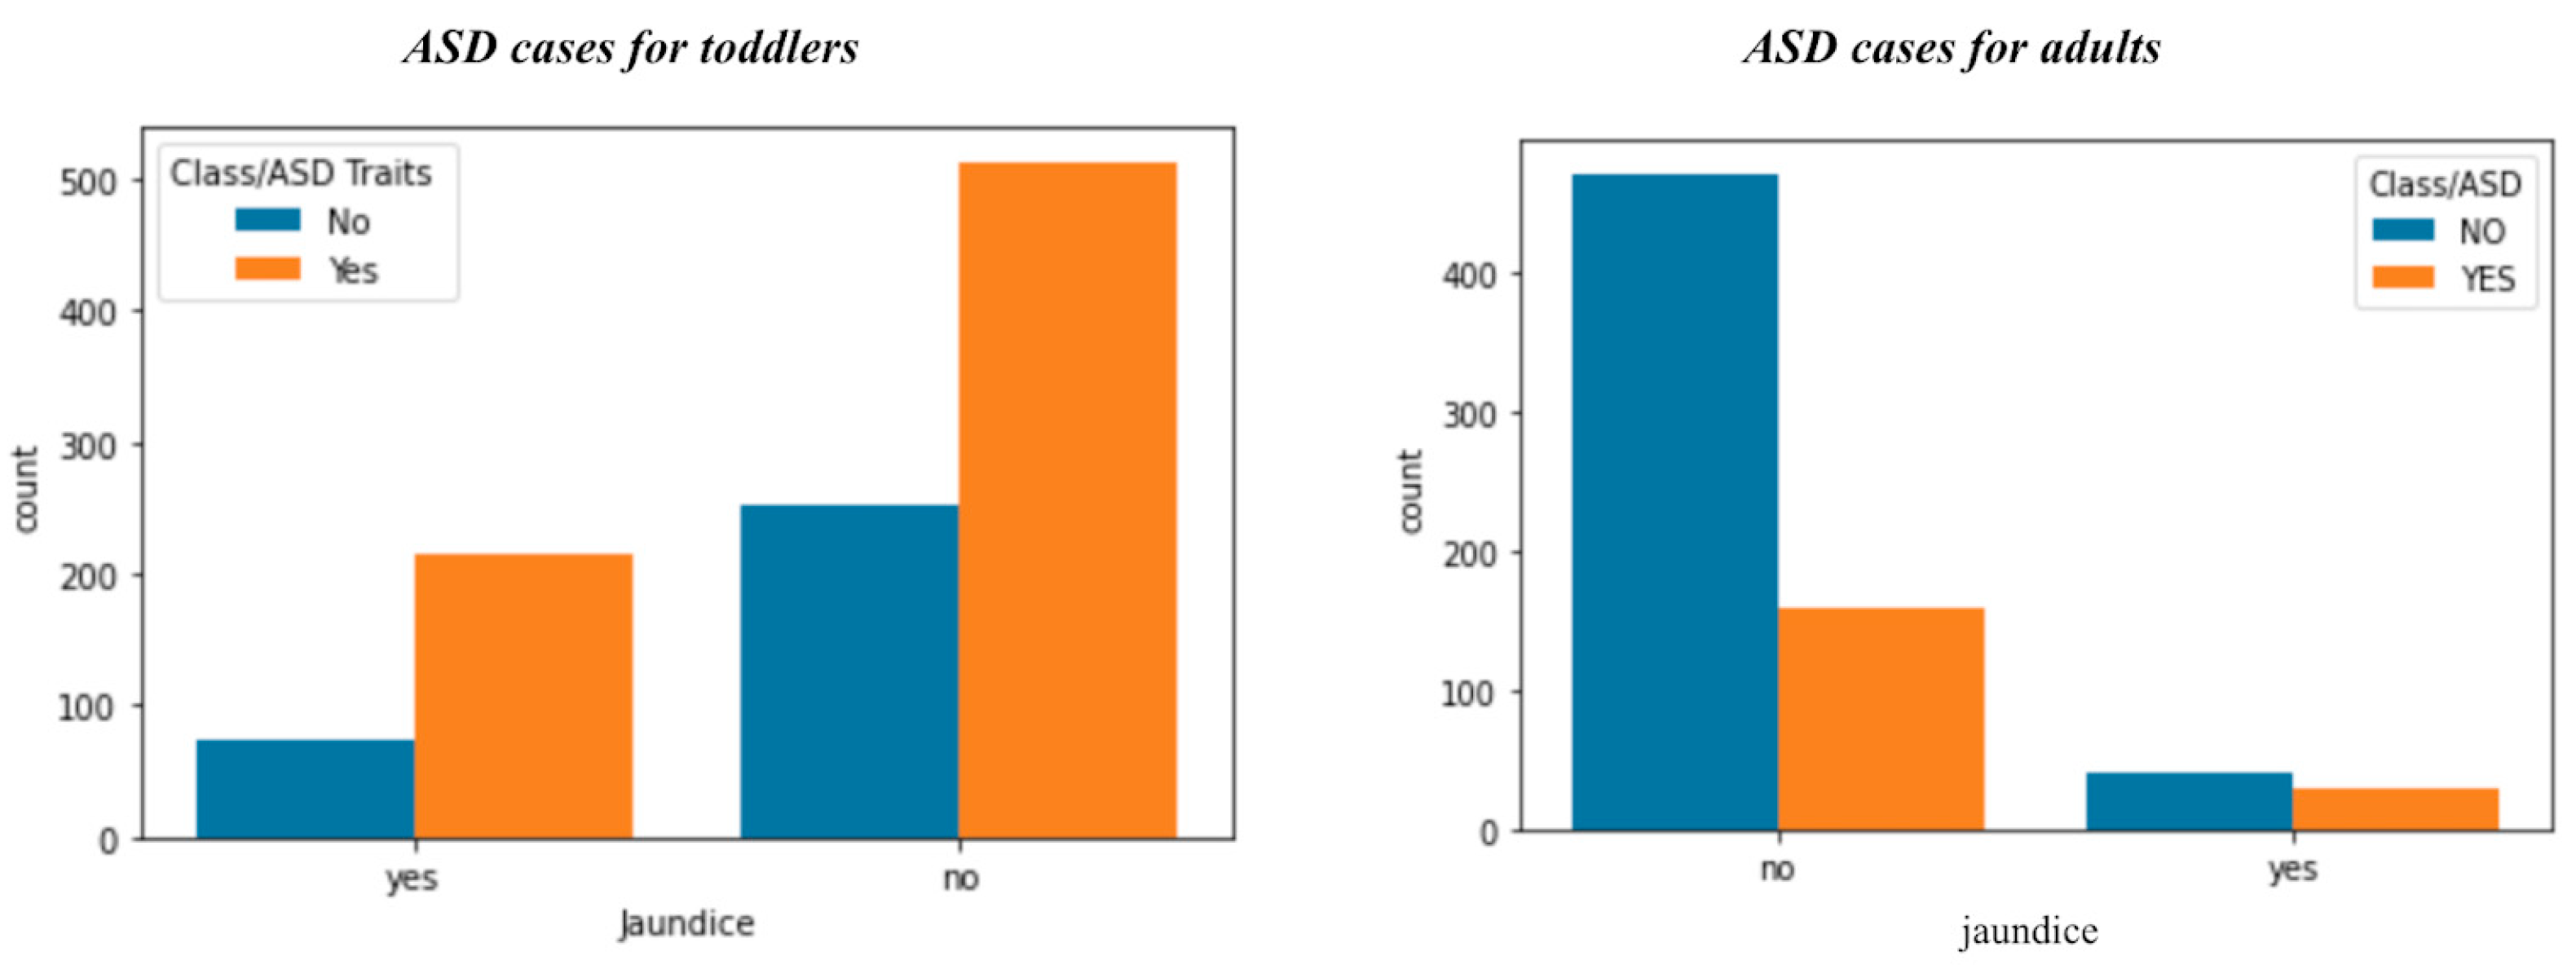
- ASD cases with jaundice
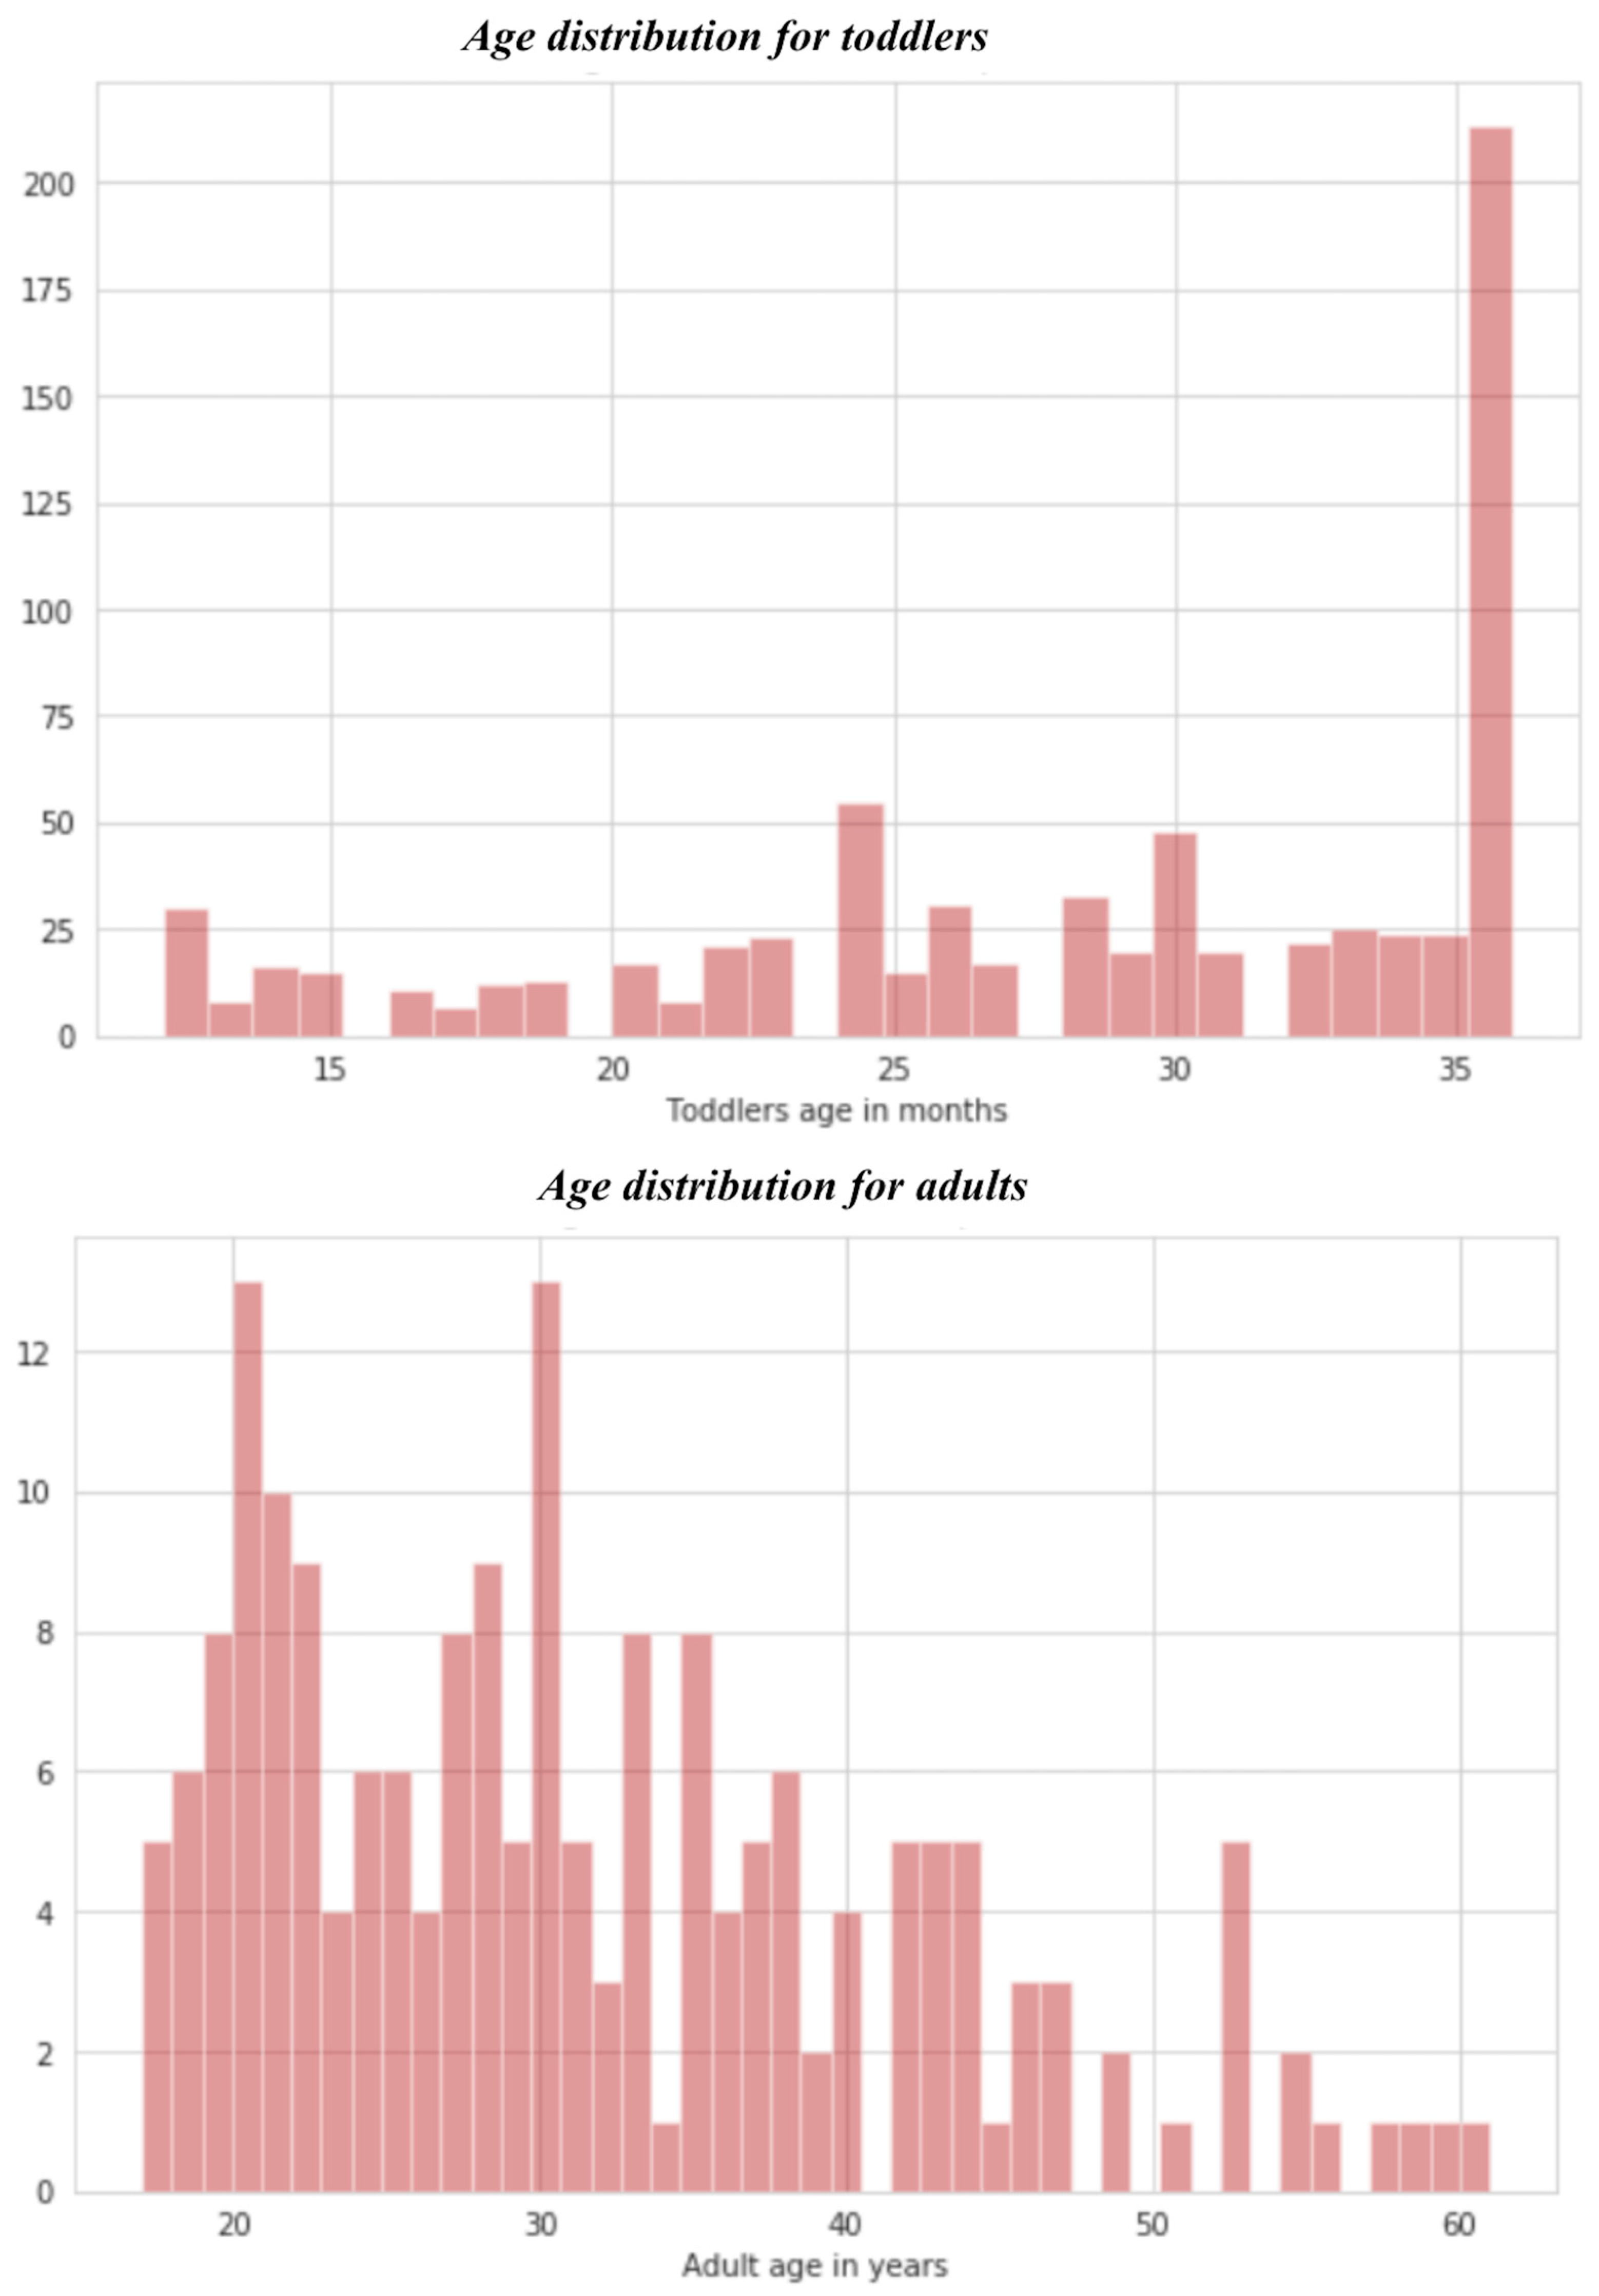
- Age distribution
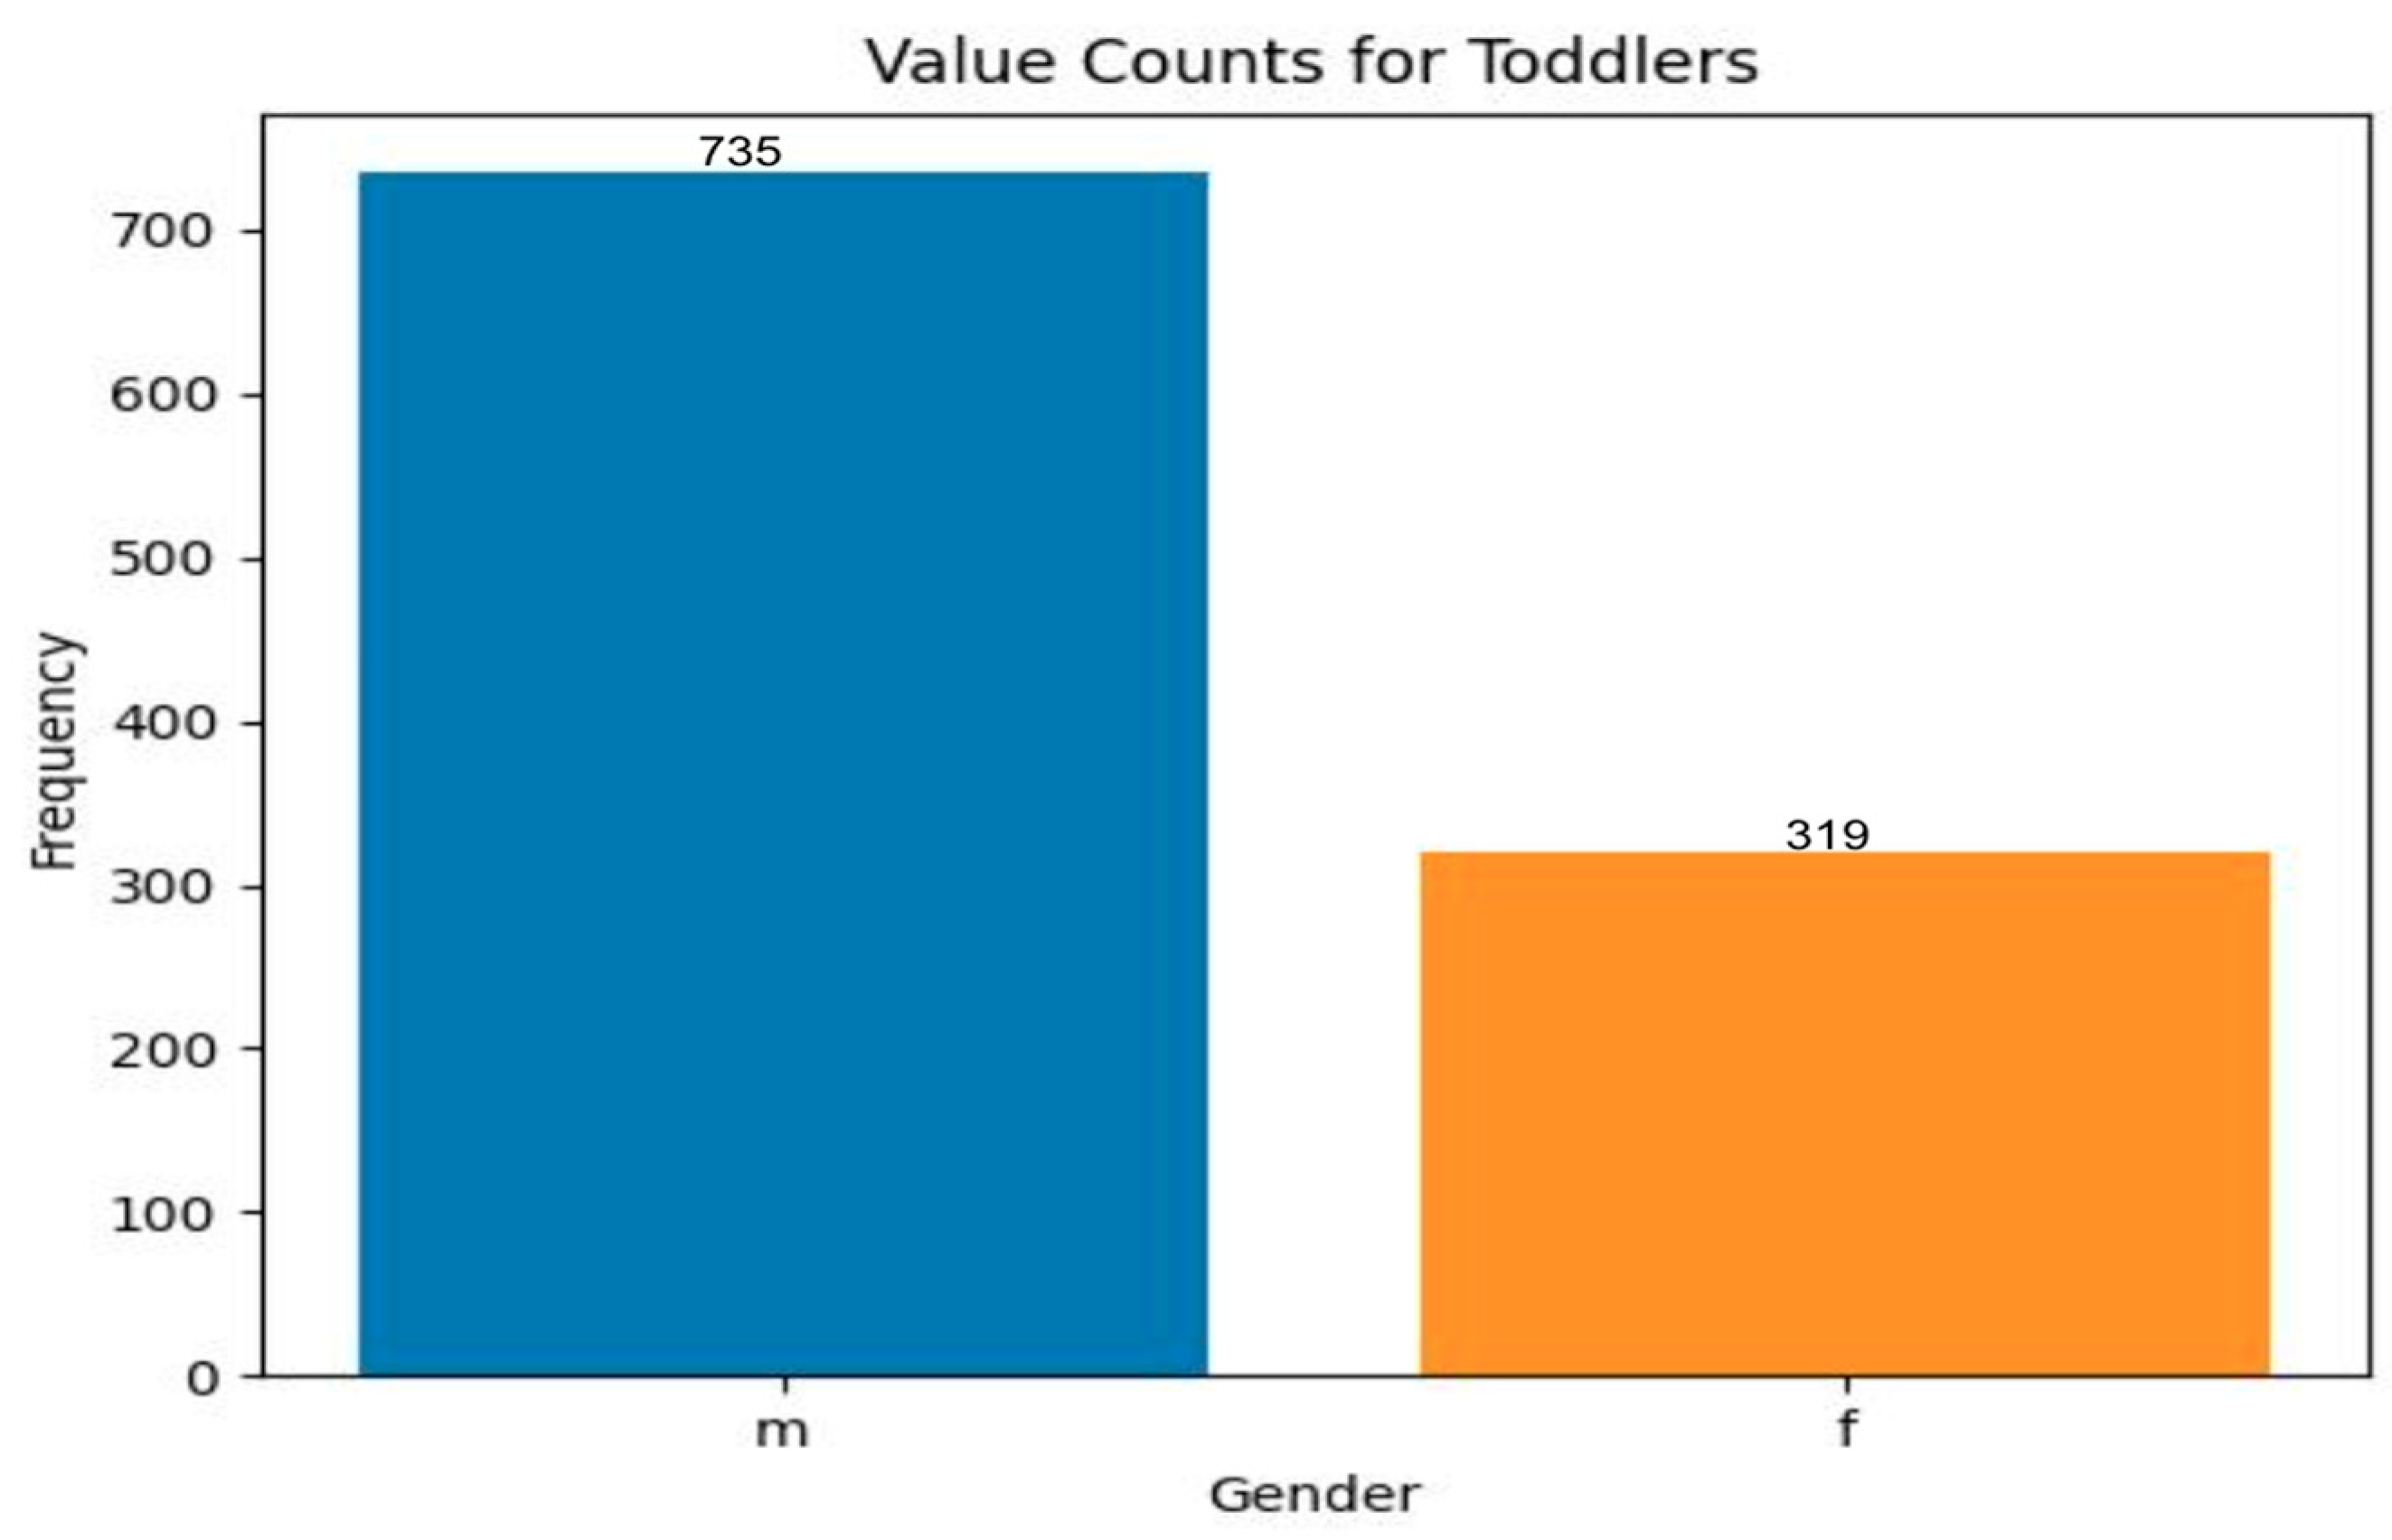
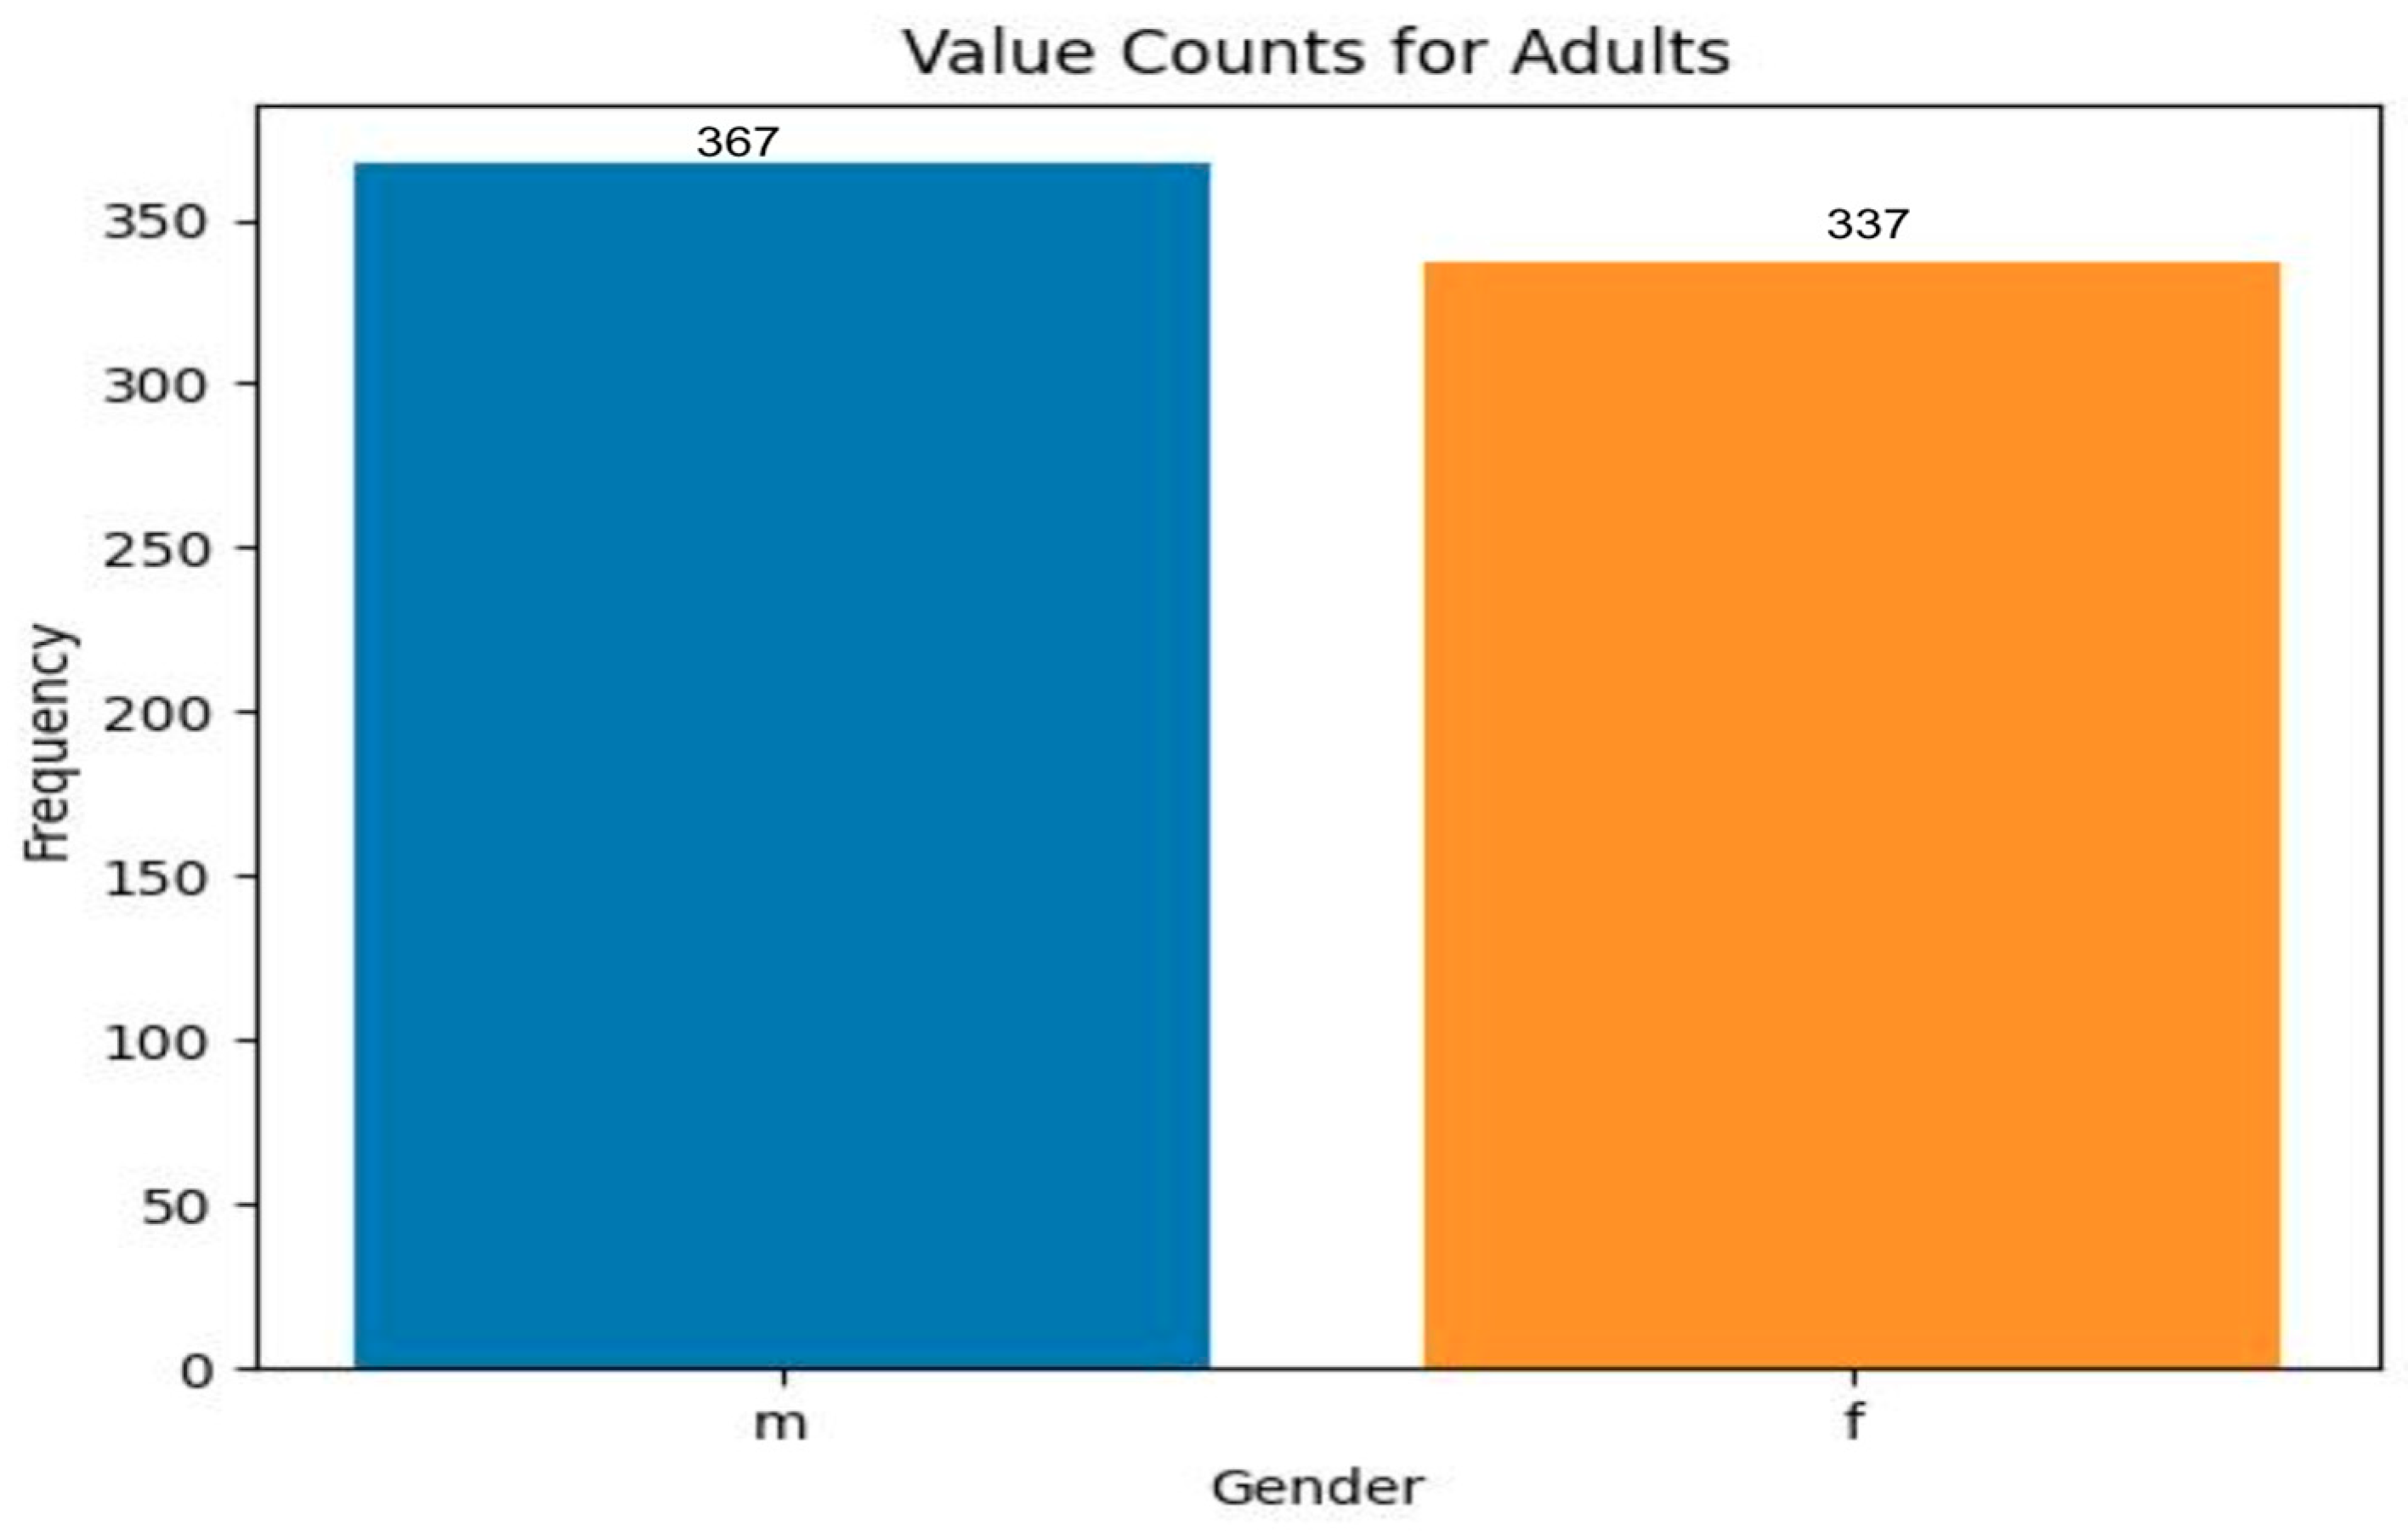
- Gender-based distribution
4.2. Results
4.3. Comparative Analysis
- a.
- In both the datasets, i.e., toddlers and adults, it is observed that the maximum number of cases belonged to White European Ethnicity;
- b.
- In the case of toddlers, there are more male cases of ASD than females. In the case of adults, there are more female cases;
- c.
- Jaundice does not have any significant impact on ASD, as the results from both datasets are not consistent;
- d.
- Most ASD cases in toddlers are seen around three years, i.e., thirty-six months. Likewise, most ASD cases in adults fall between 20 to 30 years;
- e.
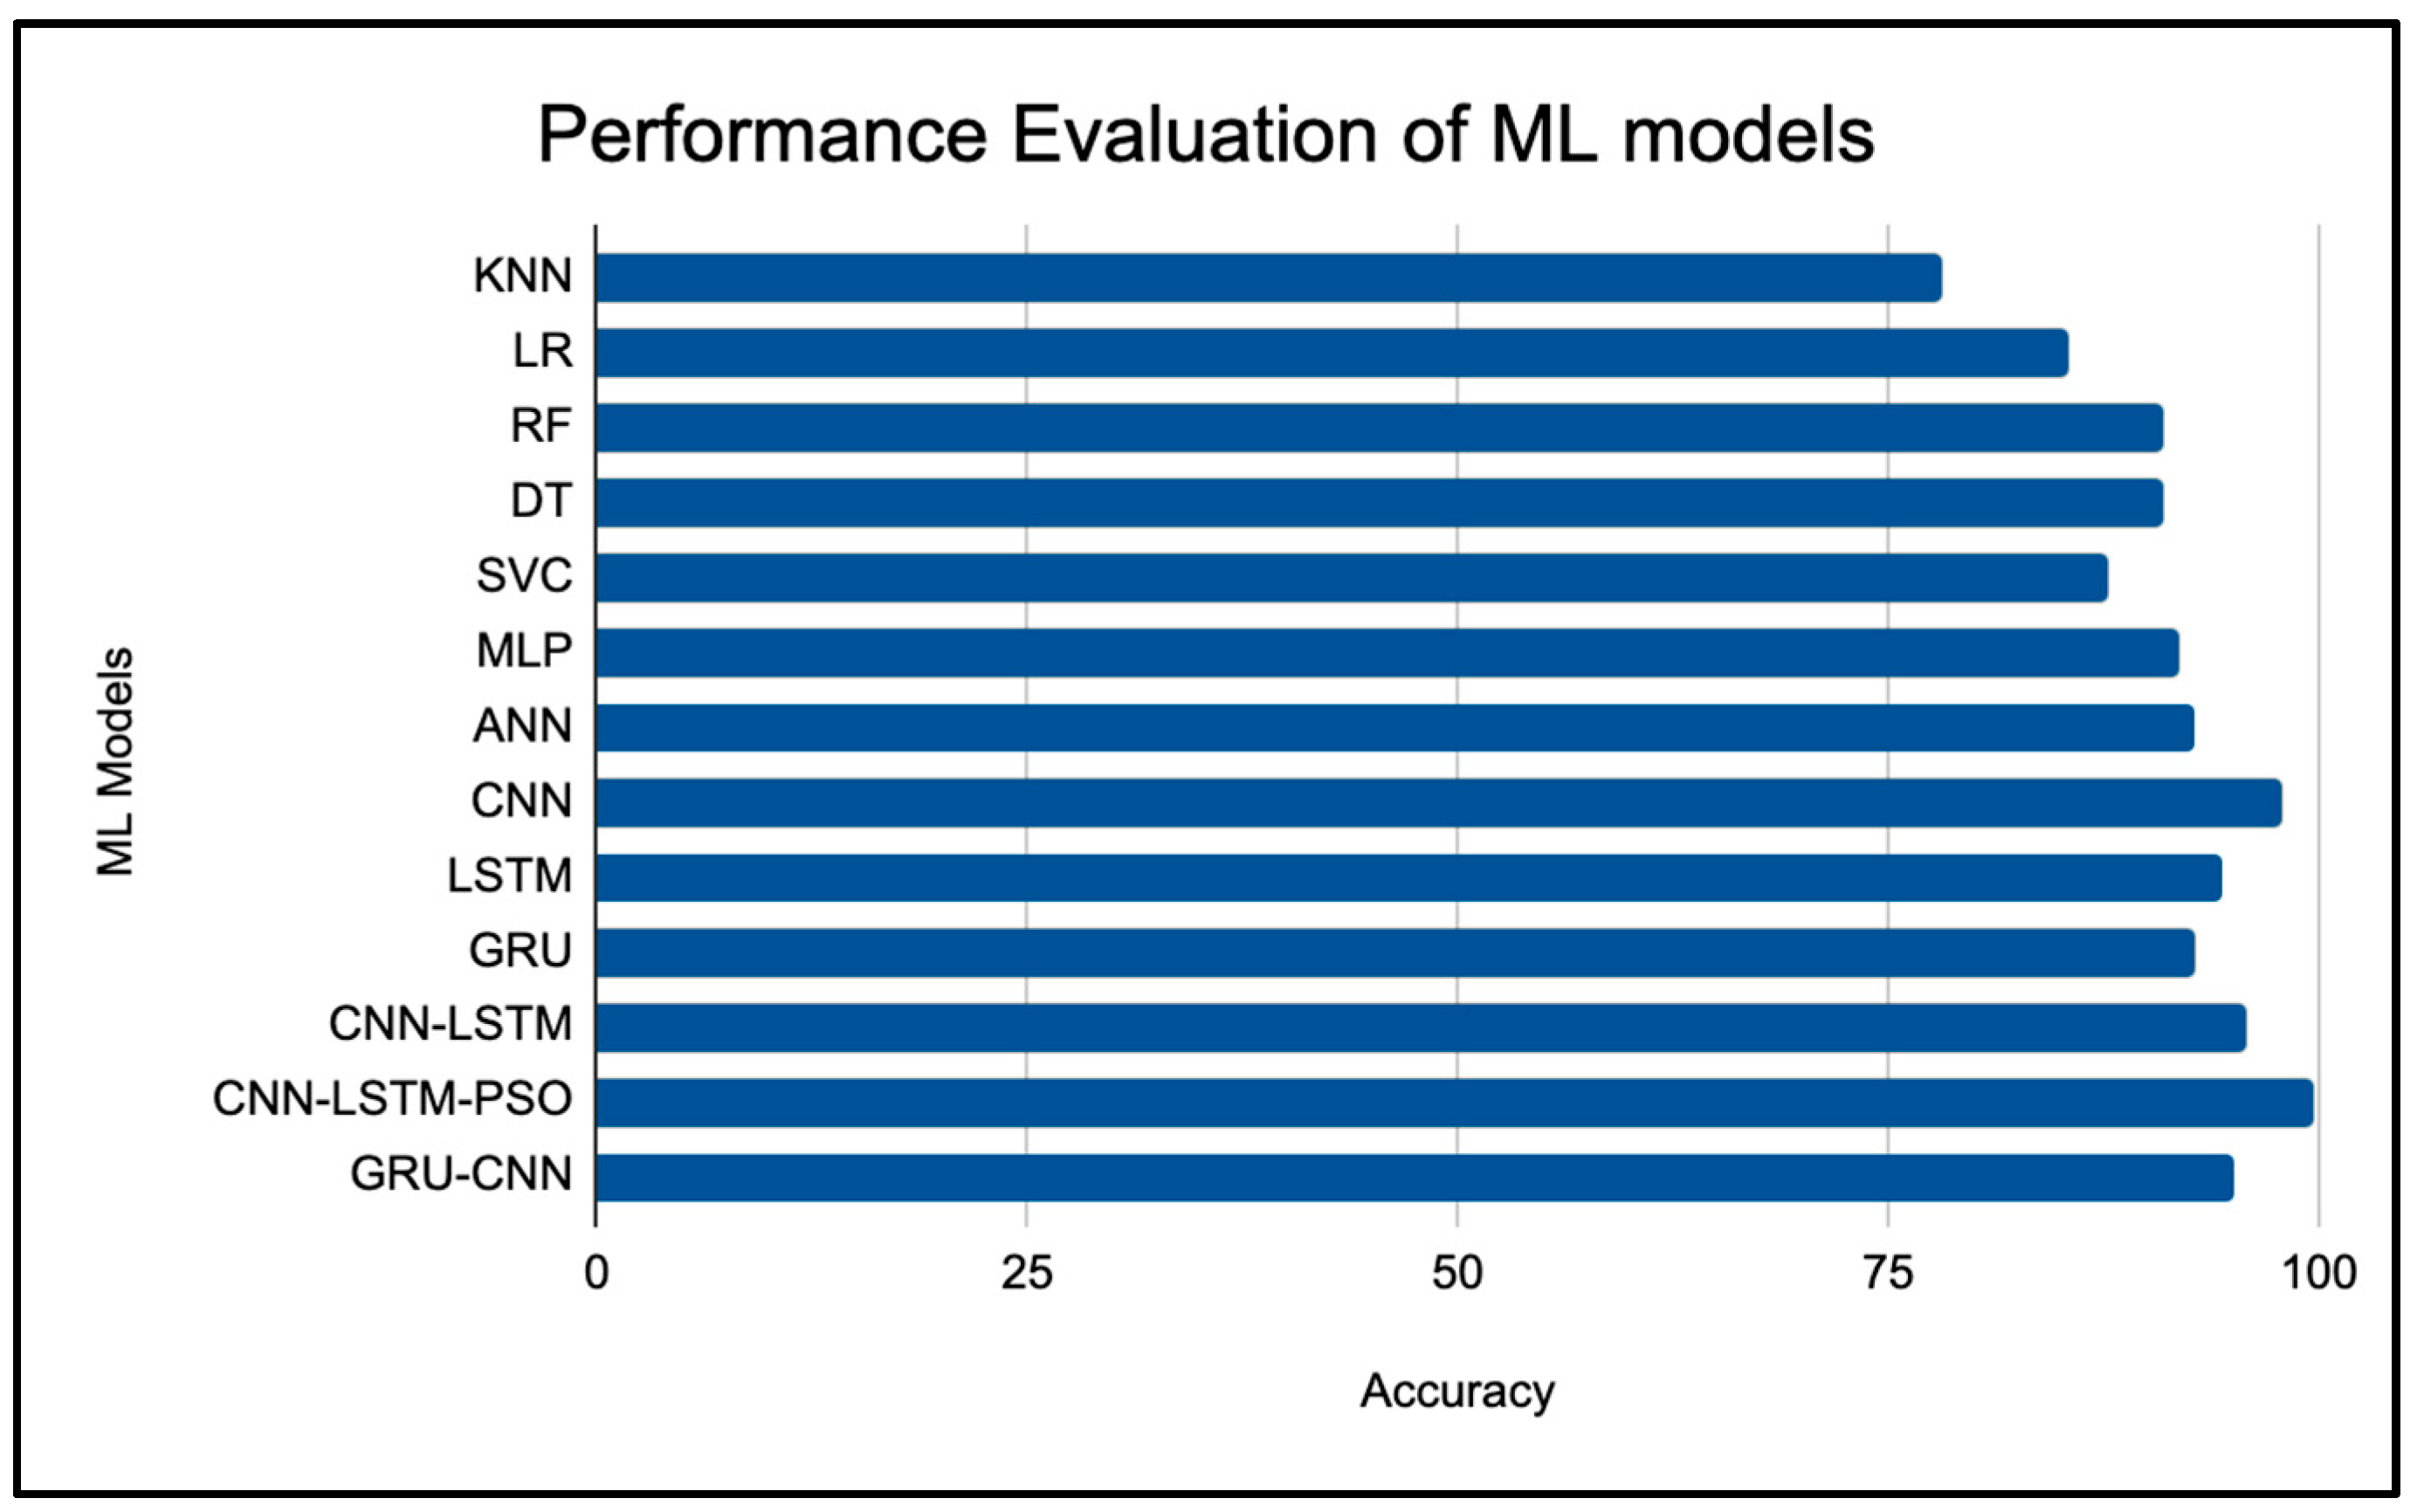
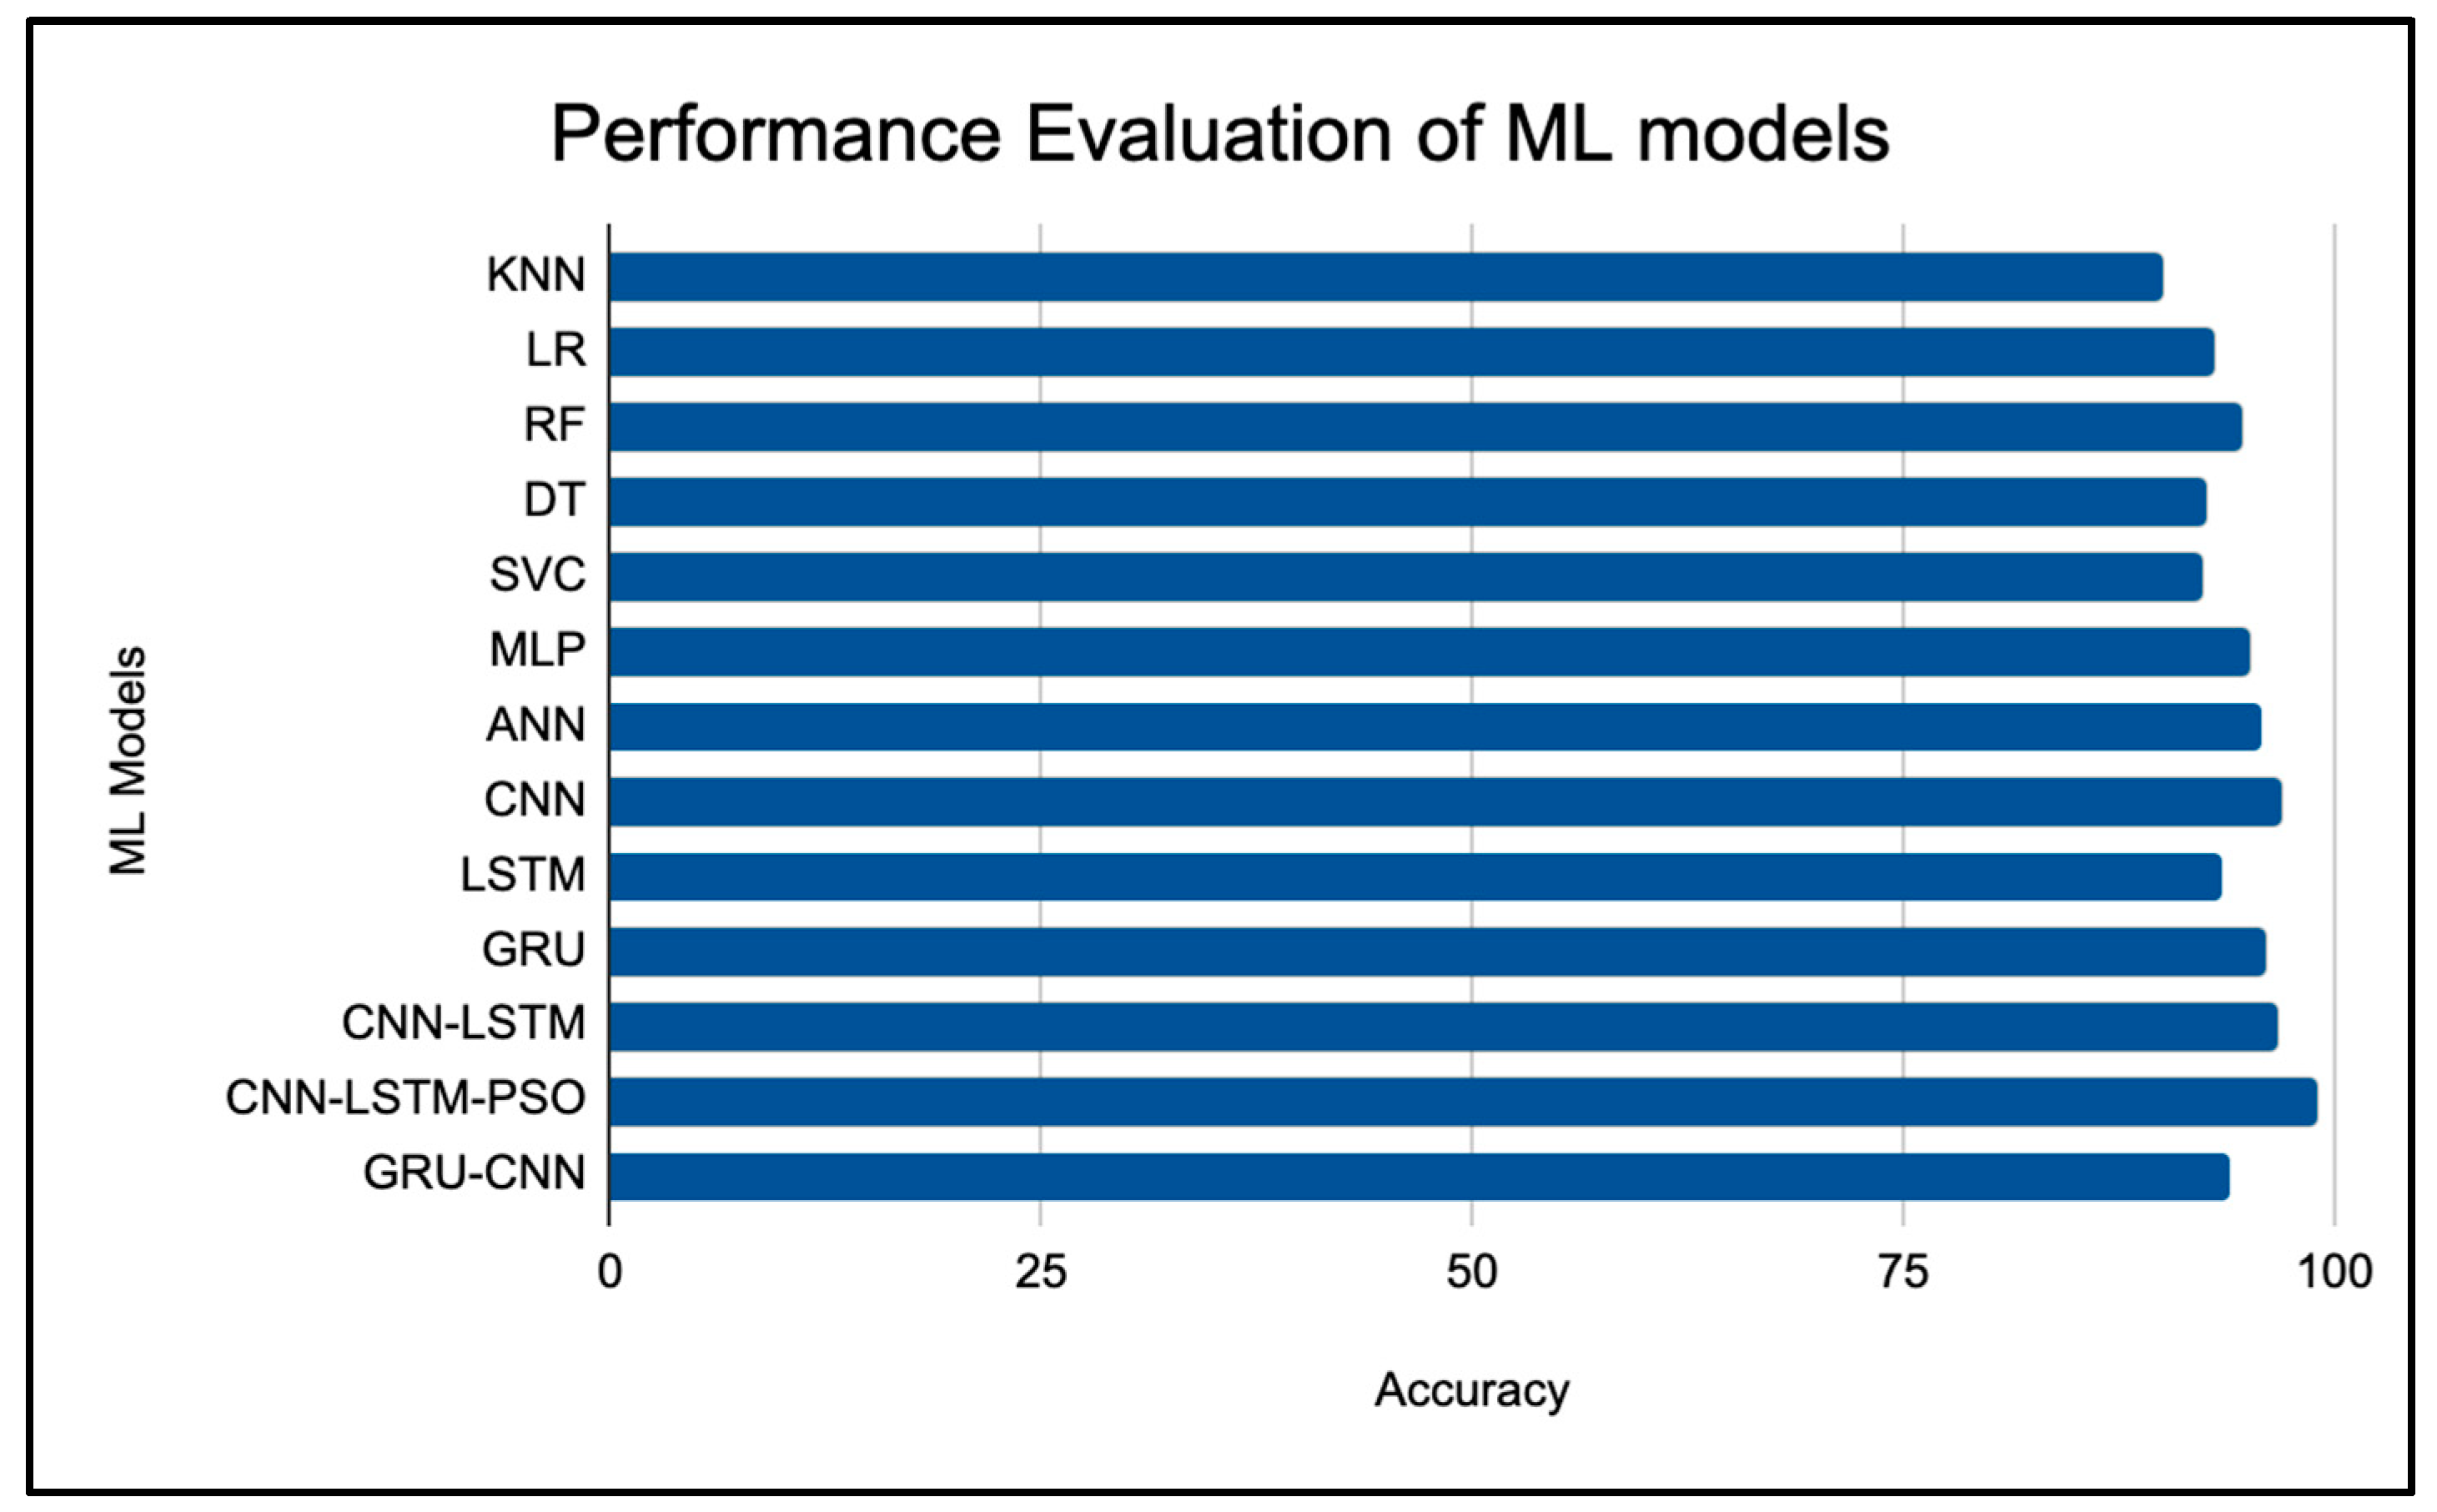
- This study proposed two deep neural network architectures, i.e., CNN–LSTM–PSO and GRU–CNN, for ASD detection in toddlers and adults (multiple datasets). While both models display satisfactory results, CNN–LSTM–PSO performs relatively better than other machine-learning algorithms;
- f.
- This study considers thirteen algorithms, including traditional ML algorithms, ensembles, and neural networks, performing extensive analysis on ASD;
- g.
- The study evaluated all the algorithms using multiple evaluation parameters, i.e., Accuracy, Precision, Recall, and F-1 Score, respectively;
- h.
- The optimization techniques considered for the study are Particle Swarm Optimization (combined with CNN–LSTM) and Adam (neural networks). The techniques are useful in minimizing the cost function, thereby improving model accuracy;
- i.
- The study deploys several AI fairness methods to eliminate bias. The bias elimination techniques proposed in this study are feature engineering techniques like handling outliers, transformations, and scaling. Apart from that, the SMOTE technique has been included to solve the class imbalance problem. Finally, we have deployed optimization methods for achieving efficient performance. The data obtained from two independent datasets has been thoroughly analyzed for bias elimination using feature engineering methods.
- Suspected outliers can be dropped if they are caused by human error or data processing errors;
- Similarly, properly formatted and validated data leads to improved data quality. It is also essential for protecting applications from inconsistencies like null values, duplicates, incorrect indexing, and incompatible formats, thereby eliminating bias through transformation.
- Moreover, scaling the features normalizes the range of values of the independent variables. Standardizing data with different scales can eliminate inconsistencies and bias in measuring the same data characteristics.
- SMOTE has been deployed to handle the data imbalance problem for both the datasets considered for this study;
- Finally, we see that optimization yields better accuracy and overall performance of the suggested models.
5. Conclusions
Funding
Data Availability Statement
Conflicts of Interest
References
- Ahmed, I.A.; Senan, E.M.; Rassem, T.H.; Ali, M.A.; Shatnawi, H.S.A.; Alwazer, S.M.; Alshahrani, M. Eye tracking-based diagnosis and early detection of autism spectrum disorder using machine learning and deep learning techniques. Electronics 2022, 11, 530. [Google Scholar] [CrossRef]
- Alqaysi, M.E.; Albahri, A.S.; Hamid, R.A. Hybrid Diagnosis Models for Autism Patients Based on Medical and Sociodemographic Features Using Machine Learning and Multicriteria Decision-Making (MCDM) Techniques: An Evaluation and Benchmarking Framework. Comput. Math. Methods Med. 2022, 2022, 9410222. [Google Scholar] [CrossRef] [PubMed]
- Alsuliman, M.; Al-Baity, H.H. Efficient Diagnosis of Autism with Optimized Machine Learning Models: An Experimental Analysis on Genetic and Personal Characteristic Datasets. Appl. Sci. 2022, 12, 3812. [Google Scholar] [CrossRef]
- Bala, M.; Ali, M.H.; Satu, M.S.; Hasan, K.F.; Moni, M.A. Efficient Machine Learning Models for Early Stage Detection of Autism Spectrum Disorder. Algorithms 2022, 15, 166. [Google Scholar] [CrossRef]
- Barik, K.; Watanabe, K.; Bhattacharya, J.; Saha, G. A fusion-based machine learning approach for autism detection in young children using magnetoencephalography signals. J. Autism Dev. Disord. 2022, 1–19. [Google Scholar] [CrossRef] [PubMed]
- Chaste, P.; Leboyer, M. Autism risk factors: Genes, environment, and gene-environment interactions. Dialogues Clin. Neurosci. 2022, 14, 281–292. [Google Scholar] [CrossRef] [PubMed]
- Francese, R.; Yang, X. Supporting autism spectrum disorder screening and intervention with machine learning and wearables: A systematic literature review. Complex Intell. Syst. 2022, 8, 3659–3674. [Google Scholar] [CrossRef]
- Kanhirakadavath, M.R.; Chandran, M.S.M. Investigation of eye-tracking scan path as a biomarker for autism screening using machine learning algorithms. Diagnostics 2022, 12, 518. [Google Scholar] [CrossRef] [PubMed]
- Kohli, M.; Kar, A.K.; Bangalore, A.; Ap, P. Machine learning-based ABA treatment recommendation and personalization for autism spectrum disorder: An exploratory study. Brain Inform. 2022, 9, 16. [Google Scholar] [CrossRef] [PubMed]
- Lau, J.C.; Patel, S.; Kang, X.; Nayar, K.; Martin, G.E.; Choy, J.; Wong, P.C.M.; Losh, M. Cross-linguistic patterns of speech prosodic differences in autism: A machine learning study. PLoS ONE 2022, 17, e0269637. [Google Scholar] [CrossRef] [PubMed]
- Liao, M.; Duan, H.; Wang, G. Application of machine learning techniques to detect the children with autism spectrum disorder. J. Healthc. Eng. 2022, 2022, 9340027. [Google Scholar] [CrossRef] [PubMed]
- Maenner, M.J.; Shaw, K.A.; Bakian, A.V.; Bilder, D.A.; Durkin, M.S.; Esler, A.; Furnier, S.M.; Hallas, L.; Hall-Lande, J.; Cogswell, M.E.; et al. Prevalence and Characteristics of Autism Spectrum Disorder among Children Aged 8 Years—Autism and Developmental Disabilities Monitoring Network, 11 Sites, United States, 2018. MMWR Surveill. Summ. 2021, 70, 1–16. [Google Scholar] [CrossRef] [PubMed]
- Mellema, C.J.; Nguyen, K.P.; Treacher, A.; Montillo, A. Reproducible neuroimaging features for diagnosis of autism spectrum disorder with machine learning. Sci. Rep. 2022, 12, 3057. [Google Scholar] [CrossRef] [PubMed]
- Minissi, M.E.; Chicchi Giglioli, I.A.; Mantovani, F.; Alcaniz Raya, M. Assessment of the autism spectrum disorder based on machine learning and social visual attention: A systematic review. J. Autism Dev. Disord. 2022, 52, 2187–2202. [Google Scholar] [CrossRef] [PubMed]
- Peketi, S.; Dhok, S.B. Machine Learning Enabled P300 Classifier for Autism Spectrum Disorder Using Adaptive Signal Decomposition. Brain Sci. 2023, 13, 315. [Google Scholar] [CrossRef] [PubMed]
- Rabbi, M.F.; Zohra, F.T.; Hossain, F.; Akhi, N.N.; Khan, S.; Mahbub, K.; Biswas, M. Autism Spectrum Disorder Detection Using Transfer Learning with VGG 19, Inception V3 and DenseNet 201. In Proceedings of the Recent Trends in Image Processing and Pattern Recognition: 5th International Conference, RTIP2R 2022, Kingsville, TX, USA, 1–2 December 2022; Revised Selected Papers. Springer Nature: Cham, Switzerland, 2023; pp. 190–204. [Google Scholar]
- Rybner, A.; Jessen, E.T.; Mortensen, M.D.; Larsen, S.N.; Grossman, R.; Bilenberg, N.; Cantio, C.; Jepsen, J.R.M.; Weed, E.; Fusaroli, R. Vocal markers of autism: Assessing the generalizability of machine learning models. Autism Res. 2022, 15, 1018–1030. [Google Scholar] [CrossRef] [PubMed]
- Li, C.; Zhang, T.; Li, J. Identifying autism spectrum disorder in resting-state fNIRS signals based on multiscale entropy and a two-branch deep learning network. J. Neurosci. Methods 2023, 383, 109732. [Google Scholar] [CrossRef] [PubMed]
- Deng, X.; Zhang, J.; Liu, R.; Liu, K. Classifying ASD based on time-series fMRI using spatial–temporal transformer. Comput. Biol. Med. 2022, 151, 106320. [Google Scholar] [CrossRef] [PubMed]
- Cao, X.; Ye, W.; Sizikova, E.; Bai, X.; Coffee, M.; Zeng, H.; Cao, J. Vitasd: Robust Vision Transformer Baselines for Autism Spectrum Disorder Facial Diagnosis. In Proceedings of the ICASSP 2023-2023 IEEE International Conference on Acoustics, Speech and Signal Processing (ICASSP), Rhodes Island, Greece, 4–10 June 2023; pp. 1–5. [Google Scholar]
- Kuttala, D.; Mahapatra, D.; Subramanian, R.; Oruganti, V.R.M. Dense attentive GAN-based one-class model for detection of autism and ADHD. J. King Saud Univ.-Comput. Inf. Sci. 2022, 34, 10444–10458. [Google Scholar] [CrossRef]
- Mujeeb Rahman, K.K.; Subashini, M.M. Identification of autism in children using static facial features and deep neural networks. Brain Sci. 2022, 12, 94. [Google Scholar] [CrossRef] [PubMed]


| Optimized Components | Hyperparameter | Range |
|---|---|---|
| Convolutional Layer | Number of filters in 1st layer | [20, 210] |
| Filter size in 1st layer | [1, 5] | |
| Number of filters in 2nd layer | [20, 210] | |
| Filter size in 2nd layer | [1, 5] | |
| Pooling | Pooling Size | [2, 5] |
| LSTM | Number of hidden nodes | [10, 500] |
| Dense | Number of nodes | [10, 200] |
| Learning Configurations | Learning rate Dropout rate | [10−4, 10−1] [0, 0.2] |
| Hyperparameter | Value |
|---|---|
| Number of Hidden Layers | 4 |
| Dropout | 0.2 |
| Activation Function (GRU) | TanH |
| Activation Function (Conv1D) | ReLU |
| Activation Function (Dense) | Softmax |
| Learning Rate | 0.0001 |
| Epochs | 100 |
| Batch Size | 10 |
| ML Models | Accuracy | Precision | Recall | F-1 Score | Execution Time (ms) |
|---|---|---|---|---|---|
| KNN | 78.12 | 0.67 | 0.72 | 0.87 | 246,464 |
| LR | 85.38 | 0.81 | 0.88 | 0.88 | 127,787 |
| RF | 90.88 | 0.90 | 0.77 | 0.82 | 276,126 |
| DT | 91.02 | 0.88 | 0.82 | 0.84 | 203,664 |
| SVC | 87.77 | 0.84 | 0.89 | 0.74 | 364,248 |
| MLP | 91.90 | 0.88 | 0.78 | 0.80 | 366,024 |
| ANN | 92.68 | 0.89 | 0.81 | 0.81 | 372,866 |
| CNN | 97.78 | 0.94 | 0.86 | 0.89 | 442,886 |
| LSTM | 94.49 | 0.93 | 0.92 | 0.90 | 504,994 |
| GRU | 92.78 | 0.90 | 0.88 | 0.87 | 658,021 |
| CNN–LSTM | 95.66 | 0.91 | 0.92 | 0.92 | 640,482 |
| CNN–LSTM–PSO | 99.64 | 0.96 | 0.94 | 0.91 | 840,599 |
| GRU-CNN | 95.02 | 0.92 | 0.90 | 0.88 | 728,894 |
| ML Models | Accuracy | Precision | Recall | F-1 Score | Execution Time (ms) |
|---|---|---|---|---|---|
| KNN | 90.08 | 0.78 | 0.77 | 0.82 | 266,848 |
| LR | 93.05 | 0.90 | 0.84 | 0.88 | 208,664 |
| RF | 94.68 | 0.91 | 0.88 | 0.88 | 382,677 |
| DT | 92.62 | 0.89 | 0.82 | 0.84 | 300,116 |
| SVC | 92.36 | 0.90 | 0.88 | 0.90 | 480,248 |
| MLP | 95.04 | 0.92 | 0.82 | 0.86 | 521,436 |
| ANN | 95.83 | 0.89 | 0.89 | 0.88 | 588,644 |
| CNN | 96.81 | 0.92 | 0.93 | 0.91 | 682,042 |
| LSTM | 93.44 | 0.85 | 0.81 | 0.83 | 654.883 |
| GRU | 96.04 | 0.90 | 0.92 | 0.94 | 778,899 |
| CNN–LSTM | 96.66 | 0.92 | 0.91 | 0.94 | 729,890 |
| CNN–LSTM–PSO | 98.89 | 0.94 | 0.91 | 0.93 | 900,048 |
| GRU–CNN | 94.02 | 0.90 | 0.90 | 0.88 | 814,766 |
| Author and Year | Study/Analysis | Methodology/Parameters | Results |
|---|---|---|---|
| Ahmed et al., 2022 [1] | Eye-tracking-based diagnosis using machine-learning models for detecting ASD | FFN, ANN, CNN, GoogleNet, ResNet-18 | Accuracy achieved, 95.5% and 94.5% |
| Kohli et al., 2022 [9] | Applied behavior analysis for detecting ASD | Clinical study data, collaborative filtering | The average accuracy is 81% to 84% |
| Liao et al., 2022 [11] | Identifying autism in children using physiological and behavioral data | Machine-learning algorithms, feature extraction, naive Bayes | Accuracy is 87.50% |
| Bala et al., 2022 [4] | Early-stage detection of ASD | ML algorithms, SVM, SHAP method | Accuracy is 96.82% |
| Peketi and Dhok, 2023 [15] | Detecting P300 signal in autism | SMOTE, SVM | Accuracy is 91.12% |
| Rabbi et al., 2023 [16] | ASD detection using transfer learning | VGG 19, Inception V3, and DenseNet 201 | Accuracy is 85% |
| Kuttala et al., 2022 [21] | ASD detection in children | Dense Attentive GAN (Generative adversarial network) | Accuracy is 97.82% |
| Cao et al., 2023 [20] | ASD detection using facial diagnosis | Vision Transformer, Gaussian Process Layer | Accuracy is 94.50% |
| Deng et al., 2022 [19] | ASD classification using clinical data | Spatial–temporal Transformer (ST-Transformer) | Accuracies are 71% and 70.6% |
| Rahman and Subashini, 2022 [22] | Identifying autism in children | CNN, Transfer Learning | The Area Under Curve Score is 96.63% |
| Proposed Work | Detecting ASD in toddlers and adults using ML, optimization, and Fair AI | Proposed CNN-LSTM-PSO, GRU-CNN Fairness techniques Other baseline ML models | Accuracies are 99.64% and 98.89%, respectively |
Disclaimer/Publisher’s Note: The statements, opinions and data contained in all publications are solely those of the individual author(s) and contributor(s) and not of MDPI and/or the editor(s). MDPI and/or the editor(s) disclaim responsibility for any injury to people or property resulting from any ideas, methods, instructions or products referred to in the content. |
© 2023 by the author. Licensee MDPI, Basel, Switzerland. This article is an open access article distributed under the terms and conditions of the Creative Commons Attribution (CC BY) license (https://creativecommons.org/licenses/by/4.0/).
Share and Cite
Priyadarshini, I. Autism Screening in Toddlers and Adults Using Deep Learning and Fair AI Techniques. Future Internet 2023, 15, 292. https://doi.org/10.3390/fi15090292
Priyadarshini I. Autism Screening in Toddlers and Adults Using Deep Learning and Fair AI Techniques. Future Internet. 2023; 15(9):292. https://doi.org/10.3390/fi15090292
Chicago/Turabian StylePriyadarshini, Ishaani. 2023. "Autism Screening in Toddlers and Adults Using Deep Learning and Fair AI Techniques" Future Internet 15, no. 9: 292. https://doi.org/10.3390/fi15090292
APA StylePriyadarshini, I. (2023). Autism Screening in Toddlers and Adults Using Deep Learning and Fair AI Techniques. Future Internet, 15(9), 292. https://doi.org/10.3390/fi15090292