1. Introduction
Systems for environmental monitoring play a crucial role in assessing and understanding the state of our natural surroundings. These systems employ a combination of sensors, data collection instruments, and advanced technologies to monitor various environmental parameters such as air quality, water quality, noise levels, and biodiversity [
1]. By continuously gathering and analyzing data, these systems provide valuable insights into the health of ecosystems, the impact of human activities, and the effectiveness of conservation efforts. Environmental monitoring systems enable scientists, policymakers, and stakeholders to make informed decisions, develop mitigation strategies, and track changes over time. With the advancements in technology, including remote sensing, Internet of Things (IoT), and machine learning, these systems are becoming increasingly sophisticated, allowing for more accurate and timely environmental assessments.
Air pollutants, such as 2.5 and 10 (µm) particulate matter (PM10, PM2.5), sulphur dioxide (SO
2), carbon monoxide (CO), ground-level ozone (O
3), hydrocarbons (HC), volatile organic compounds (VOC), and nitrogen oxides (NOx) [
2], contribute to the presence of particulate matter (PM) in the air. Various methods are employed to monitor PM levels, including ground measurements, such as comprehensive emission inventory modeling to determine emission source distribution [
3] or the gravimetric method that calculates daily particulate pollutant levels based on handheld devices measuring PM10 and PM2.5 along main roads in urban areas [
4].
In 1975, Griggs discovered that satellite data can be used to determine atmospheric aerosol optical depth (AOD) values by analyzing the scattering and absorption of shortwave radiation in the atmosphere [
5]. As a result, optical satellite imagery in the visible, near-infrared, and short-wave infrared portions of the electromagnetic spectrum has emerged as a promising data source for estimating the mass concentration of air pollutants.
To estimate PM10 and PM2.5 levels, several methods have been employed based on the relationship between measurements at ground stations by specialized equipment and AOD values extracted by complex computational models from images captured by satellites. The used computation models include regression with two or more variables, machine learning, and the surface aerosol concentration approach. Up to now, regression models have shown high efficiency in estimating PM concentrations from daily AOD at a 1000 × 1000 m spatial resolution at local and regional levels. Engel-Cox et al., in 2004, determined the regional sources of air pollution events, the intensity of the events, and their motion using imagery and statistical analysis [
6]. AOD data from Moderate Resolution Imaging Spectroradiometer (MODIS) sensor on the Terra satellite were used in combination with ground PM measurements from 1 April to 30 September 2002 in the United States to determine their correlation. As a result, correlations of MODIS AOD with ground PM were better in the eastern and Midwest portion of the United States, but poorer in the western. In 2014, Mamun et al. analyzed seasonal variations in aerosol concentration in Bangladesh during the period 2002–2011, using MODIS AOD data products [
7]. Linear regression models were used to determine seasonal trends in AOD. The results indicated that seasonal variations show maximum AOD values during the pre-monsoon season while minimum AOD during post-monsoon, and a decadal decreasing trend in AOD is found during monsoon season while all other seasons show increasing trends. The authors used a hybrid single particle Lagrangian integrated trajectory (HYSPLIT) model, a computer model that is used to compute air parcel trajectories to determine how far and in what direction a parcel of air will travel, to generate a backward trajectory in order to identify the origins of air pollutants. As a result, Bangladesh is mainly affected by the pollutants and desert dust of India combined with sea salt particles blown from the Arabian Sea. Recently, experimental models of PM2.5 and PM10 estimation were proposed using ground-based PM measurements and AOD values derived from MODIS data products [
8,
9,
10,
11,
12,
13,
14,
15]. The authors explored different regression models between ground-level PM mass concentration and AOD in different environmental regions. Mostly linear regression models presented a better fit than others based on their correlation coefficient. In addition to MODIS AOD, AOD derived from other optical satellite images was exploited to estimate PM mass concentrations with higher spatial resolution but lower temporal resolution [
16,
17,
18,
19,
20]. For example, Landsat and ASTER short-wavelength images are, respectively, at 30 m and 15 m pixel sizes, but have both 16-day and revisiting periods. Green et al. conducted a study in 2009, where they compared the aerosol optical depth (AOD) derived from the GOES satellite and the MODIS Terra satellite with ground-based measurements of AOD from the Aerosol Robotic Network (AERONET) and the mass concentration of PM2.5 from ground-based measurements by the Interagency Monitoring of Protected Visual Environments at Bondville, Illinois [
21]. Utilizing local experimental models based on linear regression, the researchers found that the correlation between AOD and PM2.5 mass concentration was strongest during autumn and weakest during winter.
This paper introduces our smart environmental management system of ground-level sensors, and satellite image-derived land surface temperature and particulate matter concentrations for the Mekong Delta. We deploy multiple IoT stations in the system for ground measurement of various values, including land surface temperature (LST), PM10, PM2.5, CO, moisture, etc. Based on the telemetry data, we build computational models for extracting values of LST, PM10, and PM2.5 from MODIS images so that values for these parameters in the entire Mekong Delta area can be calculated. The combination of telemetry data and remote sensing images helps improve data quality and reduces building and operating costs.
The main contributions of our paper consist of three aspects as follows: (1) We propose an architecture for smart environmental management based on two sources of data: telemetry data and remote sensing images; (2) We build regression models for estimating PM10 and PM2.5 and apply an experimental model for extracting LST from MODIS images for the Mekong Delta areas; (3) We deploy and test the proposed system with five IoT stations whose data can be provided for other studies.
The rest of the paper is organized as follows. First, we present our system in
Section 2. We then introduce materials and methods for extracting data from remote sensing images in
Section 3.
Section 4 discusses our computational models for extracting the above values from remote sensing images. We test and report our experiments in
Section 5. Finally,
Section 6 concludes our paper.
2. System Overview
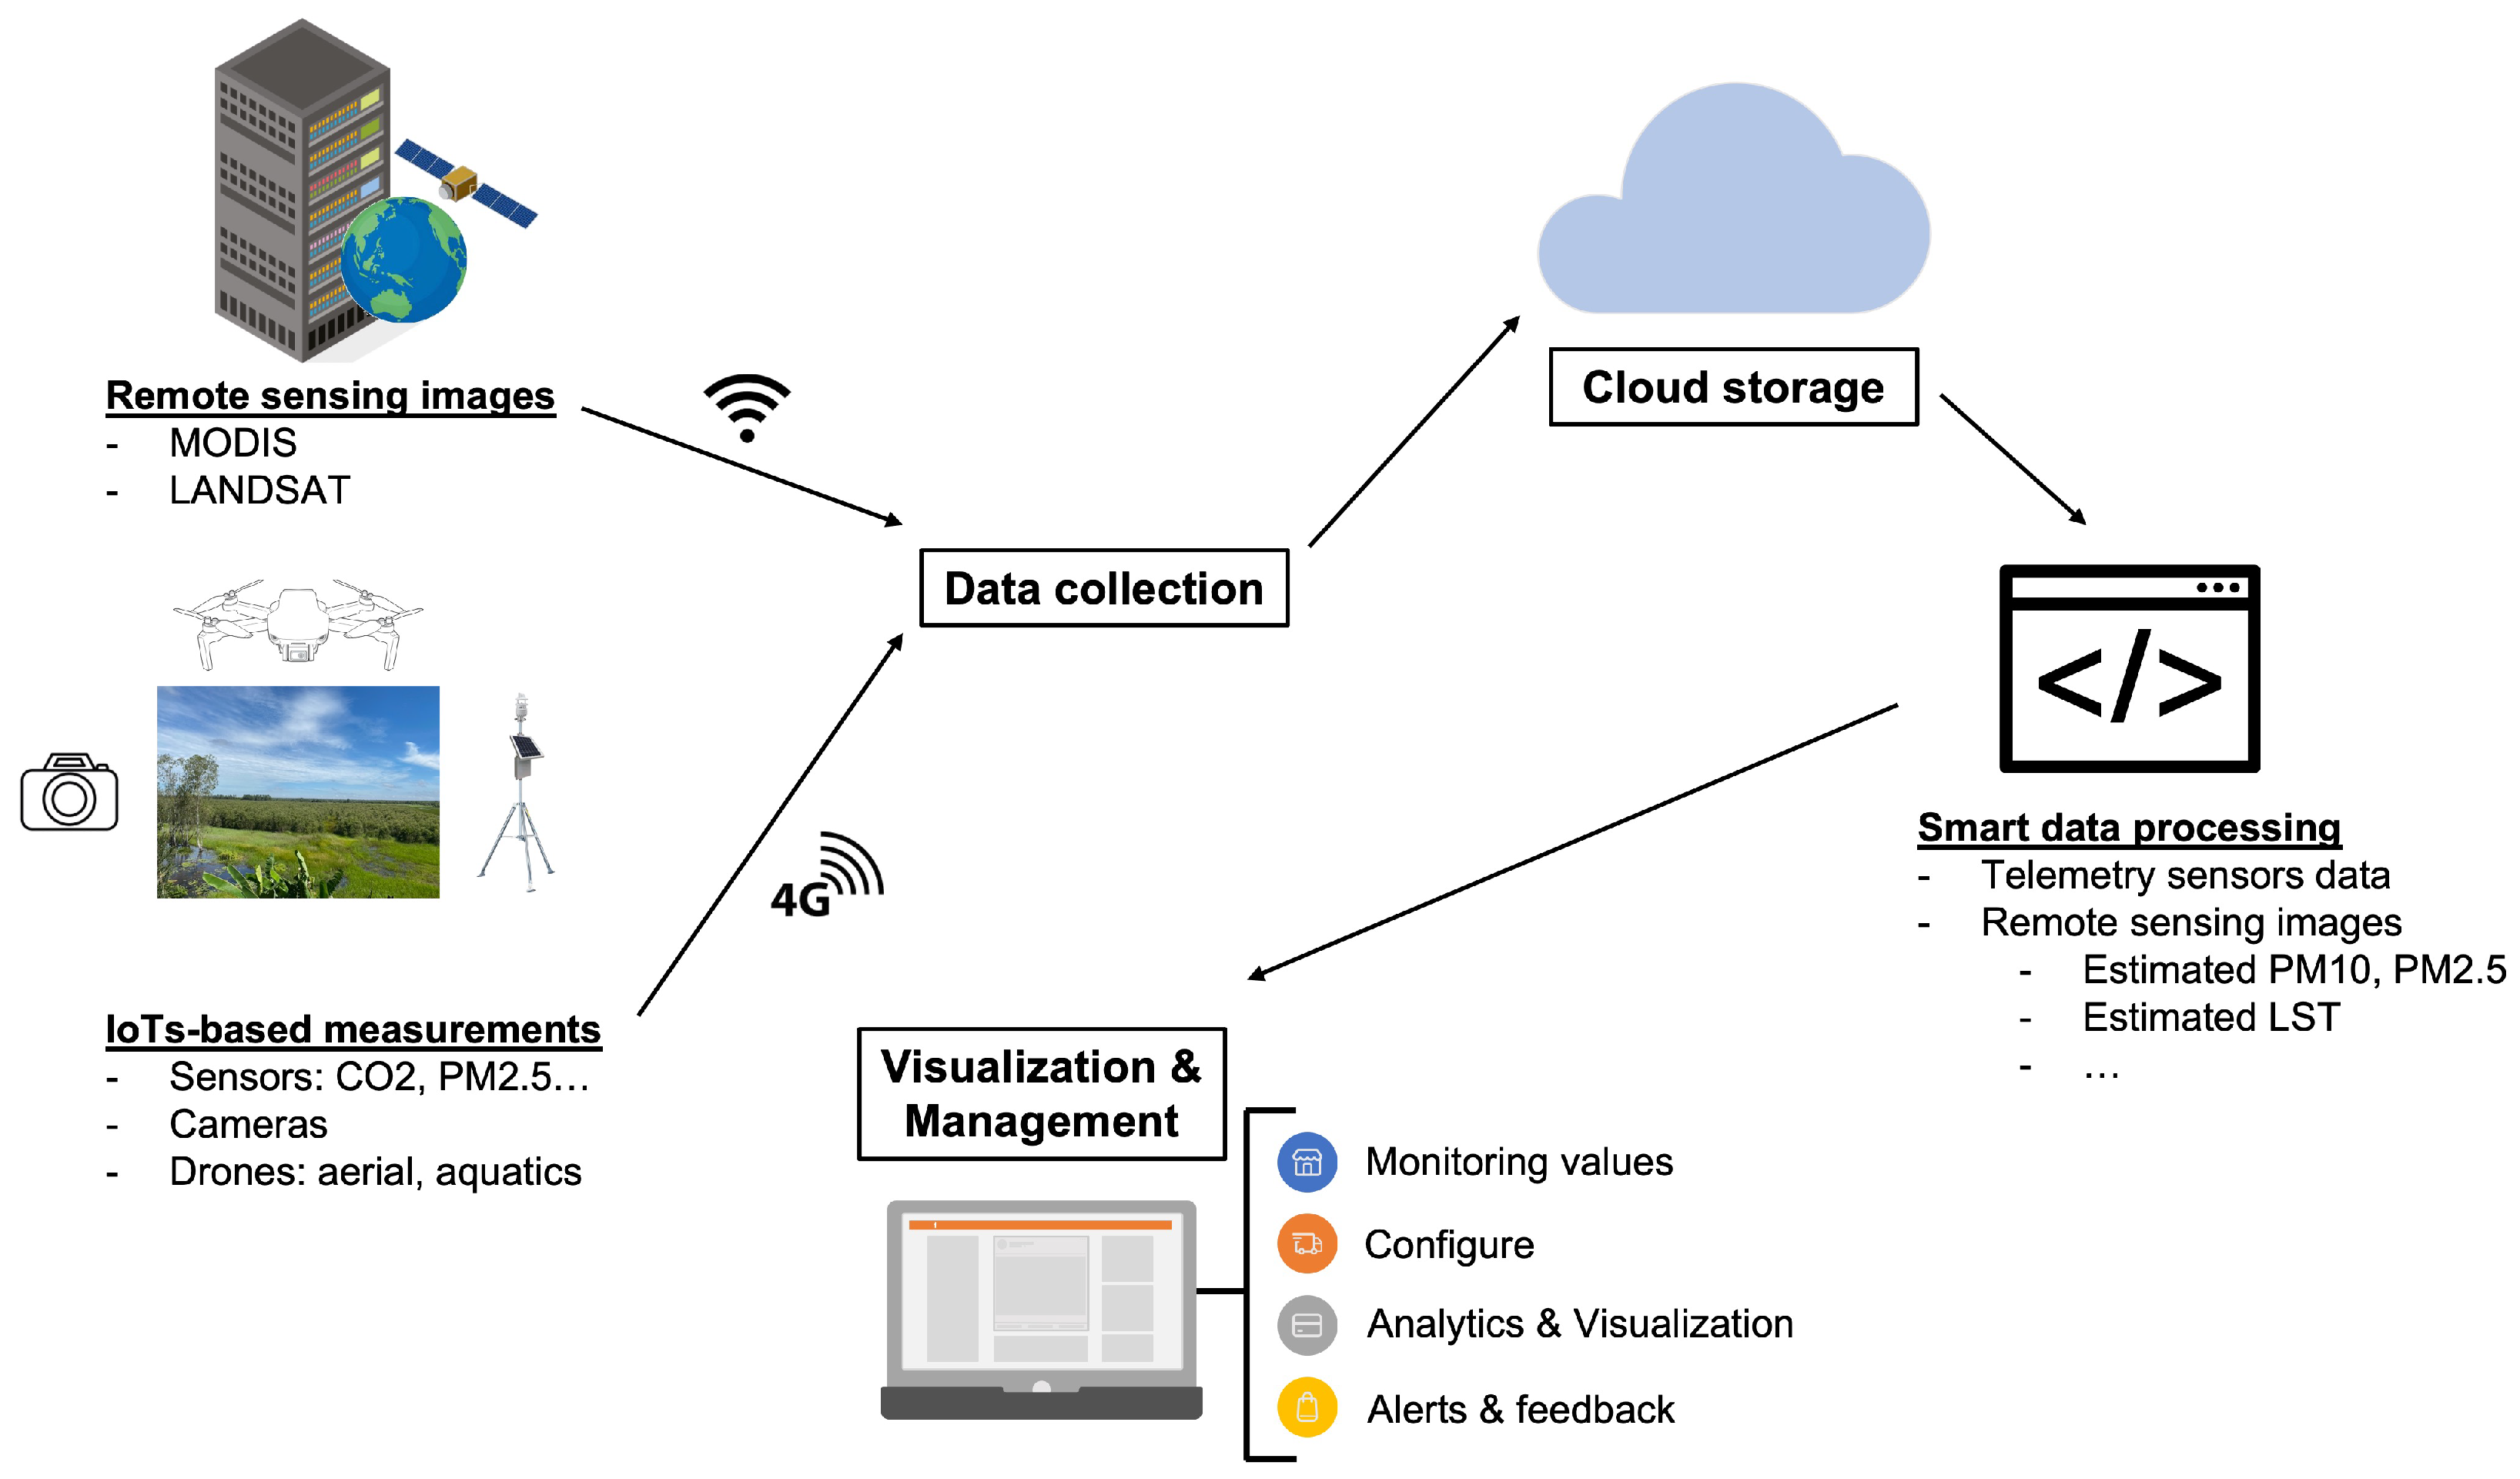
Figure 1 illustrates of IoTs and MODIS images based smart environmental management system for Mekong Delta. The proposed system architecture includes four main components: (1) Data collection; (2) Cloud storage; (3) Smart data processing; (4) Visualization and management.
The data collection component plays a critical role in the proposed smart environmental management system. This component is responsible for automatically acquiring remote sensing images from relevant providers, such as MODIS images from NASA (National Aeronautics and Space Administration (NASA), as well as telemetry data from IoT-based measurement ground stations. While the primary focus of this work is to manage PM10, PM2.5, and Land Surface Temperature (LST) values, the IoT-based architecture is designed to integrate multiple sensors, cameras, and drones for additional monitoring purposes.
The connection between the remote sensing images and the system uses traditional internet connectivity, such as wireless or cable, while the connection with the ground stations uses 3G/4G networks due to the wide coverage area. Ground stations offer precise measurements of PM10, PM2.5, and LST values; however, building and operating these stations are more expensive compared to extracting these values from remote sensing images. This is the primary reason for combining satellite images and ground station measurements in the proposed system. The key requirement for data communication is to overcome data loss. In this system, we buffer telemetry data at the stations when they cannot be sent to the cloud. They will be resent to the cloud when the communication networks become available. Due to the reliability of 3G/4G networks, our communication is almost real-time available.
The collected data, including remote sensing images and raw telemetry sensor data, undergo preprocessing to eliminate redundancy and are then forwarded to cloud storage services for long-term storage. Raw data, instead of processed data, are stored in the cloud for further study. The Smart Data Processing engine then automatically retrieves and processes the data, including PM10, PM2.5, and LST values from telemetry data and remote sensing images. The engine is designed to process various data types, including images and videos from cameras and drones, providing versatility to the system.
A Graphic User Interface (GUI) is built for both desktop and mobile devices to visualize data in real time. The GUI also provides alert notifications to administrators based on rules and values of data. Through the GUI, administrators can configure the system by setting alerting rules or calibrating the ground stations. This feature provides a convenient and efficient way to manage the system and ensure that it is working optimally at all times.
In conclusion, the data collection component of the proposed smart environmental management system provides a robust and versatile way to gather data from remote sensing images and IoT-based ground stations. The preprocessing and storage of raw data in the cloud, combined with the Smart Data Processing engine, ensures that the system can efficiently process and extract meaningful information from the collected data. The GUI provides a convenient and accessible way for administrators to monitor the system, configure it, and receive alert notifications, ensuring that the system is working optimally at all times.
3. Materials and Methods
In this section, we present details of the method and materials used for estimating values of PM10, PM2.5, and LST from remote sensing images and telemetry data.
3.1. Study Area
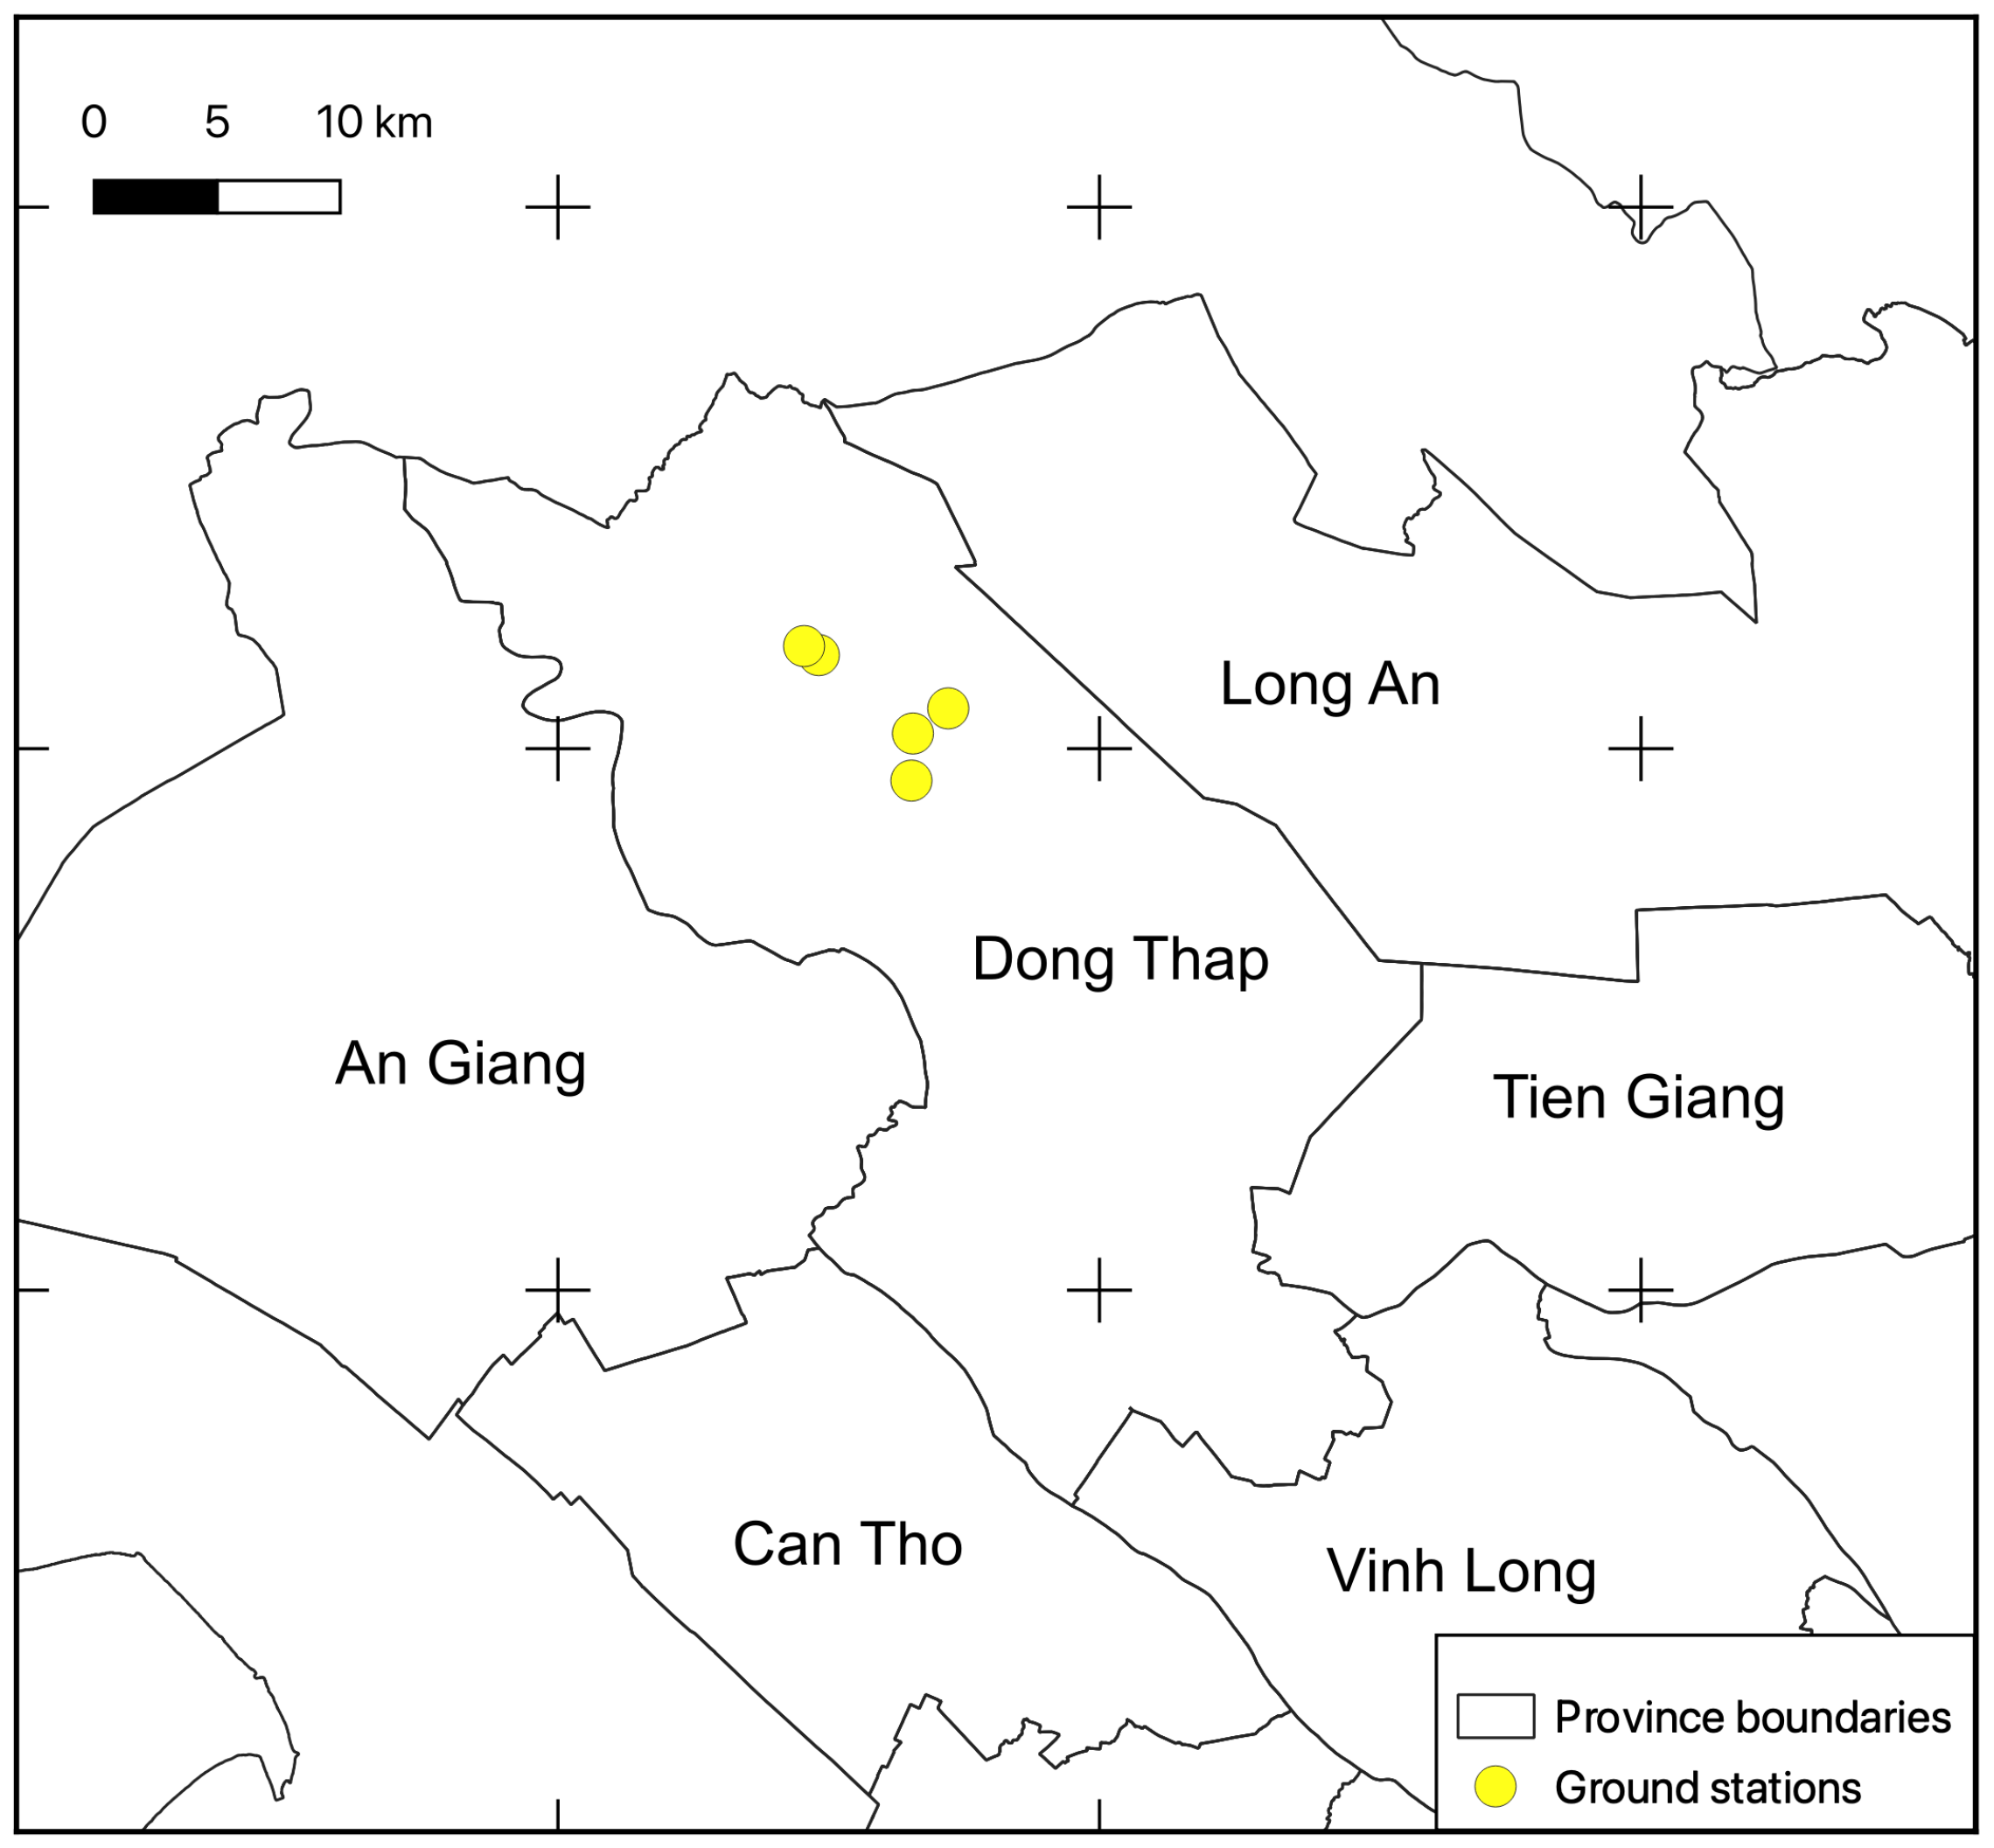
Figure 2 shows the distribution of the ground stations in the Dong Thap Province. In this study, the Tram Chim National Park located in Dong Thap Province was selected as the site for the deployment and testing of the proposed system. This choice was made because the area represents all the vital attributes of the Mekong Delta region. Tram Chim National Park, situated in Dong Thap Muoi in Dong Thap Province, Vietnam, is one of the few remaining wetlands in the threatened Plain of Reed’s ecosystem. This park holds exceptional biodiversity and tourism value, being home to over 230 bird species and 130 fish species, including the endangered Sarus Crane that is listed on the IUCN Red List. Tram Chim has been designated as a Ramsar site of international significance under the Ramsar Convention, emphasizing its importance to the global community.
However, despite its significance, the current environmental management and research efforts at Tram Chim are hampered by the lack of sufficient and consistent survey data. This is due to the challenges of accessing remote sites and the frequent flooding that occurs in the area. The absence of adequate data collection hinders the efforts to preserve and protect the park’s valuable ecosystem and wildlife. In light of this, the proposed smart environmental management system aims to overcome these challenges by utilizing innovative data collection and processing techniques.
In our system, we deploy five IoT stations in the national park area for collecting multiple telemetry parameters, as mentioned in
Section 2. However, only PM10, PM2.5, and land surface temperature values are used for this work.
3.2. Ground Measurement Stations
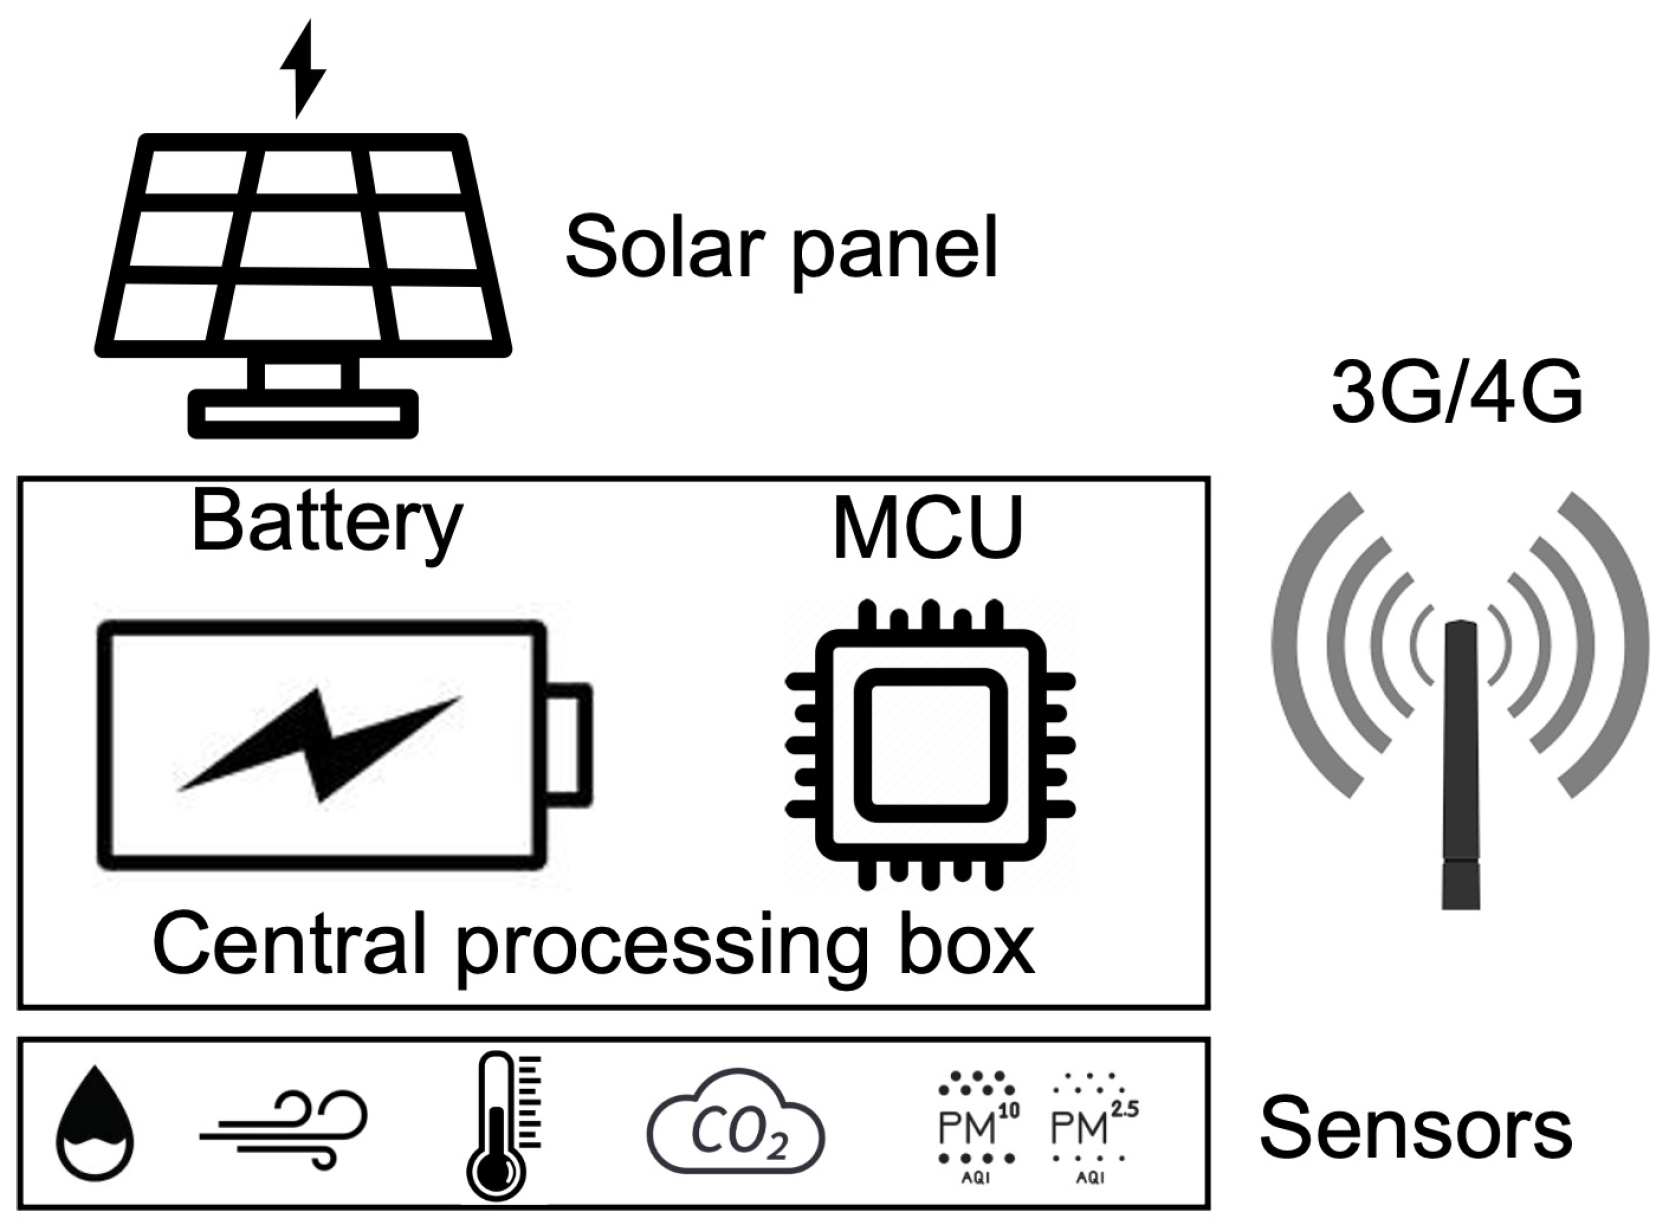
Figure 3 displays the sensor station architecture of our proposed system. As shown in the figure, the power supply for the IoT stations is provided by solar panels, considering the park’s natural conditions. The data communication between the stations and the data collection module on the cloud is facilitated through the use of a 3G/4G network. Each station collects a variety of parameters, including temperature, moisture, CO
, and particulate matter (PM10 and PM2.5), among others, through the use of sensors. It is important to note that the list of sensors used can be customized and modified according to the system’s specific requirements.
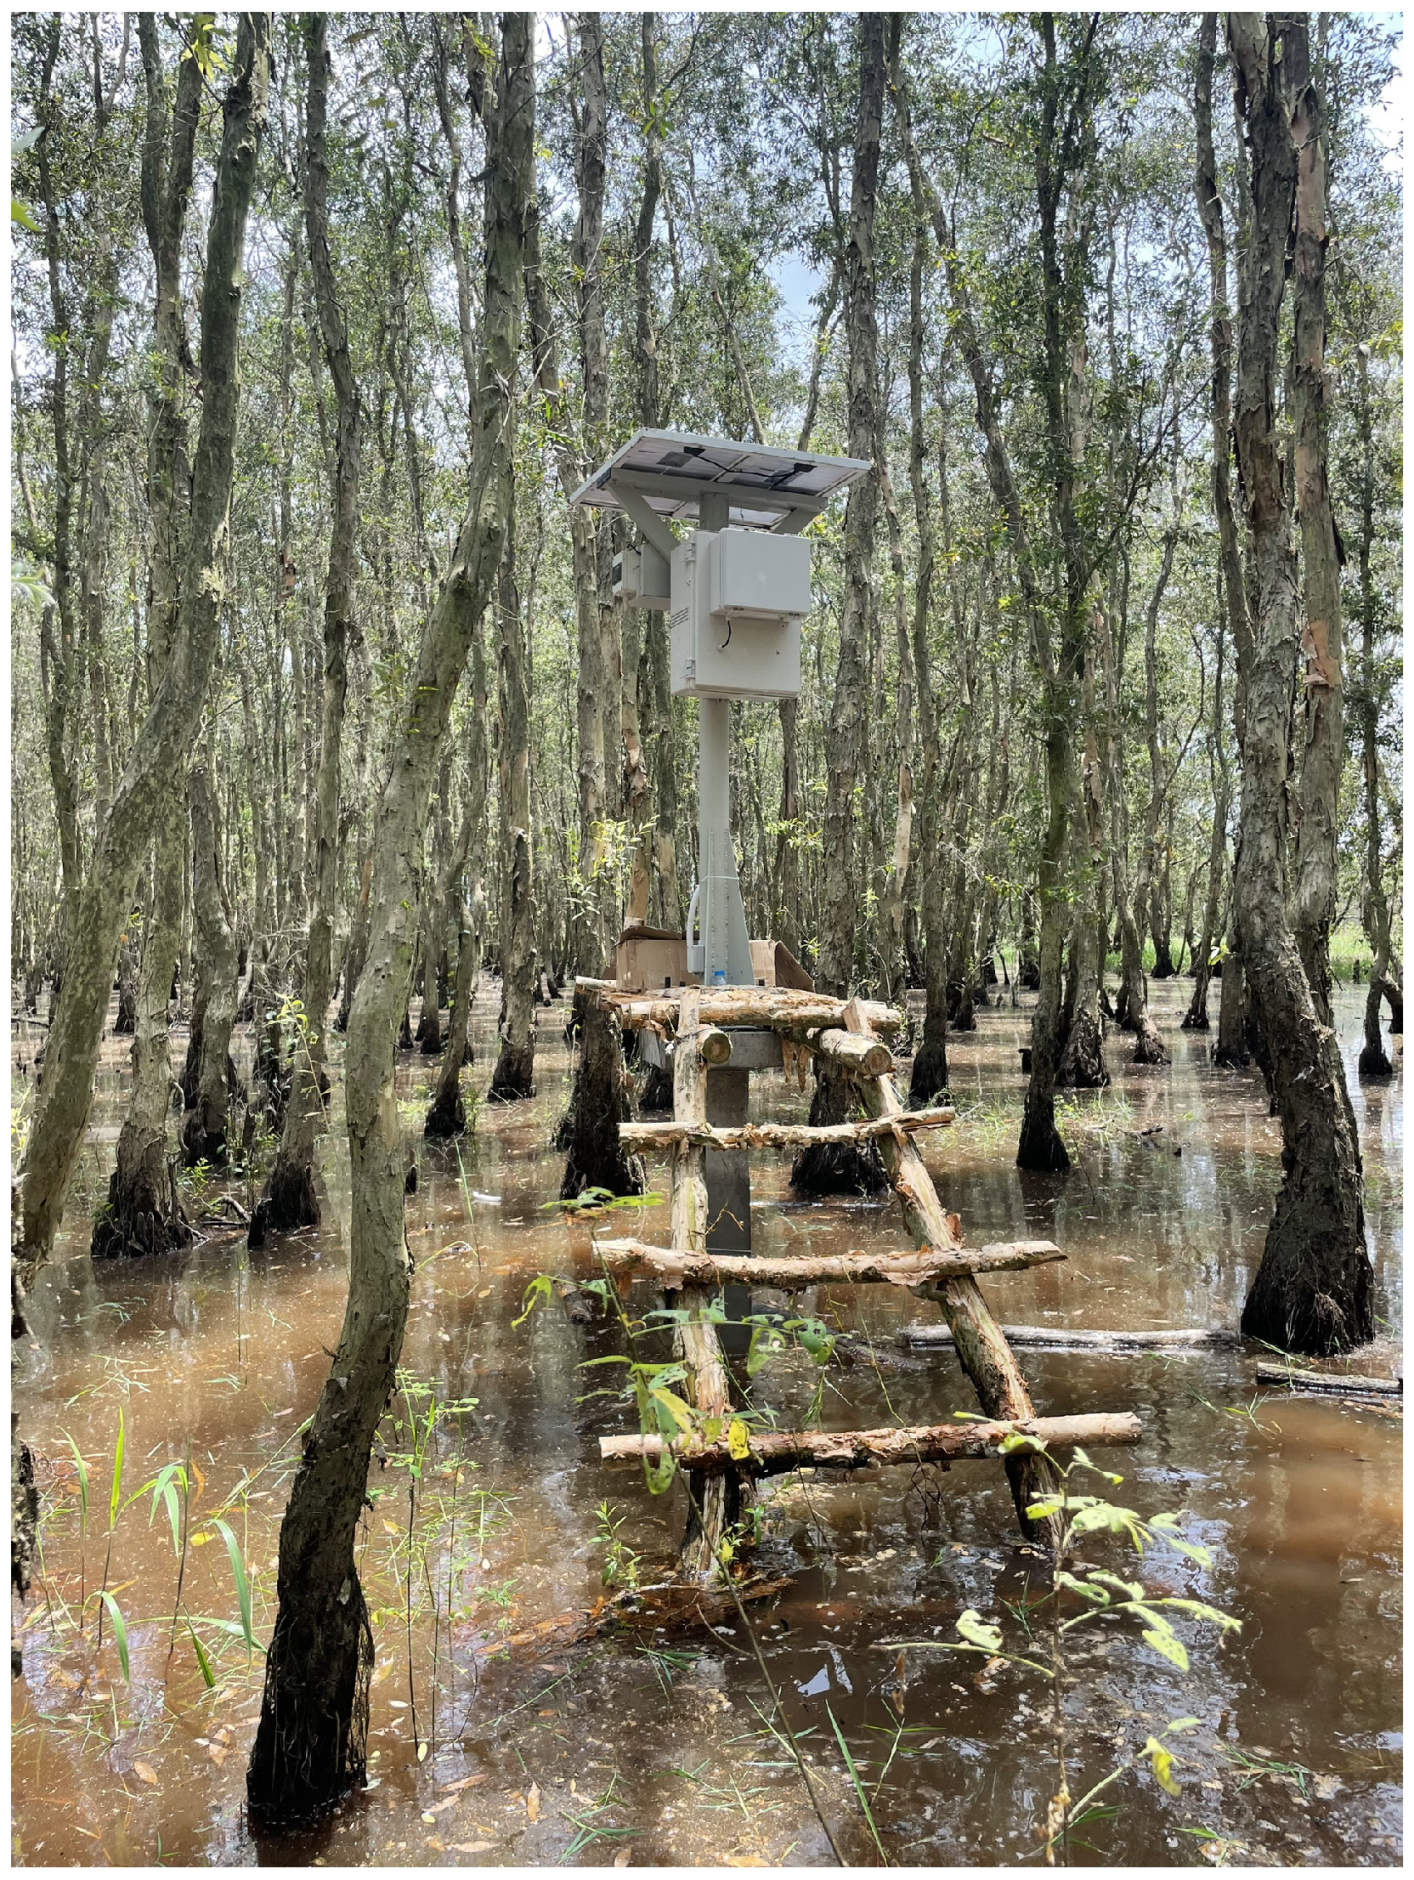
Figure 4 presents a visual representation of the actual deployment of an IoT sensor station in the study area. For deploying in the Mekong Delta area where the water level may change from 0 m to 2 m every year, we store the sensors and control board inside a waterproof 20 cm × 30 cm box. The box is placed on the top of a 2 m concrete column. The large scale of the Mekong Delta requires a comprehensive and efficient approach to data collection for the smart environmental management system. Hence, deploying a combination of IoT stations and using remote sensing images is critical to ensuring the quality of data collected and reducing the building and operating costs of the system.
Integrating IoT stations and remote sensing images enhances the coverage and accuracy of data collection, allowing for a more comprehensive and reliable representation of the state of the environment. The use of IoT stations ensures that real-time data can be collected and processed. At the same time, the remote sensing images provide a broader perspective of the study area, allowing for the detection of patterns and trends. The combination of these two approaches enables the smart environmental management system to be a cost-effective and efficient solution for monitoring the environment in the Mekong Delta.
3.3. MODIS Data Products
The Terra satellite, launched by NASA in December 1999 [
22], is equipped with five instruments, including the Moderate Resolution Imaging Spectroradiometer (MODIS). The primary objective of the Terra mission is to observe various aspects of the Earth’s atmosphere, ocean, land, snow and ice, and energy budget. Orbiting the Earth in a circular sun-synchronous polar orbit, the Terra satellite completes one orbit every 99 min and it crosses the Equator at 10:30 a.m. The MODIS sensor covers a range from visible, near-infrared, shortwave-infrared short-wavelengths to thermal infrared long-wavelengths, traveling from north to south on the daylight side of the planet. The MODIS sensor captures a wide range of wavelengths, from blue to thermal infrared, utilizing 36 bands. The spatial resolutions for bands 1–2, bands 3–7, and bands 8–36 are 250 m, 500 m, and 1000 m, respectively, as shown in
Table 1 [
23].
In addition to the level-1 raw radiance data, the level-2 and level-3 MODIS data consist of various products related to the atmosphere, land, cryosphere, and ocean [
24]. Since 2000, MODIS data products have been made available at different temporal resolutions, including daily, 8-day, 16-day, monthly, quarterly, and yearly. It is important to note that all MODIS data products are accessible free of charge.
For this study, the primary data utilized are daytime Land Surface Temperature (LST) derived from the MOD09GA and MOD11A1 land products, as well as PM mass concentration estimated from the MCD19A2 atmosphere product. These products can be obtained from the USGS Earth Data website [
25] or retrieved through the use of Google Earth Engine [
26]. To cover the whole Dong Thap Province, we need one scene at the horizontal-vertical location of ‘h28-v08’ on the global grid, and its acquisition time is at 10:30 a.m., correspondingly, as depicted in
Figure 5. The images in the hierarchical data format (HDF) of earth observing systems are georeferenced to the sinusoidal datum. Subsequently, the image dataset is converted to the WGS84 geographic coordinate system from the Sinusoidal datum and saved in the Geo-tiff format. Finally, the images are clipped, ensuring they remain within the boundaries of Dong Thap Province.
3.3.1. MOD09GA Product
The MOD09GA product offers an estimation of the surface spectral reflectance for MODIS bands 1 to 7 at a resolution of 500 m. This estimation takes into account atmospheric conditions, including gases, aerosols, and Rayleigh scattering [
27]. Additionally, it includes observation and quality layers consisting of ten 1 km observation bands and geolocation flags. The reflectance layers obtained from the MOD09GA product serve as the foundational data for numerous MODIS land products. This product is used to determine the vegetative cover of land surface from red and near-infrared reflectance factors, corresponding to MODIS band 1 (0.65 µm) and band 2 (0.86 µm) images. For example, the Normalized Difference Vegetation Index (NDVI) is one of the vegetation indices to quantify vegetation by measuring the difference between near-infrared (which vegetation strongly reflects) and red light (which vegetation absorbs). NDVI is computed following Equation (
1), where
and
are red and near-infrared reflectance factors, respectively. NDVI ranges from −1 to +1. A negative NDVI value is highly likely water while an NDVI value close to +1 presents a high possibility of dense green leaves. But when NDVI is close to zero, there are likely no green leaves and it could even be a built-up area.
3.3.2. MOD11A1 Product
The MOD11A1 product offers daily measurements of land-surface temperature (LST), emissivity values, and corresponding quality indicator layers at a resolution of 1 km [
28]. In areas above 30 degrees latitude, certain pixels may contain multiple observations that meet the criteria for clear-sky conditions. In such cases, the pixel value is calculated as the average of all qualifying observations. LST can be computed from the brightness temperature
in combination with the global atmospheric correction model, e.g., LST images of the MOD11A1 product in the level-3 data processing directly derived from the MODIS Band 31 and 32 thermal emissive data. The brightness temperature is a measurement of the radiance of emission traveling upward from the top of the atmosphere to the satellite, in Kelvin scale temperature unit (K). The brightness temperature
detected by a thermal sensor is determined by Planck’s Equation (
2), where
(W/m
.sr.m) is the spectral radiation,
(J.s) is Planck’s constant,
(m/s) is the speed of light,
(J/K) is Boltzmann’s constant, and
(µm) is the central wavelength.
and
(W/m
.sr.m) are calibration coefficients, for band 31:
,
, and band 32:
,
[
29].
Additionally, LST can be estimated from the emissivity values in combination with the vegetative cover using an experimental model, which is presented in
Section 4.1—LST computation.
3.3.3. MCD19A2 Product
The MCD19A2 product, derived using the Multi-Angle Implementation of Atmospheric Correction MAIAC algorithm, is a level-2 dataset that offers gridded aerosol optical thickness (AOT) measurements over land surfaces [
30]. The radiance measured by the satellite sensor for each pixel on the Earth’s surface results from a combination of surface reflection and scattering caused by atmospheric gases and particles. This allows for the estimation of aerosol optical depth (AOD) by considering factors such as derived surface reflectivity, aerosol characteristics (e.g., single scattering albedo and phase function), and the angular distribution of scattered light, which is primarily influenced by particle size [
21]. The MODIS sensor is specifically designed for aerosol retrievals and utilizes data from seven bands spanning wavelengths from 0.47 to 2.13 µm. In addition to AOD, these bands provide some information about aerosol particle size. The MAIAC algorithm takes into account surface reflectivity, assumed aerosol and atmospheric properties, and assigns an aerosol type based on seasonally and spatially varying aerosol characteristics derived from ground AERONET-based measurements conducted at various sites. The AOD products are derived by aggregating the observed mean radiance over a 10 km
area, which is formed from 400 subpixels at a resolution of 500 m, excluding the brightest 50% and darkest 20% of pixels. Currently, the retrieval of AOT is limited to altitudes below 4.2 km. These AOT data serve as inputs for estimating the mass concentrations of PM2.5 and PM10 using a regression method.
4. Data Processing
This section is dedicated to the introduction of our computational models that are developed for extracting values of Land Surface Temperature (LST), PM10, and PM2.5 from the combination of remote sensing images and telemetry data collected from IoT stations. The models are designed to take advantage of the data sources available and provide a way to extract the relevant environmental variables of interest in an automated and efficient manner. The telemetry data from IoT stations provide ground-level measurements of various environmental parameters, while remote sensing images provide a broader view of the area of interest and help to fill in any gaps in the ground-level data. The computational models leverage both types of data and use them to generate the desired outputs. The results of these models can be used in various applications, such as real-time monitoring, alert notifications, and visualization. By using these models, we can achieve a better understanding of the environmental conditions in the study area and make informed decisions about how best to manage it.
4.1. LST Computation
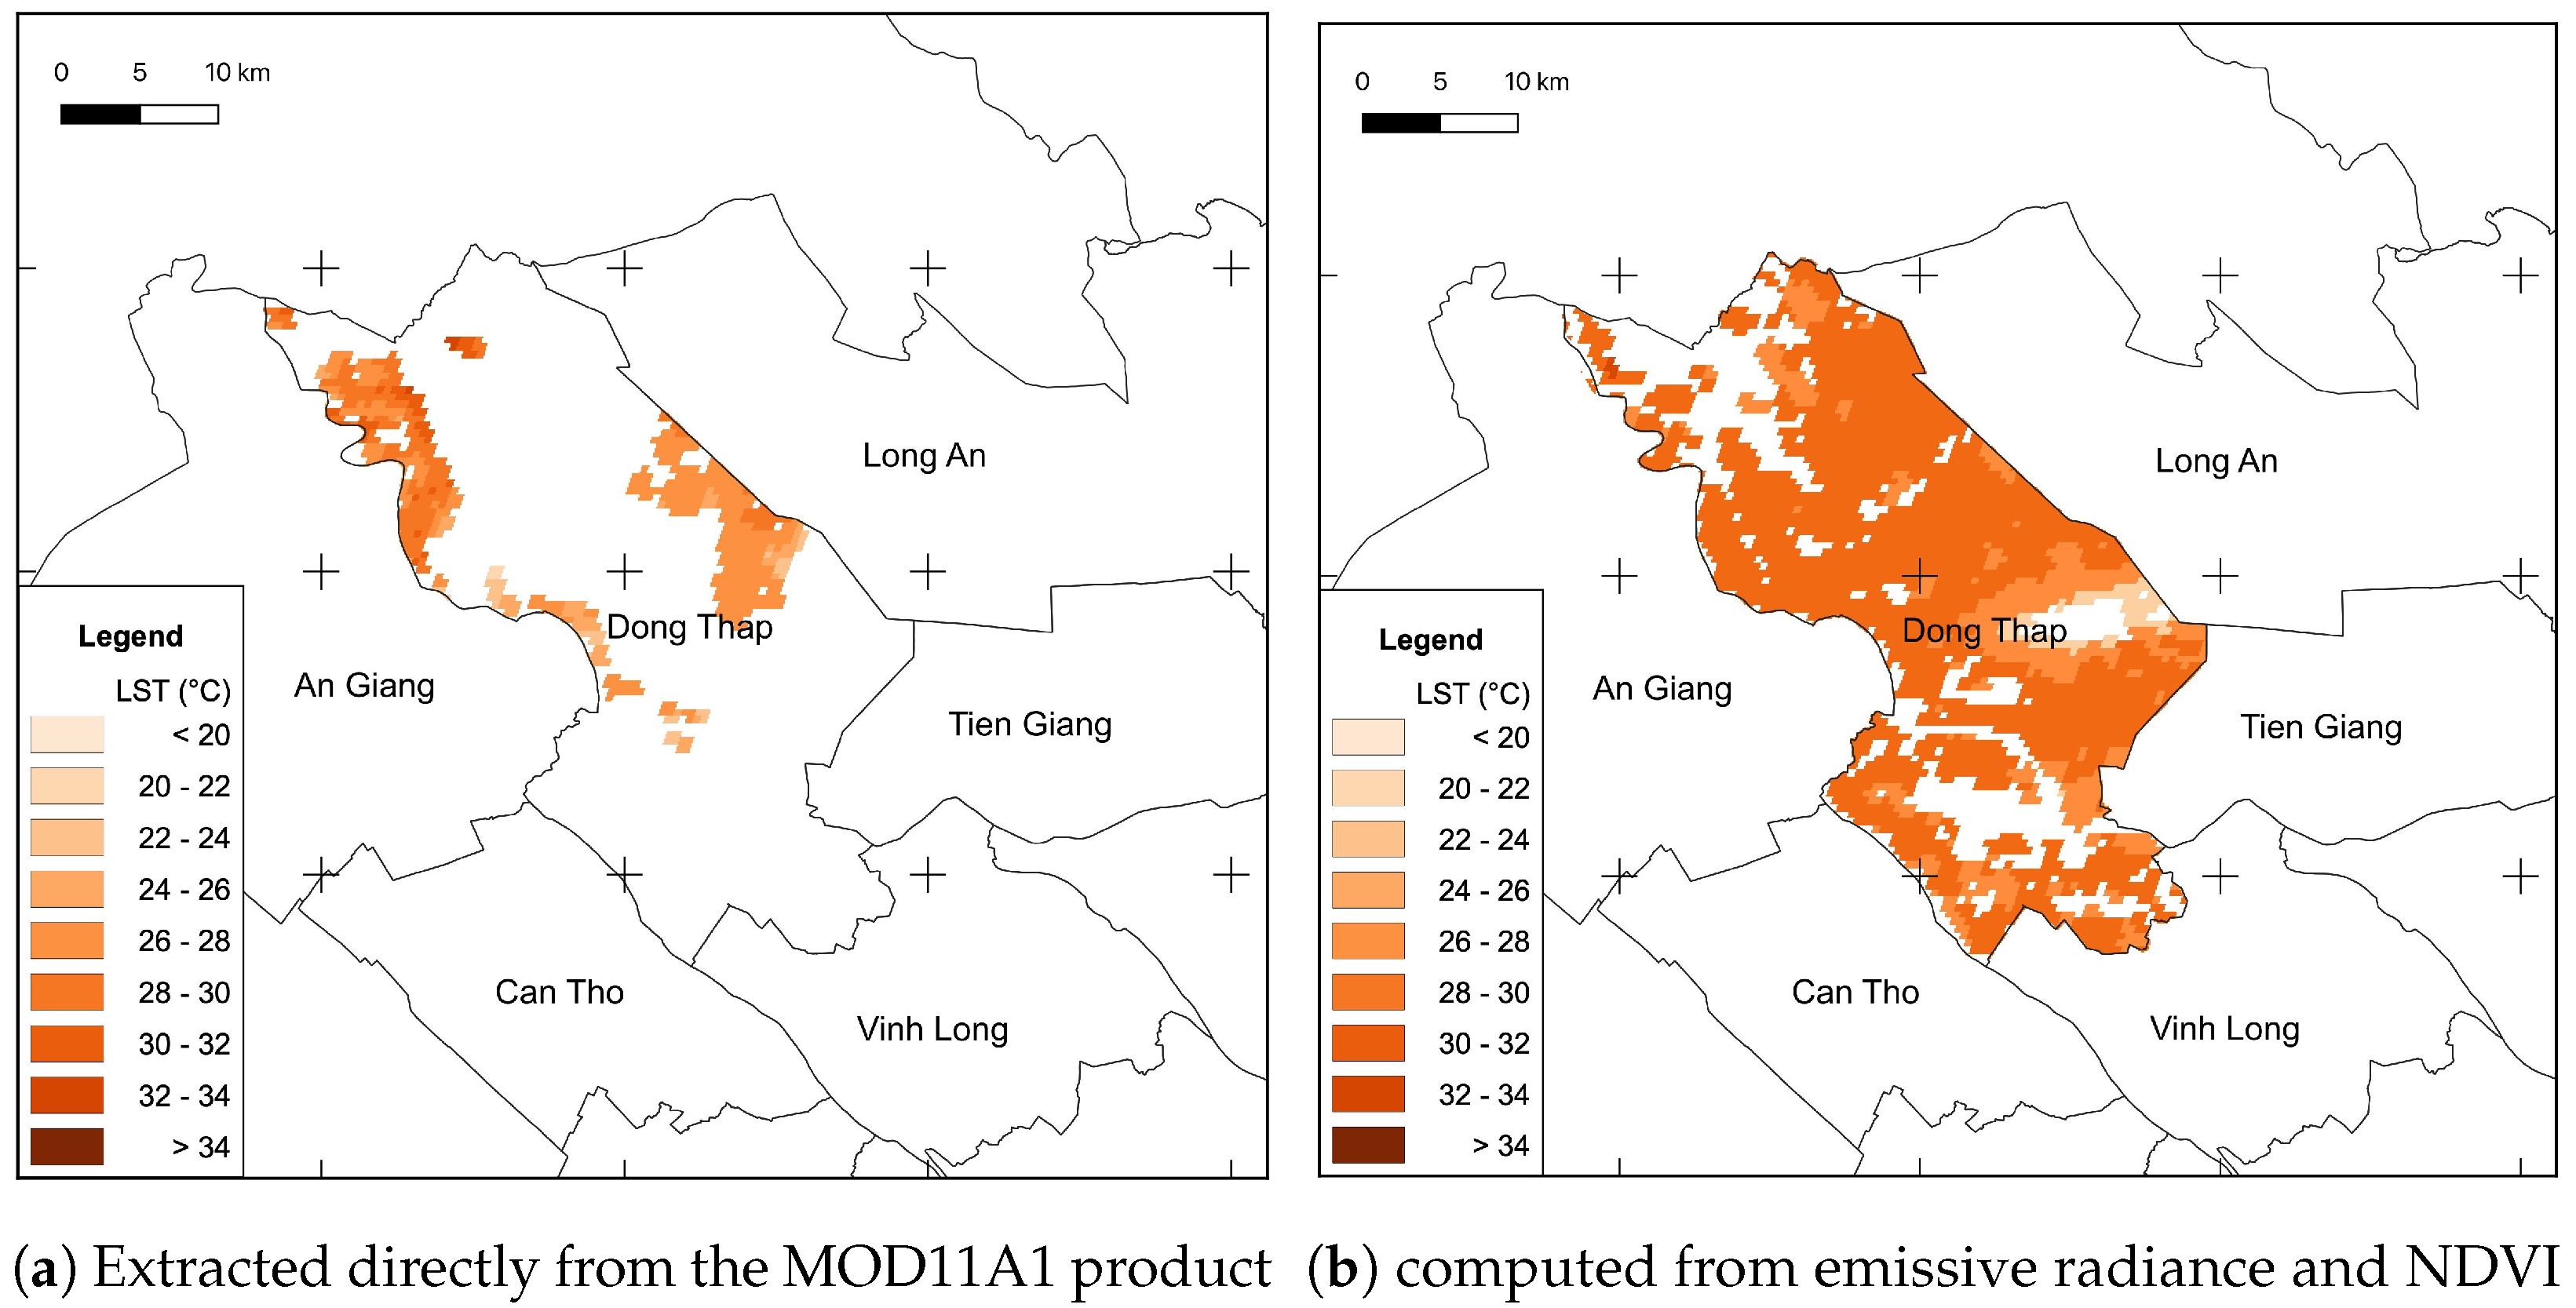
The daily daytime LST image in the level-3 data processing used in the study can be extracted directly from the MOD11A1 product. However, these LST images usually contain many no-data pixels because the temperature value is estimated using the computational model based on global environmental characteristics and ground measurements by NASA [
30]. Therefore, in this study, we apply the algorithm of LST computation from emissive data of two thermal bands developed by Price in 1984 [
31]. The authors exploited the Advanced Very High-Resolution Radiometer (AVHRR) on the NOAA 7 satellite images at two 10.8 and 11.9 µm bands at 1 km spatial resolution to estimate LST, following Equations (
3)–(
6). Additionally, the atmospheric correction of radiation from the Earth’s surface was found. The algorithm was proposed based on an analysis of AVHRR images on July 1981 and a comparison of the radiative transfer theoretical model, sea surface temperature from satellite data, and ground meteorological measurements. Price’s algorithm was confirmed by Vazquez et al. in 1997 [
32]. We use AVHRR images corresponding to a flat homogeneous region characterized by the presence of natural grassland with patches of bare soil, and allowing for seasonal changes in surface emissivity due to changes in vegetative cover using NDVI. Then, they developed different algorithms to estimate LST based on exploring atmospheric effects and the land emissivity effect on surface temperature. The algorithms were tested by ground LST measurements. The results indicated that the LST strongly depends on errors in land surface emissivity.
Here, we use the two MODIS thermal images of bands 31 and 32, corresponding to the two AVHRR thermal images to compute LST (K), following Equations (
3)–(
6).
and
(K) are the brightness temperatures obtained from band 31 and 32 images, respectively.
and
(K) are computed following Equation (
2).
and
are the coefficients of land surface emissivity in band 31, and band 32, respectively.
and
are estimated from sensor-based measurements and NASA’s global computational model.
is an average coefficient of bands 31 and 32.
is a difference of land surface emissivity between bands 31 and 32. Moreover, coefficients of land surface emissivity can be calculated from NDVI, using the experimental model proposed by Cihlar et al. in 1997 [
33]. Accordingly,
and
are calculated following Equations (
7) and (
8), respectively, where NDVI is computed following Equation (
1).
Figure 6 shows LST (°C) derived from the data on 9 June 2022.
4.2. PM2.5 and PM10 Mass Concentration Estimation
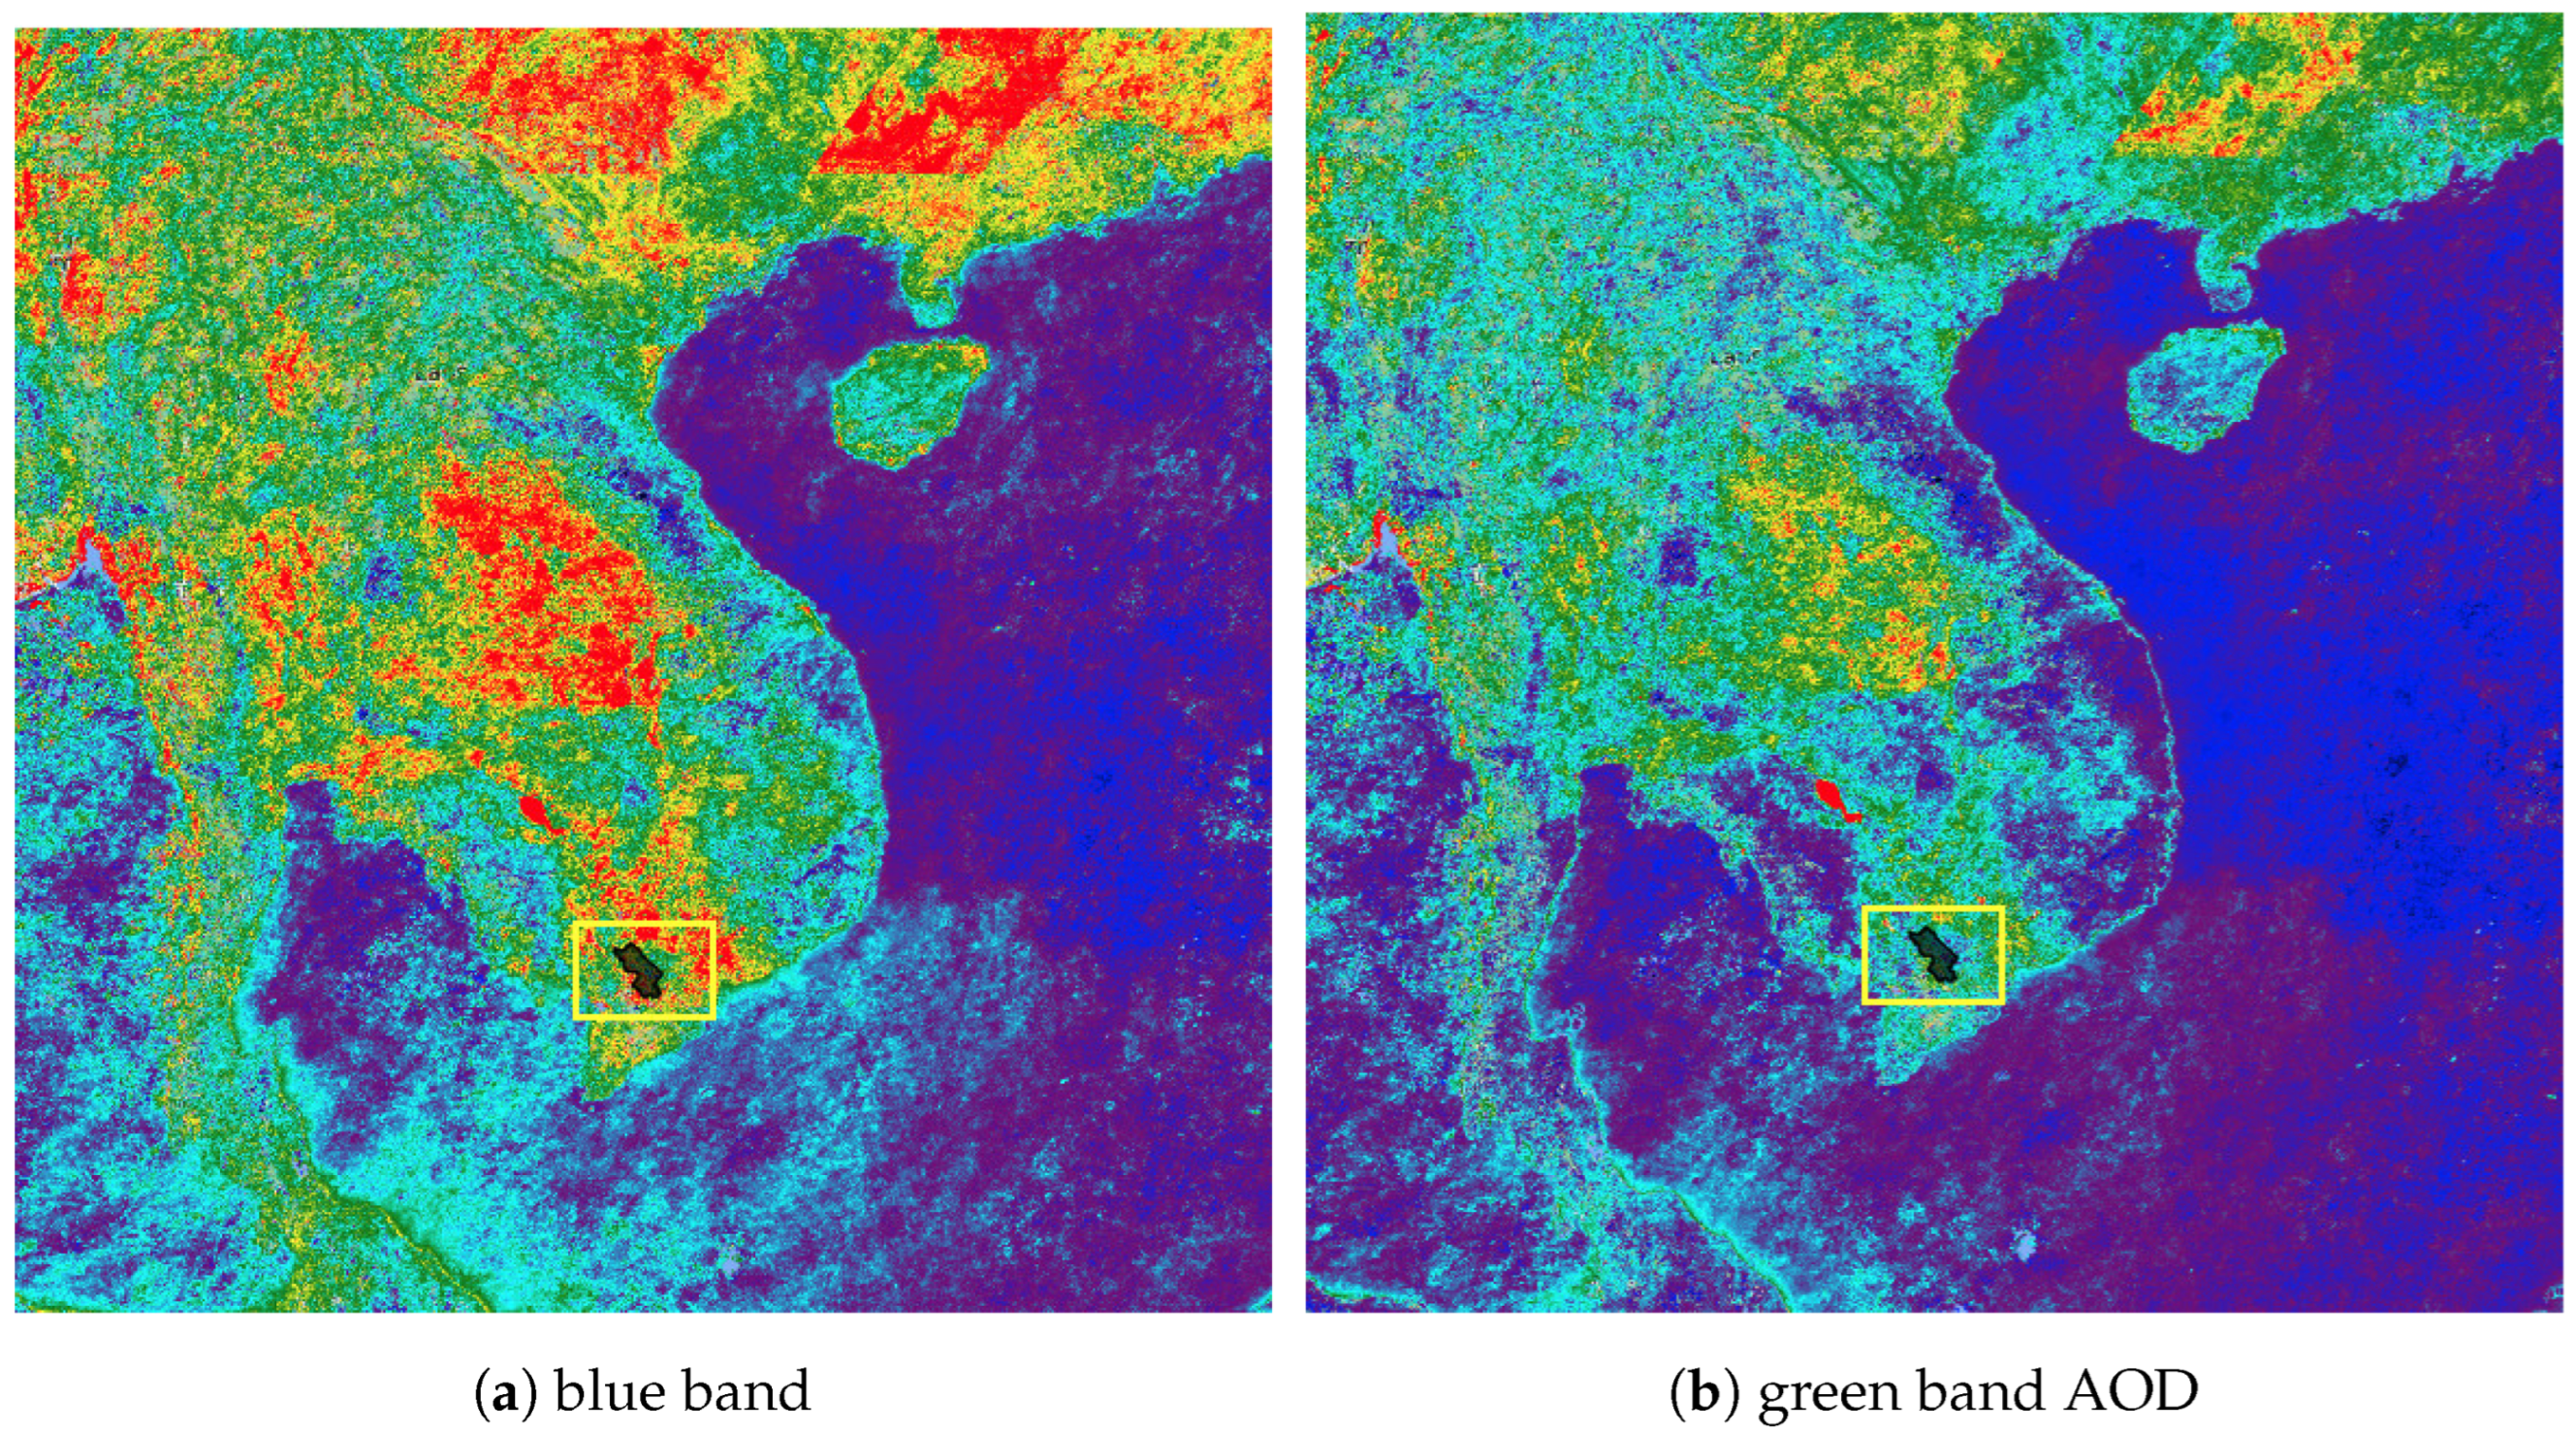
The satellite instrument detects radiance from the mixture of surface reflection and atmospheric scattering caused by elements in the air, like gases and particles. We make certain assumptions to estimate aerosol optical depth (AOD), including the exploitation of derived surface reflectivity and aerosol attributes like phase procedure or single scattering albedo, influenced by the angular distribution of scattered light and primarily determined by particle size [
34]. The MODIS instrument is specifically designed to retrieve aerosol properties and utilizes data from seven different wavelengths spanning from 0.47 to 2.13 µm. This range of wavelengths provides valuable information about both the size of aerosol particles and AOD. The MODIS algorithm considers surface reflectivity and makes assumptions regarding specific aerosol and atmospheric properties. The AOD products are obtained by analyzing the average radiance observed within a 10 km
2 area derived from 400 pixels with 500 m per pixel resolution. We excluded 50% and 20% of the brightest and darkest pixels from the analysis, respectively.
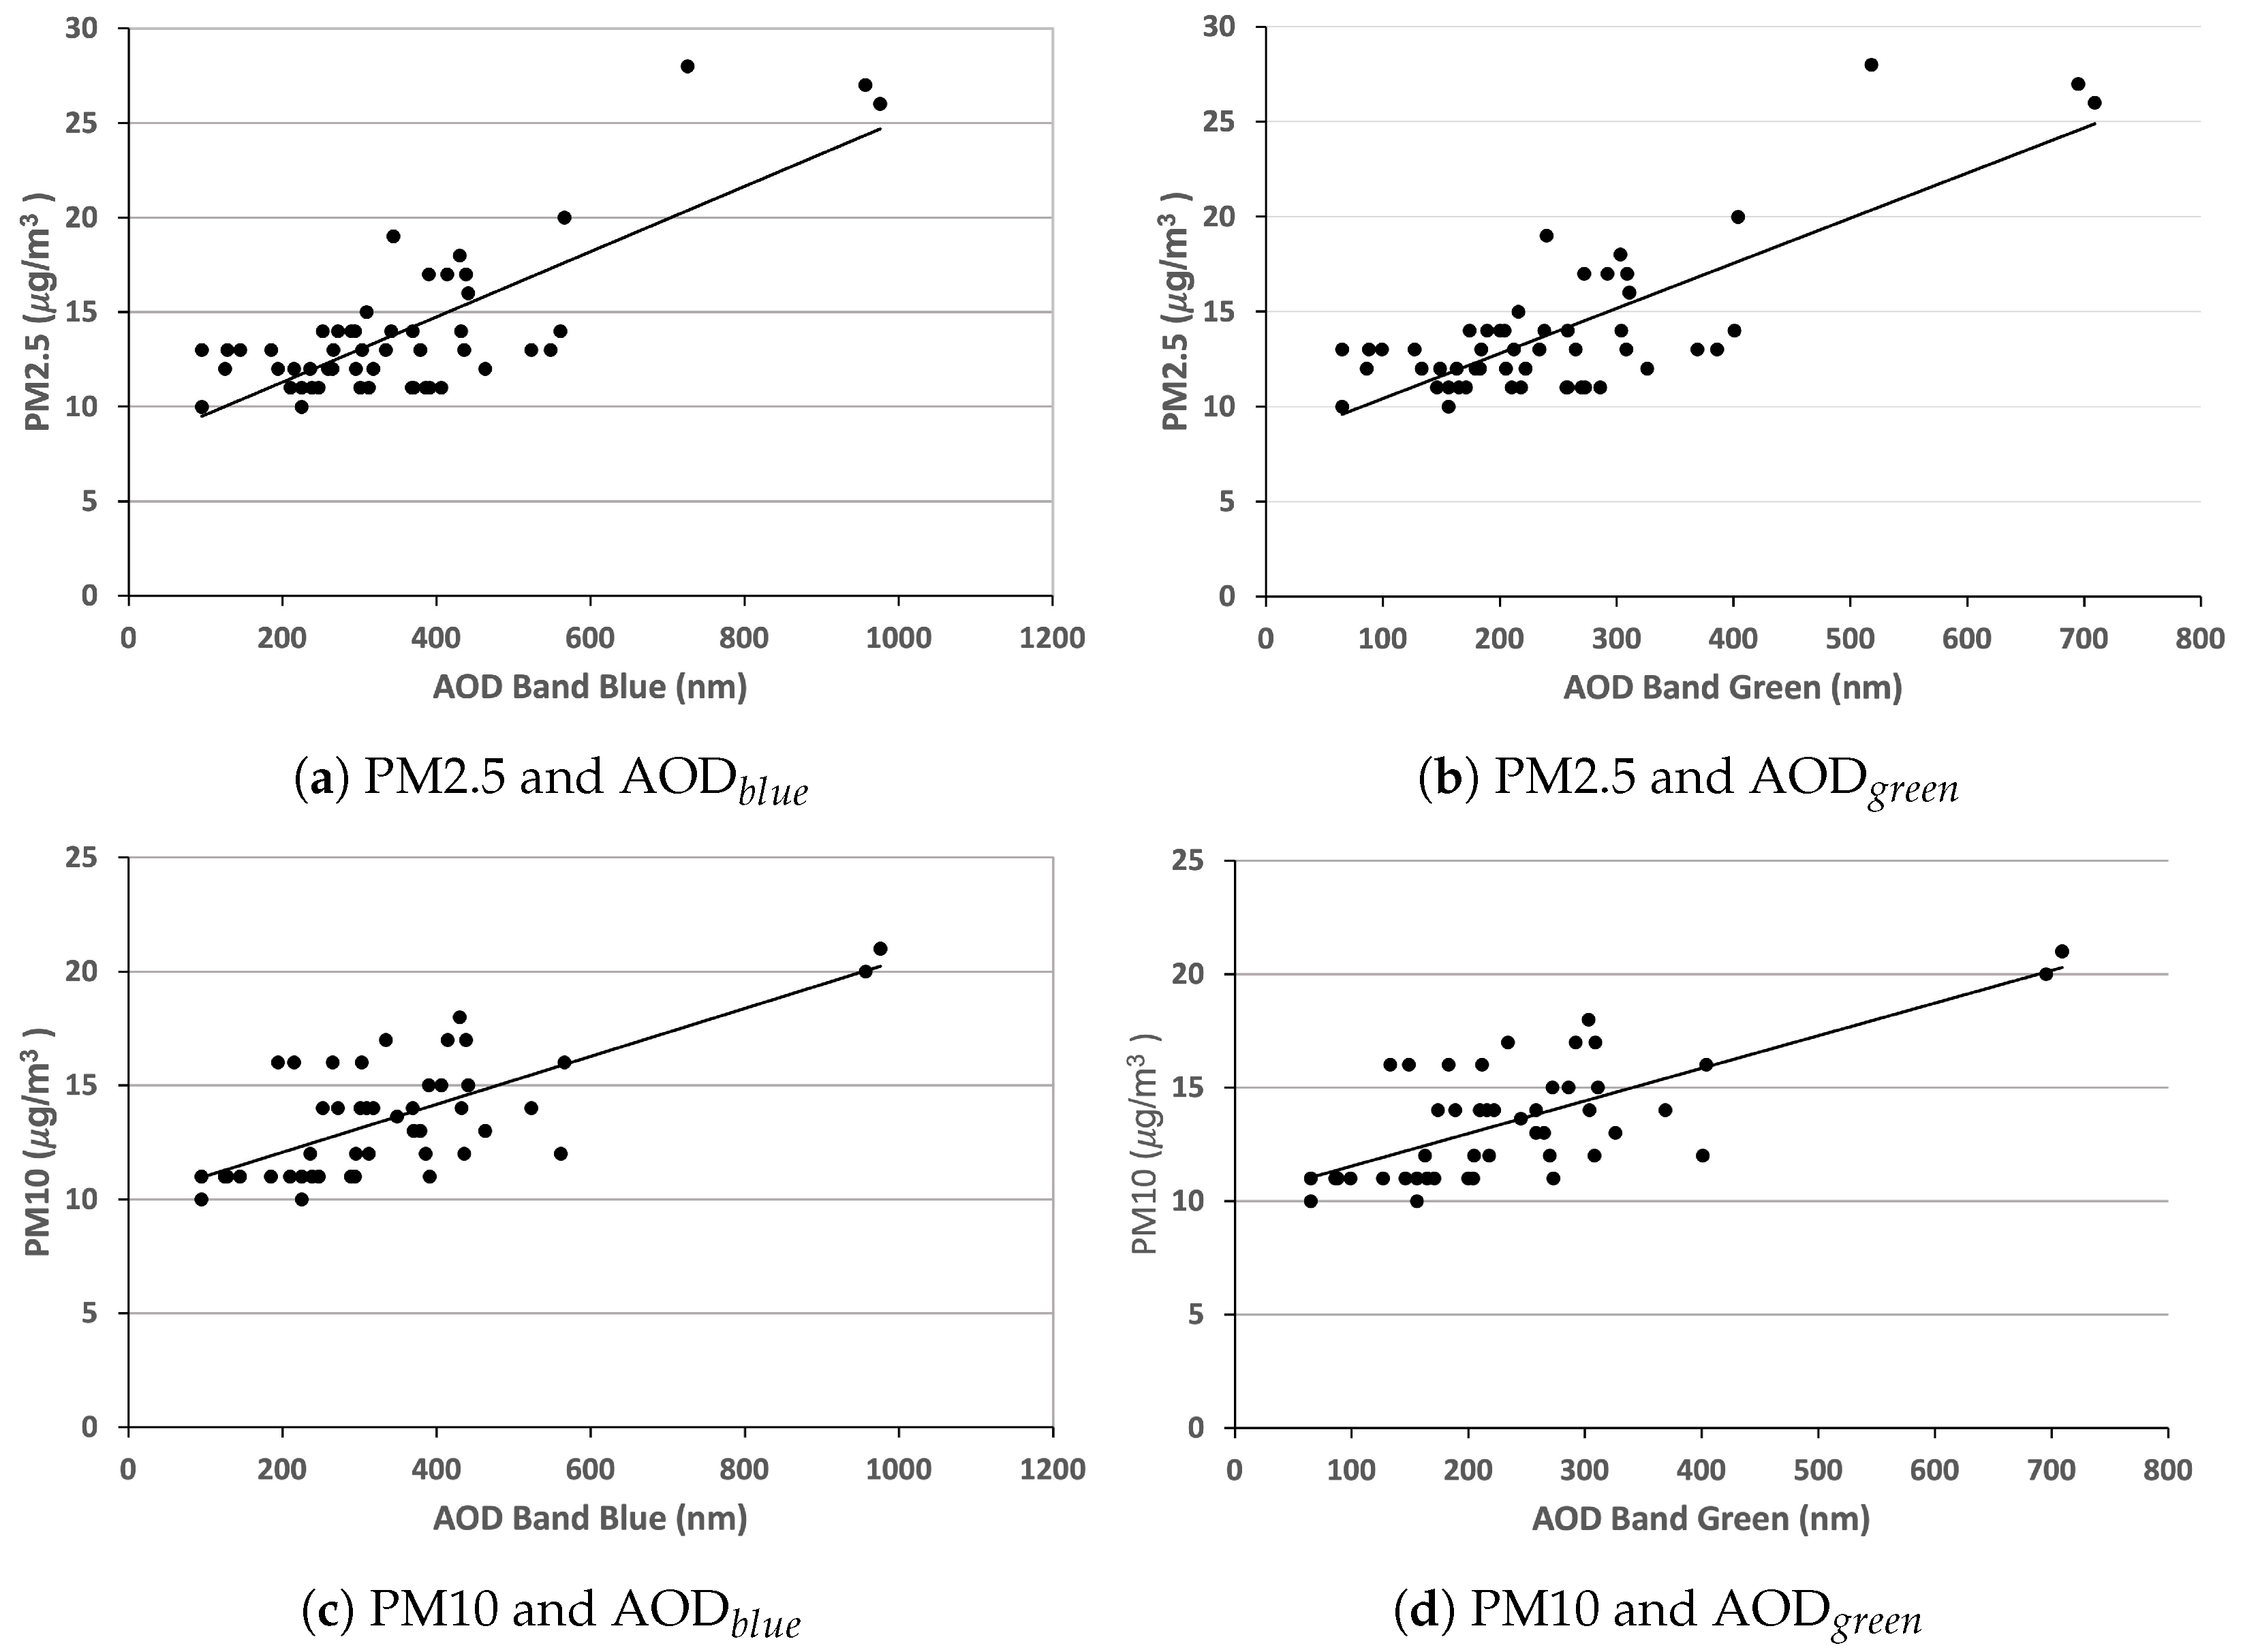
The potential of using AOD, extracted from satellite images, for estimating values of PM mass concentrations at the ground level is currently under investigation. This study examined the relationship between the values of PM mass concentration at the ground level and AOD
and AOD
values (MODIS blue and green bands) using the linear regression technique with multiple variables. The analysis period spanned from 1 May to 31 October 2022. However, it should be noted that the availability of the MODIS AOD product was limited to certain days within this timeframe. Furthermore, due to partial image coverage, some areas of the study region had no data pixels due to cloud cover or unfavorable weather conditions. To derive the daily average PM2.5 and PM10 mass concentrations for each ground station, measurements were taken from 10:00 to 11:00 a.m. The associating AOD values of MODIS blue and green bands were also extracted. Therefore, 57 observations were gathered as data for the model, depicted in
Figure 7 and described in
Table 2.
The dataset’s multivariable linear regression reveals a relatively low correlation between values of PM mass concentrations at ground level and AOD values of MODIS blue and green bands. Specifically, the PM2.5 regression model exhibits a correlation coefficient of 0.700 and a root mean square error (RMSE) of 4.474 µg/m
3, while the PM10 model demonstrates a correlation coefficient of 0.492 and an RMSE of 6.093 µg/m
3, likely due to the presence of certain anomalies. To address this issue, an analysis using the RANSAC algorithm has been conducted to eliminate these anomalies [
35]. Consequently, the dataset for the PM2.5 and PM10 regression models consists of 53 and 48 observations, respectively, as depicted in
Table 3. As a result, the multivariable linear regression models for ground-level PM measurements and MODIS AODblue and AODgreen values exhibit stronger correlations and are represented by Equations (
9) and (
10). The PM2.5 regression model displays a correlation coefficient of 0.806 and an RMSE of 4.110 µg/m
3, while the PM10 model exhibits a correlation coefficient of 0.676 and an RMSE of 5.741 µg/m
3.
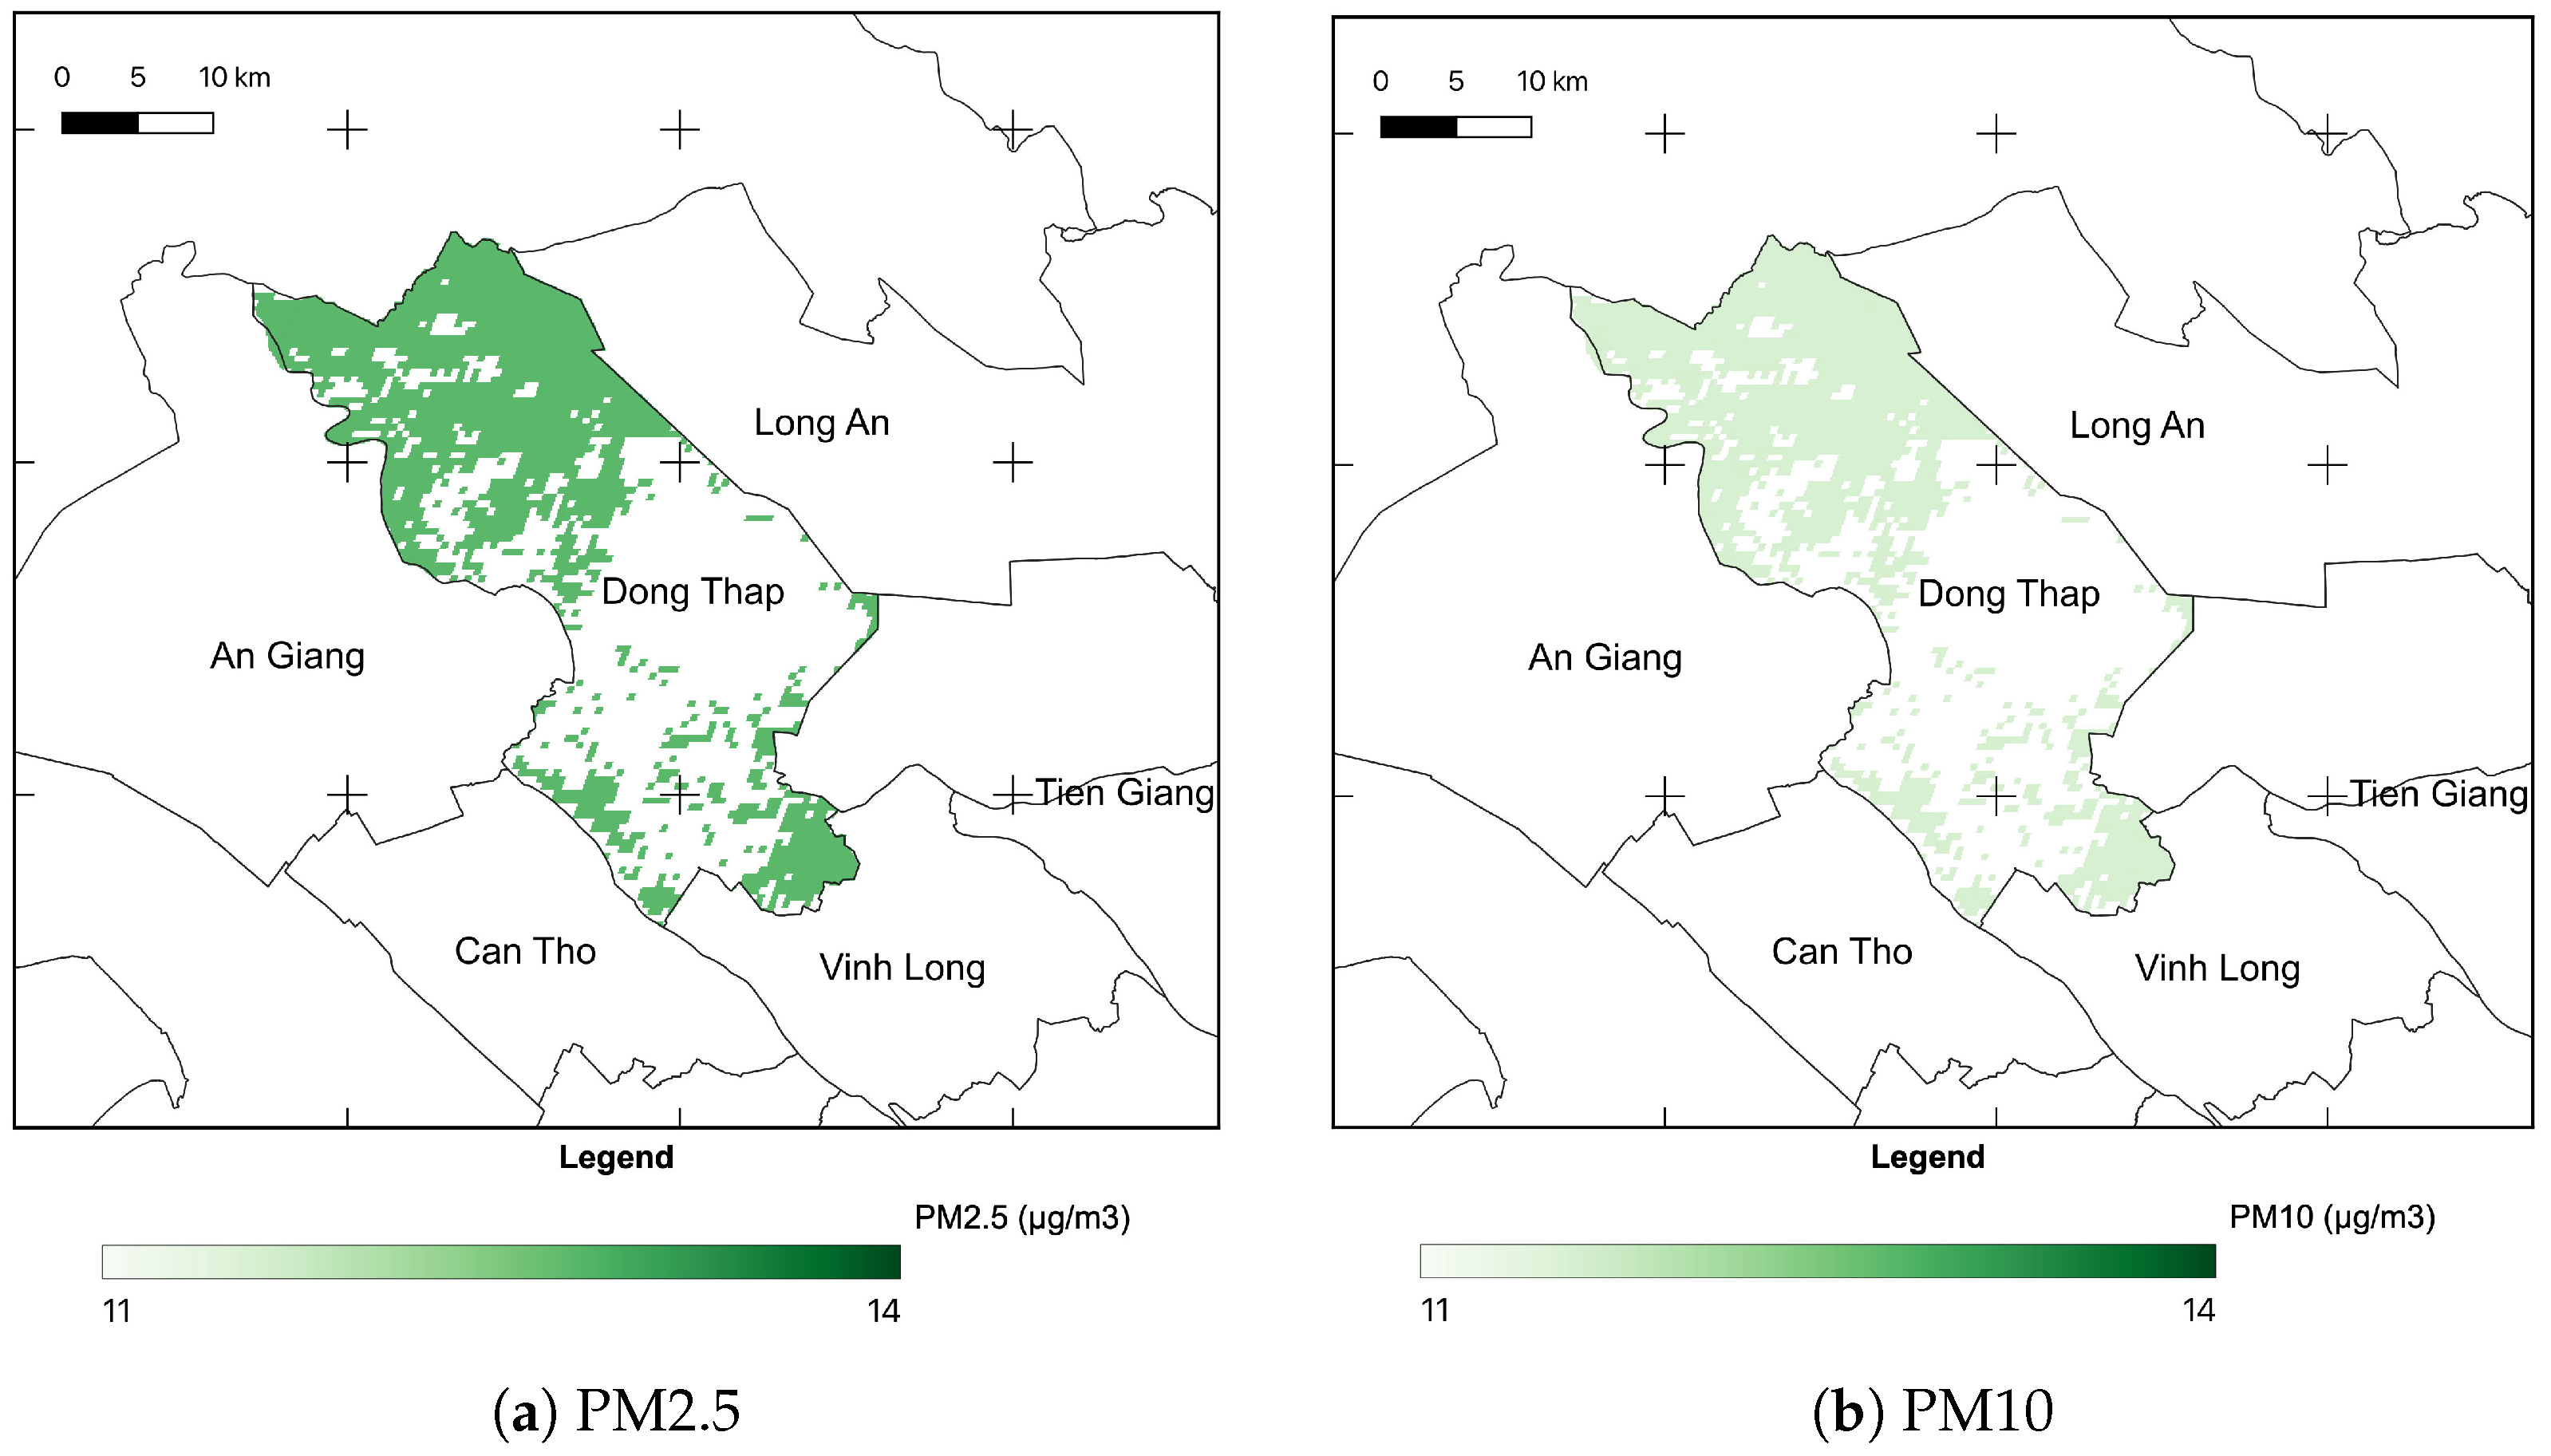
Based on the regression models, the PM2.5 and PM10 mass concentrations in the whole Dong Thap Province were estimated, as illustrated in
Figure 8.
5. Experiments
In this section, we present our experiments with the proposed computational models and compare the estimated results with telemetry data from ground IoT stations.
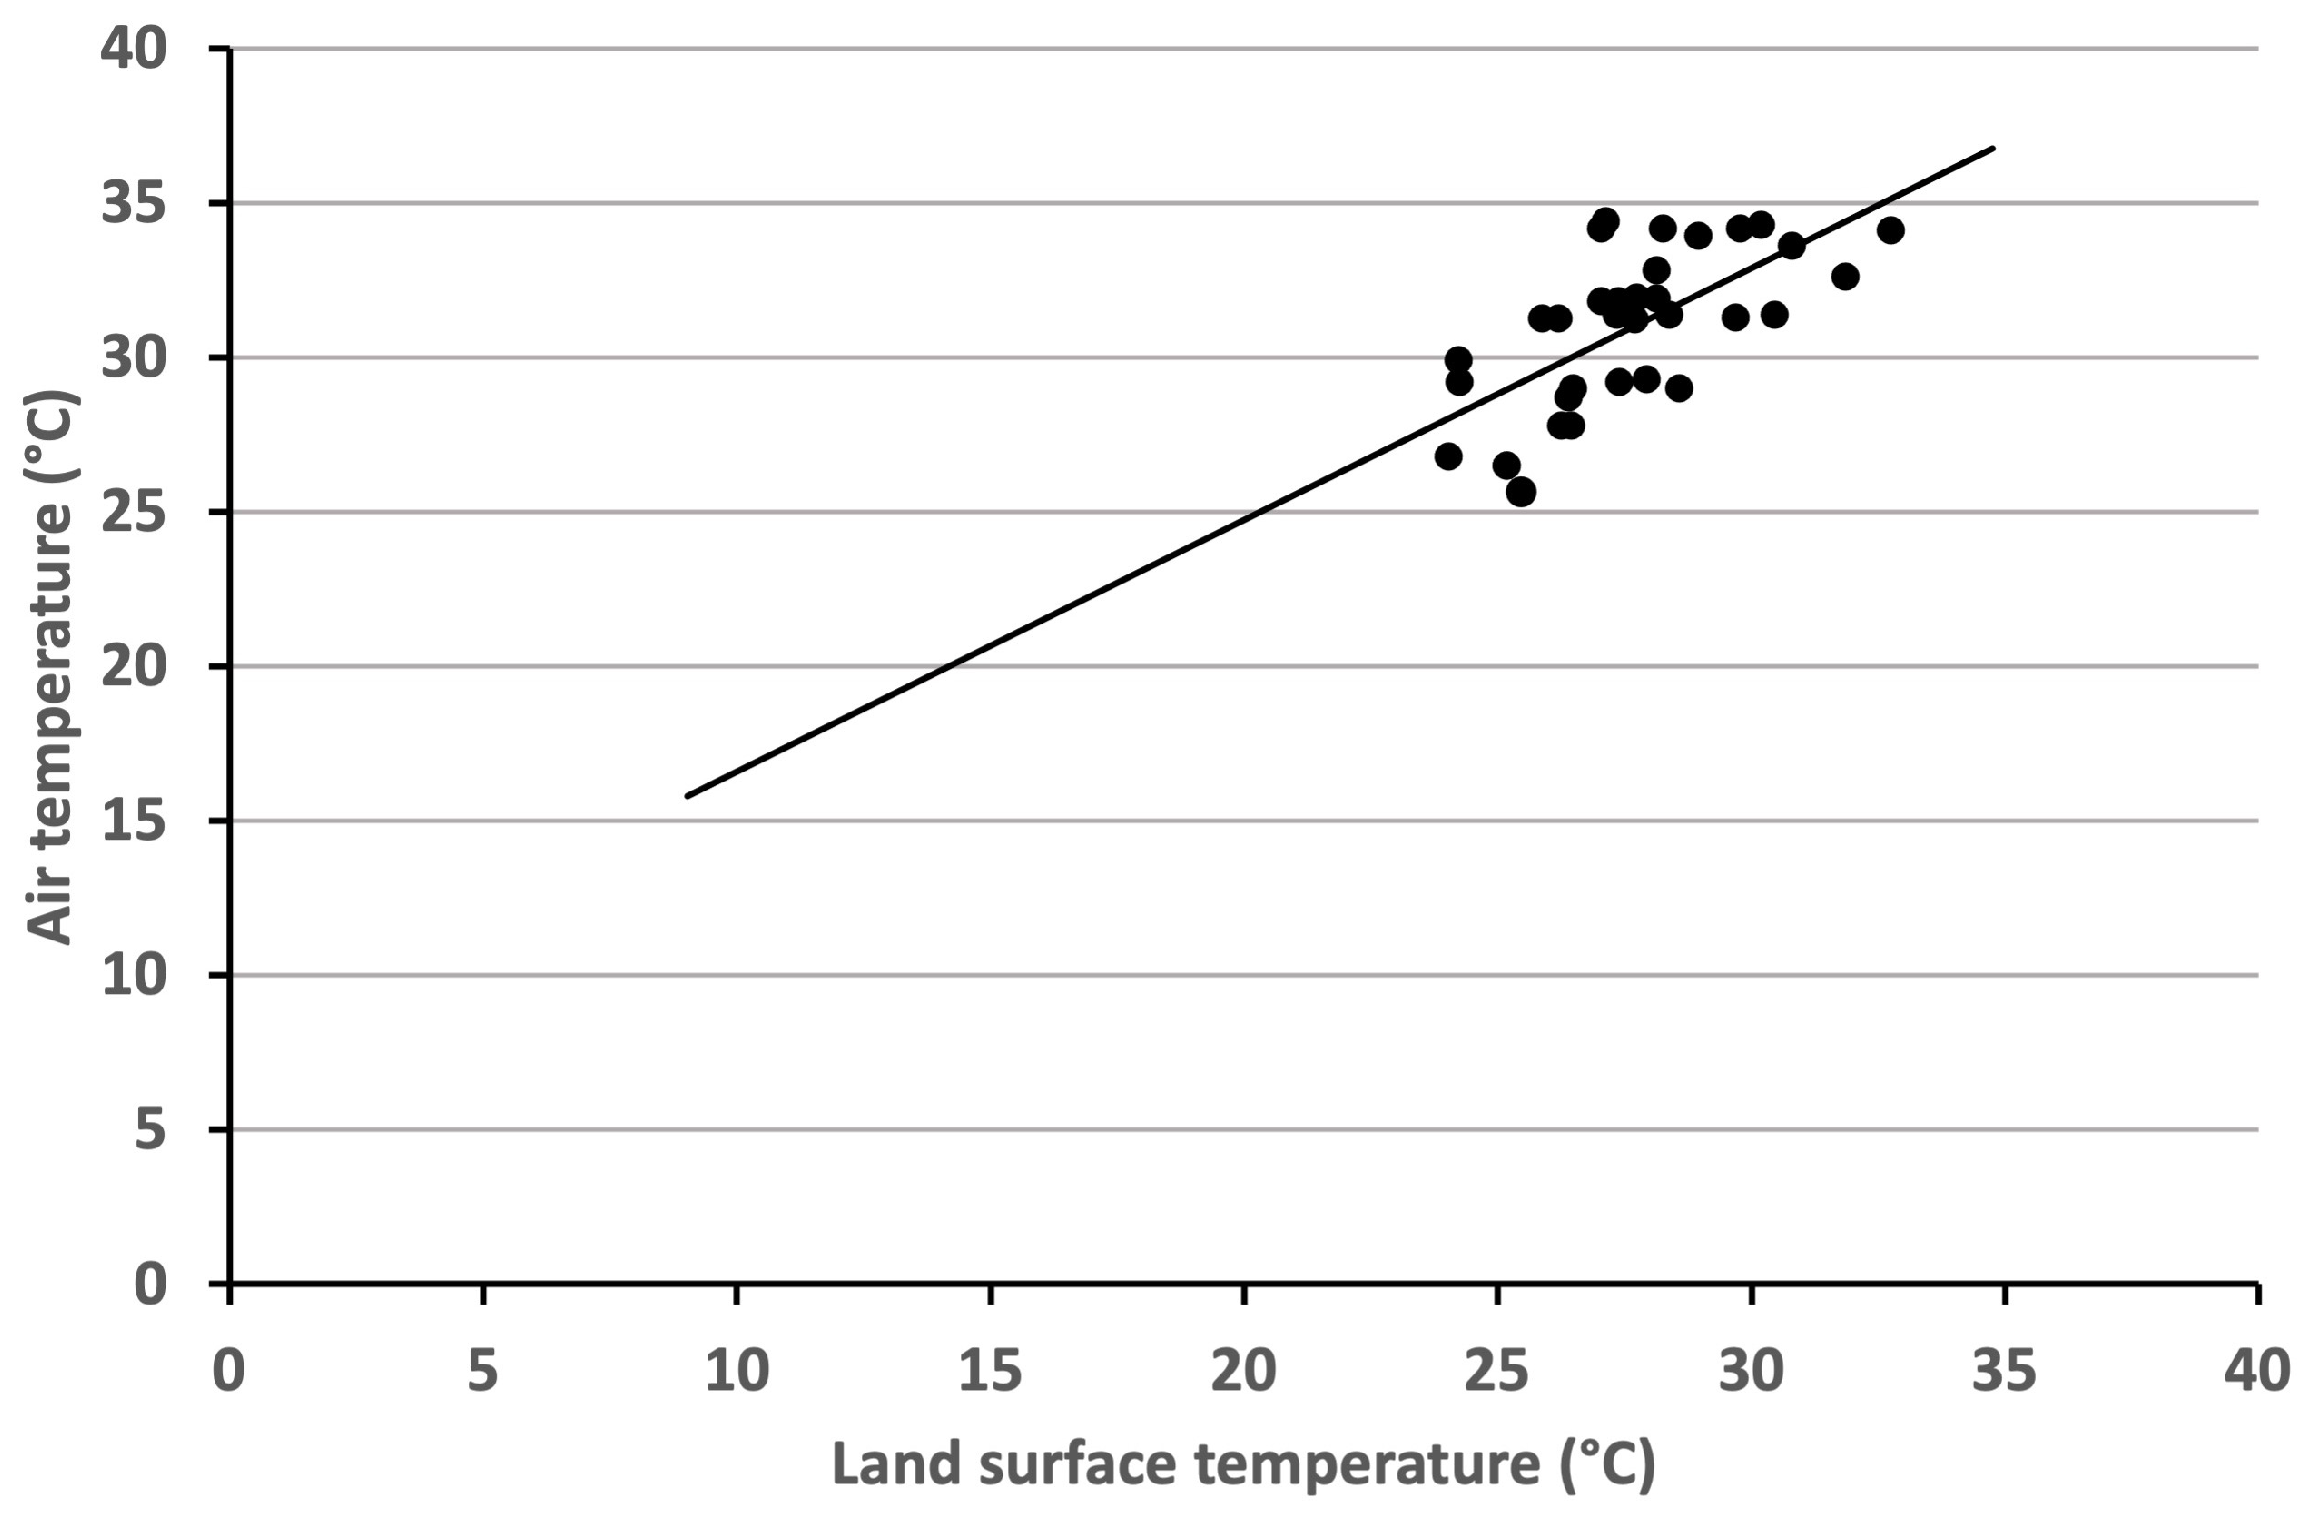
5.1. Correlation between LST and Air Temperature Values
The LST values were derived from the MOD11A1 products and the air temperature measurements from the ground stations from 1 May to 31 December 2021. Due to cloud coverage and bad weather conditions, the LST observations were limited in the study area during the observed period while the Tair observations were average from 10:00 to 11:00 a.m., corresponding to the MODIS Terra acquisition time. After filtering, these observations are described in
Table 4 and
Figure 9. The correlation between LST and T
observations is presented as Equation (
11), using the linear regression with the correlation coefficient of 0.816. Moreover, it also presents the coefficient of determination of 0.668 and the RMSE of 3.697 °C.
5.2. Validation of PM2.5 and PM10 Mass Concentration Models
The dataset for validation on the PM2.5 and PM10 models was collected from 1 November to 31 December 2022. However, due to bad weather conditions, the observations are limited as presented in
Table 5 and
Table 6. These values are substituted into Equations (
9) and (
10) to determine errors (differences) between the ground-level mass concentration measurements and their correspondingly estimated values of PM2.5 and PM10, respectively. As a result, RMSE values of the PM2.5 and PM10 models are 4.47 (µg/m
) and 6.09 (µg/m
), respectively. They are approximate to the two models’ RMSE values.
6. Conclusions
In recent years, environmental management has become an important issue, especially in regions that are rich in biodiversity and natural resources, such as the Mekong Delta. To effectively manage these areas, a smart environmental management system is needed to collect real-time data and provide monitoring and alerts to help protect the environment. This paper presents a smart environmental management system that automatically collects data from Internet of Things (IoT) stations and remote sensing images. The proposed system is designed to be deployed in large areas, such as the Mekong Delta, with low building and operating costs. The system uses telemetry data from IoT stations and remote sensing images to extract values of Land Surface Temperature (LST), PM10, and PM2.5 for areas without IoT stations. These two data sources are automatically collected and stored in a cloud storage service for smart data processing. After processing, the monitoring values, alert notifications, and real-time visualizations are displayed on both a website and a mobile application for managers to access. In the Dong Thap Province in the Mekong Delta, experimental results show that the estimated values from our system achieve Root Mean Square Error (RMSE) values of 3.679 °C for land surface temperature, 4.47 µg/m for PM2.5, and 6.09 µg/m for PM10. These errors are comparable to other models for other areas reported in the literature, demonstrating the effectiveness of our proposed system. In conclusion, our proposed smart environmental management system provides an effective solution for collecting and processing data from large areas, such as the Mekong Delta. Furthermore, the system utilizes IoT stations and remote sensing images to provide real-time monitoring and alerts, making it a valuable tool for environmental management in this region.


