Abstract
An increasing number of devices are connecting to the Internet via Wi-Fi networks, ranging from mobile phones to Internet of Things (IoT) devices. Moreover, Wi-Fi technology has undergone gradual development, with various standards and implementations. In a Wi-Fi network, a Wi-Fi client typically uses the Transmission Control Protocol (TCP) for its applications. Hence, it is essential to understand and quantify the TCP performance in such an environment. This work presents an emulator-based approach for investigating the TCP performance in Wi-Fi networks in a time- and cost-efficient manner. We introduce a new platform, which leverages the Mininet-WiFi emulator to construct various Wi-Fi networks for investigation while considering actual TCP implementations. The platform uniquely includes tools and scripts to assess TCP performance in the Wi-Fi networks quickly. First, to confirm the accuracy of our platform, we compare the emulated results to the results in a real Wi-Fi network, where the bufferbloat problem may occur. The two results are not only similar but also usable for finding the bufferbloat condition under different methods of TCP congestion control. Second, we conduct a similar evaluation in scenarios with the Wi-Fi link as a bottleneck and those with varying signal strengths. Third, we use the platform to compare the fairness performance of TCP congestion control algorithms in a Wi-Fi network with multiple clients. The results show the efficiency and convenience of our platform in recognizing TCP behaviors.
1. Introduction
In recent years, Wi-Fi networks have been increasing in popularity [1]. On the one hand, an increasing number of devices are using Wi-Fi to connect to the Internet. Everyday devices, such as mobile phones and laptops, as well as Internet of Things (IoT) devices, such as smartwatches and Raspberry Pi devices [2], have always been used with Wi-Fi implementations. On the other hand, ongoing research and development on Wi-Fi/IEEE 802.11 technology has led to the emergence of new Wi-Fi standards every few years, ranging from IEEE 802.11a/b/c/g/n to ad (WiGig), ax (Wi-Fi6), etc. Once a Wi-Fi standard has arrived, it offers improved performance compared to its predecessors, especially in terms of throughput. However, Wi-Fi technology focuses on the physical and medium access control (MAC) layers; hence, the performance gains are within the scope of an access point–client link. Consequently, Wi-Fi standards cannot completely reflect application behavior as doing so would require an end-to-end perspective, typically from a client to a server.
Many applications use the Transmission Control Protocol (TCP), an essential protocol in the TCP/Internet Protocol (IP) suite, for reliable end-to-end transmission in the transport layer in Wi-Fi networks. TCP relies on congestion control algorithms (CCAs) to adapt to changes in the network. Since there are many TCP CCAs available, it is necessary to understand and quantify their performance. Moreover, TCP has been found to incur several performance degradation problems in Wi-Fi networks, such as bufferbloat (i.e., an unexpectedly long delay when a buffer is fully occupied). A quick assessment of this issue can help support Wi-Fi deployment. In addition, when a Wi-Fi network has multiple clients, it is important to account for fairness among the clients’ flows since all of them share the bandwidth of the backhaul link. These factors lead to a demand for a time- and cost-effective platform to investigate the TCP performance in Wi-Fi networks.
The existing works that have addressed the problem of building an experimental platform for TCP evaluation in Wi-Fi networks can be classified into two categories: methods using real devices and methods relying on a simulator. Although the former can provide realistic and reliable results based on real hardware, they also have several disadvantages. Such a method may require many resources (e.g., network devices, access points, etc.) as well as considerable human effort for configuration and experimental operation. Note that human involvement increases the chance of unexpected errors. In contrast, a simulation does not require hardware resources, which significantly reduces the setup time. However, simulations cannot adequately consider the various characteristics of actual implementation, thus considerably impacting the reliability of the results. Moreover, most real TCP implementations are slightly different from those proposed in the literature, which are typically implemented in simulators. Hence, it is necessary to devise a better approach that can provide results as reliable as those of a physical experiment while offering the convenience of a simulation.
This paper presents an emulator-based approach for investigating TCP performance in Wi-Fi networks, aiming to inherit the advantages of both simulations and real networks. The paper’s earlier version is published in [3], which shows only the evaluations of CCAs with IEEE 802.11g Wi-Fi networks. The contributions of this study are summarized as follows.
- We newly introduce a platform that leverages the emulator Mininet-WiFi for rapidly emulating Wi-Fi networks (e.g., with different IEEE 802.11 standards, etc.) while guaranteeing TCP accuracy by using the actual implementations of TCP CCAs on Linux kernels. We have incorporated performance measurement functionalities and tools to automate the testing processes in our platform.
- We compare our platform’s performance for 14 TCP CCAs to the corresponding performance results in a real Wi-Fi network with similar settings. The evaluation results show a good match between the two types of results. Moreover, the platform guides us in identifying the algorithms that cause bufferbloat.
- We conduct CCA evaluations with different Wi-Fi settings: the Wi-Fi link as a bottleneck with two Wi-Fi standards (i.e., 802.11 n, g) and varying signal strengths. Moreover, we evaluate the CCAs in a Wi-Fi network with ten Wi-Fi clients and measure Jain’s fairness index. The results show that the Bottleneck Bandwidth and Round-trip propagation time (BBR) algorithm achieves the best RTT and throughput in an environment where bufferbloat occurs. However, TCP Reno achieves the best fairness performance in a Wi-Fi network with constantly changing flows.
2. Related Works
Due to the popularity of TCP, there has been much interest in evaluating TCP CCAs in different network environments. In [4], the authors considered four common CCAs (i.e., CUBIC, New Reno, BBR, and Data Center TCP (DCTCP)) on two cloud computing platforms (i.e., Amazon’s AWS and Google’s GCP). They then conducted experiments and found an appropriate CCA for each application. In [5], T. Lukaseder et al. evaluated six loss-based CCAs in a physical 10 Gbps network emulating a wide area network. They found that the Binary Increase Congestion Control (BIC) and CUBIC CCAs are more suitable in high-speed environments. A significant amount of work has also been performed focusing on TCP CCA performance in wireless networks. The work in [6] evaluated Tahoe, Reno, selective acknowledgment (SACK), and Vegas in Long-Term Evolution (LTE) networks to find the best algorithm. In [7,8], the authors discussed the design and evaluation of TCP in fifth-generation (5G) networks considering millimeter-wave wireless technology and 5G key performance indicator (KPI) requirements. In [9], the authors compared three CCAs in various scenarios on the ns-2 simulator and identified the most appropriate algorithm for each scenario. They found that Westwood+ markedly improves the performance of wireless links affected by losses. The present work focuses on TCP CCAs that are currently becoming more popular for use in Wi-Fi networks. In [10], the authors proposed a proximal policy optimization-based intelligent TCP congestion management method and showed that it reduces the delay compared to CUBIC on an emulator. However, the emulated network is an Ethernet network.
There have been many investigations in the literature of TCP congestion control performance in Wi-Fi networks operating under different IEEE 802.11 standards. In [11], a Wi-Fi network with IEEE 802.11e was analyzed on a testbed with TCP traffic flows. In [12], a Wi-Fi network with IEEE 802.11n was considered for a constructed scenario of accessing the Internet. The authors experimented with six CCAs. After measuring the RTT and throughput for file transfers, they concluded that Yet Another High-speed TCP (YeAH) was the best CCA. In [13], a Wi-Fi network with IEEE 802.11n and IEEE 802.11ac was built to evaluate and compare 13 TCP CCAs. The authors found that IEEE 802.11ac outperformed IEEE 802.11n. In addition, BIC and CUBIC were better than the other CCAs in a single-hop scenario but comparable in a multihop one. The work in [14] also evaluated CUBIC and BBR in a real Wi-Fi network with 802.11n and 802.11ac. The authors then proposed an improved variant of BBR, named BBR+, in which the pacing function of BBR is better controlled. The work in [15] evaluated the performance of TCP CCAs on an IEEE 802.11ad link and revealed the excellent performance of BBR under multi-gigabit conditions. In [16,17], there are efforts to evaluate TCP performance with IEEE 802.11ax; however, they have just considered the default TCP CUBIC or TCP Reno. There has not been an extensive evaluation of TCP CCAs in the IEEE 802.11ax network. In [18], they built a real 60 GHz mmWave network testbed and measured and analyzed the performance of TCP CCAs. They concluded that for Westwood, CUBIC, and NewReno, there were problems with the accuracy of channel bandwidth estimation, and for BBR, there were fairness problems. In [3], the authors evaluated 14 TCP CCAs in an emulated Wi-Fi network and compared RTT and throughput, showing that BBR performs best. Since there is no clear winner in all scenarios, the ability to evaluate CCAs to assess their capabilities in Wi-Fi networks with varying settings is necessary.
Another TCP issue in Wi-Fi that attracts many researchers is bufferbloat. Accordingly, there are several solutions to the issue. In [19], the authors considered the so-called Active Queue Management (AQM), which schedules the packets at a queued link following a predetermined algorithm. To observe the bufferbloat, they emulated the Wi-Fi network’s settings and evaluated seven Active Queue Management (AQM) with single TCP and multiple TCP flows. However, the authors still used several machines to emulate the Wi-Fi network. Hence, it is nontrivial when we change Wi-Fi settings for new experiments. The work in [20] showed that MAC layer frame aggregation reduces delay and improves throughput in a Wi-Fi network. Another solution is using an algorithm called TCP Small Queues (TSQ) and TCP pacing [21]. Those mentioned works have been conducted on real Wi-Fi networks. Therefore, they incur a similar issue of changing the Wi-Fi setting mentioned above.
In general, there are three classes of methods for CCA performance evaluation: using a simulator, setting up a real network, or using an emulator. Simulators have been widely used to characterize the behaviors of TCP CCAs following theoretical models [22]. For example, for CUBIC alone, there are several proposed models relying on different theories to evaluate its performance [23,24,25]. Real Wi-Fi networks have also shown their effectiveness in understanding the performance of TCP CCAs, as in [11,12,13,15,20,21]. In [26], the authors discussed the advantages and disadvantages of real networks and simulators. The former are more reliable, but they have the problems of high cost and low maintainability and flexibility. The latter are less costly, more maintainable, and flexible. However, a simulator does not involve actual communication but instead relies on formal mathematical models. The authors then introduced the network emulator Mininet-WiFi to balance the advantages of simulations and real networks [27]. Emulators typically simplify complex experimental setups while maintaining reliable accuracy. A detailed comparison of Mininet-WiFi with other emulators, simulators, and testbeds is presented in [26]. Many diverse experiments have been conducted to illustrate the effectiveness of Mininet-WiFi. Mininet-WiFi has been used in previous works because it simultaneously provides convenience and accuracy [28,29]. However, this emulator has not been used to thoroughly consider the performance of TCP CCAs, especially in Wi-Fi networks. In [30], the authors used the simulator ns-3 and its Direct Code Execution (DCE) module to emulate heterogeneous environments. They then compared CUBIC, New Reno, and BBR with a focus on fairness. They showed that BBR might not be the best choice for the public Internet with heterogeneous settings. In [31], the authors used the emulator Mininet to evaluate and compare the performance of two BBR versions; however, this evaluation was performed considering wired networks. The authors could also find the limitations of the better version by using the emulator.
In the present research, we also take an emulator-based approach to conduct a comprehensive investigation of CCAs in a Wi-Fi environment. We aim to provide a platform and tools for evaluating CCAs. An earlier version of this work has appeared in [3], where we investigated only the CCA performance in the emulator. This work extends the previous platform by adding a new evaluation scenario with a fairness index. Moreover, we compare the emulated CCA performance to that in a real network. We summarize and compare closely related works in Table 1. The table clearly shows the merits of our work compared to the others. Within the platform proposed in this study, we can change the Wi-Fi standard and topology with a few modifications in the script, reducing the time required for the experiment. The platform can support the measurement of more metrics than the previous studies (three vs. one or two metrics). Although the emulated devices are not entirely similar to actual devices, the proposed platform (considering the devices and CCAs) can provide a sufficient level of accuracy comparing the actual network’s experiment. The platform can well capture the behaviors of Wi-Fi networks and CCAs.

Table 1.
Comparison of previous CCA evaluation and ours (*: Ethernet).
3. Emulator-Based Approach for Investigating TCP Performance in a Wi-Fi Network
This section first introduces the emulated environment for TCP evaluation in Wi-Fi networks and then presents the CCAs considered in our work.
3.1. Emulator Environment
We wish to combine the merits of a simulator for establishing Wi-Fi networks and the actual implementation of TCP CCAs. We hence select the emulator approach. Our emulator environment leverages the Mininet-WiFi simulator [32], which is a fork of the emulator Mininet, initially invented for research on software-defined networking. Mininet-WiFi extends Mininet by adding virtualized Wi-Fi stations and access points. Compared to other tools such as dummynet or other somewhat real networks, it simplifies network configuration and reduces network construction time. Mininet-WiFi is not only cost effective but also has been proven to reproduce networks with higher overall fidelity than simulations [26]. Because it is natively built on Linux, the emulator environment can use standard Linux utilities. Another essential utility for emulating and controlling the parameters of a wireless channel is Traffic Control (Tc), which can configure the Linux kernel’s packet scheduler to control the packet rate, delay, latency, and loss. Tc applies these attributes to the virtual interfaces of the STAs and APs, allowing Mininet-WiFi to faithfully represent the actual packet behavior observed in the real world.
We use Mininet-WiFi’s APIs to quickly build Wi-Fi networks with different designated IEEE 802.11 versions and numbers of devices in our emulator environment. Since Mininet-WiFi does not provide essential functions such as changing CCAs or measuring networking performance, we have created automatically executed scripts that add these functions. The environment is programmed to cooperate well with a Linux host’s CCA. It configures or changes CCAs from the kernel based on the sysctl utility wrapped in a Python script. The entire process from topology creation to communication performance measurement can be automated. Once a few parameters have been set (the time to measure, the chosen CCA, etc.), RTT, throughput, and fairness can be measured automatically. Detailed descriptions of the performance metrics used in this work are as follows.
- Round-trip time (RTT): The RTT represents the time that a sent packet needs to wait for a response from the destination. In this work, RTT values are collected from a pair of Internet Control Message Protocol (ICMP) packets generated by ping.
- Throughput: The TCP throughput is the rate of transferred traffic per time unit. In our environment, we consider the throughput values reported by iperf [33].
- Fairness index: We use Jain’s fairness index , which is defined as follows:where denotes the throughput for the ith connection. The value ranges from (worst case) to 1 (best case).
In addition, the scripts that we have created can be flexibly configured, for example, to replace iperf with iperf3 or to add a new active queue management mechanism in a specified device.
We summarize the execution process of CCA evaluation within our platform in Figure 1. A user can select the evaluated CCAs from the host system. After that, the user can create a Wi-Fi network with the designated networking parameters. Depending on the network and evaluation scenario, the expected results will vary. The single flow evaluation will output throughput and RTT for each CCA. In addition to those outputs, the fairness index is also produced with the multiple flows evaluations. All the steps are wrapped in scripts for automation. We can stop at a specific step for confirmation or debugging. For example, Figure 2a shows a screenshot with the selection of CCA named reno and the creation of a Wi-Fi network. We can check the propagation model, wireless nodes’ configuration, and links between different network components. In Figure 2b, the screenshot shows the method to confirm the link connection in the Wi-Fi network with Mininet-WiFi. The scripts keep running until the end of each experiment when the connections are all correct. The results can be processed to make graphs for quick assessment. Table 2 lists the tools and scripts which are used to measure and report the results.

Figure 1.
Execution process flow.
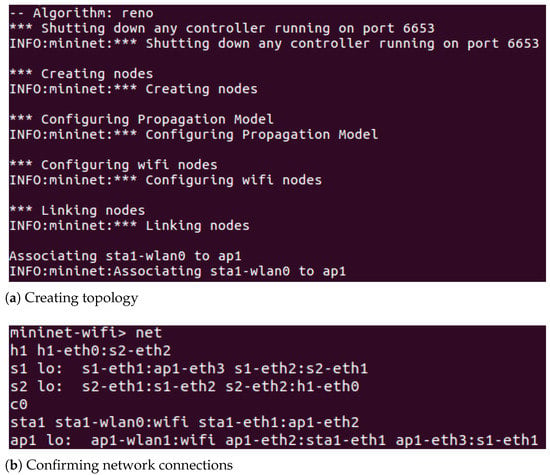
Figure 2.
Screenshots of a script execution and a confirming method.

Table 2.
Utility list.
3.2. Congestion Control Algorithms
A TCP sender uses a CCA to detect congestion and control the rate at which packets are sent in a network. The sending rate is adjusted following the congestion control window (i.e., cwnd). If there are overprovisioned packets, cwnd is reduced to suppress the traffic. TCP can reduce the number of lost packets and effectively utilize the available bandwidth. TCP CCAs can be roughly classified into three types: loss-based, delay-based, and hybrid algorithms. Algorithms of the first type, which detect congestion based on packet loss, reduce cwnd when packet loss occurs. Delay-based algorithms recognize congestion occurrence based on a delay-related parameter (i.e., the RTT). Hybrid algorithms identify congestion using both RTT and packet loss. Since the adjustment of cwnd differs for different CCAs, the algorithm with the best performance may change if the network changes. This work investigates 14 algorithms, including six loss-based CCAs, three delay-based CCAs, and five hybrid CCAs.
3.2.1. Loss-Based Algorithms
Binary Increase Congestion Control (BIC) [34] uses additive increase and binary search to increase the congestion window size.
CUBIC [35] is an improved version of BIC. CUBIC is now the default CCA on Linux kernels.
Hamilton-TCP(H-TCP) [36] was designed for high-speed, high-latency networks. It changes the rate of increase of the congestion window during a period after congestion occurs.
Highspeed [37] adjusts the congestion window size following predefined low and high speeds.
Hybla [38], a modified version of Reno, was developed for heterogeneous environments.
Reno [39] operates following the Additive Increase Multiplicative Decrease (AIMD) algorithm.
Scalable [40] is characterized by the fact that recovery from congestion is independent of the size of the congestion window.
3.2.2. Delay-Based Algorithms
Bottleneck Bandwidth and Round-trip propagation time (BBR) [41] is not a purely delay-based algorithm. However, we still classify BRR in this category. BBR adjusts the congestion window following two indicators: the bottleneck bandwidth (BtlBw) and the round-trip propagation time (RTprop).
New Vegas (NV) [42] was designed to improve the performance of Vegas as the RTT increases.
Vegas [43] detects congestion following an increase in RTT. It relies on accurate calculation of the base RTT value.
3.2.3. Hybrid Algorithms
Centre for Advanced Internet Architectures (CAIA) Delay-Gradient (CDG) [44] uses the delay gradient calculated from the minimum and maximum RTTs as a congestion signal. CDG switches to loss-based operation when it detects that its delay-based mode has no measurable effect.
Illinois [45] determines whether to increase or decrease the congestion window following a loss-based method. Moreover, it uses a queuing delay to adjust the size change rate.
Westwood [46] depends on an estimate of the end-to-end bandwidth to control the transmission rate following returning acknowledgment packets (ACKs).
Yet Another High-speed TCP (YeAH) [47] is characterized by two operation modes (slow and fast). YeAH relies on an estimate of the bottleneck queue size.
4. Evaluation
4.1. Environmental Settings
The first evaluation aims to demonstrate the effectiveness of the emulator approach by comparing the emulated TCP performance results with those from an actual Wi-Fi network. We have evaluated two scenarios: one Wi-Fi client and two Wi-Fi clients. In the former scenario, a Wi-Fi client communicates with an application server via an AP and its backhaul link in both networks. In the actual network, we use a laptop running Ubuntu with Linux kernel 4.19.97 as the Wi-Fi client. Moreover, we use two Raspberry Pi 4 devices as a server and an AP. The two Raspberry Pi devices run the Raspbian Buster OS (Debian version 10). Additionally, we use hostapd (version v2.8-devel) to implement the Wi-Fi AP, operating with IEEE 802.11g. The Raspberry Pi’s Wi-Fi module is BCM4345/6 with the brcmfmac 7.45.154 driver. To set the bandwidth and delay values of the backhaul link, we use tc and netem, respectively. However, we do not use netem to measure the RTT between the client and server; instead, we use ping. The results show that the average RTT value in the actual network is 1.3 ms.
In the emulator environment, we use the same kernel as the Wi-Fi client’s machine on the host computer. In Mininet-WiFi, we have created five nodes, which are the Wi-Fi client, an AP, two switches, and a server, as shown in Figure 3. The first hop from the client is a Wi-Fi access point using IEEE 802.11g. Then, there are two additional switches (S1 and S2), which are Open vSwitches (OVSs), to emulate the backhaul link. An OVS controller is used in the emulator to find routes between devices. However, this occurs only once at the beginning of each experiment and does not affect the network. It is hence omitted. In the comparative environment, we set the bandwidth of the backhaul link to 10 Mbps and the delay to 0.65 ms (to match the value in the actual network). The wired links other than the backhaul have a bandwidth of 1000 Mbps in the emulator environment. Moreover, we investigate queue sizes of 20 and 100 packets (i.e., S1’s queue in the emulator and the AP’s output queue in the actual network). This queue size setting is based on [48]. In the latter scenario, we have added one more Wi-Fi client to the topology in Figure 3. We have added a similar laptop, one Mininet-WiFi’s Wi-Fi client, for the actual and emulated environment, respectively.
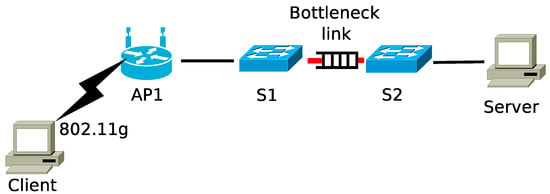
Figure 3.
Wi-Fi network topology.
In the second evaluation, we investigate CCAs with different Wi-Fi network settings, including the Wi-Fi link as the bottleneck and different signal strengths. The third evaluation considers and compares the fairness of multiple TCP flows with each CCA in Wi-Fi networks. The network configuration parameters used in each performance evaluation are summarized in Table 3.

Table 3.
Network settings in each evaluation.
4.2. Comparison to the Actual Network and CCAs
Figure 4 and Figure 5 show the throughput and RTT results in the actual Wi-Fi network and the Mininet-WiFi emulator in the one-client scenario. In these figures, we present bar plots of the average values, with each CCA on the x-axis. Moreover, the error bars show the maximum and minimum on the y-axis. First, we compare the throughputs in Figure 4a,b, which show the values in the emulated and actual networks, respectively. The throughput values of all 14 CCAs in the two networks are similar with the two queue size settings. This means that the 10 Mbps bottleneck bandwidth is fully occupied in all cases. Second, we compare the RTT values in the two networks, as shown in Figure 5a,b. In the case of the 20-packet queue, most of the RTT values with the same CCA are comparable. However, in the 100-packet queue case, there are several exceeded values. To compare the values collected in the two environments, we use a qualitative metric that is the ratio of the emulated value and the actual one. We have calculated the ratio values for average throughput (Tx) and RTT with two queue sizes and shown them in Table 4. Regarding the throughput, most of the Tx ratio values are close to 1. Moreover, a similar observation can be seen with the RTT ratios, with few exceptions, due to the bufferbloat, as presented below. In the two-client scenario, we kept all the simulation settings similar to the previous scenario. Moreover, we let the two clients simultaneously start our scripts at the same time. It is trivial to keep the simultaneity in the emulated environment. However, we may not have the same level of perfectness in the actual network due to the possibility of human operation. The comparative results for throughput and RTT are shown in Figure 6 and Figure 7, respectively. Regarding the throughput comparison, we calculate the total throughput achieved by two clients in the different CCAs and conditions of queue sizes. Figure 6a shows that in the emulated environment, similar to the one-client scenario, the two clients can occupy all the bandwidth limited by the bottleneck link. Moreover, all CCAs achieve similar and stable values of total throughput. On the other hand, Figure 6b shows a slight difference between the reported throughput values. That may cause by uncontrolled factors in the actual environment, such as neighboring interference or human errors. However, we can see that the throughput performance values in the two networks are comparable. Regarding the RTT values, we use the cumulative distribution function (CDF) of the ratio between the emulator’s RTT and the actual one, as in Figure 7. Each ratio value is calculated between two experiments with the same settings in two environments. Although RTT varies and sometimes reaches unexpected values (i.e., in the bufferbloat condition), we still see that a large portion of the ratio values is close to one in both queue conditions. Therefore, we can conclude that, overall, the emulator’s results are close to those in the actual network.
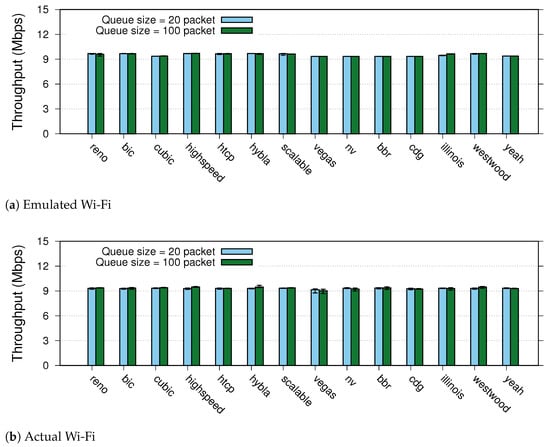
Figure 4.
Throughput comparison.

Figure 5.
RTT comparison.

Table 4.
Qualitative evaluation results.
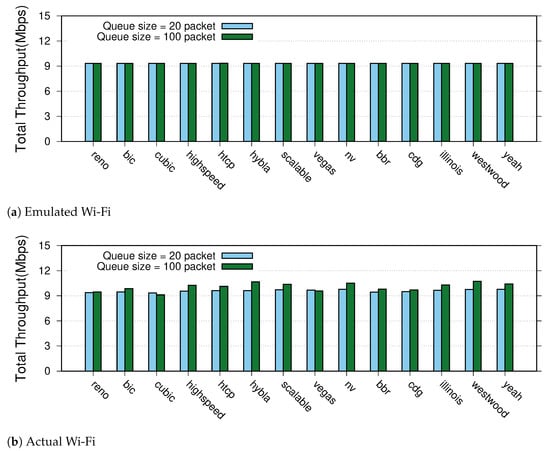
Figure 6.
Throughput comparison in two-client scenario.
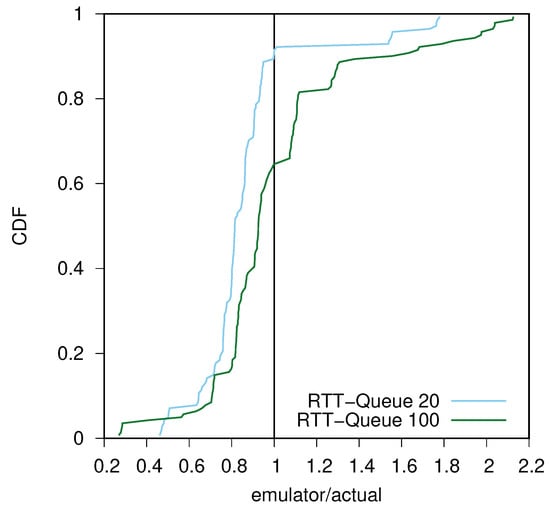
Figure 7.
CDF of the RTT ratio in two-client scenario.
In addition to the above conclusion, we can also determine whether bufferbloat occurs as the queue size is varied. Since the bottleneck bandwidth is completely occupied, latency variation may be a sign of bufferbloat. Figure 5a illustrates that for almost all CCAs, the RTT increases as the queue size increases from 20 to 100 packets, with the exceptions of Vegas, NV, BBR, and CDG. For those CCAs with large RTTs, we can consider them to be caused by bufferbloat. Because the results in the two networks are similar, it is possible to determine whether bufferbloat has occurred more quickly with the emulator. Moreover, we can compare the throughput and RTT values under different CCAs using the experimental results from our emulation platform. As mentioned, regardless of which CCA is used, the throughput values are similar. This is because there is no loss in this scenario; the CCA’s only responsibility is to adjust the sending rate in accordance with the capacity of the bottleneck. In the 60-s experiment, all CCAs can fill the bottleneck link (i.e., a bandwidth of 10 Mbps). The RTT results in Figure 5a are arranged by CCA type from the left as follows. For the loss-based CCAs (Reno, BIC, Highspeed, H-TCP, Hybla, and Scalable), the RTT increases as the queue size increases. When the queue size is 20, the RTT is approximately 20 ms, but when the queue size is 100, the value is greater by approximately four times or more. The most significant RTT increase is seen for Scalable, with an average RTT of 117 ms for a queue size of 100. The reason is that the loss-based algorithms use the packet loss as the index of congestion, so congestion is not judged to have occurred when the RTT increases. Therefore, although the amount of data should be suppressed, it is not controlled, and the network performance deteriorates. Among the delay-based and hybrid CCAs, some algorithms show a significant increase in RTT, while others do not. The delay-based NV algorithm and the hybrid Illinois, Westwood, and YeAH algorithms all suffer increases in the RTT with an increased queue size, similar to the loss-based algorithms. On the other hand, the RTT increases are slight for Vegas, BBR, and CDG compared to the other algorithms. In particular, Vegas and BBR show little change in RTT as the queue size increases: there is no change in Vegas from 4 ms or in BBR from 15 ms. Based on these observations, it can be said that Vegas and BBR are algorithms that keep the RTT at a constant value.
4.3. CCA Evaluation with Different Wi-Fi Settings
In this section, we use our platform to evaluate CCAs with different Wi-Fi settings. We want to see how CCAs behave when the Wi-Fi link becomes the bottleneck for client–server communication. Hence, we set the bandwidth link between S1 and S2 (as in Figure 3) to 1000 Mbps. Moreover, the queue size on S1 is configured at 100 packets. In the first experiment, we changed the Wi-Fi standard used in the evaluation to IEEE 802.11n and IEEE 802.11ax. In the second experiment, we compare the CCA performance in the Wi-Fi network using IEEE 802.11g with varying signal strength (i.e., the value of RSSI between client-AP are −45 dBm and −70 dBm).
The evaluation results in the first experiment with IEEE 802.11n are shown in Figure 8, in which Figure 8a and Figure 8b present the throughput, RTT values, respectively. Unlike the previous results, we can see that the throughput values with all CCAs reach around 48 Mbps. That is because the Wi-Fi link becomes the bottleneck and operates with IEEE 802.11n. Regarding the RTT values, there are no extremely high values; hence, the bufferbloat event did not happen in this setting. Among all CCAs, Westwood has the lowest RTT, and scalable has the second lowest one. We have a similar conclusion about Westwood’s RTT, when observing the evaluation results with IEEE 802.11ax shown in Figure 9b. However, the throughput of Westwood is the lowest among all CCAs’. Note that we configured the 5 GHz band in our IEEE 802.11ax evaluation. From Figure 9a, except for Reno and Westwood, all other CCAs can reach the total capacity of the 802.11ax wireless link (i.e., the S1–S2 link bandwidth is 1 Gbps). Among them, BBR achieves the lowest RTT performance. We can conclude from the two sets of evaluation results that our platform can be used for CCA evaluation with different Wi-Fi standards.
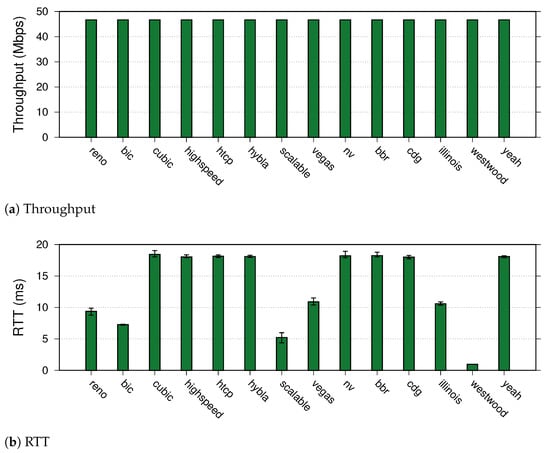
Figure 8.
CCA evaluation with IEEE 802.11n.
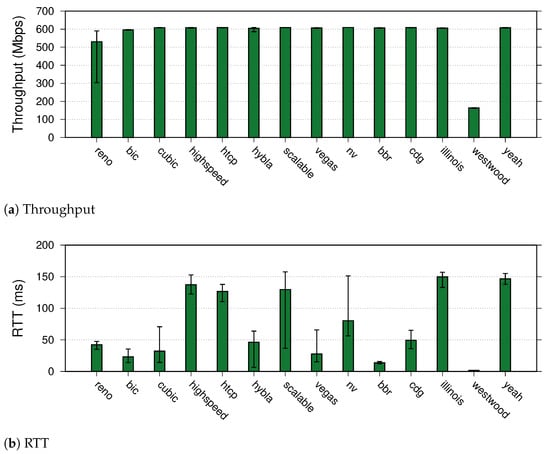
Figure 9.
CCA evaluation with IEEE 802.11ax.
The second experiment’s throughput and RTT results are shown in Figure 10. As shown in Figure 10a, with all CCAs, the throughput values have been reduced when the RSSI value becomes smaller. However, the CCAs can occupy all the available bandwidth in all cases. In the case of RTT, as shown in Figure 10b, the values are varied depending on the CCAs and signal strengths. With −70 dBm RSSI, all the RTTs are within an acceptable range (less than 30 ms). That is because the queue of S1 has not been full; hence, there was no extra additional delay. With the stronger signal, the queue may be sometimes full, causing the bigger RTTs. Similar to the previous experiment, with the Wi-Fi bottleneck link, Westwood has the best RTT performance. The results indicate our platform’s usability in the evaluations with different Wi-Fi settings.
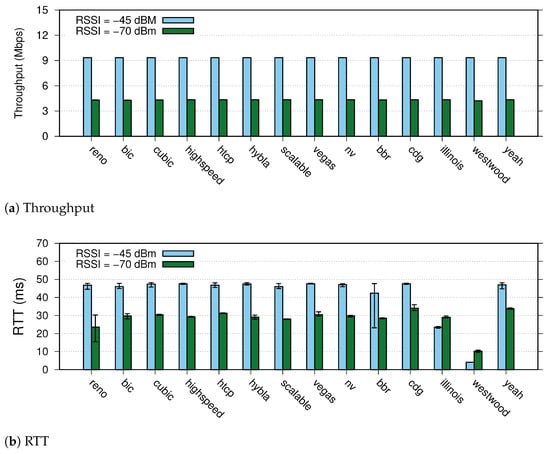
Figure 10.
Experiments on changing RSSI in IEEE 802.11g.
4.4. Fairness Evaluation
This section presents a fairness evaluation using Jain’s fairness index, which is as crucial as other network metrics (e.g., RTT and throughput), especially with multiple simultaneous client communications. For example, in a Wi-Fi network with the capture effect [49], if a client occupies an excess amount of bandwidth, there is a possibility that others will be unable to communicate. Therefore, examining fairness is essential when evaluating CCAs. In this evaluation, we revise the previous topology by making two changes. First, we consider two cases of the S1–S2 link, with bandwidths of 10 Mbps and 100 Mbps. Second, there are ten Wi-Fi clients in this scenario, as shown in Figure 11. During the evaluation, with a total length of 40 s, each client connects to the server with a 20 s TCP flow. The starting points of two subsequent TCP flows are one second apart (for example, the third and fourth flows start at 3rd and 4th second, respectively) in the first 20 s. In the last 20 s, the number of TCP flows decreases by one every 1 s until the experiment ends. We also collect throughput results and calculate fairness as follows. First, we use tcpdump [50] to capture the packets and measure the average throughput in 0.4 s. The running average throughput is calculated by shifting every 0.2 s. Specifically, we initially measure the packets arriving up to 0.4 s after the start of transmission, and we next measure the packets arriving between 0.2 and 0.6 s. The average throughput of each flow at the same time is then used to calculate Jain’s fairness index as described in Section 3. All tasks from packet capture to fairness index calculation have also been wrapped into a script that can be automatically executed. For all experiments with all CCAs, we plot the cumulative distribution functions (CDFs) of the fairness index for the 10 Mbps and 100 Mbps links in Figure 12a,b, respectively.
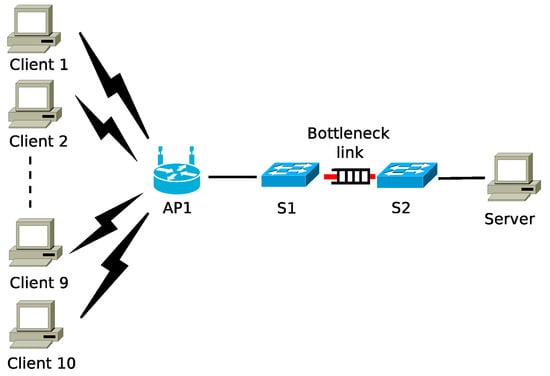
Figure 11.
Topology for fairness evaluation.
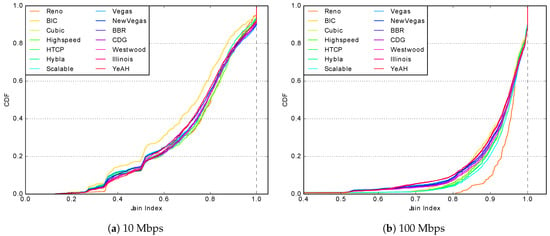
Figure 12.
Jain’s fairness index results with 10 Mbps and 100 Mbps on the S1–S2 link.
Figure 12a illustrates the fairness results when ten clients compete for a share of a link with a bandwidth of 10 Mbps, which becomes a bottleneck. As shown, an index value of 1.0 is accomplished in approximately 10% of all cases with all CCAs. In other cases, the fairness index values of the different CCAs are different. Among all fourteen CCAs, BIC has the worst performance; fairness index values of 0.8 or less account for approximately 60% of all cases. Meanwhile, Reno shows the best performance, with fewer than 40% of cases having fairness values of this level. In this evaluation, there are cases in which the fairness deteriorates due to the intentional provision of time to increase or decrease the flow. In particular, BIC is strongly influenced by this, while other CCAs perform nearly as well as Reno. Figure 12b shows the fairness results when the bandwidth between the switches is increased to 100 Mbps. Compared to the previous results, the fairness index is generally higher. In more than 90% of cases, the fairness index values of all CCAs are 0.8 or higher. Taking BIC as an example, when the bandwidth between the switches is 10 Mbps, the fairness index is 0.768, but when the bandwidth is 100 Mbps, the fairness index is 0.950. Similar observations can be found for the other CCAs. The fairest CCA is Reno, with a median fairness index value of 0.962. In this environment, where the optimal transmission rate is constantly changing, Reno does not cause substantial fluctuations; thus, it achieves the best fairness.
With the emulator approach, it is also convenient to track the dynamic behavior of all TCP flows, for example, for further investigation. In the following, we present the behaviors of CUBIC flows in the fairness evaluation. We select CUBIC because it is the default CCA on many Wi-Fi clients. Figure 13 shows the CUBIC flows for both cases of the S1–S2 link in these experiments. Lines of different colors represent each flow’s throughput variations in each figure. In the 100 Mbps case, Figure 13b shows that each line transitions through roughly the same value. Hence, each flow shares the same amount of bandwidth, although with fluctuations, when there are ten flows. By comparing Figure 13b with Figure 13a, it can be seen that the throughput for CUBIC flows is less stable when the link bandwidth is smaller.

Figure 13.
CUBIC flows with different bandwidth values on the S1–S2 link (each color representing a flow throughput).
5. Conclusions
This paper has presented an accurate platform for evaluating TCP performance in Wi-Fi networks. The platform leverages the Mininet-WiFi emulator to construct different Wi-Fi networks and modify the network configurations in a time- and cost-effective manner. Moreover, we have added measurement tools to assess the network performance conveniently. We have compared and verified the platform’s accuracy by evaluating 14 TCP CCAs. The results show that the emulator platform provides results that are as reliable as those from the actual network. We have also identified whether the bufferbloat issue has occurred within the platform (e.g., a small queue size at a bottleneck link). In addition, we have shown that the platform’s evaluation can be configured with different Wi-Fi settings, such as various IEEE 802.11 standards or signal levels. Using the platform, we can compare TCP CCAs with different performance metrics, including RTT, throughput, and Jain’s fairness index. Moreover, we can collect details on the dynamic behaviors of multiple TCP flows. Utilizing the proposed platform, we evaluated CCAs and found that BBR performed best in the Wi-Fi network, where the bufferbloat event happened. Moreover, Reno achieved the best performance in the Wi-Fi environment with a constantly changing number of flows.
In the future, we will verify the accuracy of emulated Wi-Fi networks against the real ones, which supports IEEE 802.11n, IEEE 802.11ax, and other Wi-Fi standards.
Author Contributions
Conceptualization, S.A., Y.H. and K.N.; methodology, S.A., Y.H. and K.N.; software, S.A., Y.H. and D.T.T.H.; writing—original draft preparation, S.A., Y.H. and K.N.; writing—review and editing, S.A., Y.H., D.T.T.H., T.D.N., D.-D.L., K.N. and H.S.; supervision, K.N. and H.S.; project administration, K.N.; funding acquisition, K.N. All authors have read and agreed to the published version of the manuscript.
Funding
This work was supported in part by the Japan Society for the Promotion of Science (JSPS) under Grant 20H0417, 23H03377 and in part by the Japan Science and Technology Agency (JST), with the establishment of university fellowships towards the creation of science technology innovation, Grant Number JPMJFS2107.
Institutional Review Board Statement
Not applicable.
Informed Consent Statement
Not applicable.
Data Availability Statement
Not applicable.
Conflicts of Interest
The authors declare no conflict of interest.
References
- Cisco Systems, I. The Zettabyte Era: Trends and Analysis; White Paper; Cisco: San Jose, CA, USA, 2015. [Google Scholar]
- Ganji, A.; Page, G.; Shahzad, M. Characterizing the Performance of WiFi in Dense IoT Deployments. In Proceedings of the 2019 28th International Conference on Computer Communication and Networks (ICCCN), Valencia, Spain, 29 July–1 August 2019; pp. 1–9. [Google Scholar]
- Horie, Y.; Thi Thu Hien, D.; Nguyen, K.; Sekiya, H. A Comparison of Congestion Control Algorithms in Emulated Wi-Fi Networks. In Proceedings of the 2020 International Conference on Information and Communication Technology Convergence (ICTC), Jeju, Republic of Korea, 21–23 October 2020; pp. 305–310. [Google Scholar]
- Ganji, A.; Singh, A.; Shahzad, M. Choosing TCP Variants for Cloud Tenants—A Measurement based Approach. In Proceedings of the 2020 29th International Conference on Computer Communications and Networks (ICCCN), Honolulu, HI, USA, 3–6 August 2020; pp. 1–9. [Google Scholar]
- Lukaseder, T.; Bradatsch, L.; Erb, B.; Van Der Heijden, R.W.; Kargl, F. A Comparison of TCP Congestion Control Algorithms in 10G Networks. In Proceedings of the 2016 IEEE 41st Conference on Local Computer Networks (LCN), Dubai, United Arab Emirates, 7–10 November 2016; pp. 706–714. [Google Scholar]
- Taruk, M.; Budiman, E.; Haviluddin.; Setyadi, H.J. Comparison of TCP variants in Long Term Evolution (LTE). In Proceedings of the 2017 5th International Conference on Electrical, Electronics and Information Engineering (ICEEIE), Malang, Indonesia, 6–8 October 2017; pp. 131–134. [Google Scholar]
- Poorzare, R.; Augé, A.C. Challenges on the Way of Implementing TCP Over 5G Networks. IEEE Access 2020, 8, 176393–176415. [Google Scholar] [CrossRef]
- Polese, M.; Jana, R.; Zorzi, M. TCP and MP-TCP in 5G mmWave Networks. IEEE Internet Comput. 2017, 21, 12–19. [Google Scholar] [CrossRef]
- Grieco, L.A.; Mascolo, S. Performance Evaluation and Comparison of Westwood+, New Reno, and Vegas TCP Congestion Control. SIGCOMM Comput. Commun. Rev. 2004, 34, 25–38. [Google Scholar] [CrossRef]
- Shi, H.; Wang, J. Intelligent TCP Congestion Control Policy Optimization. Appl. Sci. 2023, 13, 6644. [Google Scholar] [CrossRef]
- Ng, A.C.H.; Malone, D.; Leith, D.J. Experimental Evaluation of TCP Performance and Fairness in an 802.11e Test-Bed. In Proceedings of the 2005 ACM SIGCOMM Workshop on Experimental Approaches to Wireless Network Design and Analysis, Philadelphia, PA, USA, 22 August 2005; pp. 17–22. [Google Scholar]
- Ong, K.; Murray, D.; McGill, T. Large-Sample Comparison of TCP Congestion Control Mechanisms over Wireless Networks. In Proceedings of the 2016 30th International Conference on Advanced Information Networking and Applications Workshops (WAINA), Crans-Montana, Switzerland, 23–25 March 2016; pp. 420–426. [Google Scholar]
- Alakoca, H.; Karaca, M.; Karabulut Kurt, G. Performance of TCP over 802.11ac based WLANs via Testbed Measurements. In Proceedings of the 2015 International Symposium on Wireless Communication Systems (ISWCS), Brussels, Belgium, 25–28 August 2015; pp. 611–615. [Google Scholar]
- Grazia, C.A.; Klapez, M.; Casoni, M. BBRp: Improving TCP BBR Performance Over WLAN. IEEE Access 2020, 8, 43344–43354. [Google Scholar] [CrossRef]
- Nguyen, K.; Sekiya, H. TCP Behavior on Multi-gigabit IEEE 802.11ad Link. In Proceedings of the 8th IEEE International Conference on Green and Human Information Technology (ICGHIT), Hanoi, Vietnam, 5–7 February 2020; pp. 58–61. [Google Scholar]
- Muhammad, S.; Zhao, J.; Refai, H.H. An Empirical Analysis of IEEE 802.11 ax. In Proceedings of the 2020 International Conference on Communications, Signal Processing, and Their Applications (ICCSPA), Sharjah, United Arab Emirates, 16–18 March 2021; pp. 1–6. [Google Scholar]
- ElKassabi, I.; Abdrabou, A. An Experimental Comparative Performance Study of Different WiFi Standards for Smart Cities Outdoor Environments. In Proceedings of the 2022 IEEE 13th Annual Ubiquitous Computing, Electronics & Mobile Communication Conference (UEMCON), New York, NY, USA, 26–29 October 2022; pp. 450–455. [Google Scholar]
- Yang, W.; Zhou, X.; Du, W.; Sun, J.; Ren, Y.; Xie, G. A Measurement Study of TCP Performance over 60GHz mmWave Hybrid Networks. In Proceedings of the 2022 IEEE 23rd International Symposium on a World of Wireless, Mobile and Multimedia Networks (WoWMoM), Belfast, UK, 14–17 June 2022; pp. 300–305. [Google Scholar]
- Høiland-Jørgensen, T.; Hurtig, P.; Brunstrom, A. The Good, the Bad and the WiFi: Modern AQMs in a Residential Setting. Comput. Netw. 2015, 89, 90–106. [Google Scholar] [CrossRef]
- Showail, A.; Jamshaid, K.; Shihada, B. An Empirical Evaluation of Bufferbloat in IEEE 802.11n Wireless Networks. In Proceedings of the 2014 IEEE Wireless Communications and Networking Conference (WCNC), Istanbul, Turkey, 6–9 April 2014; pp. 3088–3093. [Google Scholar]
- Grazia, C.A.; Klapez, M.; Casoni, M. A Performance Evaluation of TCP Pacing and TCP Small Queues. IEEE Access 2021, 9, 129329–129336. [Google Scholar] [CrossRef]
- Pokhrel, S.R.; Panda, M.; Vu, H.L.; Mandjes, M. TCP Performance over Wi-Fi: Joint Impact of Buffer and Channel Losses. IEEE Trans. Mob. Comput. 2016, 15, 1279–1291. [Google Scholar] [CrossRef]
- Bao, W.; Wong, V.W.S.; Leung, V.C.M. A Model for Steady State Throughput of TCP CUBIC. In Proceedings of the 2010 IEEE Global Telecommunications Conference GLOBECOM, Miami, FL, USA, 6–10 December 2010; pp. 1–6. [Google Scholar]
- Poojary, S.; Sharma, V. Analytical Model for Congestion Control and Throughput with TCP CUBIC Connections. In Proceedings of the 2011 IEEE Global Telecommunications Conference-GLOBECOM, Houston, TX, USA, 5–9 December 2011; pp. 1–6. [Google Scholar]
- Yoshida, H.; Satoda, K.; Murase, T. Constructing stochastic model of TCP throughput on basis of stationarity analysis. In Proceedings of the 2013 IEEE Global Communications Conference (GLOBECOM), Atlanta, GA, USA, 9–13 December 2013; pp. 1544–1550. [Google Scholar]
- Fontes, R.d.R.; Mahfoudi, M.; Dabbous, W.; Turletti, T.; Rothenberg, C. How Far Can We Go? Towards Realistic Software-Defined Wireless Networking Experiments. Comput. J. 2017, 60, 1458–1471. [Google Scholar] [CrossRef]
- Fontes, R.R.; Afzal, S.; Brito, S.H.B.; Santos, M.A.S.; Rothenberg, C.E. Mininet-WiFi: Emulating software-defined wireless networks. In Proceedings of the 2015 11th International Conference on Network and Service Management (CNSM), Barcelona, Spain, 9–13 November 2015; pp. 384–389. [Google Scholar]
- Zhang, X.; Wang, H.; Zhao, H. An SDN Framework for UAV Backbone Network Towards Knowledge Centric Networking. In Proceedings of the IEEE INFOCOM 2018-IEEE Conference on Computer Communications Workshops (INFOCOM WKSHPS), Honolulu, HI, USA, 15–19 April 2018; pp. 456–461. [Google Scholar]
- Han, Z.; Lei, T.; Lu, Z.; Wen, X.; Zheng, W.; Guo, L. Artificial Intelligence-Based Handoff Management for Dense WLANs: A Deep Reinforcement Learning Approach. IEEE Access 2019, 7, 31688–31701. [Google Scholar] [CrossRef]
- Farrow, P. Performance analysis of heterogeneous TCP congestion control environments. In Proceedings of the 2017 International Conference on Performance Evaluation and Modeling in Wired and Wireless Networks (PEMWN), Paris, France, 28–30 November 2017; pp. 1–6. [Google Scholar]
- Song, Y.J.; Kim, G.H.; Mahmud, I.; Seo, W.K.; Cho, Y.Z. Understanding of BBRv2: Evaluation and Comparison With BBRv1 Congestion Control Algorithm. IEEE Access 2021, 9, 37131–37145. [Google Scholar] [CrossRef]
- Lantz, B.; Heller, B.; McKeown, N. A Network in a Laptop: Rapid Prototyping for Software-Defined Networks. In Proceedings of the 9th ACM SIGCOMM Workshop on Hot Topics in Networks, Monterey, CA, USA, 20–21 October 2010. [Google Scholar]
- iperf—The Ultimate Speed Test Tool for Tcp, Udp and Cctp. Available online: https://iperf.fr/ (accessed on 1 November 2022).
- Xu, L.; Harfoush, K.; Injong, R. Binary Increase Congestion Control (BIC) for Fast Long-distance Networks. In Proceedings of the IEEE INFOCOM, Hong Kong, China, 7–11 March 2004; pp. 2514–2524. [Google Scholar]
- Ha, S.; Rhee, I.; Xu, L. CUBIC: A New TCP-friendly High-speed TCP Variant. Oper. Syst. Rev. 2008, 42, 64–74. [Google Scholar] [CrossRef]
- Leith, D.; Shorten, R. H-TCP: TCP for high-speed and long-distance networks. In Proceedings of the PFLDnet, Argonne, IL, USA, February, 16–17 February 2004; pp. 1–16. [Google Scholar]
- Floyd, S. HighSpeed TCP for Large Congestion Windows. RFC 3649 . 2003. Available online: https://www.rfc-editor.org/info/rfc3649 (accessed on 27 June 2023).
- Caini, C.; Firrincieli, R. TCP Hybla: A TCP Enhancement for Heterogeneous Networks. Int. J. Satell. Commun. Netw. 2004, 22, 547–566. [Google Scholar] [CrossRef]
- Jacbson, V. Berkeley TCP evolution from 4.3-Tahoe to 4.3 Reno. In Proceedings of the 18th IETF, Vancouver, BC, Canada, 30 July–3 August 1990; pp. 523–526. [Google Scholar]
- Kelly, T. Scalable TCP: Improving Performance in Highspeed Wide Area Networks. SIGCOMM Comput. Commun. Rev. 2003, 33, 83–91. [Google Scholar] [CrossRef]
- Cardwell, N.; Cheng, Y.; Gunn, C.S.; Yeganeh, S.H.; Jacobson, V. BBR: Congestion-Based Congestion Control. Queue 2016, 14, 20–53. [Google Scholar] [CrossRef]
- Sing, J.; Soh, B. TCP New Vegas: Improving the Performance of TCP Vegas Over High Latency Links. In Proceedings of the IEEE International Symposium on Network Computing and Applications, Cambridge, MA, USA, 27–29 July 2005; pp. 73–82. [Google Scholar]
- Brakmo, L.S.; Peterson, L.L. TCP Vegas: End to End Congestion Avoidance on a Global Internet. IEEE J. Sel. Areas Commun. 1995, 13, 1465–1480. [Google Scholar] [CrossRef]
- Hayes, D.A.; Armitage, G. Revisiting TCP Congestion Control Using Delay Gradients. In Proceedings of the International Conference on Research in Networking, Valencia, Spain, 9–13 May 2011; pp. 328–341. [Google Scholar]
- Liu, S.; Basar, T.; Srikant, R. TCP-Illinois: A Loss- and Delay-based Congestion Control Algorithm for High-speed Networks. Perform. Eval. 2008, 65, 417–440. [Google Scholar] [CrossRef]
- Gerla, M.; Lee, S.; Sanadidi, M. TCP Westwood: Congestion Control with Faster Recovery; Technical Report, UCLA CSD TR #200017; The University of California, Los Angeles: Los Angeles, CA, USA, 2000. [Google Scholar]
- Baiocchi, A.; Castellani, A.P.; Vacirca, F. YeAH-TCP: Yet Another Highspeed TCP. In Proceedings of the PFLDnet, Los Angeles, CA, USA, 7–9 February 2007. [Google Scholar]
- Thu Hien, D.T.; Duc Ngo, T.; Le, D.; Sekiya, H.; Pham, V.; Nguyen, K. Targeting Bufferbloat in Wi-Fi Networks: An Emulator-based Approach. In Proceedings of the 2019 19th International Symposium on Communications and Information Technologies (ISCIT), Ho Chi Minh City, Vietnam, 25–27 September 2019; pp. 102–107. [Google Scholar]
- Kanematsu, T.; Yoshida, Y.; Li, Z.; Pei, T.; Choi, Y.J.; Nguyen, K.; Sekiya, H. Analytical Evaluation of a WLAN with Dense Network Nodes Considering Capture Effect. IEICE Trans. Commun. 2020, E103B, 815–825. [Google Scholar] [CrossRef]
- Man Page of Tcpdump. Available online: https://www.tcpdump.org/manpages/tcpdump.1-4.99.1.html (accessed on 1 November 2022).
Disclaimer/Publisher’s Note: The statements, opinions and data contained in all publications are solely those of the individual author(s) and contributor(s) and not of MDPI and/or the editor(s). MDPI and/or the editor(s) disclaim responsibility for any injury to people or property resulting from any ideas, methods, instructions or products referred to in the content. |
© 2023 by the authors. Licensee MDPI, Basel, Switzerland. This article is an open access article distributed under the terms and conditions of the Creative Commons Attribution (CC BY) license (https://creativecommons.org/licenses/by/4.0/).