1. Introduction
Object detection has become increasingly popular and contributed to the development of various applications in the autonomous vehicular industry, such as obstacle detection, collision avoidance, lane-level detection, parking assistance and pedestrian safety [
1,
2,
3]. In order to perform detection tasks in autonomous vehicles, range sensors such as LiDAR, RADAR, RGB-D, and stereo vision cameras are heavily relied upon [
4,
5,
6]. LiDAR and RADAR emit light pulses and radio waves to detect the presence of an object and provide data in the form of point clouds. In contrast, vision cameras capture 2D image data of the environment along with depth/distance estimation. With rapid development in deep learning, 2D and 3D detections have gathered more interest in the research community [
7]. 2D networks are often termed image-based network since it heavily depends on image data to perform localization and classification tasks [
8]. The bounding box coordinates of 2D objects are represented as x1, y1, x2, y2. Recently, various architectures such as SSD [
9], Faster R-CNN [
10], YOLO [
11], FFNet [
12] and VirConv-S [
13] have been proposed in 2D detection challenge and are successfully backed by large-scale datasets such as KITTI [
14]. Compared to 2D detection techniques, 3D object detection poses a trivial challenge because the concepts of 2D detection cannot be directly translated to the 3D domain due to its 6 Degrees-of-Freedom (DoF) [
15]. 3D object detectors estimate the bounding box coordinates as (x, y, z, l, w, h,
).
Like 2D object detectors, state-of-the-art 3D object detectors can be classified into single-stage and two-stage detectors based on the presence or absence of Regional Proposal Networks (RPN). In two-stage methods, the first stage extracts feature information generated by RPN and generates Regions of Interest (RoI). The second stage acts as a detector network that operates only on the proposed regions to create accurate predictions. On the other hand, Single-stage detectors serve as a simple and efficient end-to-end pipeline. However, single-stage detectors face a performance drop as compared to two-stage detectors. One of the primary reasons is the sparsity of point clouds, and when the network progressively scales down during the forward pass of the network, crucial spatial information is lost [
1]. This causes an inability to predict the bounding box coordinates in 3D space accurately. Architectures such as PointNet [
16] and VoxelNet [
4] were proposed to increase the performance of single-stage detector networks. VoxelNet divides the 3D space into voxels and then applies PointNet across each voxel, followed by 3D and 2D convolution layers [
17]. Following the recent success in the usage of transformers [
18] in computer vision, another approach was to utilize transformer structures to address sparse irregularities in processing point cloud information [
19].
During training, the predicted bounding boxes are regressed continuously to match the ground truth data [
20,
21,
22]. The detector stage of single and two-stage object detectors use
based loss functions such as L1, L2, and smooth-
l1 to optimize the bounding box regression problem [
10,
23]. However, a performance gap exists between IoU-based evaluation metrics and distance-based loss functions. Refs. [
17,
24,
25,
26,
27] have analyzed this mismatch and demonstrated that similar bounding boxes with different aspect ratios yield the same distance loss while their IoU values remain different. IoU based loss functions [
27,
28,
29] were proposed to address this issue. IoU, as the name suggests, measures the Intersection Over Union area between two bounding boxes. One of the critical differences between IoU losses and distance loss is that IoU considers all the properties of bounding boxes, such as length, width, height, and orientation, and remains scale-invariant, solving scale and range differences between the boxes.
However, IoU loss in 3D object detection brings additional complexity, such as higher DOF and huge 3D space compared to its 2D counterpart, leading to slow convergence and affecting the network performance [
30]. During our earlier study [
26], we observed that convergence of existing IoU losses and their variations are affected when the boxes have the same centers and aspect ratios but still have varying shapes and orientations. Additionally, objects in 3D space can have arbitrary orientations, and usage of axis-aligned loss functions results in prediction mismatch [
31]. To address these drawbacks, an improved loss function 3D IIOU is proposed in this research. This loss function considers orientation as a parameter in the 4th dimension and calculates the center distance between x, y, and z centers individually. The proposed loss function addresses the edge cases when the loss value and the guided regression aid in better convergence. The performance of this loss is evaluated on both single-stage and two-stage 3D object detectors on the KITTI and nuScenes datasets. The research article follows the below structure,
A background study on various categories of 3D object detectors and their challenges
Section 2.
Section 3 analyzes the shortcomings of IoU losses and
Section 4 explains the proposed the loss function.
Section 5 demonstrates the performance of the proposed loss function in a synthetic dataset.
The performance evaluation on KITTI datasets is carried out in
Section 7.
3. Analysis on 3D IoU Losses
Given a ground truth (GT) box G = {xg, yg, zg, wg, hg, lg, g} and a prediction (Pred) box P = {xp, yp, zp, wp, hp, lp, p}, whereas, x, y, and z represent the center coordinates along the x, y, and z-axis and l, w and h indicate the length, width and height along their respective axes and denotes the orientation of an object.
The IoU between the boxes [
69] are calculated as follows,
However, the above IoU loss works well for axis-aligned bounding boxes. However, loss estimation for rotated bounding boxes is more complex cause the boxes can overlap and intersect differently. To address this problem, skewIoU [
67] was proposed as follows,
In the above Equation (
3), I represent the overlap/intersection area. During the loss estimation, boxes with intersection area are sorted in anticlockwise order, and skewIoU estimates the overall IoU. However, this method also depends on intersection areas like Equation (
1), which results in a high loss value of 1 in the event of two boxes located far from each other without any overlap. Sorting the vertices in an anticlockwise direction adds computation time in loss estimation.
To address the shortcomings of IoU loss, GIoU [
27] was proposed as follows,
As seen in Equation (
4),
considers a small convex rectangle enclosing both boxes. This loss technique addresses the edge cases when the boxes are away from each other and have zero intersection area. However, when the boxes are inclusive of each other, the IoU term in Equation (
4) becomes 1, and convergence slows down, affecting the gradient estimation. A new variation of GIoU called smooth GIoU was proposed to ensure stable convergence in GIoU loss. Ref. [
28] introduced a smoothness parameter if GIoU loss reaches a specific threshold value (
) as shown in Equation (
5).
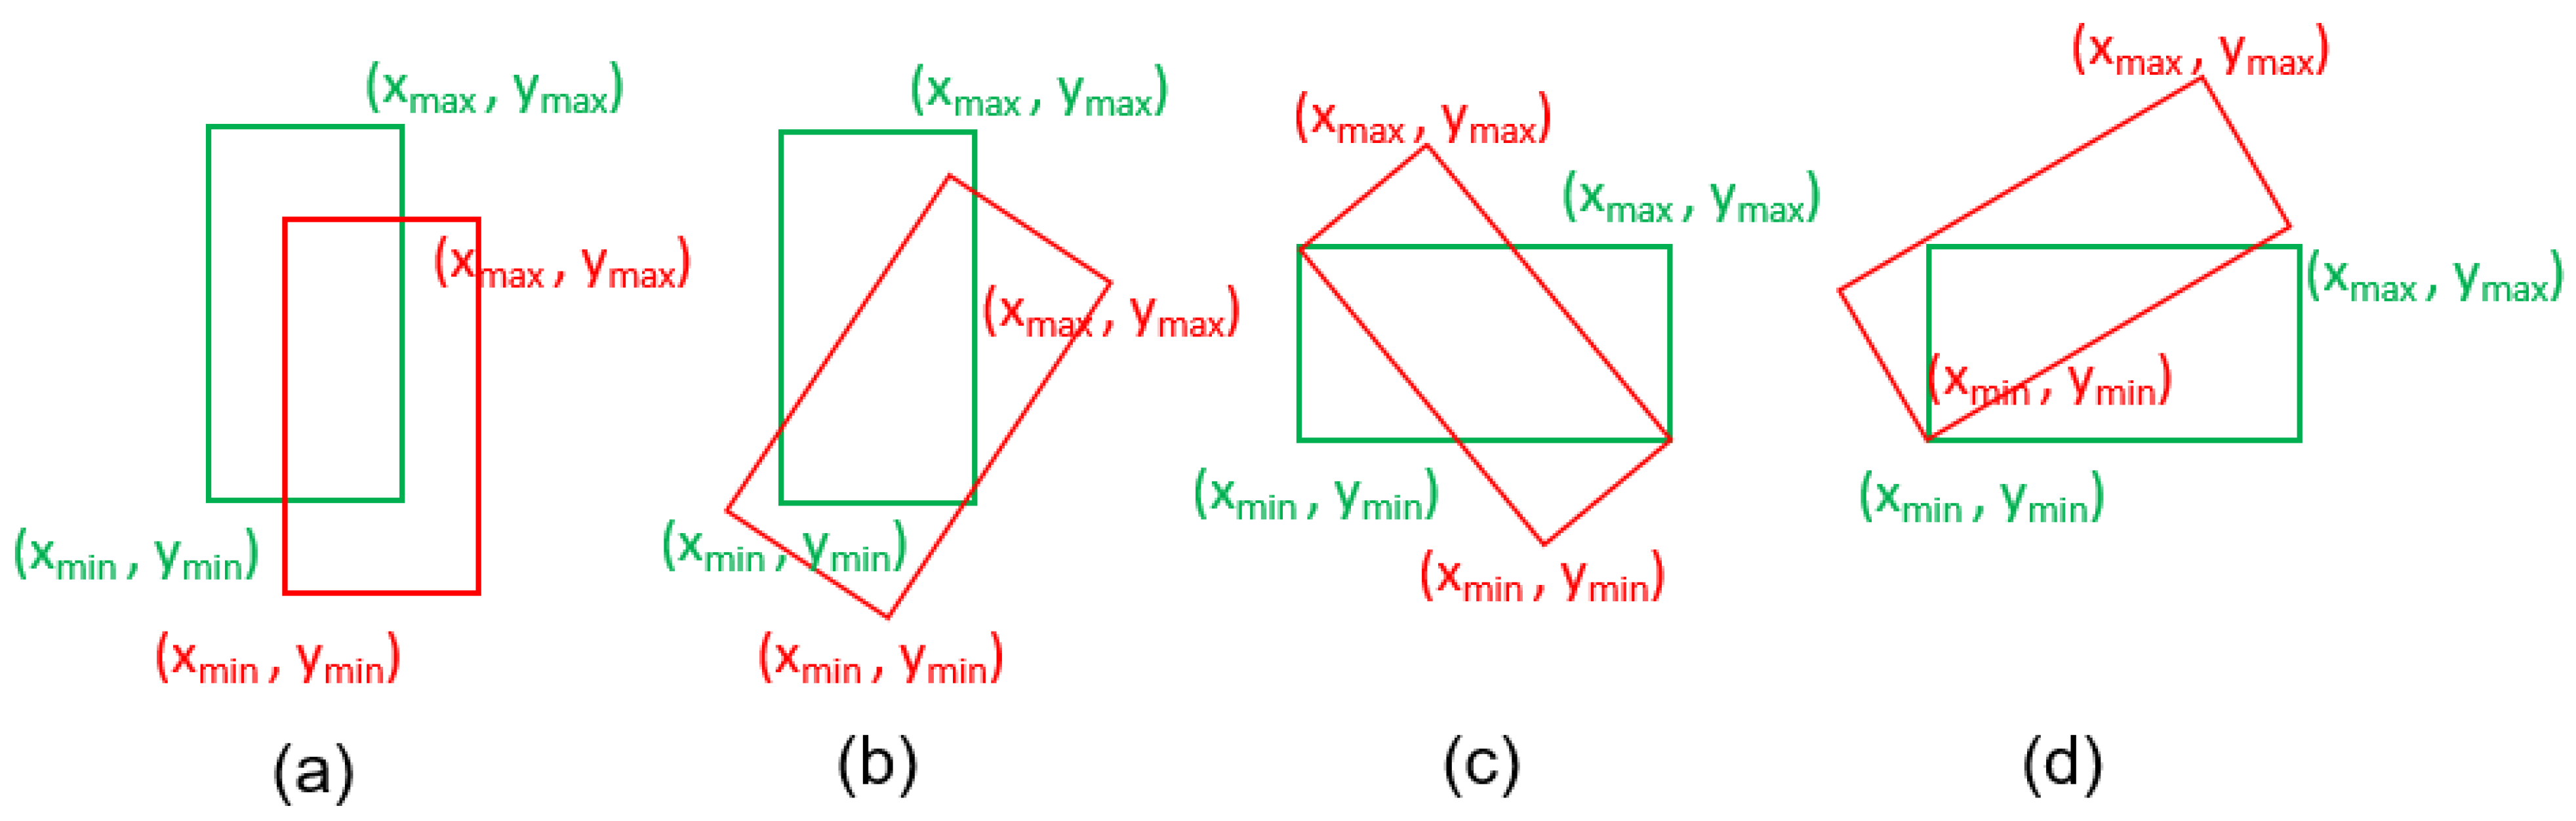
However, Equation (
3) degrades to IoU in case of inclusion and cannot overcome the aspect ratio difference between the boxes. For instance, in
Figure 1, the boxes are of different orientations and sizes, but their overlapping and convex areas remain constant. The loss estimation for rotated bounding boxes is more complex cause the boxes can overlap and intersect in different ways [
63,
67].
To address the problem of overlap and aspect ratio similarity, DIoU and CIoU losses were proposed.
Equation (
6) regresses the centers of the bounding boxes in addition to the overlap area. In the minimum rectangle containing the prediction and ground truth boxes, C represents the diagonal distance from the center of each box. This helps in convergence when the boxes are inclusive but with different centers and in cases where the boxes do not overlap. However,
is scale invariant. To address the scale invariance problem,
added a new term called
to address the gap in aspect ratio between the boxes. However, as seen in Equation (
8),
considers only two aspect ratios, such as w and h. For 3D boxes, a third aspect ratio l exists, which is not utilized in
.
To address this gap in aspect ratio and consider all geometric sides, authors of this research [
63] proposed 3D EIoU loss. The representation of the loss function is as follows,
In Equation (
9), in addition to the estimation of the distance between the centers of the boxes, the aspect ratio of the individual sides is taken into consideration, addressing the shortcomings of
and
. Since this technique does not involve the sorting operation utilized in skewIoU, the loss function’s convergence is also faster. However, the orientation of an object
needs to be more used in loss estimation. Two boxes with the same centers and aspect ratio but different orientations can have the same loss value. This requires additional operations in the analysis of the orientation of the objects [
68].
The drawbacks of existing IoU loss functions can be summarized as follows:
Various IoU losses converge to simple IoU in cases of complete overlap of boxes, boxes with the same centers, and the same aspect ratio.
Axis-aligned IoU losses suffer poor regression for rotated bounding boxes.
Performance gap due to orientation of the objects.
4. Proposed IIoU Loss
Let
and
denote 3D ground-truth regression vector and 3D prediction branch vector. We isolated a selected ground truth box as
and selected prediction box as
. Following the common settings [
30,
43], we set
= sin
cos
and
= cos
sin
.
and
were clamped to avoid infinity values. Our proposed IIoU loss has two portions: IoU loss and center loss.
Following the initial settings, IoU values are calculated as follows:
whereas,
The min and max functionality estimates the intersection area between the two boxes in 3D space, and the overall IoU of two 3D boxes are calculated in (
11).
The diagonal length of the minimum convex rectangle enclosing the ground truth and prediction boxes is calculated as follows:
The K value is a hyperparameter since we consider orientation as an additional dimension in distance loss estimation. Estimating intersection area and diagonal distance are adapted from [
27] but modified to include all the dimensions for 3D space. Our proposed loss IIoU estimates the Euclidean distance between x, y, and z centers individually to estimate the center loss. The center coordinate of each axis, along with the minimum and maximum edges, are utilized as follows,
In the above Equation (
14), the Euclidean distance between x centers is calculated. Similarly, we can estimate the Euclidean distance for y and z centers (line 10 in Algorithm 1). Once the center distance is calculated, the diagonal length is a denominator to minimize the distance between two boxes. The IIoU can be obtained at line 12 in Algorithm 1.
This approach has a few advantages when compared to traditional IoU losses. Rotation as an additional dimensional parameter simplifies loss calculation when the boxes are not aligned/rotated. For instance, when the boxes are a little tilted, and two axes coincide, Euclidean distance estimation of rotation and other third axis aids in effective loss estimation. Secondly, when the boxes have different orientations but have the same centers, existing losses fail as they are heavily dependent on the centers. Previous studies [
26] show that two boxes with the same centers can still have different dimensions. The same observation can be made regarding aspect ratios. All the bounding box parameters in our proposed loss equation are completely differentiable and can be trained on GPU with gradient-based back-propagation. Our Algorithm 1 presents sequential steps carried out in loss estimation.
| Algorithm 1 Improved intersection over union loss estimation. |
- Input:
= , = . - Output:
- 1:
▹ IoU calculation: - 2:
U = + = () + () - 3:
I = F + F + F - 4:
▹ F = min( ,) − max( ,) - 5:
IoU = I/(U − I ) - 6:
▹ Distance Estimation: - 7:
Diagonal = F’ + F’ + F’ + F’ - 8:
▹ F’ = (max( ,) − min( ,))** 2 - 9:
Distance Estimation = - 10:
- 11:
▹ - 12:
- 13:
return
|
5. Simulation Experiment
A simulation experiment was conducted to evaluate the performance of the proposed IIoU loss function against the above-explained loss functions. When preparing a synthetic dataset, aspect ratio, scale, and distance between bounding boxes were considered. Seven 3D ground truths centered at (6, 6, 6) were generated with several aspect ratios such as 1:1:1, 0.66:1:1, 1:0.66:1, 1:1:0.66, 2.5:1:1, 1;2.5:1, 1:1:2.5. 3D anchor boxes were uniformly distributed at 1000 points in a circular region with a radius of 4 and a center at (6, 6, 6). A range of 3D anchor boxes were chosen to accommodate overlapping and non-overlapping cases. These volumes are 0.5, 0.67, 0.75, 1, 1.33, 1.5 and 2. For any given point and scale, 3D anchor boxes with the same aspect ratios 1:1:1, 0.66:1;1, 1:0.66:1, 1:1:0.66, 2.5:1;1, 1;2.5:1, 1:1:2.5 were provided. This approach would generate 49,000 (1000 × 7 × 7) anchor boxes for each ground truth box. Since we have seven ground truth boxes, the total number of regression cases will equal 343,000 (1000 × 7 × 7 × 7).
For each case, we simulated bounding box regression using gradient descent Algorithm 2 as follows,
and
indicate anchor box at iteration t and gradient loss to the same anchor box at iteration
t − 1 with a learning rate of
. For accelerating the convergence of network, we multiply the gradient loss by
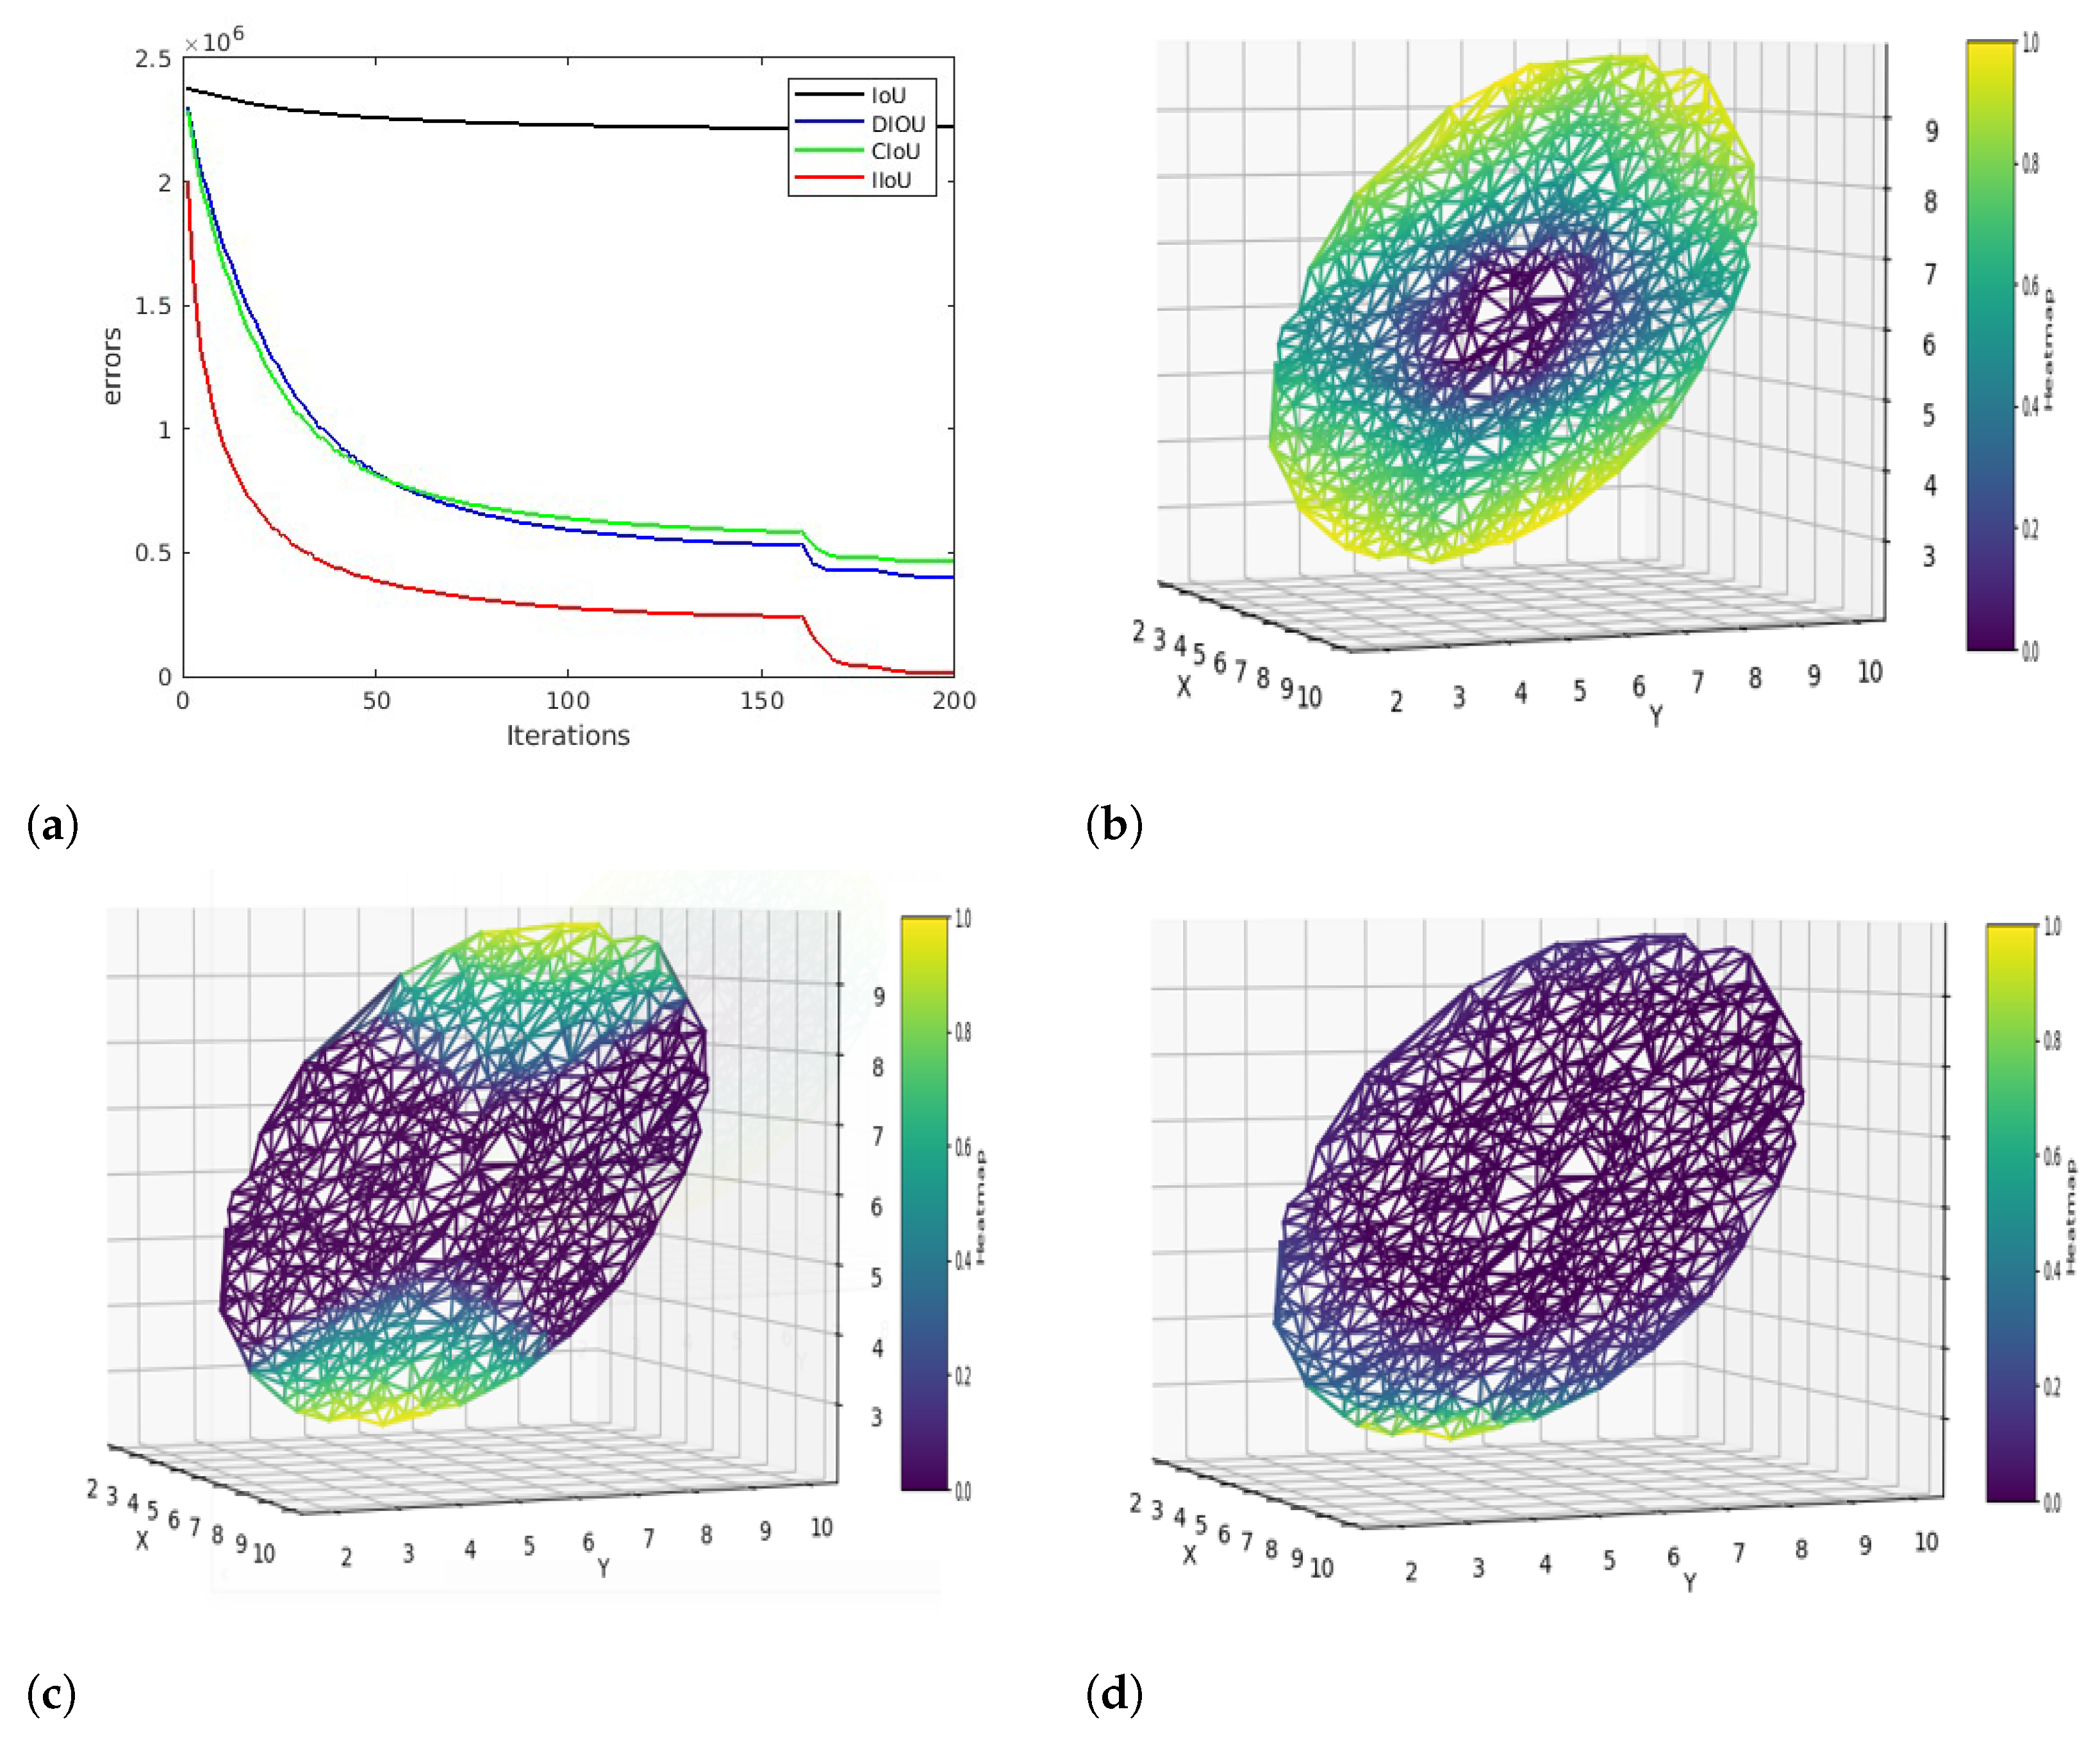
At the end of 200th iteration, cumulative loss values of
,
,
and
are reported as follows: 4.5 × 10
, 1.51 × 10
, 1.55 × 10
, 6.9 × 10
.
has the lowest error rate and a better convergence speed, as shown in
Figure 2a.
Figure 2b–d represents the distribution of regression errors across the x, y, and z axes with a heat map.
suffers a higher error rate throughout the iterations due to inclusions and non-overlapping scenarios. In
Figure 2c, we can observe that
performs better than
but has a higher error rate at the edges. This could be due to a special case of inclusion where the centers of the boxes align, or they have similar aspect ratios. Similarly, we can observe the improved performance of proposed IoU loss,
from
Figure 2d. The proposed loss function was able to regress the boxes more efficiently across all the cases of inclusions, boxes with the same centers, and similar aspect ratios.
| Algorithm 2 Simulation experiment on synthetic data. |
- Input:
indicates anchor boxes at 1000 points (N) centered at (6, 6, 6) and scattered in a circular space with a radius of 4. S = covering 7 different scales and aspect ratios of the anchor boxes. is the set of ground truth boxes with center (6, 6, 6) and 7 aspect ratios. corresponds to learning rate. - Output:
Regression error is calculated for each iteration and 200 scattered points.
- 1:
Initiate and iteration limit of 343,000 (T). - 2:
for do - 3:
for do - 4:
for do - 5:
for
do - 6:
if then - 7:
else if then - 8:
else - 9:
end if - 10:
- 11:
+ ) - 12:
- 13:
end for - 14:
end for - 15:
end for - 16:
end for - 17:
return RE
|
7. Evaluation
The performance of the proposed IIoU was evaluated on both the LiDAR-based detection network and the fusion detector network. Due to testing constraints in the KITTI benchmark test set [
14], performance evaluation was carried out on the KITTI val dataset. Three classes of the KITTI dataset, such as 3D car, pedestrian, and cyclist, were evaluated with different IoU thresholds, 0.7, 0.5, and 0.5. The testing thresholds were adapted from previous studies [
38,
40,
43]. The results are displayed in average precision (AP) and mean average precision (mAP), a cumulative average of different APs. This section calculates the relative improvement (R.L.) to IoU loss. The highest prediction result in each category is highlighted in bold.
Table 1 displays the improved performance of IIoU against IoU and DIoU losses in a 3D fusion network. The initial analysis phase revealed a performance gap between networks trained from scratch and pre-trained model weights [
17,
46,
70]. To conduct a fair evaluation, we trained all the networks from scratch. All the training parameters, including the hyper-parameters, training, and testing environments, were kept constant during the network training and evaluation phase.
Table 1 shows that the proposed IIoU performs well for all easy, moderate, and hard categories of the 3D cyclist class. We can observe an R.L. of 3.4% in the hard class.
Table 2 measures the A.P. at 40 sampling recall positions. IIoU performs significantly better than IoU and DIoU in the 3D car and cyclist classes. The hard category of the 3D car class shows an R.L. of 2.29%. 3D cyclist shows a R.L. of 0.71%, 3.76%, 6.01% demonstrating a significant performance change for smaller objects. In both
Table 1 and
Table 2, the 3D cyclist class attains the best performance for the proposed loss function.
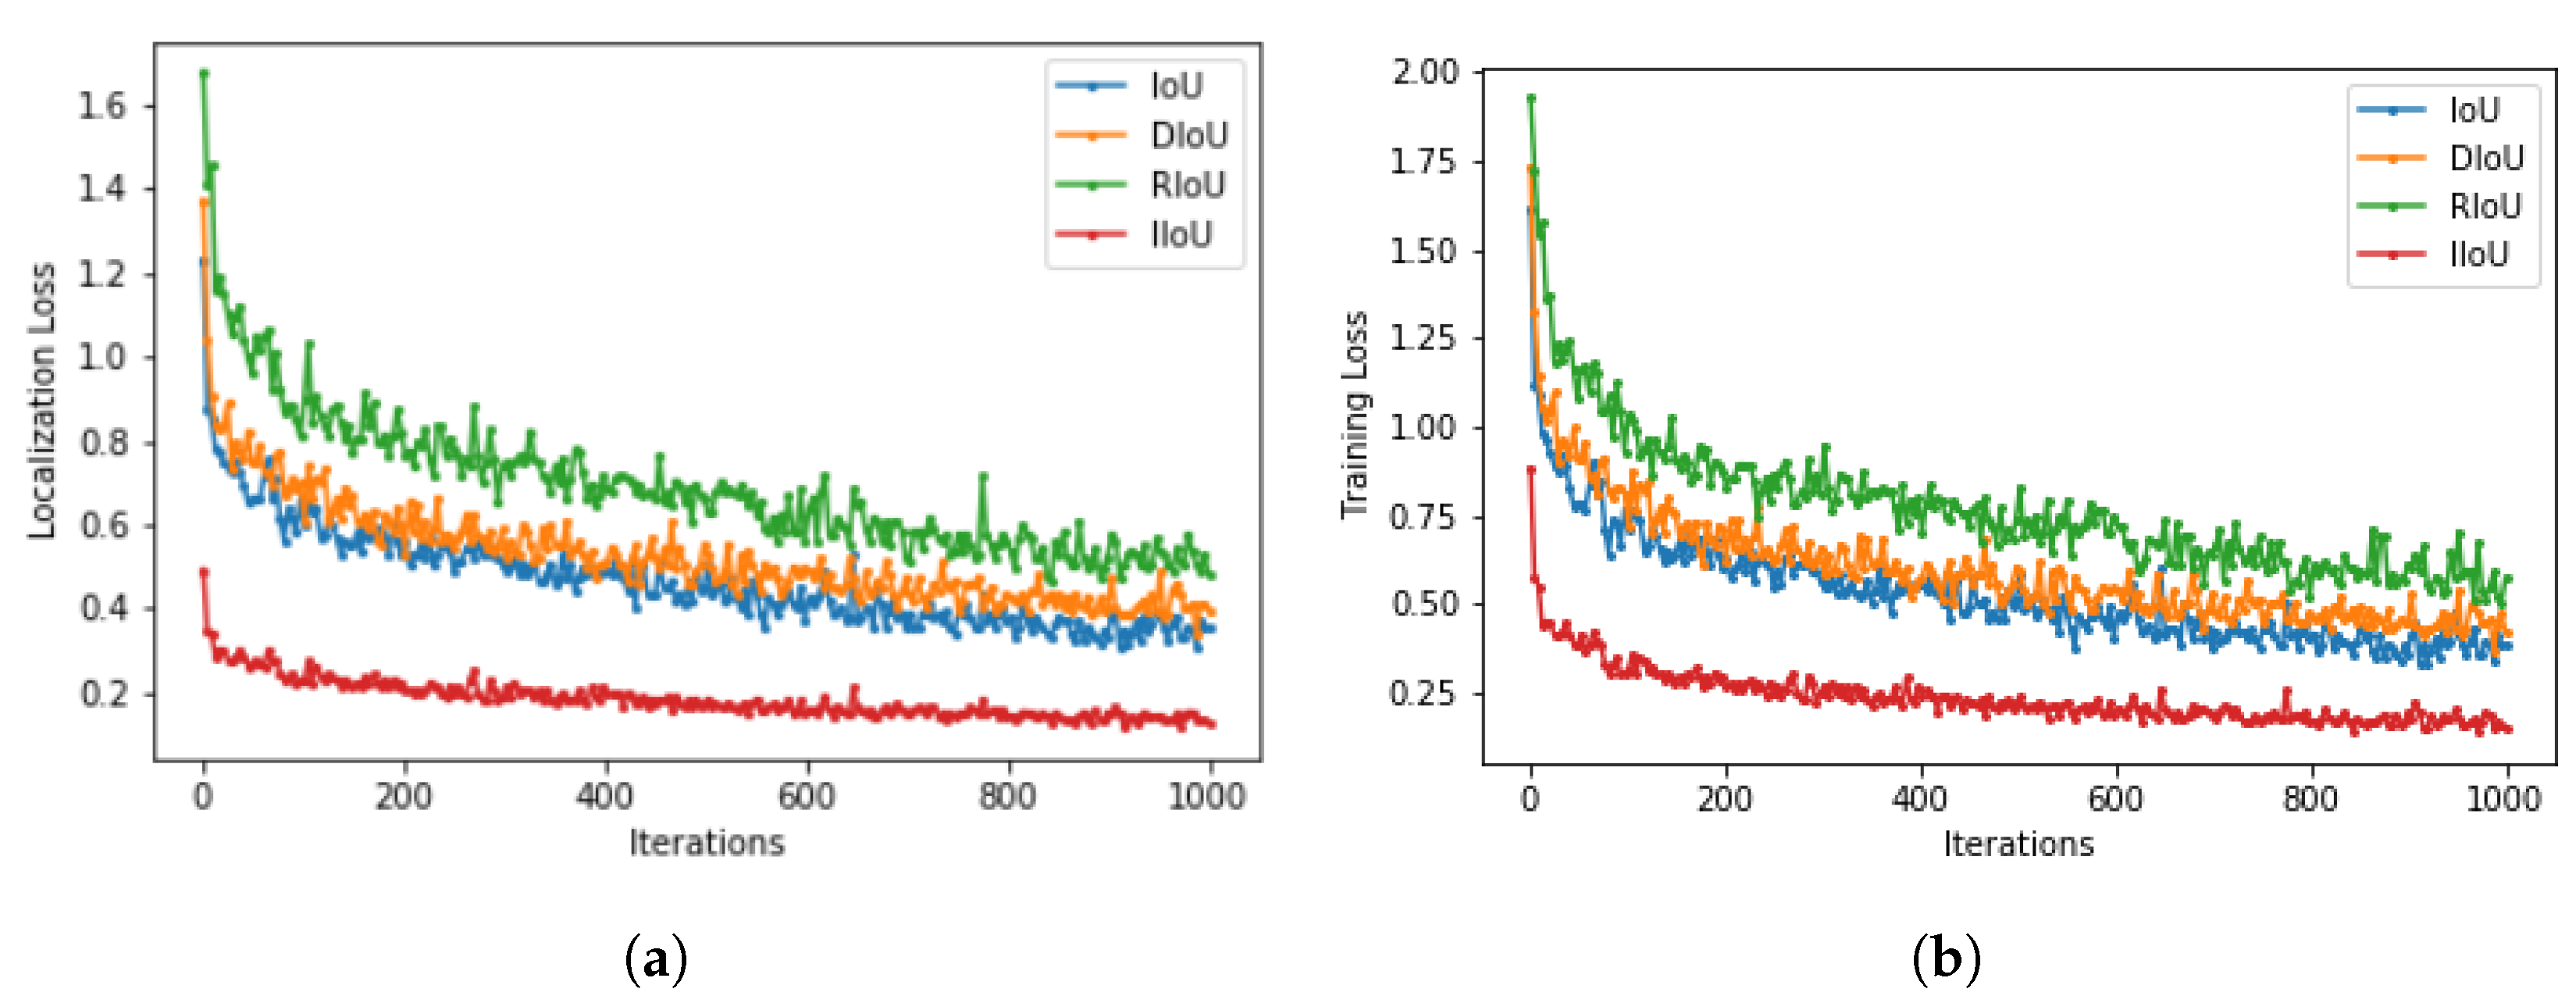
Figure 3 displays the loss convergence of IoU, DIoU, RIoU, and proposed IIoU loss.
Figure 3a represents the localization loss estimation at each iteration step. IoU and DIoU almost converge at the same rate. However, the proposed IIoU loss converges much faster and minimizes the loss values.
Figure 3b showcases overall training loss. This sums up both classification and localization loss. Better convergence is observed at the proposed IIoU loss compared to IoU, DIoU, and RIoU losses.
Table 3 displays the improved performance of IIoU against IoU, DIoU, and RIoU losses in the 3D LiDAR detection network. The table shows that the DIoU loss performs well across all categories compared to the IoU loss. This is because DIoU loss considers center distance estimation and aids in better localization. However, RIoU loss shows consistent improvement compared to DIoU loss. Our proposed IIoU loss attains higher results in the 3D pedestrian class with an R.L. of 20%, 18.43%, and 11.63%. IIoU loss has the highest mAP of 76.27 when compared to its counterparts.
Table 4 and
Table 5 demonstrate the performance of the proposed loss function against IoU loss. NDS is a consolidated metric that captures metrics such as IoU, box location, size, and orientation. As we can observe, the NDS score of the proposed method has improved in both single-stage and two-stage LIDAR networks. Area Orientation Error (AOE) measures the difference in yaw angles between the ground truth and predictions, and ATE measures the Euclidean distance between the centers in 2D. A low AOE and ATE error from the proposed method indicates the network could regress the boxes more accurately. The classification accuracy is measured by AAE, which has improved in the two-stage LIDAR network.
For the next phase of evaluation and to compare our proposed method with other state-of-the-art detectors, the fusion network was trained with the proposed loss function using the KITTI train+val dataset. The total number of training samples was 7480. No additional data split and data augmentation were carried out. The train settings were kept constant throughout the execution across
Table 1,
Table 2 and
Table 3 and
Table 6.
Table 6 provides the evaluation results for the 3D pedestrian class across easy, moderate, and hard categories in the test set. Our proposed loss method achieves optimal performance in easy and hard categories, surpassing many state-of-the-art detectors such as PointGNN [
45], Frustum-PointPillars [
40] and Part-
[
52].
Discussion and Limitations: Machine learning, especially deep learning, has shown significant promise in feature extraction and pattern recognition, which could complement our geometric approach. For instance, integrating deep learning-based feature extraction with our IIoU loss could enhance the model’s ability to discern subtle variations in object orientation and position, leading to more accurate predictions. This integration could be in the form of a hybrid model where deep learned features inform the geometric bounding box adjustments, creating a synergy between abstract feature representation and concrete geometric calculation.
Recent research related to deep learning-based object detection comprehensively covered in paper [
72], and the advancements in ML-based geometric analysis as discussed by [
73], there is a growing trend towards combining geometric computations with ML methodologies for improved performance in spatial understanding tasks. Adopting a similar approach, we propose to extend our IIoU loss framework by incorporating ML elements, such as polynomial fitting or parametric regression models, to refine the bounding box parameters based on learned spatial features. This not only retains the intuitive clarity of our current geometric approach but also leverages the robustness of ML in handling complex patterns. Furthermore, to address the aspect of error control strategies in bounding box estimation, future work can be undertaken to integrate an error feedback mechanism into the algorithm proposed in this paper. This mechanism will utilize ML-based error estimation to adjust the bounding box parameters dynamically, ensuring a more precise and reliable detection outcome. By doing so, the gap between geometric intuitiveness and ML’s adaptive robustness can be addressed, thus enhancing the overall efficacy of our method in 3D object detection tasks.


