Abstract
Following the Internet of Things (IoT) and the Internet of Space (IoS), we are now approaching IoP (Internet of People), or the Internet of Individuals, with the integration of chips inside people that link to other chips and the Internet. Low latency is required in order to achieve great service quality in these ambient assisted living facilities. Failures, on the other hand, are not tolerated, and assessing the performance of such systems in a real-world setting is difficult. Analytical models may be used to examine these types of systems even in the early phases of design. The performance of aged care monitoring systems is evaluated using an M/M/c/K queuing network. The model enables resource capacity, communication, and service delays to be calibrated. The proposed model was shown to be capable of predicting the system’s MRT (mean response time) and calculating the quantity of resources required to satisfy certain user requirements. To analyze data from IoT solutions, the examined architecture incorporates cloud and fog resources. Different circumstances were analyzed as case studies, with four main characteristics taken into consideration. These case studies look into how cloud and fog resources differ. Simulations were also run to test various routing algorithms with the goal of improving performance metrics. As a result, our study can assist in the development of more sophisticated health monitoring systems without incurring additional costs.
1. Introduction
Currently, the Internet of Things (IoT) is one of the most powerful communication technologies of the 21st century. In the IoT environment, most electronic devices in our everyday life will be part of the internet due to their communication and computing skills. IoT represents the next important step for theInternet as it evolves from a substrate of communication that connects computers to one that connects and embraces objects of everyday life (things). In this context, there is another important concept, the Internet of People (IoP). According to the Internet of People (IoP) paradigm, there is a complex sociotechnical system where human beings, with their devices, are the main nodes of the network. User devices become proxies for their users in the cyber world. Devices communicate, exchange, and manage data on behalf of their users and must behave the way their human users would if they interacted in the physical world [,,].
The expansion in the number of connected mobile devices, sensors, and actuators has given rise to the term IoT []. IoT devices’ advanced connection technologies are making people’s daily lives more comfortable [,]. The areas are diverse, such as sports [], agriculture [], smart cities [], among others. Another area that has significantly benefited from IoT is the health arena [], even in critical scenarios such as smart hospitals []. IoT advancements can significantly benefit the most vulnerable people by monitoring their daily activities [,].
It is recommended that older adults maintain an independent lifestyle; however, they become more prone to accidents. Constant monitoring of the health state of the elderly is essential. There is a significant amount of research on monitoring systems for the elderly who live alone. The idea is to assist before any unforeseen situation occurs [,,,,]. For that, small data capture devices are not enough. Robust computational infrastructures are needed to process requests in realtime. Thus, IoT allows the creation of more precise treatments. The data are collected by wireless sensor networks (WSNs) or Body Sensor Networks (BSNs). WSNs/BSNs integrate autonomously spatially distributed sensors, cooperatively transmitting their data to remote servers. Sensors collect patients’ data and forward them to another piece of equipment (gateway) responsible for receiving and retransmitting the data. In a second moment, a gateway can route data to many distributed servers, local servers (e.g., edge computing), or to the cloud [,,]. BSNs are responsible for monitoring the elderly and notifying relatives and doctors in an emergency []. A large amount of generated data must have powerful computing resources to process data as fast as possible. The cloud and fog computing resources can be used in this scenario [].
Cloud computing is a centralized architecture and consists of large data centers located around the world. Furthermore, the cloud is more powerful than the fog regarding processing resources and storage capacity. However, the cloud is highly dependent on internet connections [,,,]. The fog extends cloud computing and its services to the network’s edge, thus, bringing together its advantages and benefits; it has other advantages such as low latency and less dependence on internet connections for data transmission.
In addition to fog computing comes edge computing operating directly in the device layer, performing some kind of processing, even if of little computational complexity, to further reduce the volume of communication, in addition to collaborating to provide autonomy in decision making in the layer of things. Evaluating the performance of the hybrid fog-cloud-edge architecture with real experiments sometimes is impracticable. Evaluating prototypes in real environments is financially costly and often not viable. Analytical models can be useful in this context, making predictions based on probabilities.
A queuing model or system can be briefly described as follows: form: users (or customers or customers) arrive to receive a certain service and, due to the impossibility of immediate assistance, they form a waiting list. The terms user and service are used here with a broad sense. We may refer to cars arriving at gas station toll booths, machines waiting to be fixed, parts following an assembly line, or messages transmitted through communication channels. The objective of queuing theory is to optimize the performance of a system, reducing its operating costs. For this, the system must meet some minimum performance criteria. This paper proposes to evaluate elderly monitoring systems using a queueing network model. The evaluated architecture includes a sensor network attached to a person generating data and using fog and a cloud as processing resources. Therefore, the main contributions of this paper are the following:
- A performance queuing model as a useful mechanism for health monitoring systems users focused on fog/cloud to evaluate the performance even in the initial stages of development. About 21 parameters can be calibrated.
- Load balancing analysis was performed considering the distribution of jobs between the cloud and the fog. Six strategies were tested, including random probabilities, round-robin, least utilization, JSQ (Join the Shortest Queue), and shortest response time. The routing strategy probabilities were more efficient with different arrival rates.
The remainder of this paper is organized as follows: Section 2 presents the most relevant related works on the topic and Section 3 describes the architecture considered for designing the model. Section 4 details the analytical model while Section 5 presents the results. Section 6 presents the model’s validation. Finally, Section 7 discusses the conclusions and suggestions for further works.
2. Related Works
Many publications in the literature relate to IoT-based e-health patient monitoring systems, their deployment architecture, and performance modeling. Oueida et al. [] proposed a resource preservation net (RPN) framework using Petri nets. The work presents a framework capable of generating non-consumable resource models that are theoretically described and validated. The work aims to measure some performance indicators of an intelligent hospital system with edge and cloud processing components. Among the performance metrics of the study, there is the patient’s length of stay (LoS), resources usage rate, and average waiting time. Santos et al. [] propose analytical models of Petri nets and Reliability Block Diagram (RBD) to assess the availability of an intelligent health monitoring system that depends on edge, fog, and cloud infrastructures. Santos et al. [] still use a multi-objective optimization algorithm (NSGA-II) to improve system availability, taking into account its cost as a limitation.
Greco et al. [] propose a technological and architectural solution based on Open Source big data technologies to perform realtime data flow analysis on wearable sensors. The architecture proposed by the work comprises four layers: the sensing layer, the preprocessing layer, the cluster processing layer, and the persistence layer. Each layer’s performance analysis was performed to gauge each layer’s memory and CPU usage. Chen et al. [] proposed an Edge-Cognitive-Computing-based (ECC-based) smart-healthcare system. The system can monitor and analyze the status of patients using cognitive computing. Furthermore, the system can allocate the use of resources according to the patient’s degree of risk. Experiments have shown that the system improves the user experience, optimizes the use of resources, and increases the patient’s survival chances in sudden emergencies.
Araujo(a) et al. [] proposed a high-level model capable of characterizing the behavior of an mHealth system. The objective of the work is to identify the probability of a system message being delivered in a t time. The paper does not analyze availability, but some parts of the model are characterized as an availability model. Lisboa et al. [] propose a patient monitoring architecture using sensors and cloud and fog processing. The work also presents a sensitivity analysis that identifies the components that most impact system availability. Santos et al. [] also propose a monitoring architecture using cloud and fog. However, Ref. [] extends the idea of [] and adds a model that can calculate performance metrics and identify possible bottlenecks in the system.
Rodrigues et al. [] propose models capable of calculating performance and availability metrics in a smart hospitals system. The work presents a performance model capable of calculating Mean Response Time, Resource Utilization, and Discard. The work also presents an availability model and performs a sensitivity analysis on this model. The results show optimal settings for system performance and availability.
Sallam et al. [] proposed an intelligent fog computing scheduling model that offers service-provisioning for IoT while reducing the latency. A case study with a critical healthcare application (An electrocardiogram (ECG)) has also been presented. The objective was to optimally schedule the requests of ECG sensors on a fog environment and proficiently handle their demands on existing resources for each fog node. The proposed model was evaluated using the iFogSim toolkit in terms of delay performance metric. The results show that the proposed model performance outperformed the existing approaches.
There is a contrast to the related work as seen above. The proposed queueing model analyzes the performance of the health monitoring system considering different contexts, architecture, and workload. There is a consideration of cloud computing conditions and capabilities and cloud resources. The model can be used to calculate the performance of healthcare systems and define required computing resources, including IoT workload. The proposed approach can handle strict QoS requirements using the optimal computation needed for processing generated health data. The model does not depend on a workload type or require knowledge about services running on a remote cloud. To the best of the authors’ knowledge, the scaling of computing resources in cloud and fog environments in the healthcare context has not been studied previously in the literature using the queuing model and all explored metrics.
3. Evaluated Scenario
Physicians used to make healthcare judgments solely primarily on personal experience, patient indications and symptoms, healthcare professional expertise, and diagnostic laboratory analysis. The Internet of Medical Things (IoMT) devices has emerged as a critical tool for clinicians in obtaining accurate data and making more precise diagnoses. Realtime monitoring of people’s health is one of the approaches to delivering health services based on the IoT paradigm. Health monitoring systems are commonplace, and they may collect data from IoMT devices and deliver it to a gateway via a wireless communication protocol. The medical team and family members can analyze vital signs data via the WBAN (Wireless Body Area Network). From clinical treatment to chronic illness prevention and control, WBAN systems are critical in healthcare systems. These technologies, for example, are used to track and treat cardiovascular illness in realtime [].
Figure 1 shows the proposed scenario for health, assisted ambient living [], and wellbeing monitoring system for elderly people based on IoT, which was developed based on the architecture presented in []. Wearable sensors collect vital patient information. Contextual information, such as date, time, location, and temperature, can be added to this data. Health practitioners can spot unexpected trends and draw assumptions about the elderly’s status by understanding the setting.
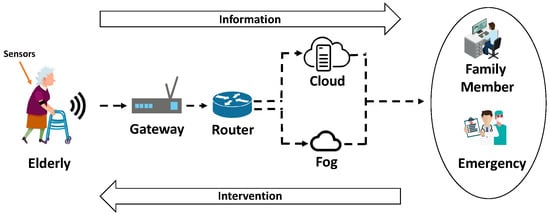
Figure 1.
Scenario illustration of a health monitoring system for elderly people.
This scenario includes sensors, gateways, routers, fog, cloud, communication with family members’ devices, and an emergency unit. Sensors collect biological and contextual signals from the bodies of patients and their surroundings. Falls, heart attacks, and other causes can be detected using this data, which are supplied to the gateway using wireless communication protocols. A gateway must handle a variety of communication protocols as a point of contact between the WSN and the router. A gateway may collect data from several subnets, convert communication protocols, and provide additional higher-level services like data aggregation, filtering, and so on []. A router is responsible forthe load balancing strategy. When receiving gateway data, the router must decide whether to send it to the fog or the cloud. Both the cloud and the fog present their benefits. The cloud usually is more vital than fog in terms of resource capabilities; however, the fog is positioned closer to sensor and actuator devices. In emergency, cloud/fog stores data and sends an alert to an emergency unit and the elderly’s family members. Family members’ devices and the emergency unit can be smartphones, tablets, or other devices, ensuring that the alert reaches its destination.
4. Queuing Model
Figure 2 presents a theory-based queuing model for the specified architecture. The term “theory-based” refers to Queue Theory, which was used as the basis for the model development. As aforementioned, the JMT tool was used, which allows the development of models based on queueing theory. In the model, there are two entry points and two departure points. There are also five lineups with related services and four transfer times displayed. Table 1 lists all the model’s components.
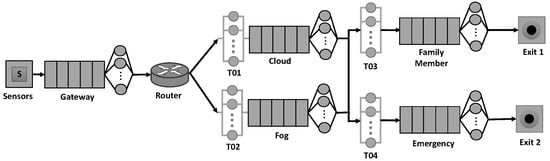
Figure 2.
Analytical model to assess a health monitoring scenario.

Table 1.
Description of the model components.
The recommended model shows the service time for each component. The data flows from left to right. Within a preset period, sensors generate requests based on a probabilistic distribution. These requests need a service time based on the time it takes to collect and transport data from the sensors when they arrive at the gateway. Transmission 1 (T01) is a component that simulates a network delay by delaying the transmission of a request. It lacks a clearly defined service. The data is sent from the gateway to the router, determining whether it should be sent to the fog or the cloud. Cloud and fog service time refer to the time it takes to save data and communicate them to other analytic services so that warning signals may be sent out. While the fog is closer to the sensors, the cloud is often stronger. After processing in the cloud/fog, the model contains two more connections, transmissions 03 and 04, used in the model. Both the cloud and the fog can send information or alerts to a family member or in the event of an emergency. Following the end of the data processing loop, there are two options for exit (Exit 1 and Exit 2). Exit 1 indicates that data processing is complete before reaching the Family Member. When an emergency occurs, Exit 2 signals the end of data processing.
The arrival rate assumes that the times between the arrivals of each service in the system are independent and exponentially scattered. A FIFO (First-In, First-Out) queueing discipline is expected to be used to manage health data received in each component of the overall system. To replicate the Gateway, Cloud, Family Member, and Emergency, the M/M/c/K queue model is employed. The M/M/c/K model refers to the c service stations (servers). Each service station has a maximum capacity of (K) nodes. Finally, the concept may be used by anybody who requires realtime monitoring, not only the elderly.
5. Numerical Analysis
Numerical analyses based on the suggested model are presented in this section. The proposed scenario was modeled and evaluated using the Java Modeling Tools (JMT) [] tool. JMT is a set of open-source tools for simulating and evaluating the performance of communication networks, based mostly on queue theory []. The input parameters for each model component are listed in Table 2. Almeida et al. [] and Debauche et al. [] were used to retrieve the parameters in Table 2. The queue capacity of each component is also included in the table. The X tag denotes the absence of a queue capacity definition for the component.
Table 2.
Model configuration parameters for numerical analysis.
The next sections present four use cases (A, B, C and D). In all the cases, the arrival rate (AR) was changed from 0.1 jobs/milliseconds (j/ms) to 1.0 j/ms in increments of 0.1 j/ms. In scenario A, the number of parallel processing nodes using three capacities of the cloud is varied. In scenario B, the nodes number in the fog following the same pattern is changed. In scenario C, the experiments use only the cloud or the fog and use both together. In scenario D, the routing strategy aiming to identify the most efficient load balancing method when deciding to distribute jobs between cloud and fog is changed. The four scenarios are illustrated in Figure 3.
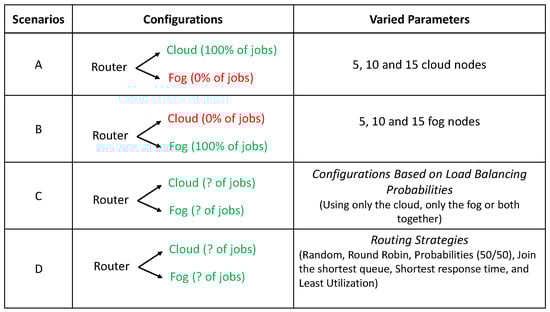
Figure 3.
Overview of the four evaluated scenarios. Color green indicates that the request will be transmitted to that target whereas color red means the opposite.
5.1. Scenario A—Analysis of Cloud Resources Variation
The results of detecting cloud resource capabilities fluctuation are shown in Figure 4. It’s important to note that the fog in this instance was localized. The MRT reflects the system’s responsiveness. The MRT tends to be smaller as resources increase; however, this trend is not always visible. The findings for MRT are shown in Figure 4a. Smaller MRTs were obtained in situations with fewer resources. However, the findings for 10 and 15 nodes were extremely comparable. The MRT becomes substantially greater owing to AR only when resources are reduced to five nodes. The proximity of MRT to 10 and 15 shows that using just 10 compute nodes may be more beneficial and cost-effective. AR has a greater influence on fewer resources (five nodes).
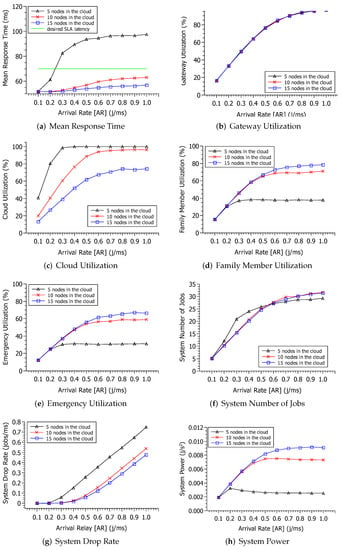
Figure 4.
Analysis results varying the arrival rate of new requests.
The MRT exhibits a minimal significant rise as the workload grows for 10 and 15 nodes. This suggests that between 10 and 15 nodes are sufficient to fulfill the moderately high demand of up to 1.0 j/ms with an MRT of 50 to 60 ms. The slowdown of MRT growth owing to AR is a tendency that can be seen in all three situations. From AR = 0.5 j/ms, the MRT growth tends to plateau. This AR = [0.5 j/ms–1.0 j/ms] range can be utilized to provide infrastructure customers with an MRT that is not reliant on AR. With 15 nodes, the average would be around 55 milliseconds. For 15, 10, and 5 nodes, the MRT is 56 ms, 61 ms, and 95 ms, respectively, at the extreme point of most substantial demand (AR = 1.0 j/ms). According to one concept, a user will typically accept an MRT of 70 ms []. If a Service Level Agreement (SLA) with MRT is restricted to 70 ms (see the green line in the picture), it is clear that five nodes with AR more than 0.3 j/ms would not be able to meet this time constraint.
Figure 4b shows the use of a gateway in the considered three scenarios. As the AR increases, the use of the gateway grows exponentially. The gateway has the same level of usage for all the cloud configurations. When the AR is equal to 0.1 j/ms, the gateway’s usage is approximately 16% for the three scenarios. However, after the AR exceeds 0.6 j/ms, the gateway starts to use approximately 90% of its capacity. When the AR reaches 1.0 j/ms, the gateway uses approximately 97% of its capacity for all cloud configurations. The gateway utilization growth tends to stagnate from AR = 0.6 j/ms until reaching its maximum utilization of approximately 97%. Considering the extreme point of most significant demand (AR = 1.0 j/ms), the gateway utilization did not reach 100%. However, it becomes impossible to meet more requests at this stage of processing without data loss.
Figure 4g shows the rate at which requests are dropped in the system. The increase in the drop rate is proportional to the arrival rate. The smaller the number of nodes, the higher the drop rate.
Both scenarios start running with the drop rate at 0, but in AR = 0.8 j/ms, scenario A starts to perform the drop, ascending to 0.9955 at AR = 2.0 j/ms. In scenario B, the discard will only start when the system reaches AR = 1.4 j/ms and proceeds upwards to 0.7936. Figure 4c presents the cloud utilization level. Again, utilization grows according to the AR. However, unlike the previous utilization, here, the lines are not overlapping. Changing the number of resources in the cloud directly impacts cloud utilization. With more nodes, cloud utilization is lower. At the starting point (AR = 0.1), the cloud utilization has similar values for 10 and 15 nodes. However, when the AR reaches 1.0 j/ms, the result for 10 nodes approaches five nodes. If the demand is deficient, five nodes are enough to avoid overloading the system, but five and 10 nodes will not be enough if the demand is high. Only after 15 nodes will utilization remain at 62%. Another critical observation is regarding the curves of growth stagnation. For five nodes, stagnation occurs from AR = 0.3 j/ms. For 10 and 15 nodes, stagnation occurs from AR = 0.7 j/ms.
Figure 4d,e show the use of the components Family Member and Emergency, respectively. The results were very similar, so the interpretation can be grouped. Again, the usage proportionally increases the AR. Unlike the use of the cloud, the greater the nodes number, the greater the utilization. When the number of resources in the cloud increases, more requests will pass. As the number of resources of such output components (Family Member and Emergency) does not change, such components are directly proportional to the number of nodes in the cloud. Initially, it is not possible to notice a difference in the utilization of the three scenarios. Only from AR = 0.2 j/ms does the utilization present different values. However, this distinction only becomes noticeable concerning 10 and 15 nodes when AR reaches 0.5 j/ms. When the AR reaches 1.0 j/ms, the utilization is approximately 37% (5 nodes), 71% (10 nodes), and 78% (15 nodes). Even with the AR equal to 1.0 j/ms, the user does not reach 100% due to the cloud’s dependence.
Figure 4f shows the jobs number in the system. The jobs number within the system increases as the AR increases, as jobs are queued for resource constraints. A slightly different result from the other two scenarios is considering five nodes. When the AR is lower, the system’s number is higher for five nodes than the other scenarios. When the AR becomes higher (>0.6 j/ms), the number of jobs in the system is lower for five nodes than in the other scenarios. Therefore, when the capacity is shallow and the workload is very high, data drop occurs, which results in fewer jobs within the system. It is worth mentioning that even with a very high arrival rate (1.0 j/ms), there are not very high numbers of accumulation of jobs in the system, with an average of 32 jobs.
Figure 4g shows the rate at which requests are discarded in the system. The increase in the discard rate is directly proportional to the arrival rate. The smaller the number of nodes, the higher the discard rate. Initially, with AR = 0.1 j/ms and AR = 0.2 j/ms, all scenarios have a rate of 0 discards. However, afterward, the result of the three scenarios is at odds. Only the scenarios with 10 and 15 nodes remained similar. In the worst case (five nodes), the maximum drop rate peak was 0.8 j/ms. This value may seem low but is equivalent to 2,880,000 jobs lost in just one hour.
Figure 4h presents an analysis to find the system’s ideal operational point, called system power. As previously mentioned, system power is obtained by dividing the throughput by the MRT. The system power increases proportionally to the increase in AR when the number of resources is higher (10 and 15 nodes). When the number of resources is lower, the power decreases slightly with AR increase. To understand this result, one must observe the MRT (Figure 4a). The MRT increases significantly as a function of RA. However, for 10 and 15 nodes, the MRT hardly changes. Therefore, as the system power is inversely proportional to the MRT, the system power decreases if the MRT increases. The increase in the system power to 10 and 15 nodes is conditioned to the throughput. Each of the three scenarios has its respective maximum system power points. For five nodes, it occurs when AR is at 0.2 j/ms. For 10 and 15 nodes, it occurs from AR = 0.6 j/ms.
5.2. Scenario B—Analysis of Fog Resources Variation
Figure 5 presents the results of observing the variation of fog resources capabilities. It is essential to mention that the cloud was isolated and not considered in this scenario. The MRT obtained by fog resources variation (see Figure 5a) was significantly distinct from the one obtained with cloud variation. First of all, the results here were higher than in the cloud variation scenario. Considering five nodes, the highest MRT was nearly 160 ms with the fog, whereas the cloud obtained 97 ms with the same number of nodes. This is explained by the cloud capacity—in terms of service time—being more efficient than the fog. The difference between 10 and 15 nodes in the cloud variation is more significant. Choosing 10 or 15 nodes carefully does matter when having only the fog as an available resource. The point where the MRT growth stagnates remains the same after 0.3 j/ms, meaning that after this point, the MRT will be the same, independent from the AR value. Ultimately, the hypothetical SLA of 70 ms (green line) would not be satisfied, not even with 15 fog nodes. Therefore, the designer should be aware that the users would not be delighted only with the fog.
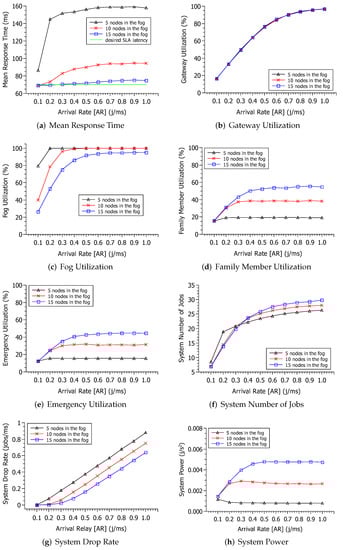
Figure 5.
Results for analysis of the fog resources variation.
Figure 5b shows the use of a gateway in the considered three scenarios. As the AR increases, the use of gateway grows exponentially. The gateway has the same level of usage for all configurations of fog. When the AR is equal to 0.1 j/ms, the gateway’s use is approximately 16% for the three scenarios. However, after the AR exceeds 0.6 j/ms, the gateway starts to use approximately 90% of its capacity. When the AR reaches 1.0 j/ms, the gateway uses approximately 97% of its capacity for all fog configurations. The gateway utilization growth tends to stagnate from AR = 0.6 j/ms until reaching its maximum utilization of approximately 97%. Considering the extreme point of most significant demand (AR = 1.0 j/ms), the gateway utilization did not reach 100%. However, it becomes impossible to meet more requests at this stage of processing without data loss.
Figure 5c presents the fog utilization. In the cloud’s previous scenario, the utilization has taken more time to reach high utilization levels. However, here in the fog scenario, with five and 10 nodes, the utilization achieved 100% with just 0.3 j/ms of AR. It is essential to mention, as well, that 15 nodes did not achieved the 100% utilization level. Another difference to the cloud scenario is that the fog results were close to each other almost in all AR points, meaning that it does not make much difference to choose one or another number of nodes after 0.6 j/ms of AR.
Figure 5d,e presents the utilization to the output components, family member, and emergency. Again, both results are presented together due to their similarities. The only difference between graphs is that the family member results are slightly higher than the emergency one. This difference may be explained by the service times. The family member is configured with a higher service time (see Table 2). More equidistant lines are observed comparing the cloud results, about 20% of the interval between the lines. Meanwhile, in the cloud, the results for 10 and 15 nodes were almost the same.
Figure 5f depicts the number of jobs in the system. The number of jobs within the system increases as the AR increases, as jobs are queued for resource constraints. A slightly different result from the other two scenarios is that of five nodes. When the AR is lower, the system’s number is higher for five nodes than the other scenarios. When the AR becomes higher (>0.35 j/ms), called the "changing point”, the number of jobs in the system is lower for five nodes than in the other scenarios. In the cloud scenario, this changing point happened later, around 0.6 j/ms. The authors believe that the higher drop rate levels explain this difference in the fog scenarios. Therefore, when the capacity is shallow and the workload is very high, data drop occurs, which results in fewer jobs within the system. It is worth mentioning that even with a very high arrival rate (1.0 j/ms), there are not very high numbers of accumulation of jobs in the system, with an average of 30 jobs.
Figure 5g shows the rate at which requests are discarded in the system. Initially, with AR = 0.1 j/ms, all scenarios have a rate of 0 discards. However, afterward, the results of the three scenarios are at odds. The three scenarios have different results. In the worst case (five nodes), the maximum drop rate peak is 0.9 j/ms.
Figure 5h presents an analysis to find the ideal operating point of the system. As previously mentioned, system power is obtained by dividing the throughput by the MRT. A higher number of capacity nodes result in higher system power because it increases and MRT decreases. Each of the three scenarios has its respective maximum system power points. For five nodes, it occurs when AR is at 0.1 j/ms; for 10 nodes, the maximized system power occurs at 0.3 j/ms and for 15 nodes occurs at 0.5 j/ms.
5.3. Scenario C—Analysis of Percentage Load Balancing Variation
This section presents the results considering a specific routing strategy based on distribution probabilities. Such a routing strategy is provided by the queue simulation JMT tool [] and enables us to set a specific load balancing probability to specific targets. Therefore, the router was configured in three ways, as follows:
- Cloud (100%) Fog (0%) [Only cloud]
- Cloud (0%) Fog (100%) [Only fog]
- Cloud (50%) Fog (50%) [Hybrid]
Figure 6 presents the results addressing the percentage load balancing variation. Figure 6a presents the results considering the MRT metric. The best result was to use only the cloud isolated. The results of the "only cloud” (black line) configuration ranged from 50 ms to 55 ms. The "only fog” (blue line) configuration obtained the second-best result. The only fog configuration had a mean of 60 ms. The hybrid configuration resulted in the worst MRT, with a mean of more than 70ms. Observing the desired SLA latency (green line), the hybrid configuration would not attend such a requirement for AR ≥ 0.3 j/ms.
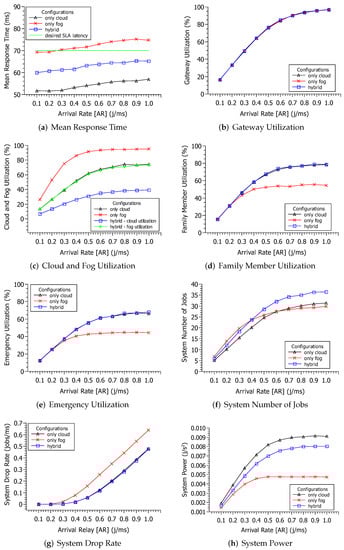
Figure 6.
Results changing the arrival rate with distinct load balancing distributions.
Figure 6b shows the gateway utilization. As the AR increases, the use of the gateway grows exponentially. The gateway has the same level of usage for all configurations. When the AR is equal to 0.1 j/ms, the gateway’s use is approximately 16% for the three configurations. However, after the AR exceeds 0.8 j/ms, the gateway starts to use approximately 90% of its capacity. When the AR reaches 1.0 j/ms, the gateway uses approximately 97% of its capacity for all configurations.
Figure 6c shows the utilization to the fog and cloud. The utilization increases proportionally to the AR growth. The highest utilization was when using only the fog. The more limited fog resources explain this. The second highest utilization were two configurations: the only cloud (black line) and the hybrid configuration—fog utilization (green line). The hybrid configuration’s cloud utilization obtained the lowest resource utilization (blue line). Therefore, if the system designer intends to have low utilization, they must consider the hybrid configuration. In addition, as far as the cloud is more potent than the fog, the cloud’s utilization will be lower, taking into account similar parameters used in this work.
Figure 6d,e presents the utilization of family member and emergency components. Again, both results are shown together due to their similarities. The family member’s utilization is slightly higher than the emergency component due to the service time difference. The two previous configurations (A and B) significantly differed between the utilization levels. However, the only cloud configuration and the hybrid one had the same result here. The utilization of the "only fog” is lower because, in this case, the drop rate is higher (see Figure 6g), and fewer jobs pass by the output components. In any case, none of the three utilizations achieved the 100% level.
Figure 6f presents the system number of jobs in the system. The number of jobs increases proportionally to the AR growth. The number of jobs in the “only cloud” configuration is lower than the hybrid one. This fact can be explained because the “only cloud” has obtained the lowest MRT result (see Figure 6a), meaning that fewer jobs remain inside the system. The “only fog” system number of jobs was lower than the hybrid one as well. However, this is caused by the high drop rate of the "only fog” configuration (Figure 6g). Therefore, the drop rate of the “only fog” is higher than the other two configurations, indicating that the fog resources are less efficient considering AR higher than 0.3 j/ms. The drop rate of the only cloud and the hybrid are the same because even with only 50% of the cloud, the resources are enough to meet the demand.
Finally, Figure 6h presents system power. The system power with a lower arrival rate is almost the same as the three configurations. Only after AR = 0.5 j/ms are the differences are more perceptive. Again, only fog presents the worst result. The highest system power is achieved in the three configurations after AR ≥ 0.8 j/ms.
5.4. Scenario D—Analysis of Routing Strategies Variation
This section analyses the results of experimenting with distinct routing strategies with different arrival rates observing the MRT. The adopted routing strategies are provided by the simulation tool JMT []. The used strategies are summarized as follows:
- Random: Jobs are directed to one of the stations related to the considered station in output at random. The outbound connections are chosen with the same probability as the inbound links. Each output link in a model with three output connections has a chance of 1/3.
- Probabilities: Each outbound link’s routing probability must be determined. The total number of probabilities must equal one. The 50/50 balance is used in this experiment.
- Round Robin: According to a circular routing, jobs are cyclically sent to the outgoing connections.
- Least Utilization: At the moment of routing, the destination station is picked as the one with the least amount of traffic.
- Join the Shortest Queue (JSQ): (sometimes referred to as Shortest Queue Length) At the moment the job leaves the routing station, each work is routed to the station connected in output that has the fewest number of jobs in the queue or service.
- Shortest Response time: When work leaves the routing station, it is dispatched to the station with the shortest response time for the job’s class.
Figure 7 shows the calculated MRT mean to the six routing strategies considering three arrival rates (0.1 j/ms, 0.5 j/ms, and 1.0 j/ms). Let us focus on the highest and lowest MRTs. The highest MRTs were reached with the shortest response time in all three arrival rates. Since the cloud’s service time and the fog and respective transmission times are not so different, such instantaneous calculated shortest response time might be highly sensitive. The lowest MRT was obtained with two routing strategies depending on the arrival rate. The routing strategy "probabilities” was more efficient with the lowest (0.1 j/ms) and the highest (1.0 j/ms) arrival rates. Therefore, considering similar parameters as this study, the system designer should consider using such a routing strategy with extreme workloads (low and high). The arrival rate of 0.5 has obtained a different result, in which the random routing strategy has been spotlighted among the others.
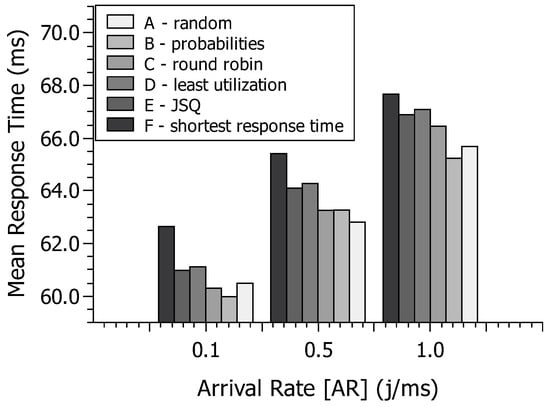
Figure 7.
Results changing the arrival rate with routing strategies variation.
5.5. Results Summary Numerical Analysis
Comparing the results of scenarios A and B, it is evident that the behavior of all metrics is similar in both simulations. Looking at the metrics closely, the MRT of the cloud is higher than in the fog, and the distance between the results with 10 and 15 nodes is higher in the fog scenario. We believe that such a fact happens because both system components (cloud and fog) reside on the same system level. What distinct cloud and fog is essentially the processing power and localization.
Therefore, it is worth investing in increasing the number of fog nodes.
In scenario C, the objective was to observe the impact of distribution based on probabilities. Although scenarios A and B have shown the metrics as isolated resources, it was interesting to see the comparison with the hybrid possibility in the same graphs. The conclusion, in this case, was that the hybrid configuration is not advantageous considering the MRT, but the hybrid configuration resulted in a lower drop rate.
Scenario D has shown distinct routing strategies with different arrival rates observing the MRT. However, they are the more classic used routing strategies used in the literature. The limitation of the experiment was that we could only use the algorithms provided by the JMT tool. The round-robin strategy is highly adopted in the context of the distributed system, but it resulted in the fourth-best result. The lowest MRT was obtained with two routing strategies depending on the arrival rate. The routing strategy “probabilities” was more efficient with the lowest565(0.1 j/ms) and the highest (1.0 j/ms) arrival rates. Therefore, considering similar parameters as this study, the system designer should consider using such a routing strategy with extreme workloads (low and high).
6. Model Validation
This section discusses the validation of the proposed model. We constructed a prototype to test our proposed model, which allows us to compare the MRT calculated by the model to the MRT achieved in real-world experiments. Figure 8 depicts the experiment’s setup. There have been several omissions. In the validation scenario, we simulate the existence of a request generator, a gateway, a router, a fog, and a cloud. Four fog/cloud cores, each with its container, are available. The request is divided across the containers using a round-robin technique. We used the sixth machine as a world clock. A synthetic system (Request generator) was constructed to send requests with an exponential distribution. The configuration of the machines used to do the validation, as well as their respective functions, are presented in Table 3.
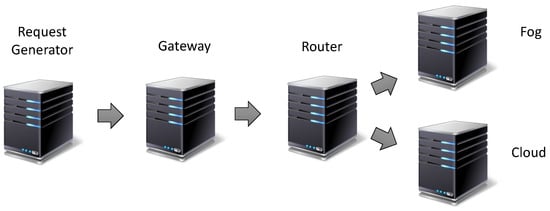
Figure 8.
Practical experiment outline.
Table 3.
Machines’ configuration.
All graphics were generated according to the results extracted from the JMT tool. Only the validation has used an application prototype developed in Java. The validation code is available on Bitbucket (https://bitbucket.org/laecioandrade/simulatorcode/src/master/, accessed on 20 December 2021).
The service times obtained in this experiment were entered into the model. Each request is a file containing a 10,000 × 10,000 matrix filled with random data in the experiment. The request generator simulates many consumers sending requests at once, and the router gets them all at once and distributes them among the fog/cloud, which then distributes them among the inner containers. To guarantee that the results were reliable, we repeated the experiment 30 times.
We utilized the one-sample t-test (sample t-test https://tinyurl.com/yanthw4e, accessed on 20 December 2021) to compare the MRT generated by the model with the MRT obtained in the tests. Normal distribution was found in all of the samples. To check if the t-test was significant, we looked at the p-value. The results are presented in Table 4. The p-value in each case was more than 0.05. As a result, we cannot reject the null hypothesis of equality with 95 percent confidence in all circumstances. As a result, we may deduce that the model’s output is statistically identical to the outcome of the experiment. Because it is based on reality, the model is useful for planning IoMT designs.
Table 4.
Validation Results.
Given the consistency of the data obtained during the experiment, one may infer that the model is dependable and accurate. The estimated value of the model is within the experimental error range. Because it is based on reality, the model is useful for planning IoMT designs.
7. Conclusions and Future Works
This study presented an M/M/c/K queueing model to depict and assess a health monitoring scenario (ambient assisted living) for the elderly. IoT sensors and cloud/fog distant resources were included in the analyzed design. The model may be used to calculate various measures, including mean reaction time, utilization level, drop rate, and the link between throughput and mean response time. The numerical analysis looked at four different possibilities. Three of them experimented with different fog/cloud resource capabilities, while one examined different routing tactics. We observed the association between the arrival rate and cloud/fog capacity fluctuation from various viewpoints thanks to the numerical analysis. Furthermore, according to the study, even if a fog was closer to the sensors, the cloud was more efficient for remote processing. The established results also show that the mean response time was highly dependent on message queuing in the components. Depending on the component’s position in the system, the drop rate and utilization level may grow or decrease. The random and fixed probability strategies were the most efficient when it came to routing techniques. However, because the model has 21 parameters, it may be used for various additional analyses.
The model will be extended in the future to investigate alternative methods of communication between the components. More components, such as more than one cloud, can be added (considering public, private, and hybrid). Furthermore, the nature of queues can be altered, with or without limits. We also want to look at the security implications of such a system.
Author Contributions
Conceptualization, L.R. and F.A.S.; Data curation, A.d.B.S.; Funding acquisition, L.R. and F.A.S.; Investigation, A.d.B.S.; Methodology, J.J.P.C.R.; Project administration, F.A.S.; Resources, J.J.P.C.R.; Software, L.R. and A.d.B.S.; Supervision, F.A.S.; Validation, L.R., J.J.P.C.R. and F.A.S.; Visualization, J.J.P.C.R. and A.d.B.S.; Writing—original draft, L.R.; Writing—review & editing, J.J.P.C.R., A.d.B.S. and F.A.S. All authors have read and agreed to the published version of the manuscript.
Funding
This research received no external funding.
Data Availability Statement
Not Applicable, the study does not report any data.
Acknowledgments
This work is partially supported by FCT/MCTES through national funds and, when applicable co-funded EU funds under the Project UIDB/50008/2020; and by Brazilian National Council for Scientific and Technological Development - CNPq, via Grant No. 313036/2020-9.
Conflicts of Interest
The authors declare no conflict of interest.
References
- Conti, M.; Passarella, A.; Das, S.K. The Internet of People (IoP): A new wave in pervasive mobile computing. Pervasive Mob. Comput. 2017, 41, 1–27. [Google Scholar] [CrossRef]
- Conti, M.; Passarella, A. The Internet of People: A human and data-centric paradigm for the Next Generation Internet. Comput. Commun. 2018, 131, 51–65. [Google Scholar] [CrossRef]
- Archana, P.; Spoorthi, M.; Vishalakshi, S.; Gururaj, H.; Praveena, K. Internet of People (IoP): A case study on Retail Application. In Proceedings of the 2019 1st International Conference on Advances in Information Technology (ICAIT), Chikmagalur, India, 25–27 July 2019; pp. 301–307. [Google Scholar]
- Atzori, L.; Iera, A.; Morabito, G. The internet of things: A survey. Comput. Netw. 2010, 54, 2787–2805. [Google Scholar] [CrossRef]
- Rodrigues, J.J.; Jabbar, S.; Abdallah, M.; Verikoukis, C.; Guizani, M. Future Communication Trends toward Internet of Things Services and Applications. IEEE Wirel. Commun. 2019, 26, 6–8. [Google Scholar] [CrossRef]
- Santos, G.L.; Gomes, D.; Kelner, J.; Sadok, D.; Silva, F.A.; Endo, P.T.; Lynn, T. The internet of things for healthcare: Optimising e-health system availability in the fog and cloud. Int. J. Comput. Sci. Eng. 2020, 21, 615–628. [Google Scholar] [CrossRef]
- Ray, P.P. Internet of Things for Sports (IoTSport): An architectural framework for sports and recreational activity. In Proceedings of the 2015 International Conference on Electrical, Electronics, Signals, Communication and Optimization (EESCO), Visakhapatnam, India, 24–25 January 2015; pp. 79–83. [Google Scholar]
- Boursianis, A.D.; Papadopoulou, M.S.; Diamantoulakis, P.; Liopa-Tsakalidi, A.; Barouchas, P.; Salahas, G.; Karagiannidis, G.; Wan, S.; Goudos, S.K. Internet of Things (IoT) and Agricultural Unmanned Aerial Vehicles (UAVs) in Smart Farming: A Comprehensive Review. Internet Things 2020, 100187. [Google Scholar] [CrossRef]
- Vinayakumar, R.; Alazab, M.; Srinivasan, S.; Pham, Q.V.; Padannayil, S.K.; Simran, K. A visualized botnet detection system based deep learning for the Internet of Things networks of smart cities. IEEE Trans. Ind. Appl. 2020, 56, 4436–4456. [Google Scholar] [CrossRef]
- Rodrigues, J.J.; Segundo, D.B.D.R.; Junqueira, H.A.; Sabino, M.H.; Prince, R.M.; Al-Muhtadi, J.; De Albuquerque, V.H.C. Enabling technologies for the internet of health things. IEEE Access 2018, 6, 13129–13141. [Google Scholar] [CrossRef]
- Fischer, G.S.; da Rosa Righi, R.; de Oliveira Ramos, G.; da Costa, C.A.; Rodrigues, J.J. ElHealth: Using Internet of Things and data prediction for elastic management of human resources in smart hospitals. Eng. Appl. Artif. Intell. 2020, 87, 103285. [Google Scholar] [CrossRef]
- Tun, S.Y.Y.; Madanian, S.; Mirza, F. Internet of things (IoT) applications for elderly care: A reflective review. Aging Clin. Exp. Res. 2020, 33, 855–867. [Google Scholar] [CrossRef]
- Pinheiro, P.R.; Pinheiro, P.G.C.D.; Holanda Filho, R.; Barrozo, J.P.; Rodrigues, J.J.; Pinheiro, L.I.; Pereira, M.L. Integration of the Mobile Robot and Internet of Things to Monitor Older People. IEEE Access 2020, 8, 138922–138933. [Google Scholar] [CrossRef]
- Ali, M.; Ali, A.A.; Taha, A.E.; Dhaou, I.B.; Gia, T.N. Intelligent autonomous elderly patient home monitoring system. In Proceedings of the ICC 2019-2019 IEEE International Conference on Communications (ICC), Shanghai, China, 20–24 May 2019; pp. 1–6. [Google Scholar]
- Richard, A.A.R.; Sadman, M.F.; Mim, U.H.; Rahman, I.; Zishan, M.S.R. Health monitoring system for elderly and disabled people. In Proceedings of the 2019 International Conference on Robotics, Electrical and Signal Processing Techniques (ICREST), Dhaka, Bangladesh, 10–12 January 2019; pp. 677–681. [Google Scholar]
- Anitha, G.; Priya, S.B. Posture based health monitoring and unusual behavior recognition system for elderly using dynamic Bayesian network. Clust. Comput. 2019, 22, 13583–13590. [Google Scholar] [CrossRef]
- Silverio, A.A.; Silverio, A.A.; Remot, A.M. Low-Cost Elderly Healthcare Monitoring System. J. Phys. Conf. Ser. 2020, 1529, 32061. [Google Scholar] [CrossRef]
- Almeida, A.; Mulero, R.; Rametta, P.; Urošević, V.; Andrić, M.; Patrono, L. A critical analysis of an IoT—Aware AAL system for elderly monitoring. Future Gener. Comput. Syst. 2019, 97, 598–619. [Google Scholar] [CrossRef]
- Rahmani, A.M.; Gia, T.N.; Negash, B.; Anzanpour, A.; Azimi, I.; Jiang, M.; Liljeberg, P. Exploiting smart e-Health gateways at the edge of healthcare Internet-of-Things: A fog computing approach. Future Gener. Comput. Syst. 2018, 78, 641–658. [Google Scholar] [CrossRef]
- Araujo, C.; Silva, F.; Costa, I.; Vaz, F.; Kosta, S.; Maciel, P. Supporting availability evaluation in MCC-based mHealth planning. Electron. Lett. 2016, 52, 1663–1665. [Google Scholar] [CrossRef] [Green Version]
- Dos Santos, G.B.; Trinta, F.A.; Rego, P.A.; Silva, F.A.; De Souza, J.N. Performance and energy consumption evaluation of computation offloading using caos d2d. In Proceedings of the 2018 IEEE Global Communications Conference (GLOBECOM), Abu Dhabi, United Arab Emirates, 9–13 December 2018; pp. 1–7. [Google Scholar]
- Hussain, A.; Wenbi, R.; da Silva, A.L.; Nadher, M.; Mudhish, M. Health and emergency-care platform for the elderly and disabled people in the Smart City. J. Syst. Softw. 2015, 110, 253–263. [Google Scholar] [CrossRef]
- da Silva, F.A.P.; Neto, P.A.d.M.S.; Garcia, V.C.; Assad, R.E.; Trinta, F.A.M. Accounting models for cloud computing: A systematic mapping study. In Proceedings of the 8th International Conference on Grid Computing and Applications (GCA), Las Vegas, NV, USA, 16–19 July 2012. [Google Scholar]
- Wang, G.; Ng, T.E. The impact of virtualization on network performance of amazon ec2 data center. In Proceedings of the 2010 Proceedings IEEE INFOCOM, San Diego, CA, USA, 14–19 March 2010. [Google Scholar]
- Silva, F.A.; Zaicaner, G.; Quesado, E.; Dornelas, M.; Silva, B.; Maciel, P. Benchmark applications used in mobile cloud computing research: A systematic mapping study. J. Supercomput. 2016, 72, 1431–1452. [Google Scholar] [CrossRef]
- Silva, F.A.; Maciel, P.; Matos, R. SmartRank: A smart scheduling tool for mobile cloud computing. J. Supercomput. 2015, 71, 2985–3008. [Google Scholar] [CrossRef]
- Oueida, S.; Kotb, Y.; Aloqaily, M.; Jararweh, Y.; Baker, T. An edge computing based smart healthcare framework for resource management. Sensors 2018, 18, 4307. [Google Scholar] [CrossRef] [Green Version]
- Greco, L.; Ritrovato, P.; Xhafa, F. An edge-stream computing infrastructure for real-time analysis of wearable sensors data. Future Gener. Comput. Syst. 2019, 93, 515–528. [Google Scholar] [CrossRef]
- Chen, M.; Li, W.; Hao, Y.; Qian, Y.; Humar, I. Edge cognitive computing based smart healthcare system. Future Gener. Comput. Syst. 2018, 86, 403–411. [Google Scholar] [CrossRef]
- Araujo, J.; Silva, B.; Oliveira, D.; Maciel, P. Dependability evaluation of a mhealth system using a mobile cloud infrastructure. In Proceedings of the 2014 IEEE International Conference on Systems, Man, and Cybernetics (SMC), San Diego, CA, USA, 5–8 October 2014; pp. 1348–1353. [Google Scholar]
- da Silva Lisboa, M.F.F.; Santos, G.L.; Lynn, T.; Sadok, D.; Kelner, J.; Endo, P.T. Modeling the availability of an e-health system integrated with edge, fog and cloud infrastructures. In Proceedings of the 2018 IEEE Symposium on Computers and Communications (ISCC), Natal, Brazil, 25–28 June 2018; pp. 00416–00421. [Google Scholar]
- Santos, G.L.; Endo, P.T.; da Silva Lisboa, M.F.F.; da Silva, L.G.F.; Sadok, D.; Kelner, J.; Lynn, T. Analyzing the availability and performance of an e-health system integrated with edge, fog and cloud infrastructures. J. Cloud Comput. 2018, 7, 1–22. [Google Scholar] [CrossRef] [Green Version]
- Rodrigues, L.; Gonçalves, I.; Fé, I.; Endo, P.T.; Silva, F.A. Performance and availability evaluation of an smart hospital architecture. Computing 2021, 103, 2401–2435. [Google Scholar] [CrossRef]
- Sallam, A.; Almohammedi, A.A.; Gaid, A.S.; Shihab, Y.; Sadeq, M.; Abdulaziz, S.E.; Abduasalam, S.; Abdulhaleem, Y.; Shepelev, V. Performance Evaluation of Fog-Computing Based on IoT Healthcare Application. In Proceedings of the 2021 International Conference of Technology, Science and Administration (ICTSA), Taiz, Yemen, 22–24 March 2021; pp. 1–6. [Google Scholar]
- El Kafhali, S.; Salah, K. Performance modelling and analysis of Internet of Things enabled healthcare monitoring systems. IET Netw. 2018, 8, 48–58. [Google Scholar] [CrossRef]
- Garcia, N.M.; Rodrigues, J.J.P. Ambient Assisted Living; CRC Press: Boca Raton, FL, USA, 2015. [Google Scholar]
- Al-Khafajiy, M.; Baker, T.; Chalmers, C.; Asim, M.; Kolivand, H.; Fahim, M.; Waraich, A. Remote health monitoring of elderly through wearable sensors. Multimed. Tools Appl. 2019, 78, 24681–24706. [Google Scholar] [CrossRef] [Green Version]
- Rahmani, A.M.; Thanigaivelan, N.K.; Gia, T.N.; Granados, J.; Negash, B.; Liljeberg, P.; Tenhunen, H. Smart e-health gateway: Bringing intelligence to internet-of-things based ubiquitous healthcare systems. In Proceedings of the 2015 12th Annual IEEE Consumer Communications and Networking Conference (CCNC), Las Vegas, NV, USA, 9–12 January 2015; pp. 826–834. [Google Scholar]
- Bertoli, M.; Casale, G.; Serazzi, G. JMT: Performance engineering tools for system modeling. ACM SIGMETRICS Perform. Eval. Rev. 2009, 36, 10–15. [Google Scholar] [CrossRef]
- Fishman, G.S. Discrete-Event Simulation: Modeling, Programming, and Analysis; Springer Science & Business Media: Berlin/Heidelberg, Germany, 2013. [Google Scholar]
- Almeida, A.; Mulero, R.; Patrono, L.; Rametta, P.; Urošević, V.; Andrić, M. A performance analysis of an IoT-aware elderly monitoring system. In Proceedings of the 2018 3rd International Conference on Smart and Sustainable Technologies (SpliTech), Split, Croatia, 26–29 June 2018; pp. 1–7. [Google Scholar]
- Debauche, O.; Mahmoudi, S.; Manneback, P.; Assila, A. Fog IoT for Health: A new Architecture for Patients and Elderly Monitoring. Procedia Comput. Sci. 2019, 160, 289–297. [Google Scholar] [CrossRef]
- Gopika Premsankar, M.d.F.; Taleb, T. Edge computing for the Internet of Things: A case study. IEEE Internet Things J. 2018, 5, 1275–1284. [Google Scholar] [CrossRef] [Green Version]
Publisher’s Note: MDPI stays neutral with regard to jurisdictional claims in published maps and institutional affiliations. |
© 2022 by the authors. Licensee MDPI, Basel, Switzerland. This article is an open access article distributed under the terms and conditions of the Creative Commons Attribution (CC BY) license (https://creativecommons.org/licenses/by/4.0/).