1. Introduction
Colorectal cancer (CRC) remains a leading cause of cancer-related mortality worldwide, with microsatellite-stable (MSS) tumors representing the majority of cases and showing poor responsiveness to current immunotherapies [
1]. CT26, a widely used murine CRC model, exhibits an MSS, mismatch repair-proficient phenotype, making it suitable for preclinical studies of immunotherapy-resistant CRC [
2]. Unlike microsatellite instability–high (MSI-H) tumors, MSS CRC exhibits an immunologically ‘cold’ tumor microenvironment (TME), characterized by impaired cytotoxic T lymphocyte (CTL) recruitment, accumulation of immunosuppressive tumor-associated macrophages (TAMs), and persistent secretion of cytokines and chemokines such as interleukin (IL)-17, granulocyte colony-stimulating factor (G-CSF), and IL-8 (CXCL1) [
1,
3]. These features establish a TAM-dominated, immune-excluded niche that is largely refractory to immune checkpoint inhibition, highlighting a critical unmet need for strategies that can both activate antitumor immunity and remodel suppressive TMEs [
4].
Addressing this therapeutic challenge requires strategies that simultaneously activate antitumor immunity and reprogram suppressive TAM populations. In this context, valosin-containing protein (VCP/p97) inhibition with CB-5083 (CB) disrupts proteostasis and induces endoplasmic reticulum (ER) stress (ERS), triggering immunogenic cell death (ICD) hallmarked by calreticulin exposure, HMGB1 release, and ATP secretion [
5]. Yet, systemic VCP inhibition may compromise antigen presentation and T cell priming [
6], highlighting the need for combinatorial approaches. miR-142, a PD-L1-targeting immunomodulatory microRNA, restores T-cell cytotoxicity, promotes M1-like macrophage polarization via HMGB1 modulation, and restrains epithelial–mesenchymal transition (EMT) through TGF-β signaling, thereby enhancing both innate and adaptive immunity [
5,
7]. Imiquimod (R837; R), a Toll-like receptor 7 (TLR7) agonist, further promotes dendritic cell (DC) maturation and Th1-skewed T cell activation, although systemic administration is limited by cytokine-mediated toxicity [
8,
9].
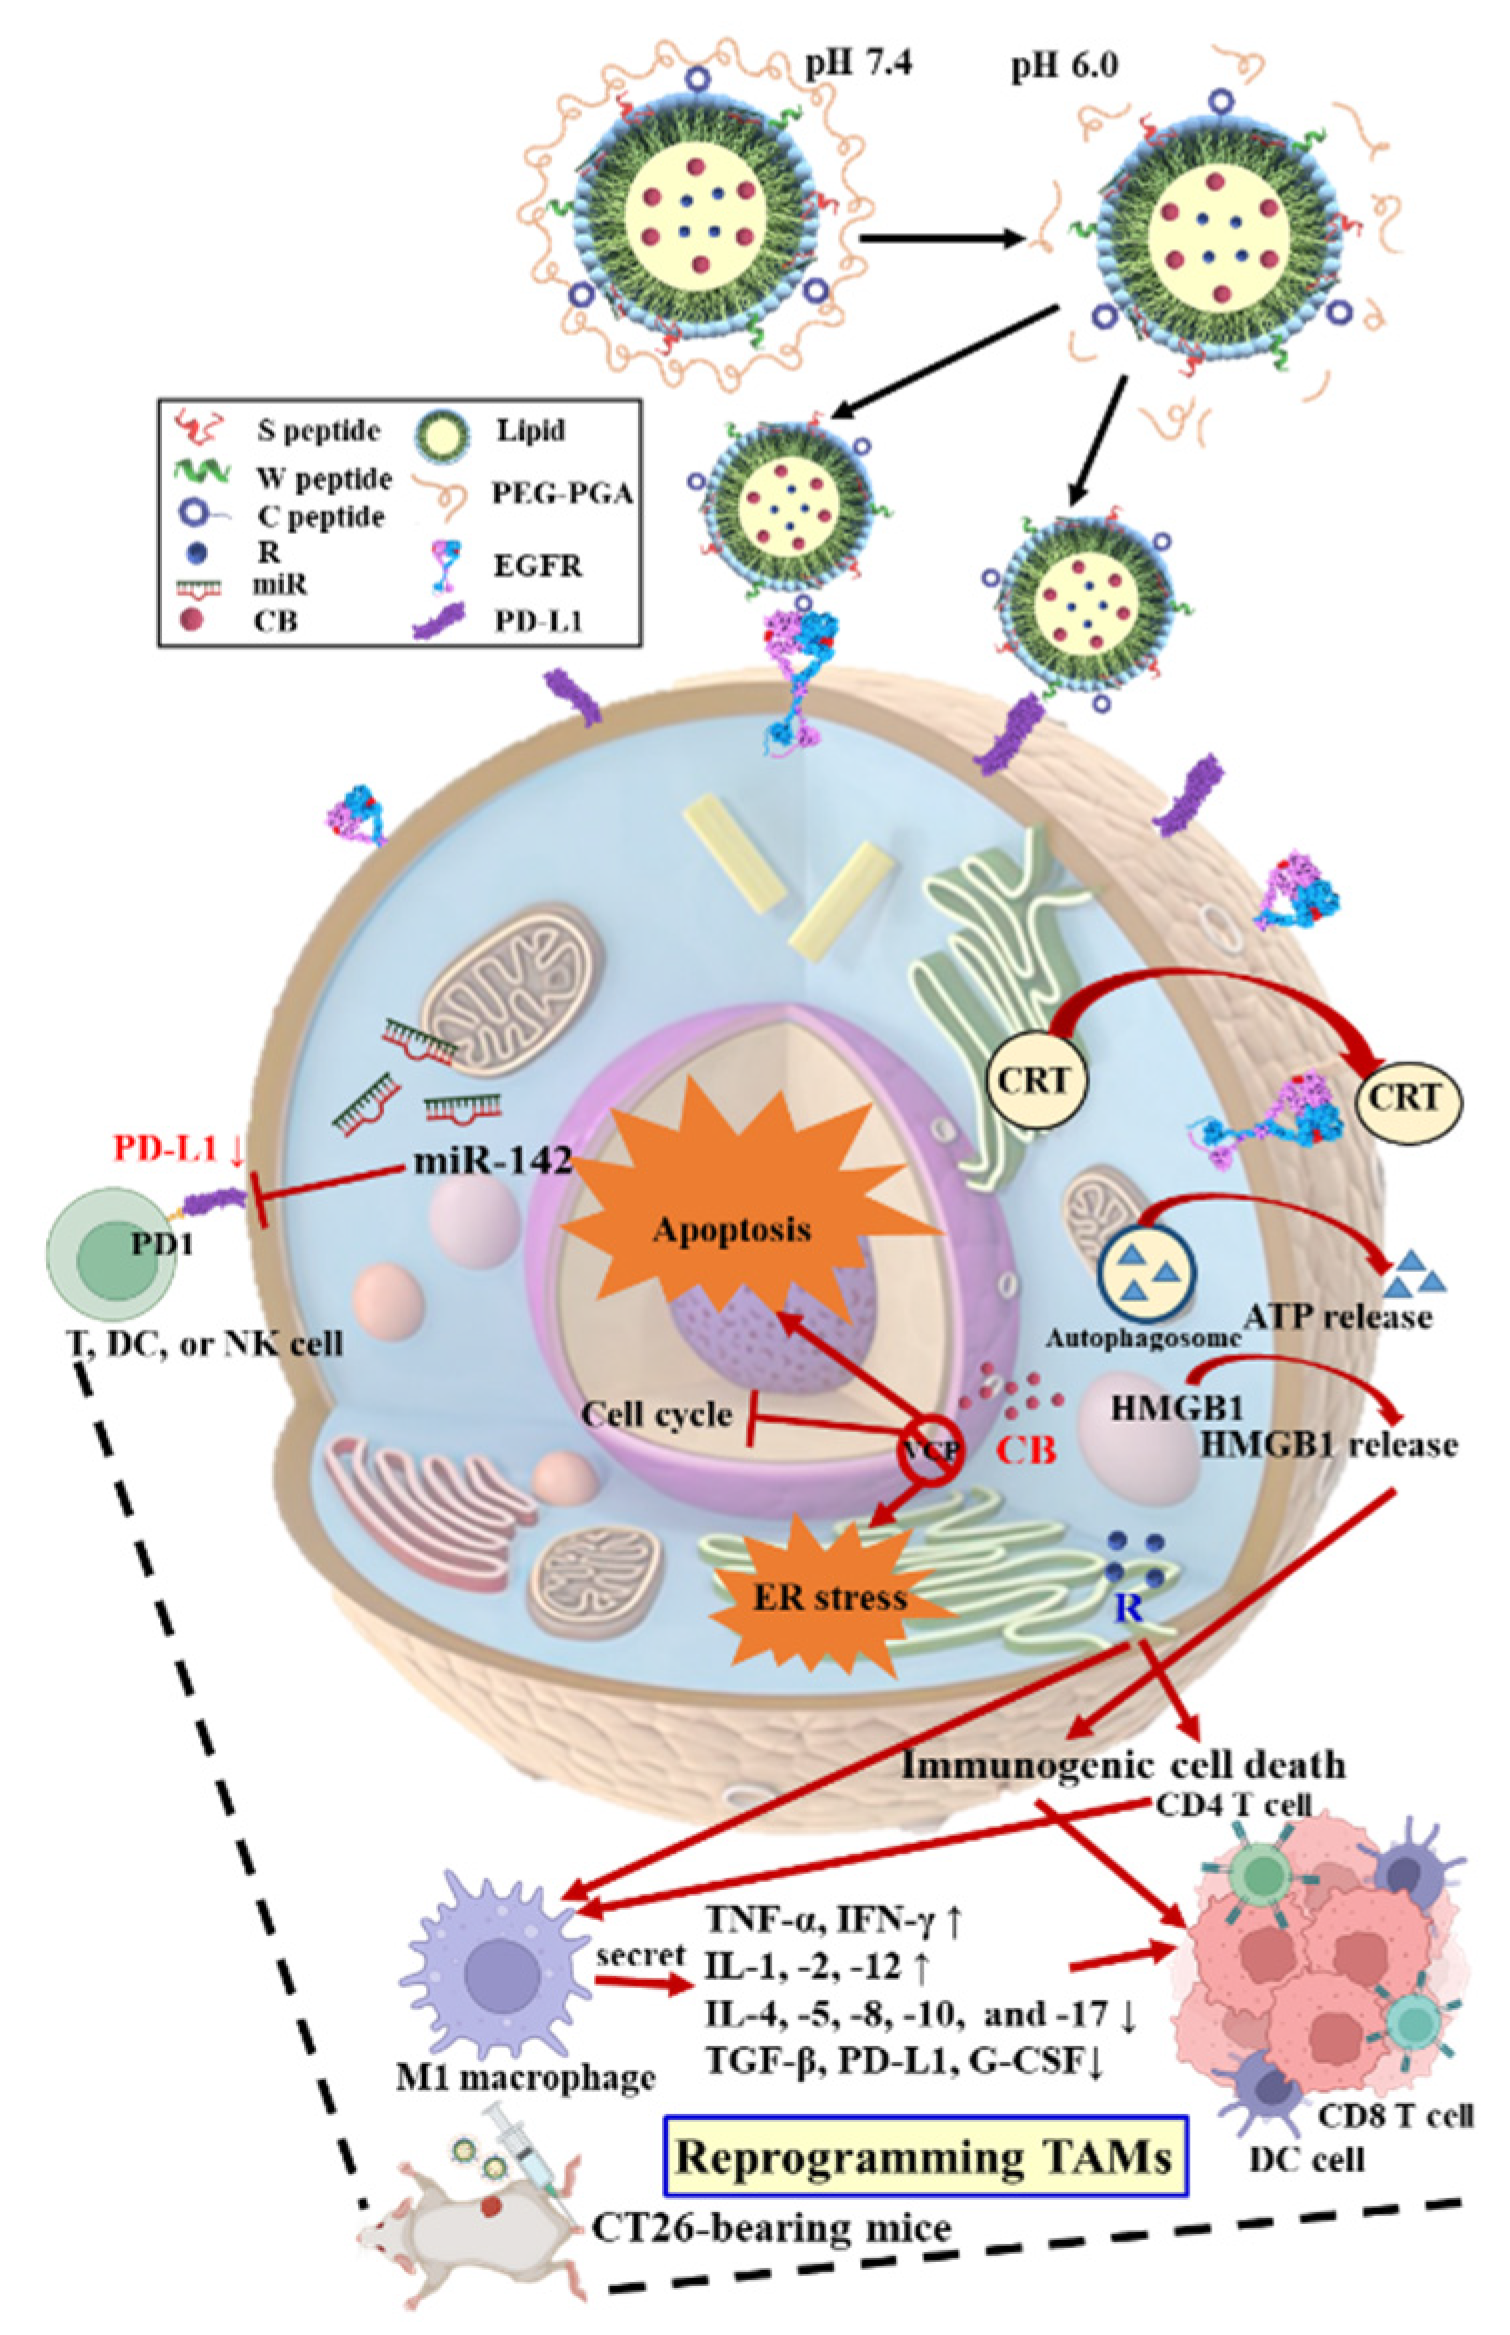
To achieve tumor-specific delivery and coordinated activation of these pathways, we designed a multifunctional solid lipid nanoparticle (SLN) platform functionalized with PD-L1- and EGFR-targeting peptides, an ER-homing sequence, and a pH-labile poly(glutamic acid)–poly(ethylene glycol) (PGA–PEG) coating [
5,
7].
This architecture enables systemic stability, pH-triggered exposure of targeting ligands, and ER-localized payload release in the acidic TME [
5,
7,
10]. By co-encapsulating CB, miR-142, and R837, this system aims to remodel the immunologically cold MSS CRC TME, reinstate antitumor immunity, and support novel combinatorial immunotherapy approaches in the CT26 murine model. Importantly, this design differs from prior SLN-based pancreatic cancer studies by integrating CRC-specific immunological considerations and TME reprogramming, emphasizing novelty and translational relevance.
To evaluate the therapeutic potential of this multifunctional SLN system, we systematically assessed its physicochemical properties, pH-responsive ligand exposure, and ER-targeted payload release. In vitro studies focused on proteostasis disruption, ER stress induction, and ICD in CT26 cells, while in vivo experiments examined TAM reprogramming, T-cell infiltration, and cytokine modulation. Collectively, these studies were designed to determine whether simultaneous proteostasis disruption, PD-L1 inhibition, and TLR7 activation could reprogram the TAM-dominated, immunosuppressive TME into an immune-permissive environment, providing mechanistic and translational insights for combinatorial immunotherapy in MSS CRC (
Scheme 1).
2. Materials and Methods
2.1. Materials
Poly(L-glutamic acid) (PGA) was obtained from Vedan Biotechnology Corporation (Taichung, Taiwan). DOTAP and DSPE-PEG derivatives were sourced from Avanti Polar Lipids (Alabaster, AL, USA). The TLR7 agonist R837 (R) and CB were purchased from MedChemExpress (Monmouth Junction, NJ, USA). FAM-labeled and unlabeled miR-142 oligonucleotides were custom synthesized by GenePharma (Shanghai, China). The targeting peptides were prepared by Kelowna International Scientific (Taipei, Taiwan). Cholesterol, Tween® 80, and paraformaldehyde were acquired from Acros Organics (Geel, Antwerp, Belgium). Cell culture media and supplements were provided by Gibco (Carlsbad, CA, USA). Additional analytical-grade reagents were procured from Cayman Chemical (Ann Arbor, MI, USA), Merck KGaA (Darmstadt, Germany), and MilliporeSigma (Burlington, MA, USA).
2.2. Synthesis of pH-Sensitive PGA-PEG
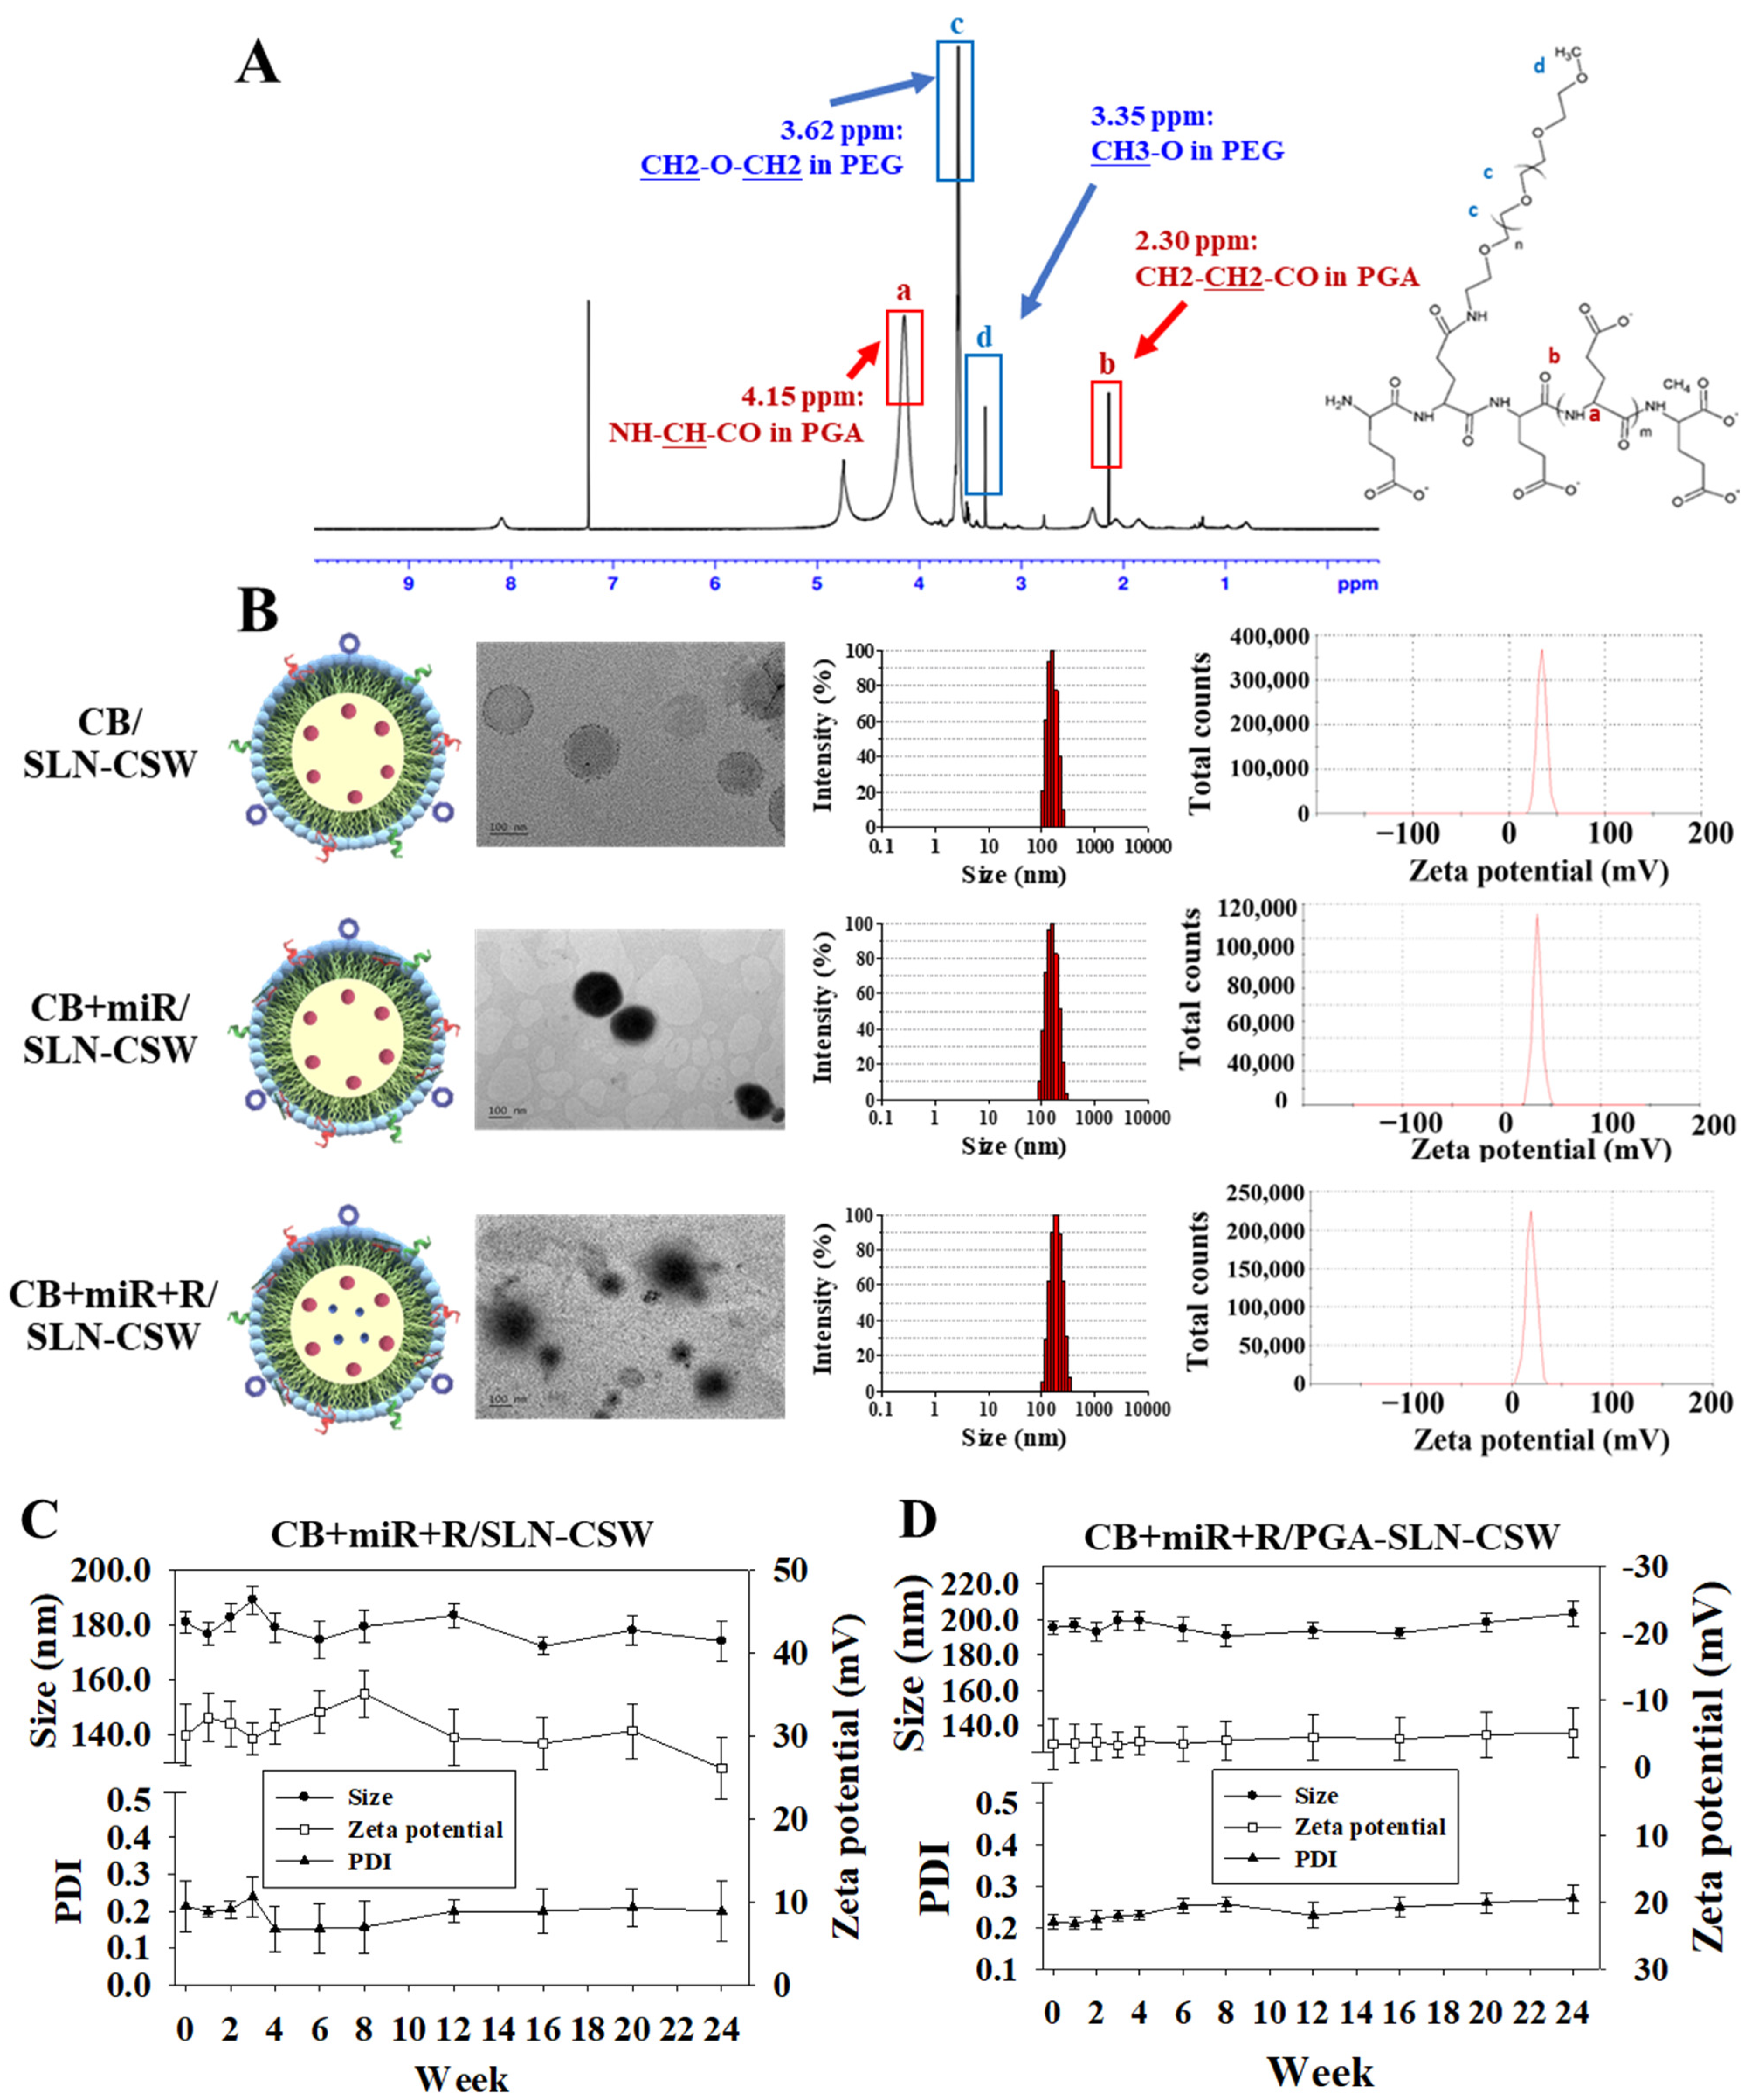
The pH-sensitive polymer PGA-PEG was synthesized by coupling PGA (Vedan Biotechnology Corporation, 100 mg, molecular weight 15–50 kDa) with methoxy PEG amine (mPEG-NH2; Nanocs, New York, NY, USA, molecular weight 2000 Da, 50 mg) using N-hydroxysuccinimide (NHS; Alfa Aesar, Ward Hill, MA, USA, 11.5 mg, 0.1 mmol) and 1-ethyl-3-(3-dimethylaminopropyl) carbodiimide hydrochloride (EDC; Acros Organics, 19.2 mg, 0.1 mmol) at a molar ratio of 1:1:1:1 in 10 mL of aqueous buffer (pH 7.4, 50 mM phosphate buffer). The mixture was stirred continuously using a magnetic stirrer (300 rpm) at 25 °C overnight under nitrogen atmosphere to prevent oxidation. Following dialysis (MWCO 3.5 kDa, Spectrum Laboratories, Rancho Dominguez, CA, USA) against phosphate-buffered saline (PBS, pH 7.4, 4 × 1 L, changed every 6 h) for 48 h at 4 °C, the product was freeze-dried using a lyophilizer at −50 °C and <0.1 mbar for 48 h. Successful conjugation of PGA-PEG was confirmed by proton 1H nuclear magnetic resonance (1H NMR; 400 MHz, Bruker Avance III, Billerica, MA, USA) in deuterium oxide (D2O). This acid-labile polymer was designed to remain shielded in circulation but de-shield in the acidic MSS CRC tumor microenvironment (pH~6.0–6.5), enabling ligand exposure and payload release through protonation of carboxyl groups (-COOH) on PGA at acidic pH, leading to reduced electrostatic repulsion and polymer detachment.
2.3. Synthesis of Lipid–Peptide Conjugates
Lipid-peptide conjugates (DSPE-PEG-C, -S, or -W) were synthesized as described previously [
7] with minor modifications. Briefly, DSPE-PEG-maleimide was reacted with each peptide (C-, S-, or W-peptide) in a 1:1 molar ratio overnight (16–18 h) in aqueous buffer at 25 °C under gentle magnetic stirring (200 rpm) protected from light. The maleimide group of DSPE-PEG reacted with the thiol group of cysteine residues in the peptides via Michael addition, forming stable thioether linkages. The conjugation product was dialyzed against PBS (MWCO 3.5 kDa, changed every 8 h) for 24 h at 4 °C and freeze-dried as described above. Successful conjugation was confirmed by matrix-assisted laser desorption/ionization time-of-flight (MALDI-TOF) mass spectrometry (Bruker, Billerica, MA, USA) in positive ion mode using α-cyano-4-hydroxycinnamic acid (MedChemExpress, Monmouth Junction, NJ, USA) as the matrix.
2.4. Preparation of CB + miR + R/SLN–CSW and pH-Responsive CB + miR + R/PGA–SLN–CSW
The SLNs were prepared using a modified emulsification-solvent evaporation method combined with electrostatic adsorption. Briefly, monostearin (glyceryl monostearate), cholesterol, and DOTAP were dissolved in methanol to form a lipid phase at 65 °C under magnetic stirring (400 rpm). Subsequently, CB, R, and DSPE-PEG-peptide conjugates were added sequentially to the lipid phase and stirred for 30 min at 65 °C to ensure complete dissolution and molecular mixing, followed by the addition of Tween® 80 (0.1% w/v) and mixing for 1 h. The anionic miR was incorporated by dropwise addition via a micropipette into the pre-formed SLN dispersion under gentle stirring to allow electrostatic complexation. For the preparation of pH-responsive CB + miR + R/PGA-SLN-CSW, the pH-sensitive polymer PGA-PEG (0.1% w/v in PBS pH 7.4) was added dropwise to the pre-formed SLN suspension (containing CB, miR, R, and peptide conjugates) and mixed at 25 °C for 2 h under gentle magnetic stirring to allow polymer adsorption onto the nanoparticle surface.
2.5. Physicochemical Characterization and Long-Term Stability
The particle size, polydispersity index (PDI), and zeta potential of the nanoparticles were measured by dynamic light scattering (DLS) and laser Doppler electrophoresis using a Zetasizer Nano ZS (Malvern Instruments, Worcestershire, UK) equipped with a 633 nm He-Ne laser at 25 °C and a detection angle of 173° (backscattering mode). Each sample was diluted 1:20 in PBS (pH 7.4, filtered through 0.22 μm membrane) and equilibrated for 2 min before measurement, then analyzed in triplicate (
n = 3) with 12 sub-runs per measurement. The results were expressed as mean ± standard deviation. The refractive index was set to 1.47 for lipids and 1.33 for PBS. Size distribution was analyzed using the intensity-weighted distribution (Z-average) and reported as mean diameter ± SD. To determine the EE% and DL% of CB- or miR-loaded nanoparticles, 1 mL of nanoparticle suspension was ultracentrifuged at 15,000 rpm for 60 min at 4 °C using a Beckman Coulter ultracentrifuge. The supernatant (containing free unencapsulated drug) was carefully removed without disturbing the pellet, and the resulting pellets were washed once with cold PBS (500 μL), re-centrifuged under the same conditions, and then lysed in 0.5% Triton X-100 (500 μL, incubated at 37 °C for 30 min with vortexing every 10 min to ensure complete lysis of nanoparticles). Following centrifugation at 15,000 rpm for 30 min at 4 °C to pellet debris, the concentrations of CB and miR in both the supernatant (free drug) and the lysed pellet (encapsulated drug) were quantified using a UV/Vis spectrophotometer (Ultrospec 8000, Biochrom, Holliston, MA, USA) at wavelengths of 280 nm for CB and a NanoDrop spectrophotometer (Thermo Fisher Scientific, Waltham, MA, USA) at 260 nm for miR, respectively. The EE% and DL% were calculated according to standard equations.
where W
e represents the initial weight of CB or miR, W
f denotes the weight of CB or miR in the filtrate, and W
t corresponds to the total nanoparticle weight.
The morphological features of the nanoparticles were examined by transmission electron microscopy (TEM; JEM-1400 PLUS, JEOL, Tokyo, Japan). For TEM imaging, nanoparticle suspensions (10 μL, diluted 1:100 in deionized water) were deposited on carbon-coated copper grids (300 mesh, Electron Microscopy Sciences, Hatfield, PA, USA), fixed by adding 2% glutaraldehyde (5 μL) for 5 min, and then negatively stained with 2% uranyl acetate (10 μL for 1 min). Multiple fields (at least 10 random fields per sample) were examined, and representative images were captured. To evaluate long-term stability, particle size, PDI, and zeta potential were monitored at predetermined time points over a 24-week period under controlled storage conditions (4 °C in amber glass vials, protected from light, n = 3 independent batches). At each time point, samples were brought to room temperature, gently mixed by inversion (10 times), and analyzed immediately. Physical stability was defined as a <10% change in particle size and <0.05 increase in PDI.
2.6. pH-Responsive Characteristics
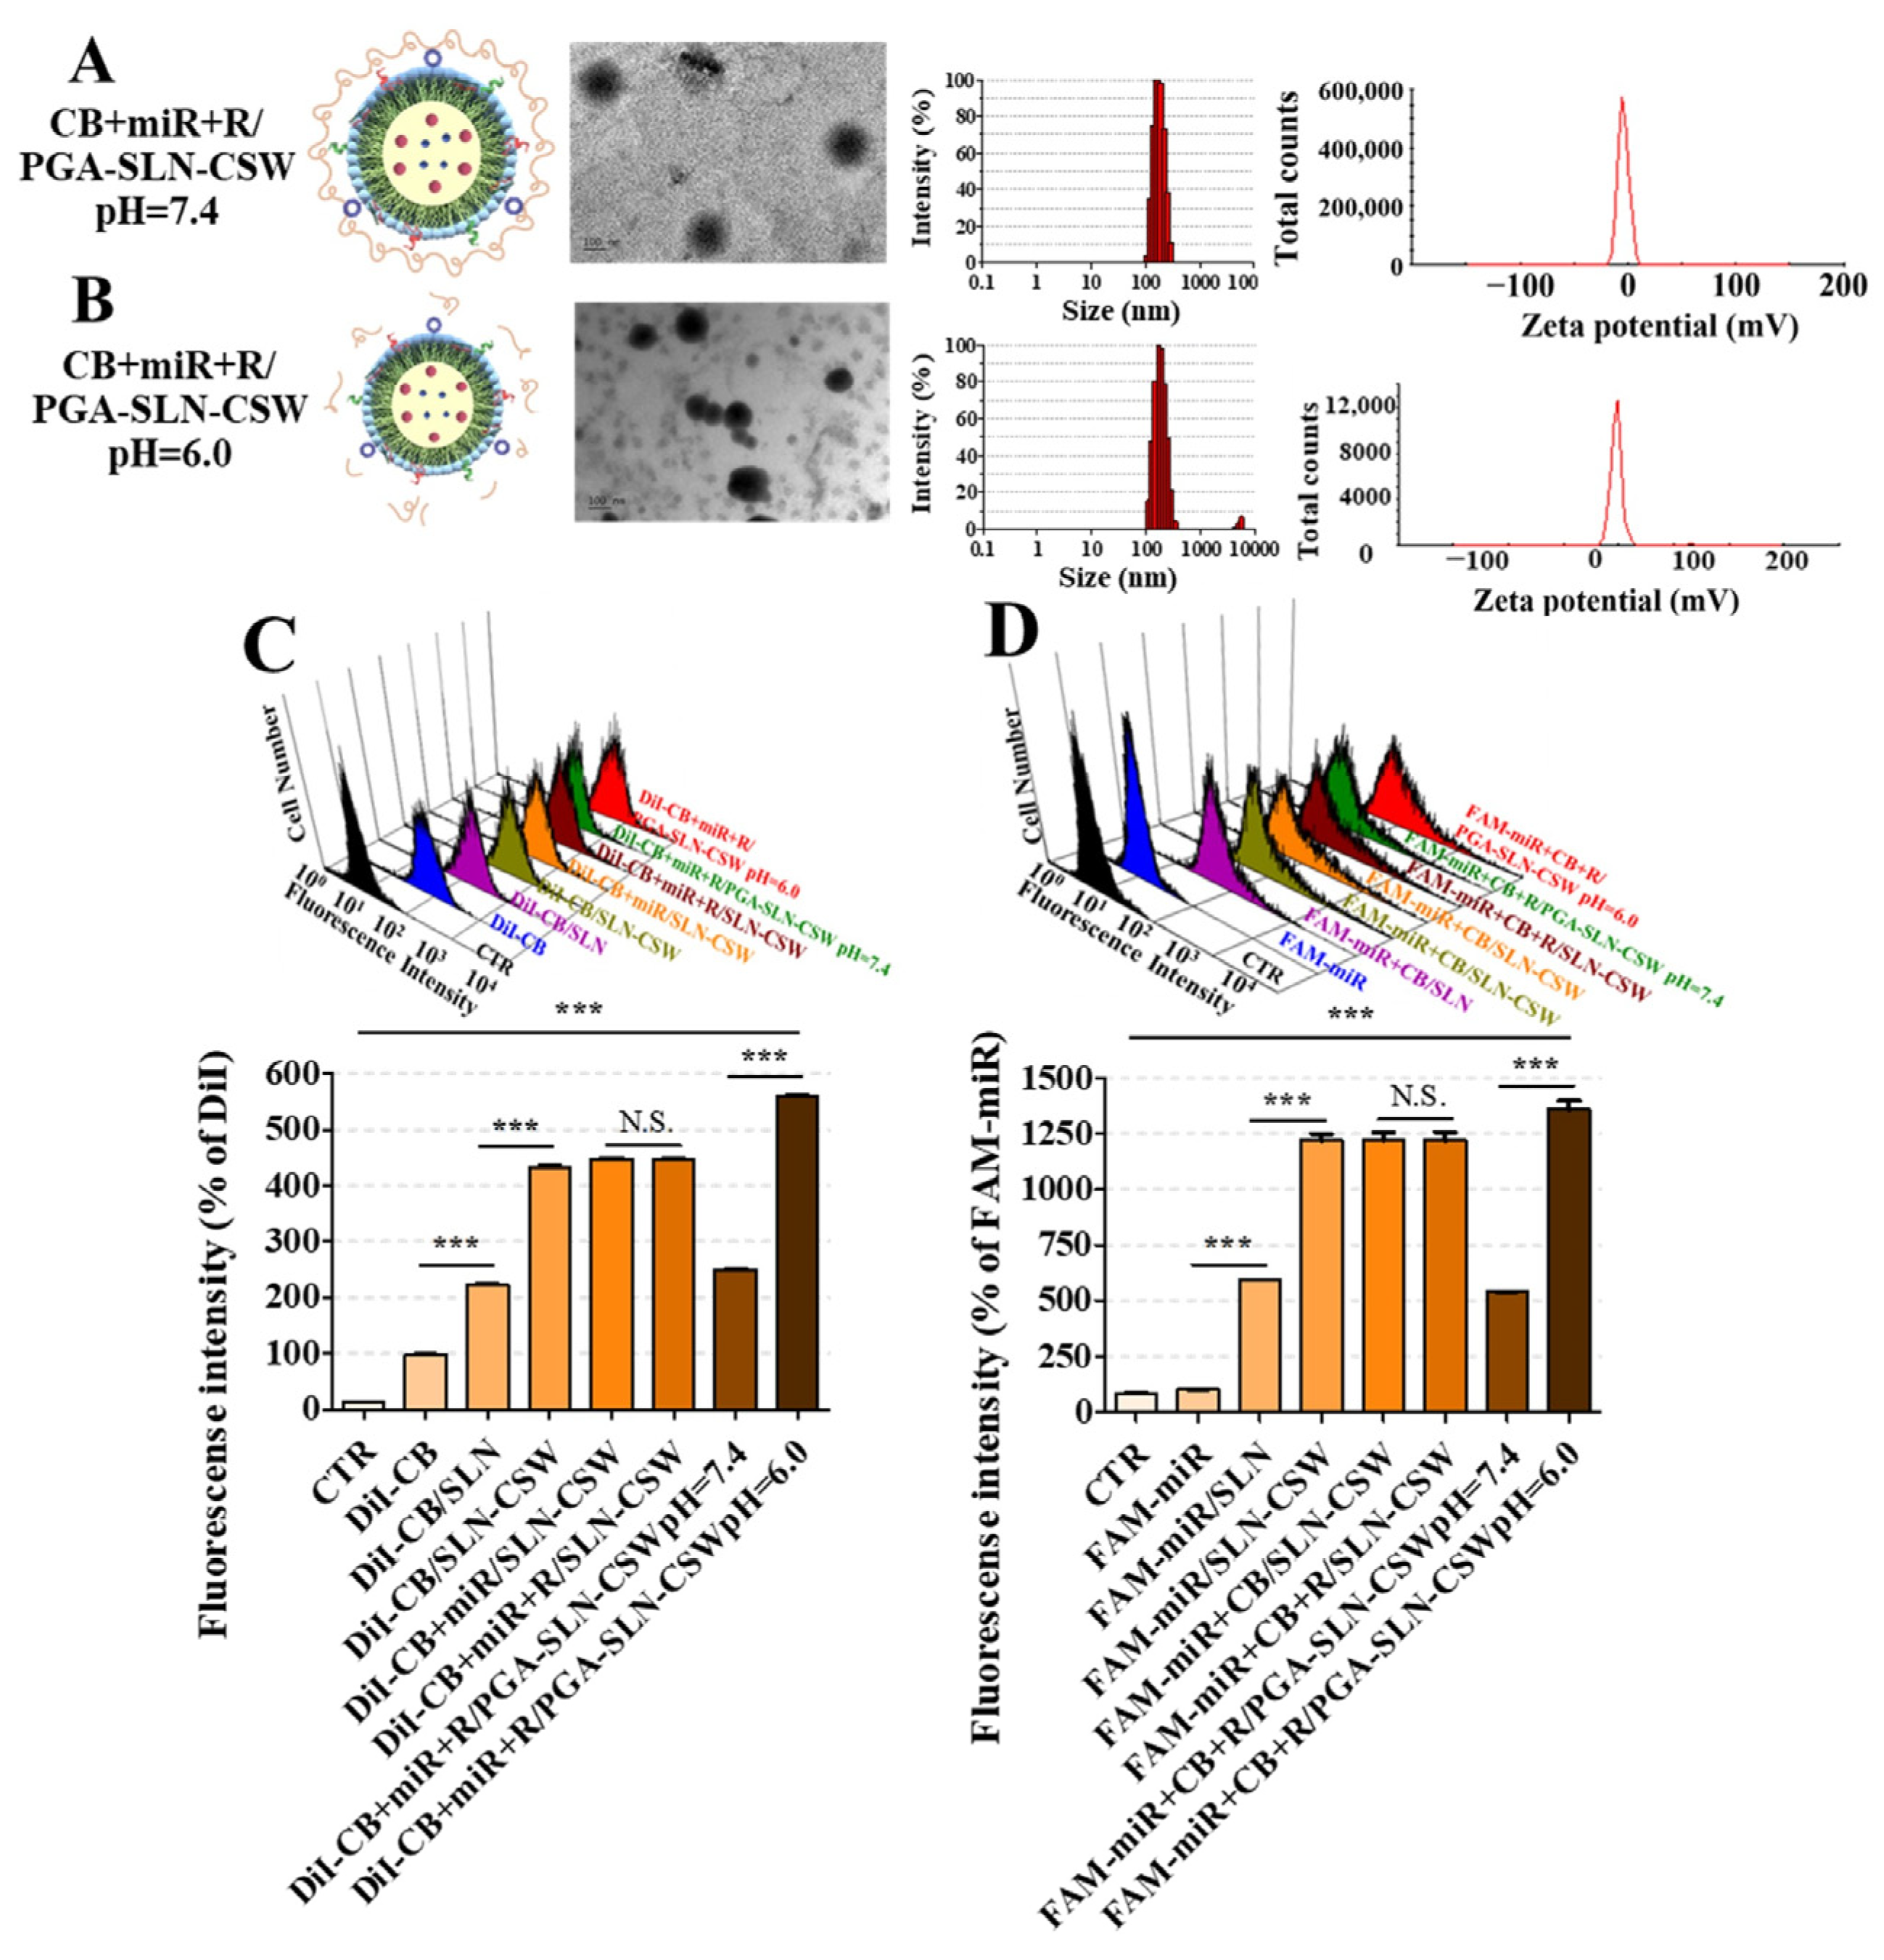
To investigate the acid-sensitive behavior and confirm the de-shielding mechanism under mildly acidic conditions, particle size and zeta potential of CB- and/or miR-loaded formulations were measured at pH 7.4 and 6.0 using a Zetasizer Nano-ZS (Malvern Instruments).
2.7. Cell Lines and Culture
Murine colorectal carcinoma CT-26 cells (MSS phenotype, derived from BALB/c mice, ATCC catalog CRL-2638), RAW 264.7 murine macrophage (derived from BALB/c mice, ATCC catalog TIB-71), and IEC-6 rat intestinal epithelial cells (non-transformed normal intestinal epithelial cells, ATCC catalog CRL-1592) were obtained from the Bioresource Collection and Research Center (Hsinchu, Taiwan). CT-26 and IEC-6 cells were cultured in RPMI-1640 medium, while RAW 264.7 cells were cultured in DMEM, all supplemented with 10% fetal bovine serum (FBS; Gibco) and 1% penicillin–streptomycin–glutamine (PSG; Corning, NY, USA). The CT-26 line was explicitly chosen to model the poor T cell infiltration and TAM-rich environment characteristic of MSS CRC.
2.8. Intracellular Uptake and Trafficking Studies
Confocal laser scanning microscopy (CLSM) imaging was used to detect PD-L1/EGFR dual-targeting and ER localization in the MSS CRC context. CB was fluorescently labeled with 1,1′-dioctadecyl-3,3,3′,3′-tetramethyl indocarbocyanine perchlorate (DiI) for visualization. For trafficking, CT-26 cells were treated for 1, 3, and 24 h, stained for nuclei and ER (CytoPainter ER Staining Kit; Abcam, Cambridge, UK), and immunolabeled for EGFR and PD-L1. Briefly, cells were fixed with 4% paraformaldehyde for 15 min, permeabilized with 0.1% Triton X-100 in PBS for 10 min, blocked with 5% bovine serum albumin (BSA) in PBS for 1 h at room temperature, and incubated overnight at 4 °C with primary antibodies: rabbit anti-EGFR (1:200) and mouse anti-PD-L1 (1:200). After washing three times with PBS-Tween 20 (0.05%), cells were incubated with Alexa Fluor 488-conjugated goat anti-rabbit IgG (1:500) and Alexa Fluor 647-conjugated goat anti-mouse IgG (1:500) for 1 h at room temperature in the dark. Imaging was performed with an Olympus CLSM (FV10i, Tokyo, Japan). For the internalization of DiI-CB and FAM-miR, CT-26 and IEC-6 cells were incubated with DiI-CB (200 nM), FAM-miR (100 nM), and/or R (1.5 µM) formulations for 24 h. Uptake was quantified by flow cytometry (FACSCalibur, BD Biosciences, San Jose, CA, USA) using 488 nm (FAM detection, FL1 channel) and 561 nm (DiI detection, FL2 channel) lasers. A minimum of 10,000 gated events (based on forward scatter and side scatter to exclude debris) were acquired per sample. Data were analyzed using FlowJo v10 software (FlowJo LLC, Ashland, OR, USA).
2.9. Assessment of Cytotoxicity and Synergistic Effects by Sulforhodamine B (SRB) Assay
CT-26 and IEC-6 cells were treated with different miR-, CB-, and/or R-loaded formulations. Cells were then fixed with 1% trichloroacetic acid (TCA) at 4 °C for 1 h. Fixed cells were stained with 50 μL per well of 0.04% SRB (sulforhodamine B, Sigma-Aldrich, Saint Louis, MO, USA) dissolved in 1% acetic acid for 30 min at room temperature with gentle shaking, and washed with 1% acetic acid. After air drying, 10 mM Tris base was added to each well, and absorbance at 540 nm was measured using an ELISA reader (TECAN, Männedorf, Switzerland). To assess synergistic effects, CT-26 cells were treated with varying concentrations of miR and/or CB. The combination index (CI) was analyzed using CompuSyn software, v. 1.0 (Paramus, NJ, USA) from SRB-derived dose–response data following the Chou-Talalay method. CI values were interpreted as follows: CI < 0.7 (strong synergism), 0.7–0.85 (moderate synergism), 0.85–0.9 (slight synergism), 0.9–1.1 (additive effect), and >1.1 (antagonism). All experiments were performed in triplicate.
2.10. Assessment of Reactive Oxygen Species (ROS)
Following a 24 h treatment with various formulations (CB: 200 nM; miR: 100 nM; R: 1.5 μM) or vehicle control, CT-26 cells seeded at 5 × 10⁴ cells per well in 8-well chambered coverslips were washed twice with PBS and stained with 4′,6-diamidino-2-phenylindole (DAPI; Millipore Sigma, Burlington, MA, USA) for nuclear counterstaining and 2′,7′-dichlorodihydrofluorescein diacetate (DCFH-DA; Millipore Sigma) for ROS detection (20 min incubation for both stains). Cells were fixed with 4% paraformaldehyde for 10 min, and images were subsequently acquired using CLSM (Olympus FV10i). For quantitative analysis, intracellular DCF fluorescence was then measured via flow cytometry (FACSCalibur).
2.11. Apoptosis and Cell Cycle Analysis
To quantify apoptotic and necrotic cell populations, an Annexin V-fluorescein isothiocyanate (FITC)/propidium iodide (PI) apoptosis detection kit (Strong Biotech Corporation, Taipei, Taiwan) was utilized after 24 h of treatment. Cell suspension (~1 × 10⁵ cells) was transferred to flow cytometry tubes and incubated with Annexin V-FITC and PI (50 μg/mL) for 15 min at room temperature in the dark. Samples were analyzed within 1 h. Fluorescence was measured using FL1 (FITC, 530 nm) and FL3 (PI, 670 nm) channels, acquiring 10,000 events per sample. Cell populations were classified as follows: viable (Annexin V−/PI−), early apoptotic (Annexin V+/PI−), late apoptotic (Annexin V+/PI+), and necrotic (Annexin V−/PI+). Data were analyzed using FlowJo v10 software with appropriate compensation settings. The results were expressed as percentage of cells in each quadrant. For cell cycle analysis, CT-26 cells were seeded at 3 × 10⁵ cells per well in 6-well plates, cultured overnight, and treated for 24 h as described above. Cells were then fixed with 70% ice-cold ethanol at −20 °C overnight and subsequently stained with PI (50 μg/mL), 0.1% Triton X-100, and RNase A (Millipore Sigma) for 30 min at 37 °C in the dark. Cell cycle distribution across G0/G1, S, and G2/M phases was then assessed via flow cytometry (FACSCalibur) using the FL3 channel (670 nm).
2.12. Wound-Healing Assay
Wound closure in CT-26 monolayers was quantified after 15 h treatment using Ibidi culture inserts (Culture-Insert 2 Well in μ-Dish 35 mm, Ibidi GmbH, Gräfelfing, Germany). Briefly, CT-26 cells were seeded at 3 × 10
4 cells per well of the insert in 70 μL of complete medium and cultured overnight until confluent monolayers formed on both sides of the insert. The insert was then gently removed using sterile forceps, creating a defined 500 μm gap. Serum-free medium containing various formulations (CB: 200 nM; miR: 100 nM; R: 1.5 μM) or vehicle control was added. Cell migration was visualized before and after treatment using light microscopy (Olympus IX70, Tokyo, Japan), and the migration area was quantified using ImageJ software, v. 1.53t.
2.13. Western Blotting
After 24 h treatment with various formulations (CB: 200 nM; miR: 100 nM; R: 1.5 μM) or vehicle control, total cellular proteins were extracted using radioimmunoprecipitation assay (RIPA) buffer. Protein concentrations were quantified using a BCA assay (Thermo Fisher, Waltham, MA, USA). Equal amounts of protein (30–50 μg per lane, normalized across samples) were separated by sodium dodecyl sulfate-polyacrylamide gel electrophoresis (SDS-PAGE), transferred to polyvinylidene fluoride (PVDF) membranes (Bio-Rad, Hercules, CA, USA), and probed with specific primary antibodies followed by horseradish peroxidase (HRP)-conjugated IgG secondary antibodies (JacksonImmunoResearch, West Grove, PA, USA). Protein bands were visualized using Immobilon enhanced chemiluminescence (Millipore, Billerica, MA, USA) and imaged with a Luminescence Imaging System (Amersham Imager 680; GE Healthcare, Chicago, IL, USA).
2.14. Macrophage–Cancer Cell Co-Culture and Cytokine Quantification
To evaluate the effect of formulations on TAM polarization, RAW 264.7 macrophages were co-cultured with CT-26 cells in cell culture inserts (Greiner Bio-One, Kremsmünster, Austria). Briefly, RAW 264.7 cells (1 × 10⁵ cells) were seeded in the upper insert chamber in 1.5 mL of DMEM complete medium, and CT-26 cells (2 × 10⁵ cells) were seeded in the lower well in 2.5 mL of RPMI-1640 complete medium. After 24 h of co-culture to establish cell–cell communication, CT-26 cells were treated with various formulations (CB: 200 nM; miR: 100 nM; R: 1.5 μM) for an additional 48 h at 37 °C. RAW 264.7 cells, CT-26 cells, and conditioned medium were collected for Western blot analysis.
2.15. Quantification of Cytokines and HMGB1
Cytokine and HMGB1 concentrations were determined using ELISA kits (BioLegend, San Diego, CA, USA). Each well was coated with 200 μL of capture antibody and incubated overnight, followed by blocking with assay diluent buffer for 1 h. Subsequently, standards and conditioned media were introduced and incubated for 2 h, followed by sequential incubation with detection antibodies (HMGB1, IL-10, TNF-α, TGF-β, IFN-γ), avidin-HRP, and substrate solutions (tetramethylbenzidine (TMB), provided in kit) for 15–30 min at room temperature in the dark until color development. Absorbance at 450 nm was measured using a TECAN ELISA reader to quantify protein levels.
2.16. Analysis of CRT and HMGB1 Localization
Following 24 h of treatment, cells were stained with ER-Tracker Green to visualize the endoplasmic reticulum, then fixed and blocked prior to antibody labeling. Primary antibodies against CRT or HMGB1 were applied and incubated overnight at 4 °C. The next day, Alexa Fluor 680- and Cy5.5-conjugated secondary antibodies were introduced to detect the respective targets. The cellular distribution of CRT and HMGB1 was assessed using CLSM on an Olympus FV10i system.
2.17. Measurement of Intracellular and Extracellular ATP
ATP levels were assessed using an ATP detection assay kit (Cayman, Ann Arbor, MI, USA) based on the luciferin-luciferase bioluminescence reaction. Intracellular ATP was quantified from lysed cells, whereas extracellular ATP was measured from conditioned media. Luminescence signals were recorded using a TECAN ELISA reader to evaluate ATP concentrations. The results are presented as percentage changes relative to untreated controls.
2.18. Hemolysis Assay
To assess hemocompatibility, rat red blood cells (RBCs) were collected into heparinized tubes (10 U/mL), washed three times with sterile PBS (pH 7.4) after centrifugation at 1000× g for 5 min at 4 °C, and resuspended in PBS to a final concentration of 2% (v/v). RBC suspensions (200 μL) were incubated with 200 μL of the formulations or 0.5% Triton X-100 (positive control, 100% hemolysis) or the PBS control (negative control, 0% hemolysis) for 24 h. Hemolysis was assessed by incubating supernatants from lysed RBCs with Drabkin’s reagent (Millipore Sigma) at 25 °C for 15 min in equal volume proportions (1:1, v/v). The intensity of the chromogenic signal was determined by measuring the optical absorbance at 540 nm with a TECAN microplate spectrophotometer.
2.19. Establishment of the CT-26 Tumor-Bearing Murine Model and Assessment of Antitumor Efficacy
BALB/c mice weighing approximately 20 g and aged 4–6 weeks were sourced from the National Laboratory Animal Center (Taipei, Taiwan). All in vivo procedures strictly adhered to ethical guidelines approved by the Institutional Animal Care and Use Committee (IACUC) of National Yang Ming Chiao Tung University (approval number: 1100411, 19 April 2021). Mice were subcutaneously implanted in the right flank with CT-26 cells (3 × 10
6 cells suspended in 100 μL of PBS). When tumors reached ~60 mm
3, mice (
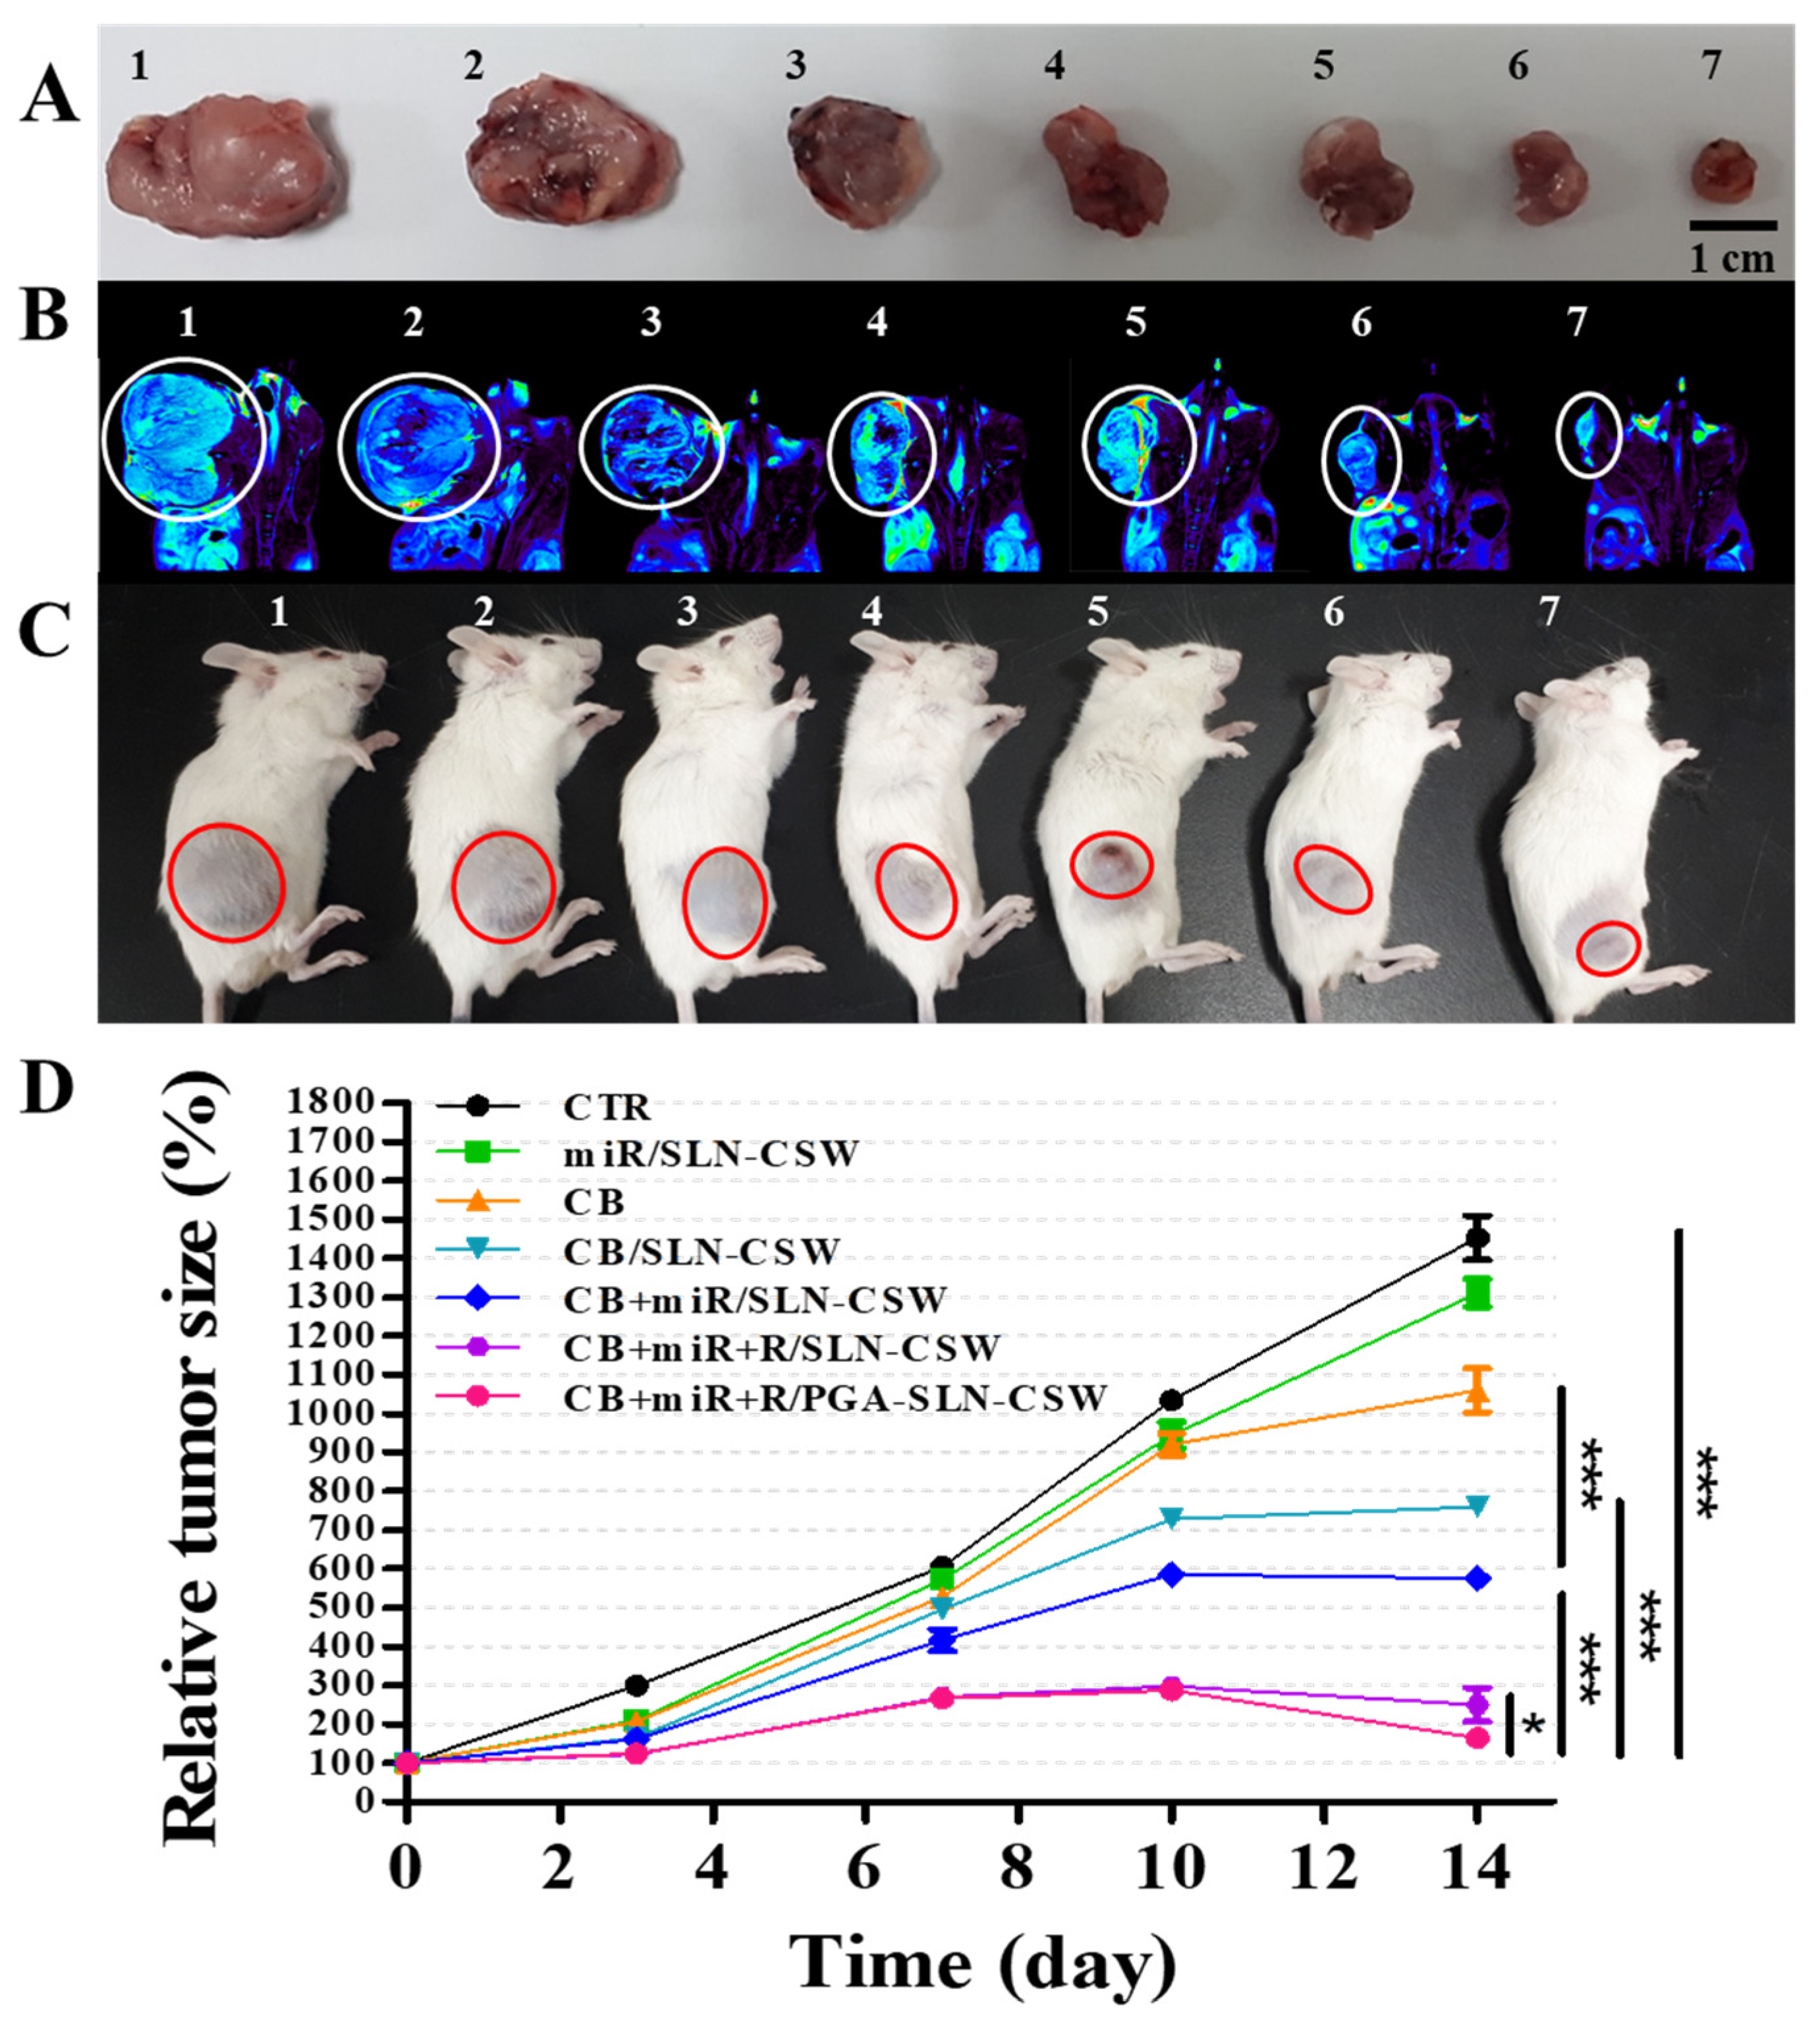
n = 3 per group) received the designated treatments twice weekly for 14 days via tail vein injection. The treatment groups were: (1) saline control (CTR), (2) miR/SLN-CSW, (3) CB, (4) CB/SLN-CSW, (5) CB + miR/SLN-CSW, (6) CB + miR + R/SLN-CSW, and (7) CB + miR + R/PGA-SLN-CSW, administered at 10 mg/kg for CB, 1.25 mg/kg for miR-142, and 6 mg/kg for R. Tumor dimensions were measured using digital calipers every 3–4 days (length and width in mm), and tumor volume was calculated using the modified ellipsoid formula:
where L is the longest diameter and W is the shortest perpendicular diameter.
2.20. Positron Emission Tomography/Magnetic Resonance Imaging (PET/MRI)-Based Tumor Imaging
Tumor localization was evaluated using PET/MRI. Mice were fasted for at least 6 h before intravenous administration of [18F]-2-deoxy-2-fluoro-D-glucose (18F-FDG; 0.282 mCi per mouse, equivalent to approximately 10.43 MBq, diluted in 100 μL of sterile saline) on day 15. PET scans were acquired at 45 min post-injection using a Bruker 7T PET/MRI system (Bruker, Billerica, MA, USA), followed by MRI scans for anatomical reference and attenuation correction. Analysis of PET and MRI datasets was performed using AMIDE, an open-source imaging software, v. 1.0.6 (SourceForge, Ames, IA, USA).
2.21. Immune Profiling
Tumors and spleens from treated CT-26 tumor-bearing mice were harvested on day 15 (24 h after the final treatment), immediately placed in cold RPMI-1640 medium on ice, and processed into single-cell suspensions for characterization of tumor-infiltrating and immune cell populations. Single-cell suspensions (1 × 10⁶ cells in 100 μL of flow cytometry buffer) were stained with fluorescein-conjugated antibodies for 20 min in the dark. Flow cytometric analysis of dual-labeled cells stained with FITC- and PE-conjugated immune antibodies was conducted using FlowJo v10 software (FlowJo LLC, Ashland, OR, USA).
2.22. Multiplex Quantification of Cytokine and Chemokine Profiles
Circulating serum cytokine and chemokine levels were measured using a Bio-Plex multiplex assay (Bio-Rad, Hercules, CA, USA). Serum samples (50 μL, diluted 1:4 in assay diluent) and standards (provided in kit, creating 7-point standard curves) were incubated with antibody-coupled magnetic beads in a 96-well plate for 30 min at room temperature with shaking (300 rpm), washed three times using a magnetic washer, incubated with detection antibodies for 30 min, washed again, and incubated with streptavidin-phycoerythrin (SA-PE) for 10 min. After final washing, the beads were resuspended in assay buffer and analyzed using the Bio-Plex 200 system, which identifies individual beads by their spectral signature and quantifies bound PE fluorescence as a proportion of the analyte concentration. Analyzed targets included IL-1β, IL-2, IL-4, IL-5, IL-8 (CXCL-1), IL-10, IL-12, IL-17, interferon-gamma (IFN-γ), tumor necrosis factor-alpha (TNF-α), transforming growth factor-beta (TGF-β), and G-CSF.
2.23. Histology, Terminal Deoxynucleotidyl Transferase dUTP Nick End Labeling (TUNEL), and Immunohistochemitry (IHC)
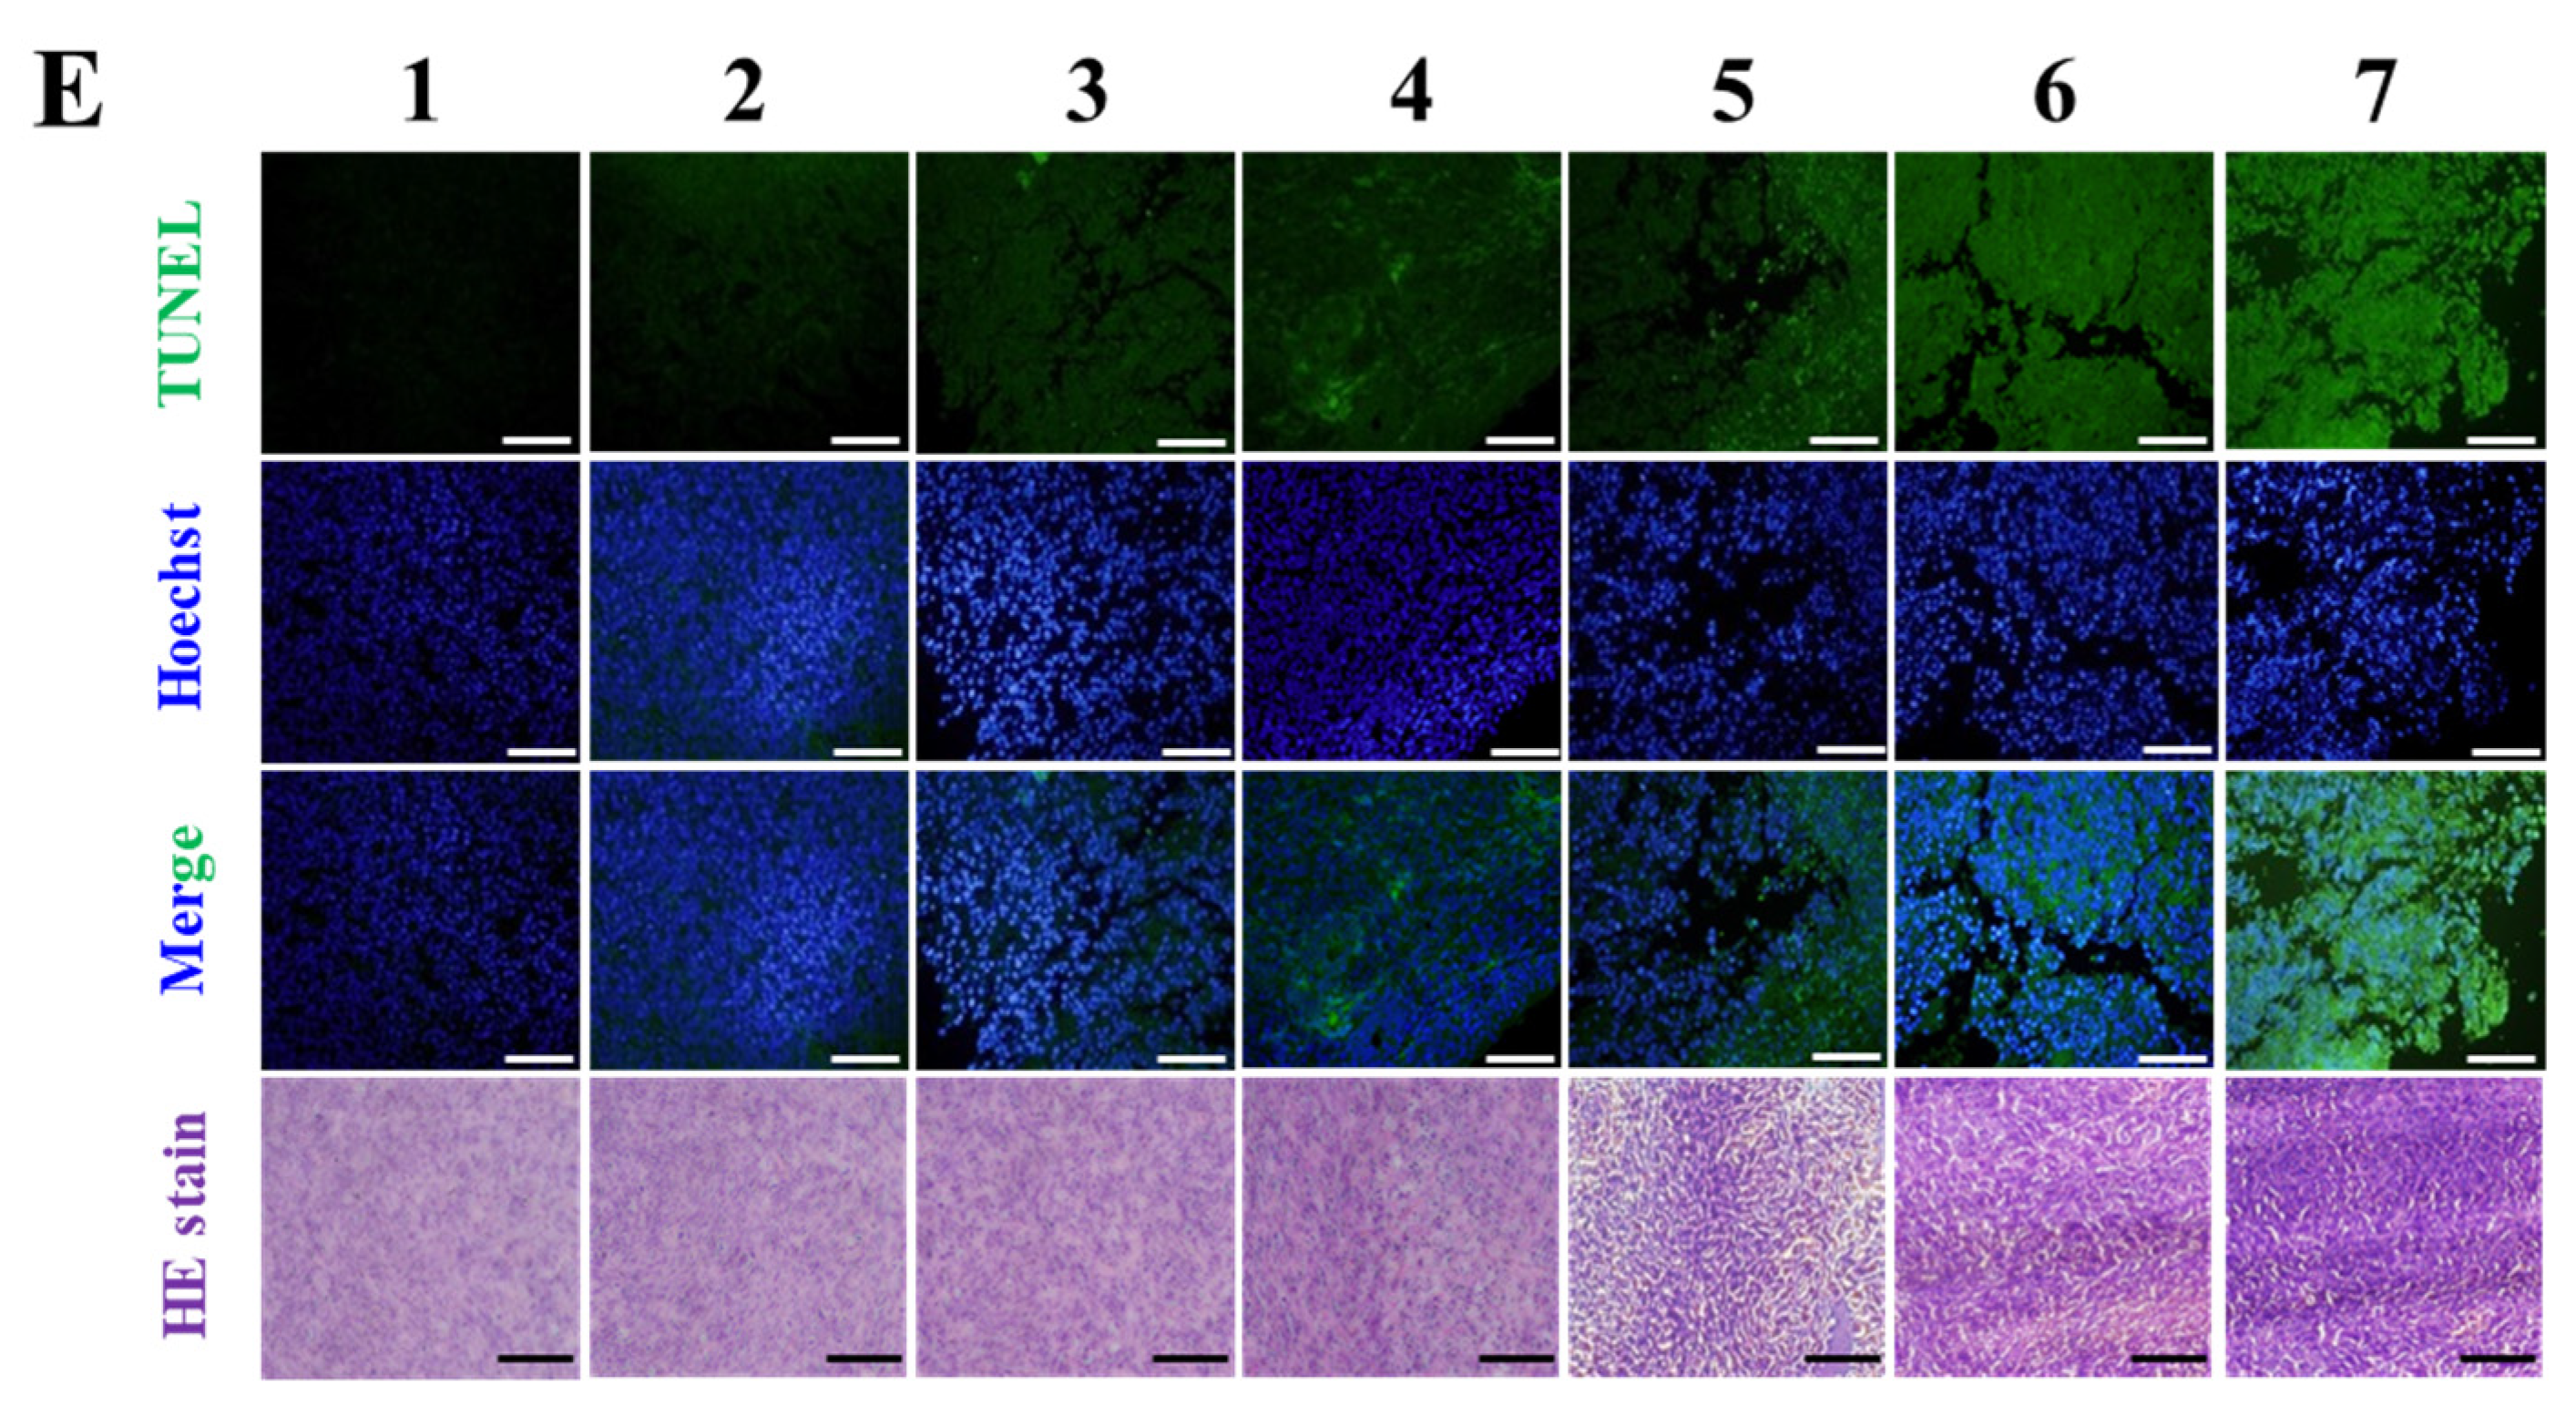
Major organs including tumors, liver, kidneys, heart, spleen, and intestines (jejunum) were fixed in 4% paraformaldehyde, paraffin-embedded, sectioned into 4–5 μm thick sections, and stained with hematoxylin and eosin (HE). Stained samples were imaged using an Olympus VS120 slide scanner. Tumor apoptosis was assessed using a TUNEL assay (In Situ Cell Death Detection Kit, Roche, Basel, Switzerland), with imaging conducted using an Olympus FV10i confocal microscope with 488 nm excitation for TUNEL (green) and 405 nm for DAPI (blue), using a 20× objective. Tumor and spleen sections were subjected to IHC staining using primary antibodies targeting CD4, CD8, FoxP3, and PD-L1, followed by incubation with HRP-conjugated secondary antibodies. Signal development was performed using 3,3′-diaminobenzidine (DAB) with hematoxylin counterstaining. Stained sections were scanned using an Olympus VS120 slide scanner at 20× magnification, and digital images were analyzed. Quantitative assessment of DAB staining intensity was performed using Image Pro Plus 4.0 software.
2.24. Tumor Re-Challenge
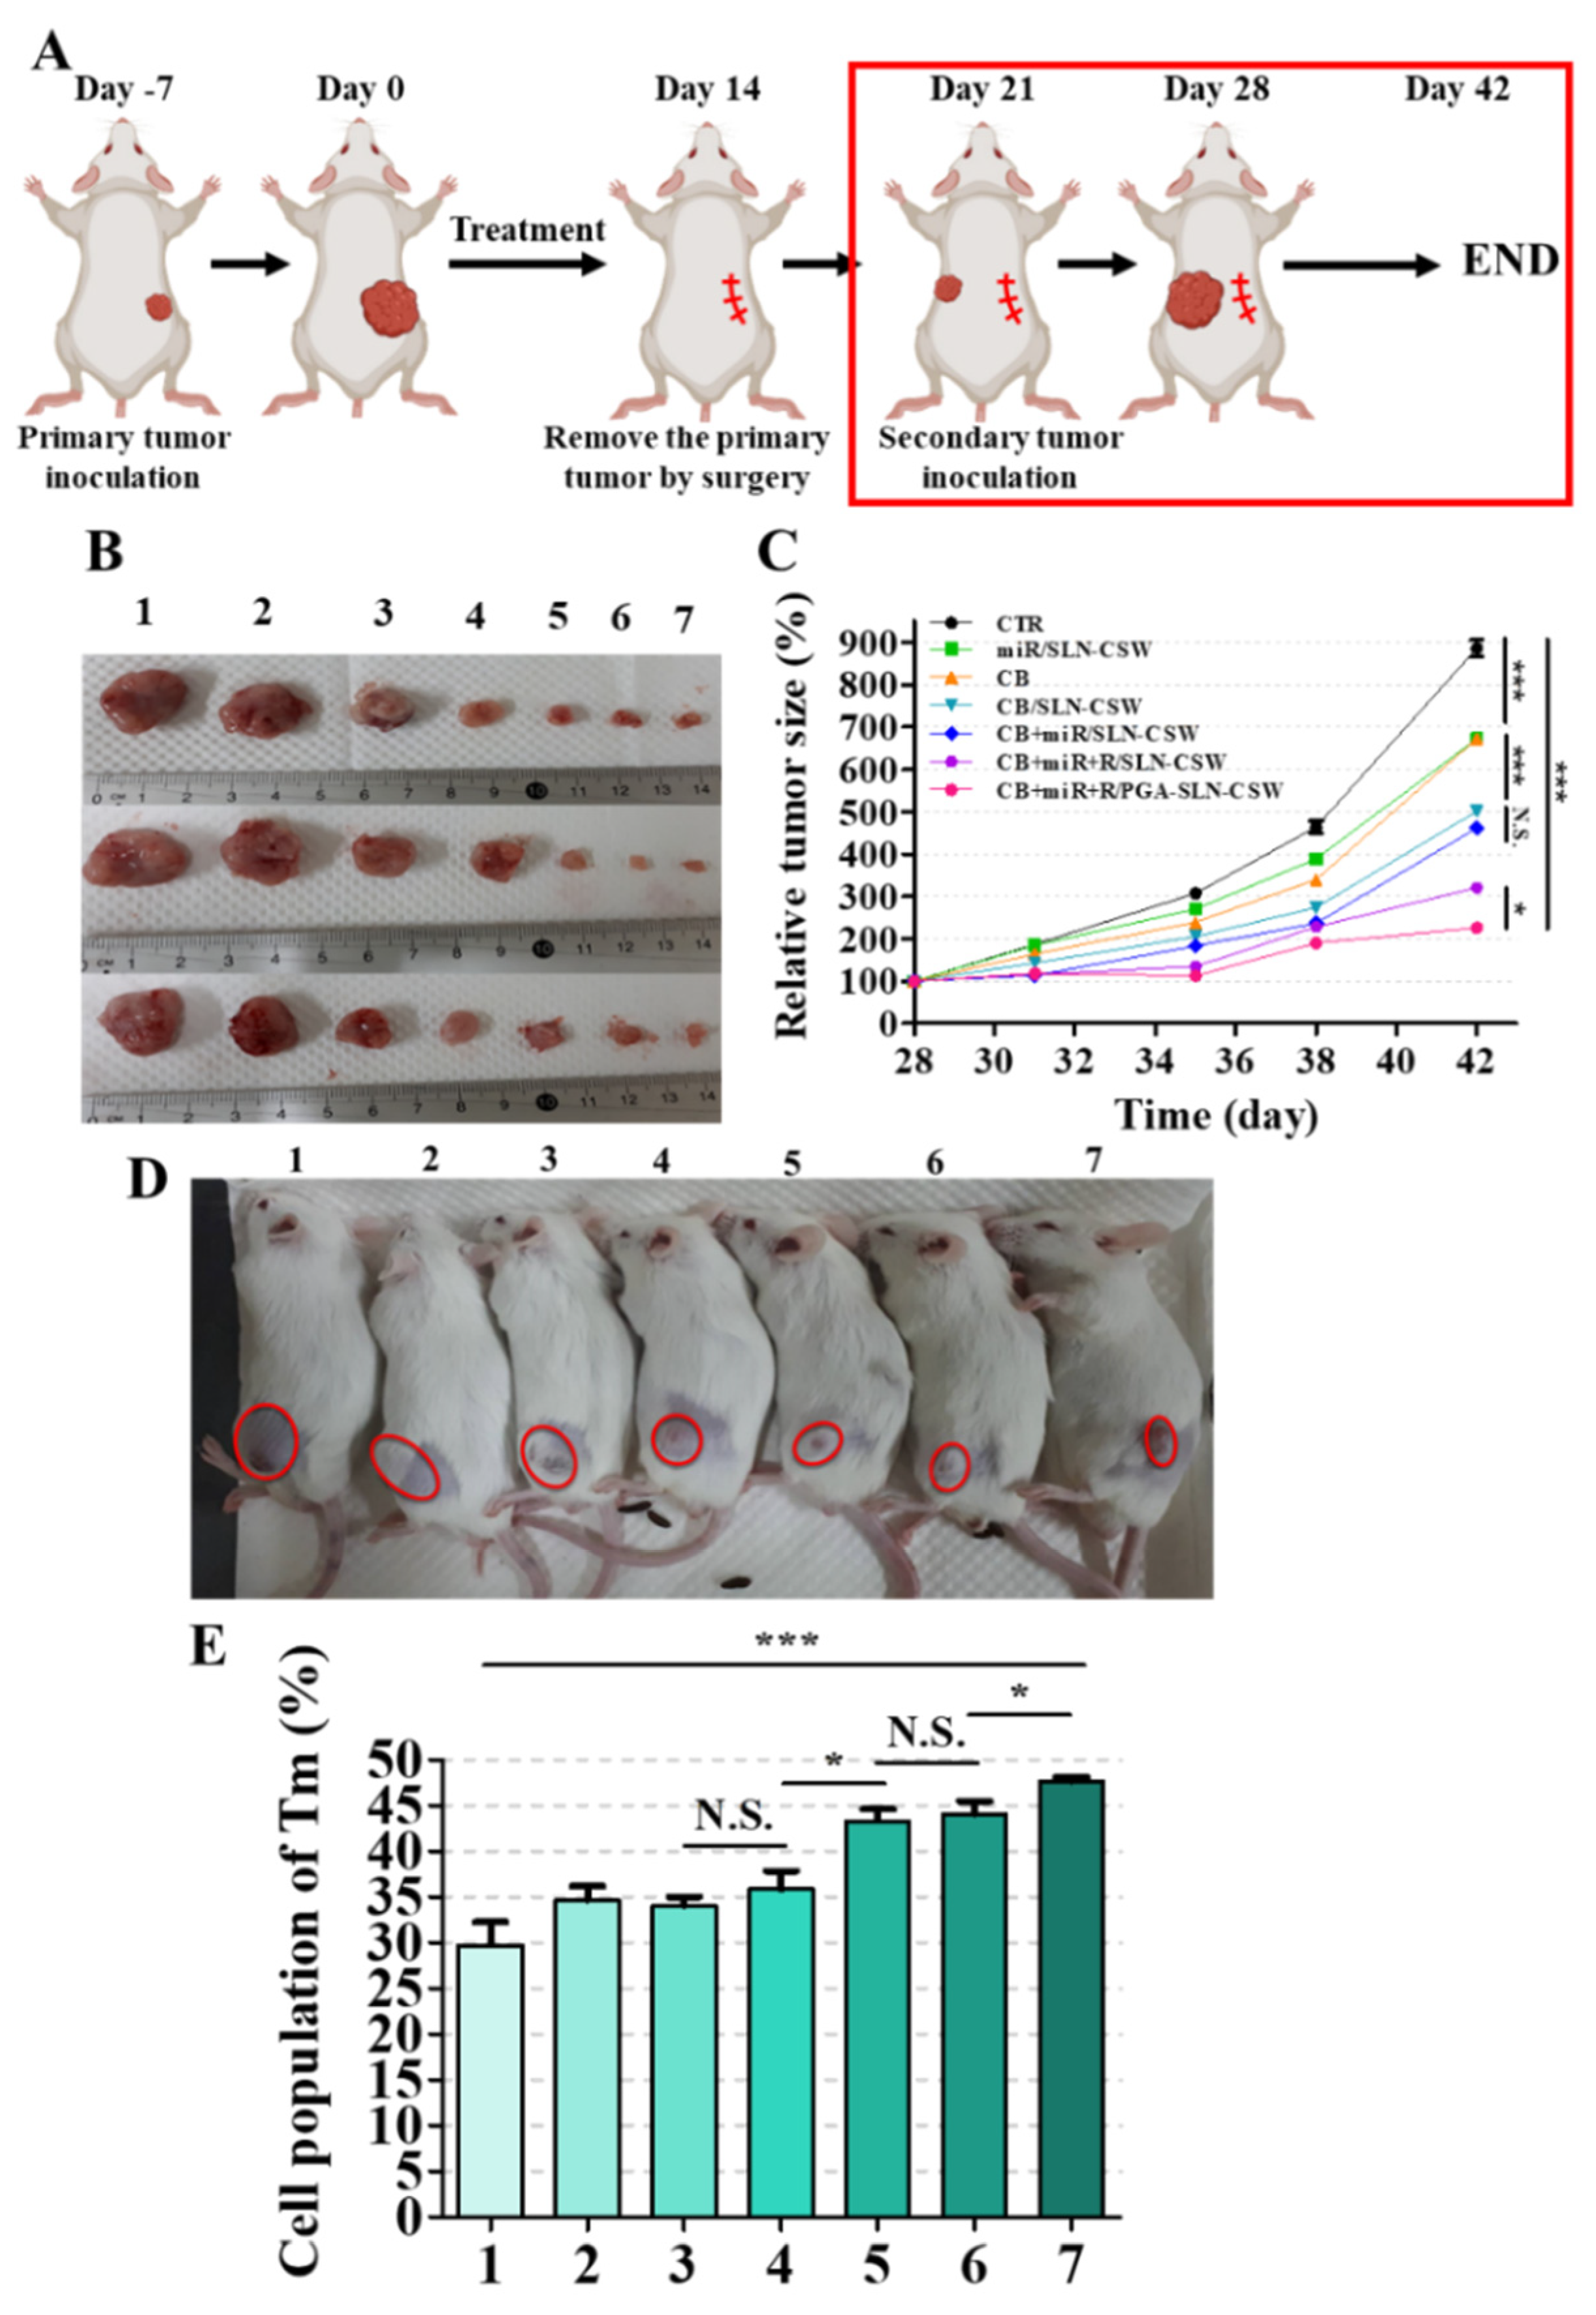
Following the 14-day treatment regimen, primary tumors were surgically excised. Seven days post-surgery, CT-26 cells (1 × 10⁶ cells in 100 μL of PBS) were re-implanted into the contralateral flank of the same mice under brief isoflurane anesthesia to assess long-term immunological memory and protective immunity against tumor rechallenge. Tumor growth was monitored by caliper measurements biweekly over an additional 2 weeks. At the end of the study, the mice were sacrificed and their spleens were harvested, minced, and washed with PBS. Single-cell suspensions were stained with fluorescein-conjugated antibodies targeting T memory cell markers and analyzed via flow cytometry using FlowJo v10 software.
2.25. Hematology and Serum Biochemistry
Whole-blood samples were obtained via retro-orbital bleeding 48 h following the final treatment. Blood cell counts, including RBCs, white blood cells (WBCs), and platelets (PLTs), were quantified using a hematology analyzer (Sysmex XT-1800iv; Sysmex, Kobe, Japan). Serum was separated by centrifugation (1500 rpm, 20 min) and analyzed for biomarkers of hepatic (glutamic-pyruvic transaminase, GPT)), cardiac (creatine kinase-MB, CK-MB), and renal (blood urea nitrogen, BUN) function using specific assay kits (Fujifilm, Tokyo, Japan) and a Fuji Dri-Chem 7000V clinical chemistry analyzer (Fujifilm Corp., Tokyo, Japan).
2.26. Biodistribution Analysis
To quantify the tissue distribution of CB at 24 h post-injection, mice (n = 3 per group) were euthanized by CO2 asphyxiation, and tissue samples (tumors, liver, spleen, kidneys, and heart) were harvested, rinsed briefly in cold PBS to remove blood, blotted dry on filter paper, weighed (50–200 mg), and immediately homogenized with ice-cold methanol (~1 mL per 100 mg tissue) and distilled water (at a ratio of methanol:water:tissue = 4:1:1 v/v/w) using a tissue homogenizer, and then incubated on ice for 15 min to allow for complete protein precipitation and CB extraction. Following centrifugation of tissue homogenates at 12,000× g for 15 min at 4 °C, the supernatant containing CB was harvested and appropriately diluted with methanol. CB levels were then quantified spectrophotometrically at 280 nm using the Ultrospec 8000 PC spectrophotometer (Biochrom, Holliston, MA, USA) at a wavelength of 280 nm after the appropriate dilution with methanol.
2.27. Statistical Analysis
Comparative statistical analyses were performed using Student’s t-test, with results expressed as means ± standard deviations (SDs). Differences were considered statistically significant at * p < 0.05, with increasing levels of significance denoted by ** p < 0.01 and *** p < 0.001.
4. Discussion
The CT26 model holds translational importance in CRC research as it recapitulates the MSS, mismatch repair–proficient phenotype that dominates the clinical landscape [
1,
2]. These tumors exhibit poor cytotoxic T lymphocyte infiltration, enrichment of immunosuppressive TAMs, and a cytokine milieu typified by IL-17, G-CSF, and CXCL-1, which collectively reinforce immune exclusion and therapeutic refractoriness [
1,
3]. The resulting TME, compounded by a dense extracellular matrix and limited drug permeability, presents formidable biological and physical barriers to therapeutic efficacy. These immunosuppressive and structural features underlie the poor responsiveness of MSS CRC to immune checkpoint inhibitors (ICIs) and highlight the need for therapeutic systems capable of remodeling the TME while preserving immune competence.
To address these challenges, a pH-sensitive PEG–PGA-coated, PD-L1/EGFR-targeted SLN system was engineered to co-deliver the proteostasis modulator CB, the immune-regulatory miR-142, and the TLR7 agonist R. The optimized formulations exhibited hydrodynamic diameters below 200 nm, a narrow PDI (~0.15), and encapsulation efficiencies above 80% (
Table 1), parameters favorable for passive and receptor-mediated tumor accumulation. TEM imaging confirmed a uniform spherical morphology without aggregation, while reproducibility analyses across independent batches demonstrated a <5% variation in size, ζ-potential, and drug loading, underscoring both formulation consistency and scalability. Long-term storage at 4 °C for 24 weeks showed no detectable change in particle size, surface charge, or polydispersity (
Figure 1C,D), further supporting suitability for extended preclinical use. Collectively, these results validate the structural integrity, batch-to-batch consistency, and translational readiness of this multifunctional nanoplatform.
Building on these physicochemical attributes, the acid-labile PEG–PGA coating was designed to conceal targeting ligands at physiological pH while enabling de-shielding and payload release within the acidic TME (
Figure 2). PD-L1- and EGFR-binding peptides facilitated dual targeting of tumor cells and TAMs, whereas the ER-homing S peptide directed intracellular trafficking toward stress-regulatory compartments [
7,
14,
15]. This hierarchical targeting strategy ensured that proteostasis disruption, checkpoint modulation, and innate immune activation occurred selectively within tumor tissues, thereby overcoming both immune resistance and physical exclusion barriers inherent to MSS CRC. Beyond confirming formulation precision and translational feasibility, these data establish a rational foundation for clinically adaptable, ER-targeted nanotherapeutics aimed at reinstating immune vigilance in CRC and other immune-refractory malignancies.
CB-5083, a first-in-class ATP-competitive VCP/p97 inhibitor, demonstrated potent preclinical anticancer activity but showed reversible visual toxicity resulting from off-target phosphodiesterase-6 (PDE6) inhibition [
16]. Other VCP inhibitors and proteostasis modulators, including ML240 and allosteric agents such as NMS-873, represent promising alternatives and further validate VCP inhibition as a viable therapeutic strategy when off-target liabilities are managed [
17,
18]. Frequent VCP overexpression in CRC [
11] suggests that dysregulated proteostasis contributes to malignant persistence and stress tolerance. CB, initially identified as a VCP inhibitor, elicited Bip-dependent ER stress in CRC cells, sequentially engaging IRE1, ATF6, and PERK branches that culminate in CHOP activation, Casp-3/9 cleavage, and LC3II/Beclin accumulation—hallmarks of apoptosis and autophagy [
7,
12,
13]. Extending this framework, the nanoformulations incorporating CB, miR, and R further intensified ER dysfunction and disrupted adaptive stress recovery in CT-26 cells (
Figure 3). VCP inhibition interfered with Bip activity and K48-linked ubiquitination, diminishing protein-folding capacity while constraining ATF6-driven transcriptional compensation. Concurrent modulation of the IRE1α–XBP1s and PERK–eIF2α/ATF4–CHOP cascades reflected sustained translational arrest and apoptotic signaling, whereas the JNK–Beclin axis mediated LC3II accumulation, which are consistent with autophagic engagement under prolonged stress.
Beyond proteostatic failure, these events intertwined with transcriptional and signaling alterations that compromise tumor cell fitness. Downregulation of cyclin D1, c-Myc, CDC20, Survivin, FBXO5, and Securin (
Figure 3E) suggested a collapse of proliferative control networks known to uphold genomic stability and chemoresistance [
19,
20,
21]. The PGA–SLN–CSW system co-delivering CB, miR, and R further reinforced this blockade, as reflected by the observed G0/G1 arrest (
Figure 3F). Attenuation of EGFR, PI3K, p-AKT, and p-mTOR (
Figure S5) implied additional disruption of oncogenic signaling that ordinarily restrains ER stress and sustains immune evasion [
22,
23]. VCP inhibition also curtailed EMT progression, lowering Smad2/3, Snail, and N-cadherin while restoring E-cadherin (
Figure 3G), thereby limiting the migratory potential (
Figure 3H). Collectively, these mechanistic layers depict a network in which impaired protein quality control, restrained growth signaling, and ER stress converge to activate apoptotic and autophagic death programs mediated by CHOP, Casp-3/9, and LC3II/Beclin [
12,
13,
24].
The triple-payload nanoformulation co-delivering CB, miR, and R elicited the most pronounced cell cycle arrest, with maximal G0/G1 accumulation observed in CB + miR + R/SLN-CSW-treated cells (
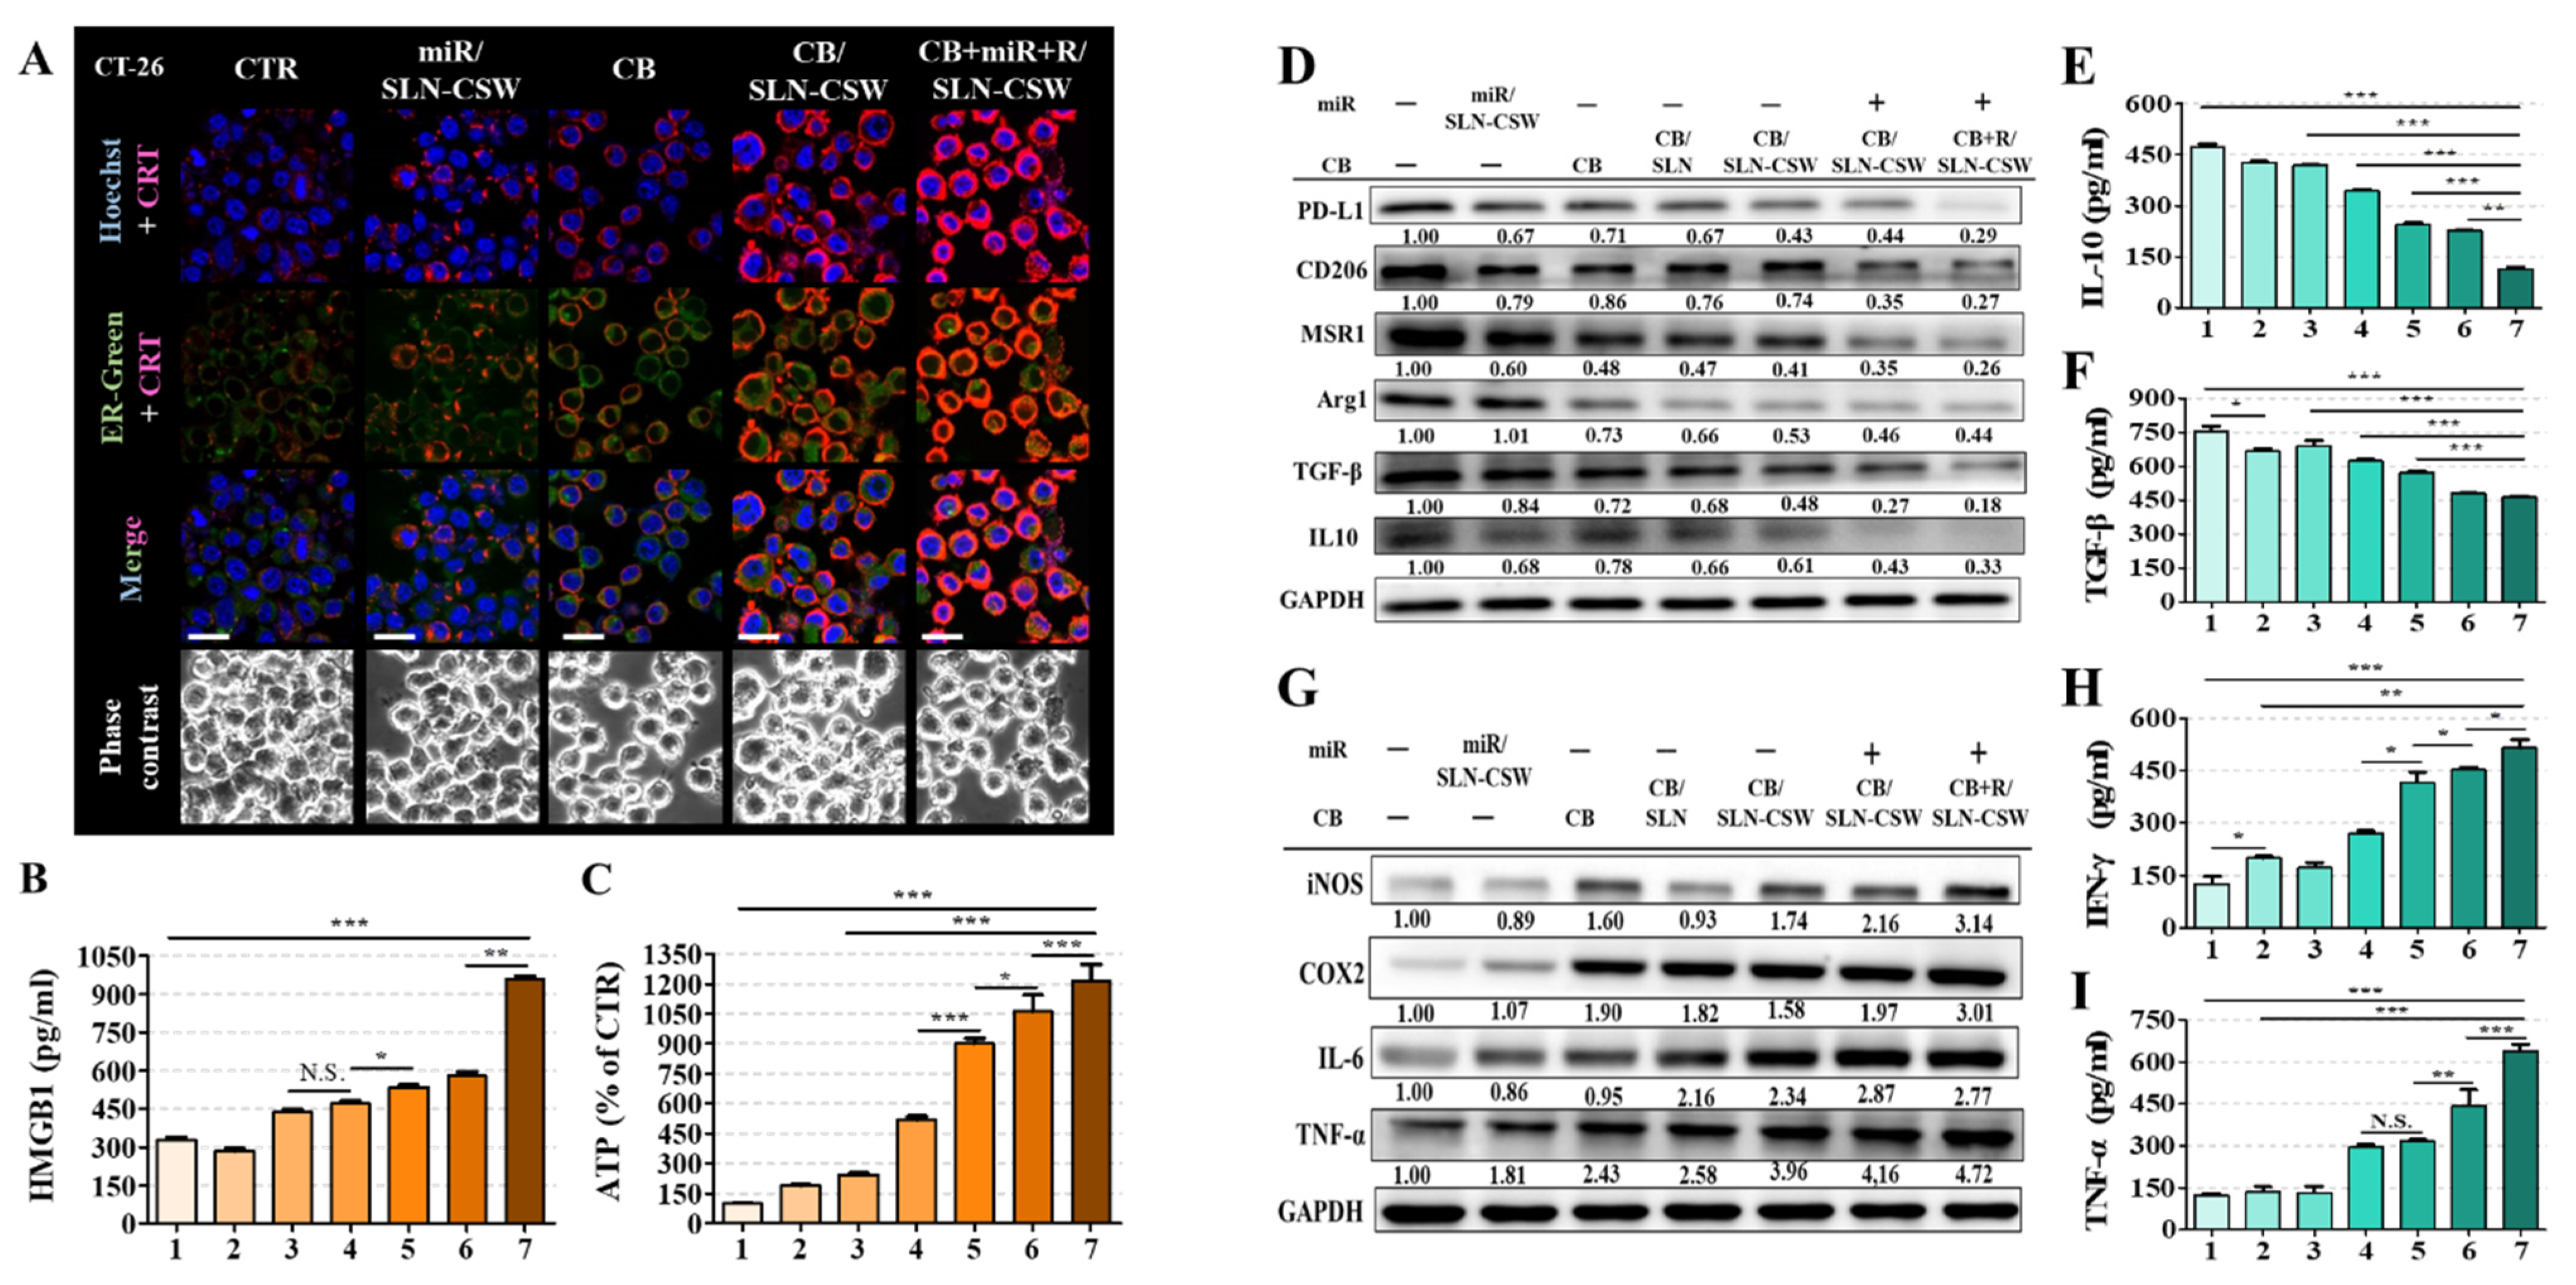
Figure 3F). These responses led to ICD, with CRT exposure, ATP release, and HMGB1 liberation (
Figure 4A–C), thereby promoting antigen presentation and effector T cell priming [
24,
25]. The delivery of miR-142 downregulated PD-L1, promoted M1-like macrophage polarization (
Figure 4D), suppressed EMT by reducing Smad2/3 and Snail expression, and restored E-cadherin, limiting tumor migration (
Figure 3G,H). R-mediated TLR7 activation induced DC maturation and pro-inflammatory cytokine production (
Figure 4D–I), further amplifying innate and adaptive antitumor responses (
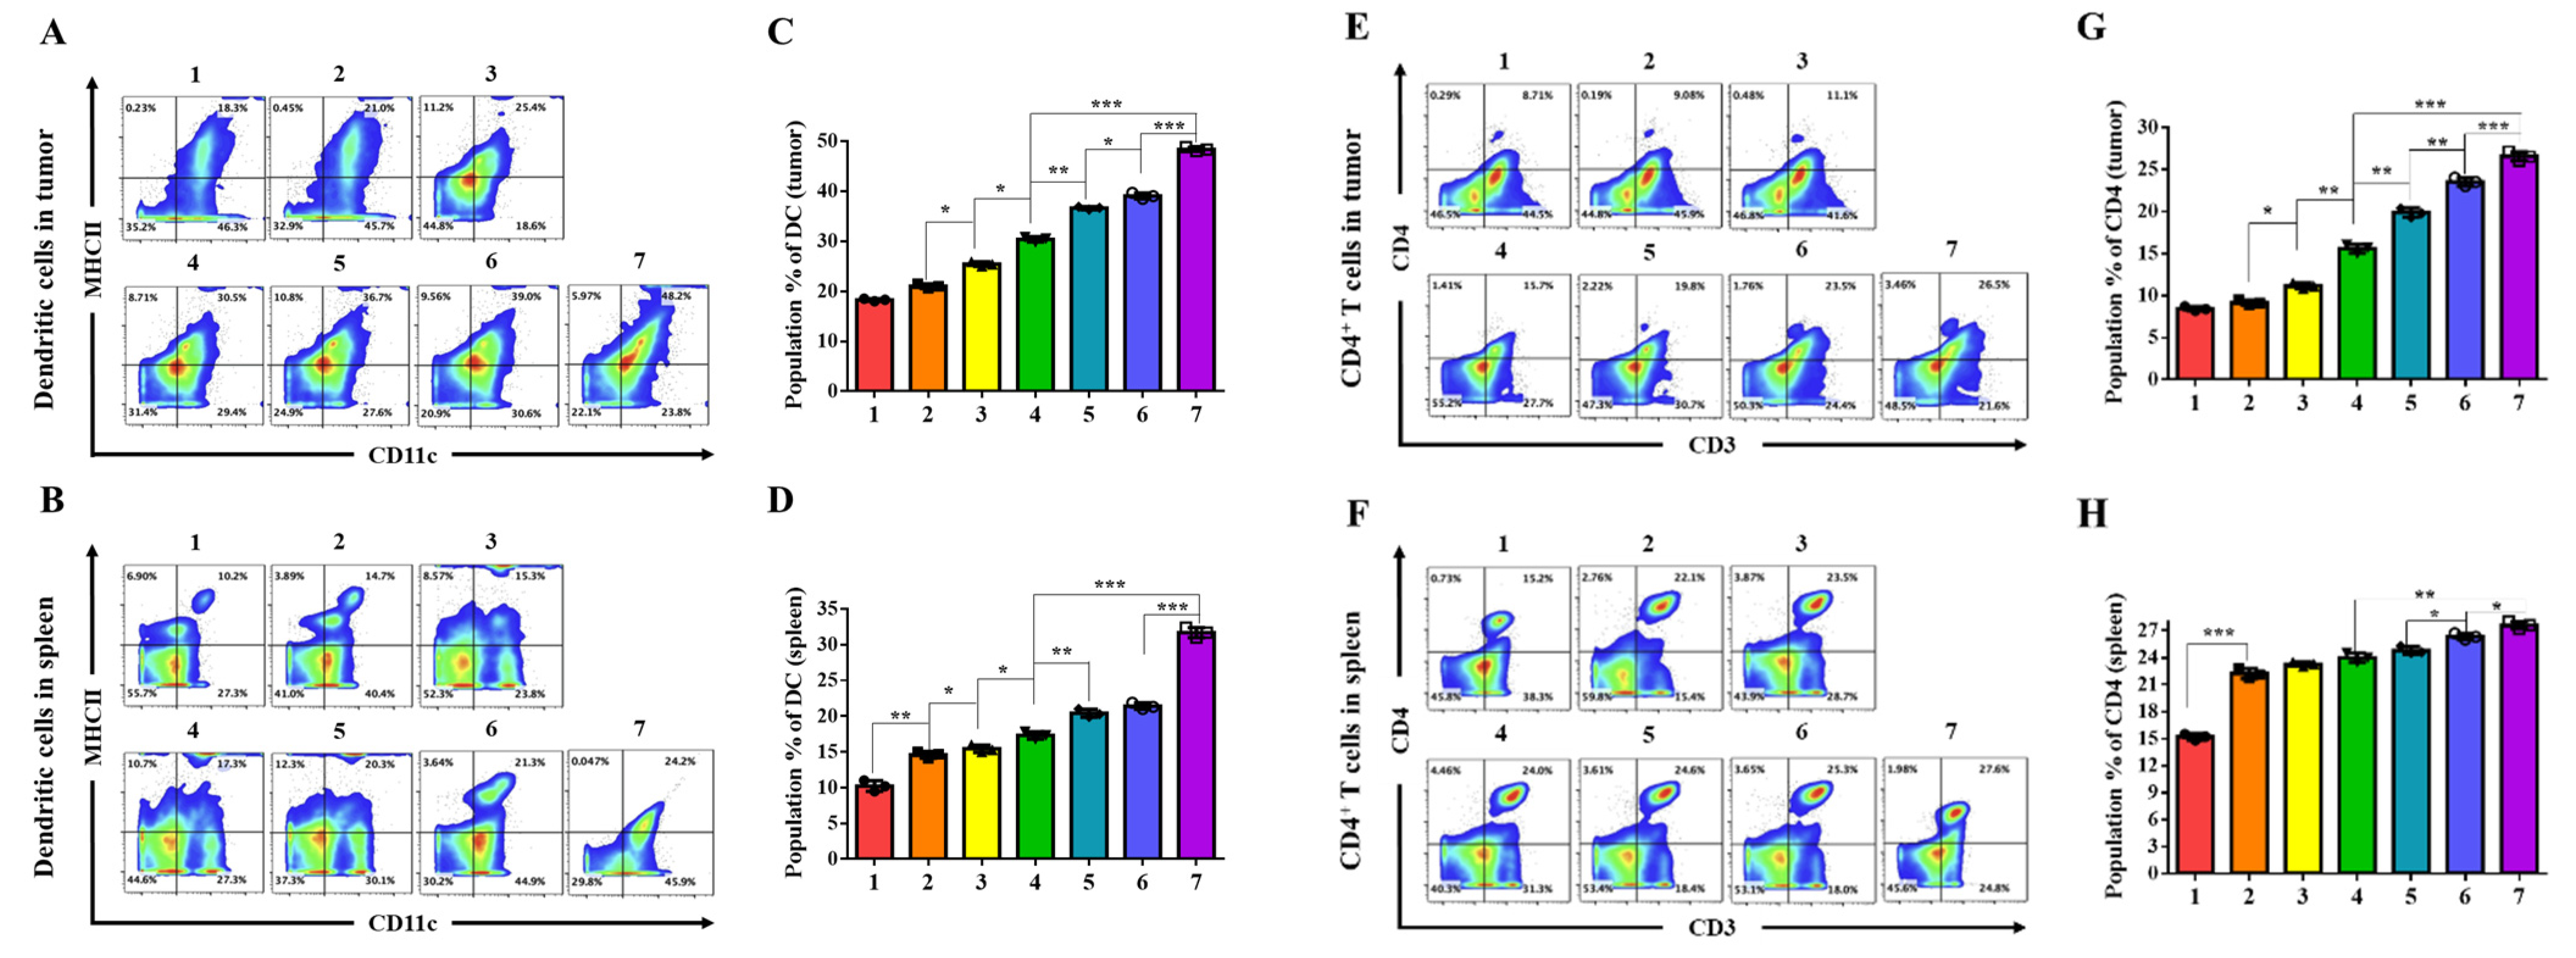
Figure 5). These findings suggest that coordinated targeting of proteostasis, checkpoint axis regulation, and TLR7 signaling not only dismantles EGFR-driven oncogenic survival circuitry but also reshapes the TME into a niche favoring T cell recruitment and immune activation, providing a mechanistically substantiated strategy to surmount immunotherapy resistance in MSS CRC.
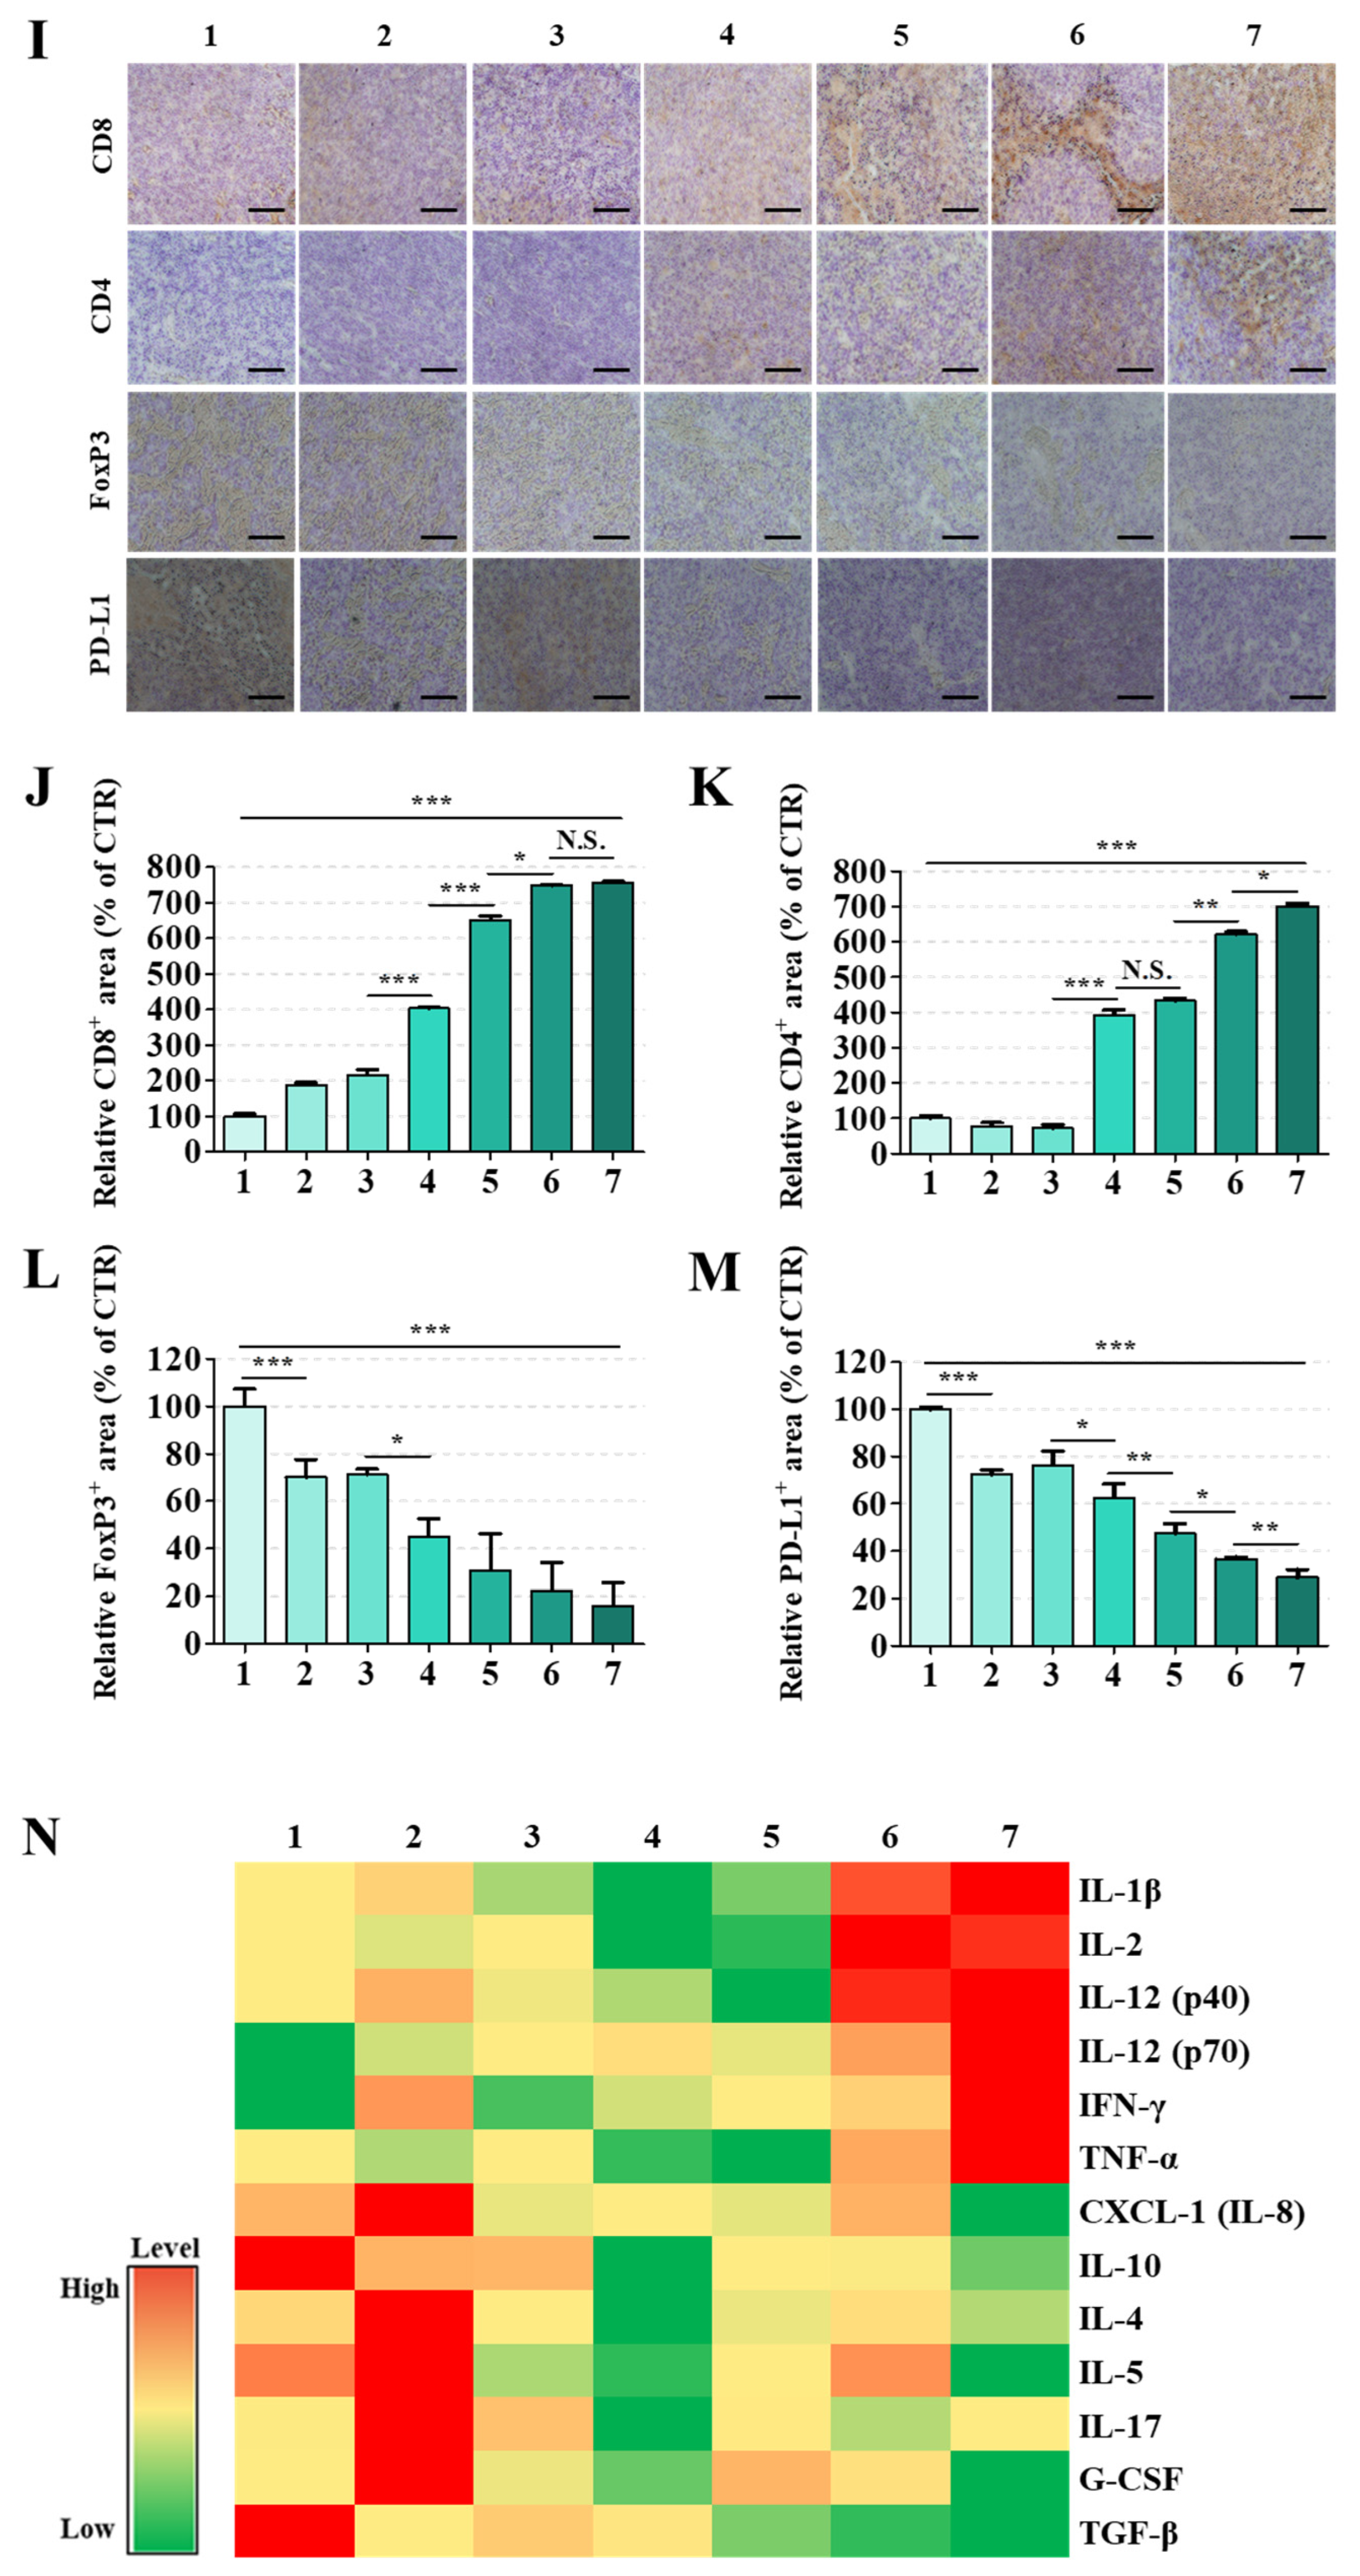
The MSS CRC TME was transformed from an immune-restrictive to a T cell-permissive state through these convergent mechanisms in vivo. Treatment with CB + miR + R/PGA-SLN-CSW increased cytotoxic (CD8
+) and helper (CD4
+) T cell populations, reduced FoxP3
+ regulatory T cells, and depleted CD206
+ M2-type TAMs within the tumor and/or spleen (
Figure 5A–M and
Figure S8–S11). Serum cytokine profiling revealed elevated TNF-α, IFN-γ, IL-2, and IL-12, concurrent with reductions in IL-17, TGF-β, and G-CSF (
Figure 5N), indicating attenuation of TAM recruitment and immunosuppression. This dual modulation of immune activation and TAM reprogramming targeted key resistance pathways in MSS CRC. In the MSS CRC setting, combination regimens incorporating CB, miR-142, and R effectively suppressed tumor burden and established long-lasting immune memory, as indicated by a durable response to tumor rechallenge and persistent effector memory T cell populations (
Figure 7). These findings suggest that combination therapy with this nanoplatform could elicit enduring antitumor immunity in tumors otherwise refractory to current immunotherapies. The tumor-selective delivery profile minimized systemic toxicity, addressing significant limitations of free CB and R [
8,
9,
26].
Treated mice maintained stable body weights, normal hematologic and biochemical indices, and intact organ histology, while biodistribution studies confirmed preferential tumor accumulation with reduced reticuloendothelial uptake (
Figure 8,
Figures S12 and S13). Although tumor-targeting peptides like our PD-L1-, EGFR-, and ER-targeting motifs are typically less immunogenic than protein biologics [
5,
18], antibody or T-cell responses can still occur, especially with repeated dosing or modified sequences. Recent studies have demonstrated that rational design can minimize this risk, but careful immunogenicity evaluation remains critical prior to clinical translation [
27]. Furthermore, serum biochemistry analysis (
Figure 8C) provides critical evidence for organ-selective delivery. While free CB induced significant hepatic (GPT:
p < 0.05) and cardiac (CK-MB,
p < 0.01) stress, nanoformulated CB eliminated these toxicity signals while achieving superior tumor control, supported by improved tumor accumulation over organs (biodistribution data;
Figure 8D). This demonstrates that targeted delivery can rescue VCP inhibitors—abandoned after CB clinical failure due to off-target toxicity [
16]—by fundamentally altering the biodistribution to achieve tumor selectivity. These findings establish a favorable therapeutic window that meets ICH S9 regulatory requirements and provide a biomarker framework for clinical monitoring in future Phase I trials.

