Article

Predicting Pharmacokinetics of Drugs in Patients with Heart Failure and Optimizing Their Dosing Strategies Using a Physiologically Based Pharmacokinetic Model

Center of Drug Metabolism and Pharmacokinetics, School of Pharmacy, China Pharmaceutical University, Nanjing 210009, China
*
Author to whom correspondence should be addressed.
Pharmaceutics 2025, 17(11), 1394; https://doi.org/10.3390/pharmaceutics17111394
Submission received: 19 August 2025 / Revised: 12 October 2025 / Accepted: 21 October 2025 / Published: 28 October 2025
(This article belongs to the Special Issue Recent Advances in Physiologically Based Pharmacokinetics)

Abstract

Background: Heart failure (HF), as the end stage of various cardiac diseases, alters blood flow to key organs responsible for drug clearance. This can lead to unpredictable and often suboptimal drug exposure, creating a critical need for quantitative tools to guide precise dosing in this vulnerable population. Methods: This study aimed to establish a whole-body physiologically based pharmacokinetic (PBPK) model for characterizing drug pharmacokinetics in both healthy subjects and patients across the HF severity spectrum. Eight commonly used drugs (digoxin, furosemide, bumetanide, torasemide, captopril, valsartan, felodipine and midazolam) for treating HF and its comorbidities were selected. Following successful validation against clinical data from healthy subjects, the PBPK model was extrapolated to HF patients. Pharmacokinetics of the eight drugs in 1000 virtual HF patients were simulated by replacing tissue blood flows and compared using clinical observations. Results: Most of the observed concentrations were encompassed within the 5th–95th percentiles of simulated values from 1000 virtual HF patients. Predicted area under the concentration–time curve and maximum plasma concentration fell within the 0.5~2.0-fold range relative to clinical observations. Sensitivity analysis demonstrated that intrinsic renal clearance, unbound fraction in blood, muscular blood flow, and effective permeability coefficient significantly impact plasma exposure of digoxin at a steady state. Oral digoxin dosing regimens for HF patients were optimized via the validated PBPK model to ensure that steady-state plasma concentrations in all HF patients remain below the toxicity threshold (2.0 ng/mL). Conclusions: A PBPK model was successfully developed to predict the plasma concentration–time profiles of the eight tested drugs in both healthy subjects and HF patients. Furthermore, this model may also be applied to guide digoxin dose optimization for HF patients.

1. Introduction

Heart failure (HF) represents the terminal pathological convergence of diverse cardiac and extracardiac disorders, manifesting as a multifaceted clinical syndrome exhibiting phenotypic heterogeneity. HF is classified into functional classes I–IV according to the New York Heart Association (NYHA)’s criteria [1,2]. Patients with HF commonly exhibit concomitant systemic hypertension and/or coronary artery disease [3], leading to hemodynamic redistribution across hepatic, renal, and gastrointestinal circulations. Hemodynamic quantification studies revealed progressive perfusion deficits in NYHA class II–IV patients, with hepatic perfusion at 76%, 54%, and 46% of age-matched controls, and renal perfusion at 78%, 55%, and 63%, respectively [2]. HF demonstrates significant comorbidity clustering, with diabetes mellitus, chronic obstructive pulmonary diseases, and anemia representing the predominant concurrent conditions. HF-induced hemodynamic perturbations and multiorgan dysfunction affecting hepatic, renal, and gastrointestinal systems critically modulate the pharmacokinetic–pharmacodynamic profiles of therapeutic agents and comorbidity treatments. The effects of HF on drug pharmacokinetics exhibit substantial variability. For instance, patients with HF demonstrate a 29% reduction in D-xylose absorption (reflecting carrier-mediated transport activity) alongside a 35% increase in intestinal permeability (assessed via urinary 5 h lactulose/mannitol ratio) compared to healthy subjects [4]. Similarly, the pharmacokinetics of midazolam are altered in HF, exhibiting a 30% decrease in systemic clearance and a prolonged elimination half-life [5]. While oral absorption of torasemide remains unchanged in HF patients, time to peak concentration increases from 0.9 h in healthy subjects to 1.7 h in HF patients. The oral clearance, renal, and non-renal clearances of torasemide are, respectively, reduced by 44%, 38%, and 46% of healthy subjects, leading to increases in plasma exposure of torasemide by 107% [6]. These collective factors confer significant complexity to pharmacotherapeutic optimization in HF patients, thereby creating substantial challenges for drug dosing and efficacy attainment. The physiologically based pharmacokinetic (PBPK) modeling integrates human physiological parameters with drug-specific physicochemical properties to predict drug pharmacokinetics in patients, serving as an advanced methodology for clinical pharmacokinetic prediction in this population [7,8].
The objective of this study was to develop a PBPK model that accounts for HF-induced alterations in tissue perfusion and hepatic/renal functions to predict drug pharmacokinetics in HF patients. Eight therapeutic agents were selected for evaluation: a cardiac glycoside (digoxin); diuretics (furosemide, bumetanide, and torasemide); an angiotensin-converting enzyme inhibitor (captopril); an angiotensin II receptor antagonist (valsartan); a calcium channel blocker (felodipine); and a sedative-hypnotic (midazolam). This selection was designed to cover a wide range of elimination pathways (renal and hepatic) and physicochemical properties, providing a robust test for the model’s capability. Of particular interest was digoxin, a narrow-therapeutic-index drug whose complex pharmacokinetics have been the subject of numerous PBPK studies, making it a critical model drug to test the impact of HF-specific hemodynamic changes. The model predictions were validated against clinical pharmacokinetic data obtained from HF patients. A virtual clinical trial was subsequently conducted using the validated PBPK model to enable dose optimization in HF patients through comparative assessment of plasma exposure profiles between HF patients and healthy subjects.

2. Methods

2.1. General Workflow

The PBPK modeling workflow for HF patients is schematically presented in Figure 1. First, a whole-body PBPK model was constructed to simulate drug pharmacokinetics in a virtual healthy population, with validation performed using clinical pharmacokinetic data. Subsequently, the model was adapted to HF patients by modifying system-specific physiological parameters. Pharmacokinetic predictions were conducted in 1000 virtual HF patients and compared with clinical pharmacokinetic data from the literature. Ultimately, the validated model was subsequently applied to explore dose optimization strategies in HF patients.

2.2. Model Development

A PBPK model was developed to concurrently predict the pharmacokinetics of eight commonly used drugs in HF patients (Figure 2). According to the anatomical structure of body, the PBPK model consists of the stomach, intestine, liver, kidney, lung, heart, brain, muscle, adipose, skin, arterial blood, venous blood, and the rest of body (ROB), which are connected by the blood circulation system. The intestine is anatomically divided into the duodenum, jejunum, ileum, caecum, and colon, each comprising an intestinal wall and lumen. It was assumed that drug absorption would only occur at the duodenum, jejunum, and ileum, and that intestinal absorption of the drug would be a first-order process. The corresponding mass equations are illustrated in the Supplementary Information.

2.3. Model Development in HF Patients

The coding and solving of the PBPK model were conducted using Phoenix WinNonlin software (Version 8.4, Certara, Radnor, PA, USA). All of the available information on anatomical and physiological parameters in 70 kg healthy subjects and the pharmacokinetic parameters of the tested drugs were collected for the initial model construction (Table S1). Kt:p values of the indicated drugs were estimated using Rodgers’ and Ruark’s methods [9,10]. Pharmacokinetic parameters of the indicated drugs were directly cited from the literature/website or were estimated/optimized from predicted pharmacokinetic data using Phoenix WinNonlin 8.4.
The PBPK model was first validated using clinical observations from healthy subjects. Subsequently, it was adapted for HF patients by replacing the anatomical and physiological parameters of healthy individuals with those specific to HF patients. It was assumed that HF mainly affected total blood flow and tissue blood flow without affecting the intrinsic clearance of drugs in the liver and kidneys. The cardiac output and tissue blood flow in HF patients were estimated using the relationship between central hemodynamics and regional blood flow in normal subjects and in HF patients according to previous reports [2,11,12], i.e., hepatic blood flow in patients with mild, moderate, and severe heart failure declined to 76%, 54%, and 46% of baseline levels, respectively; renal blood flow was reduced to 78%, 55%, and 63% of baseline levels; while blood flow to the skin, adipose tissue, and muscle decreased to 57%, 44%, and 28% of baseline levels [2]. Alterations in the gastrointestinal and splenic blood flow were assumed to be in parallel with alterations in hepatic blood flow. The calculated tissue blood flows in HF patients are listed in Table 1.
The simulations incorporated four virtual populations (normal population and HF patients with grade II, grade III, and grade IV), each comprising 1000 independently generated virtual individuals (weighing 70 kg). It was assumed that the physiologic parameters (such as tissue volumes and blood flows) were held constant across all subjects; each virtual subject was created through systematic sampling of five key parameters: CLli,int, CLk,int, fu,b, Peff, and ka. These parameters were randomly sampled within 80–120% of their baseline values to establish individual variability. The exponential model and multiplicative residual error model were used to simulate the inter-individual and intra-individual variability of these parameters. The first-order conditional estimation-extended least squares algorithm was implemented as the computational engine for parameter estimation. Pharmacokinetic characterization was performed using 10 independent Monte Carlo simulations in a virtual cohort of 1000 subjects, ensuring reliable population variability analysis. This iterative process enabled the derivation of reliable pharmacokinetic reference ranges, specifically the 5th, 50th, and 95th percentiles, using population-level aggregation of simulation outcomes.

2.4. Criterion of the Developed PBPK Model

The PBPK model was considered to be successful (1) if the simulated area under the curve (AUC) or maximum plasma concentration (Cmax) fell within 0.5~2.0-fold range of the clinical observations or (2) the observations were within the 5th–95th percentiles of the simulation derived from 1000 virtual subjects.
Effects of HF on the plasma exposure of the tested drugs were indexed as the ratio of AUC in HF patients to that in healthy subjects (AUCR) or the ratio of Cmax in HF patients to that in healthy subjects (CmaxR), i.e.,
A U C R = A U C H F A U C H
A U C R = C L H C L H F
where AUCHF, AUCH, CLHF, CLH, Cmax,HF, and Cmax,H represent the AUC, CL, and Cmax of the tested drugs in HF patients and healthy subjects, respectively.

3. Results

3.1. Drug Data Set

The tested drugs were collected from publications on PubMed based on the following criteria: (1) The drugs were orally or intravenously administered to both healthy subjects and HF patients. (2) Formulations for oral administration of the indicated drug were immediately released. (3) Plasma concentration–time profiles or their main plasma exposure parameters such as AUC or Cmax were shown. (4) The pharmacokinetics of the indicated drugs in healthy subjects and HF patients could be derived from different clinic reports. Eight drugs, including digoxin, furosemide, bumetanide, torasemide, captopril, valsartan, felodipine, and midazolam, were selected to validate the developed PBPK model for HF patients. The description of the tested drugs is shown in the Supplementary Materials. The collected pharmacokinetic parameters of the drugs and the drugs’ information in clinical reports are listed in Tables S2 and S3.

3.2. Development of PBPK Model and Validation in Healthy Subjects

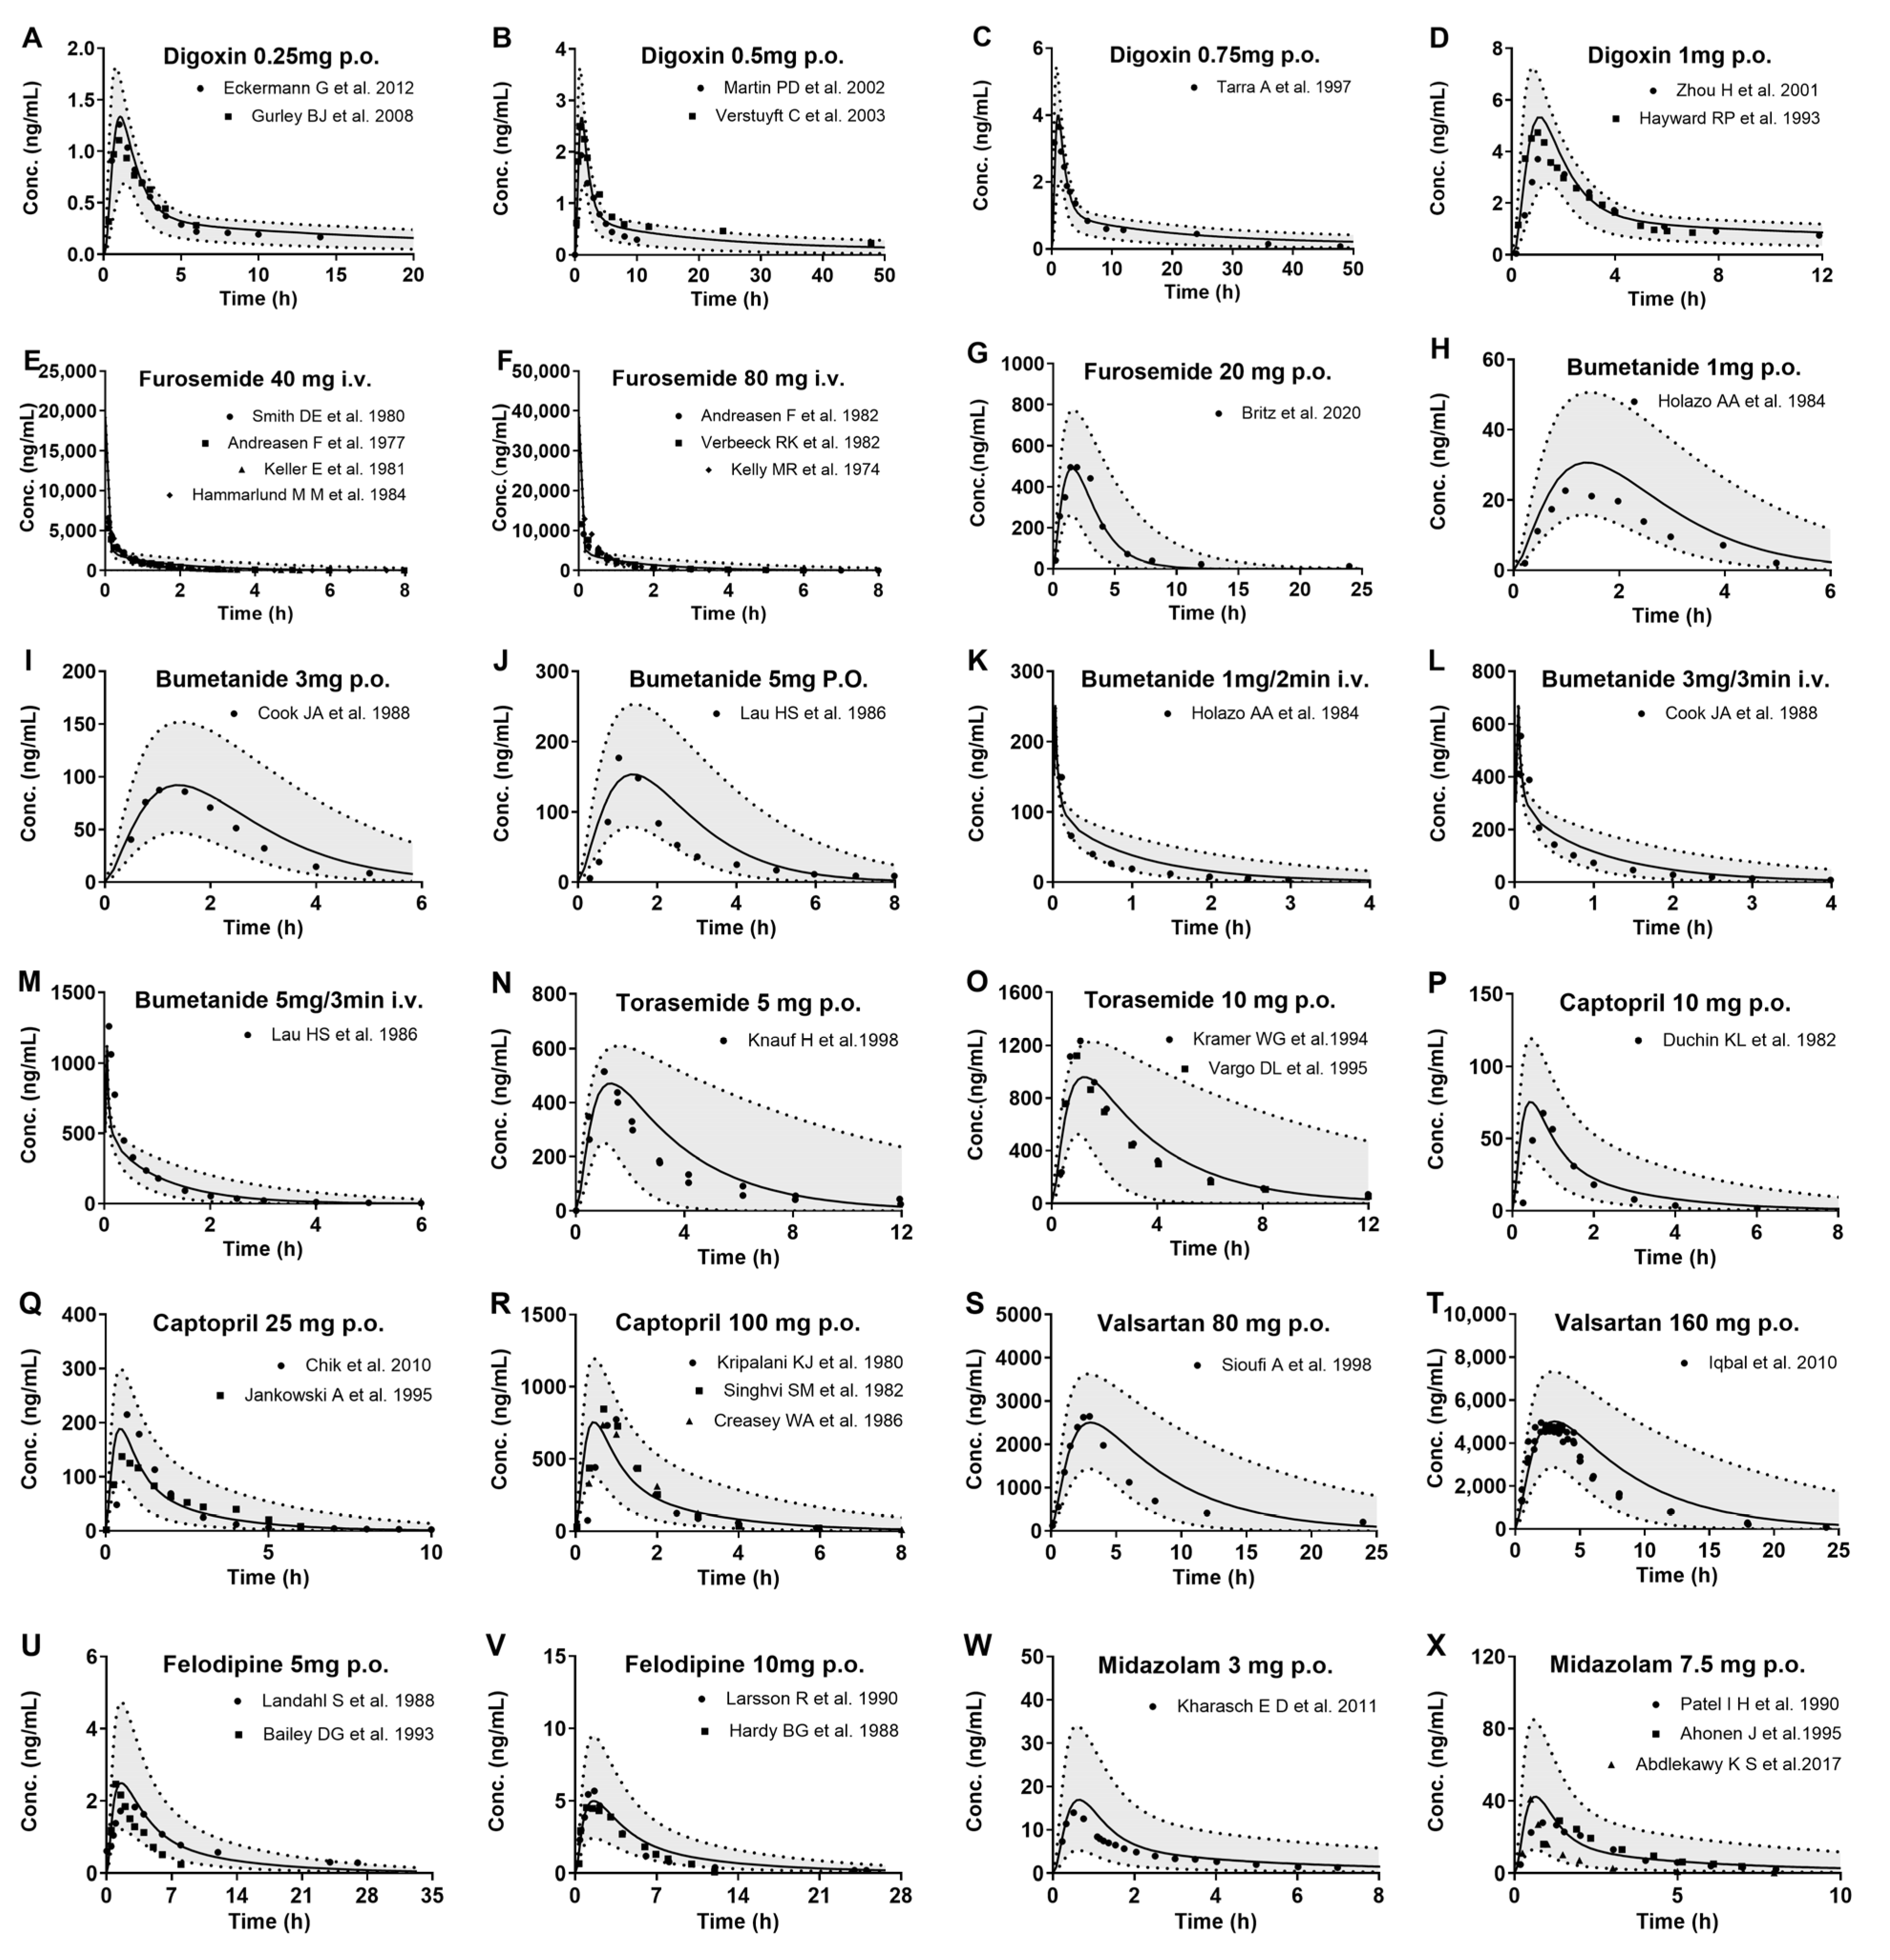
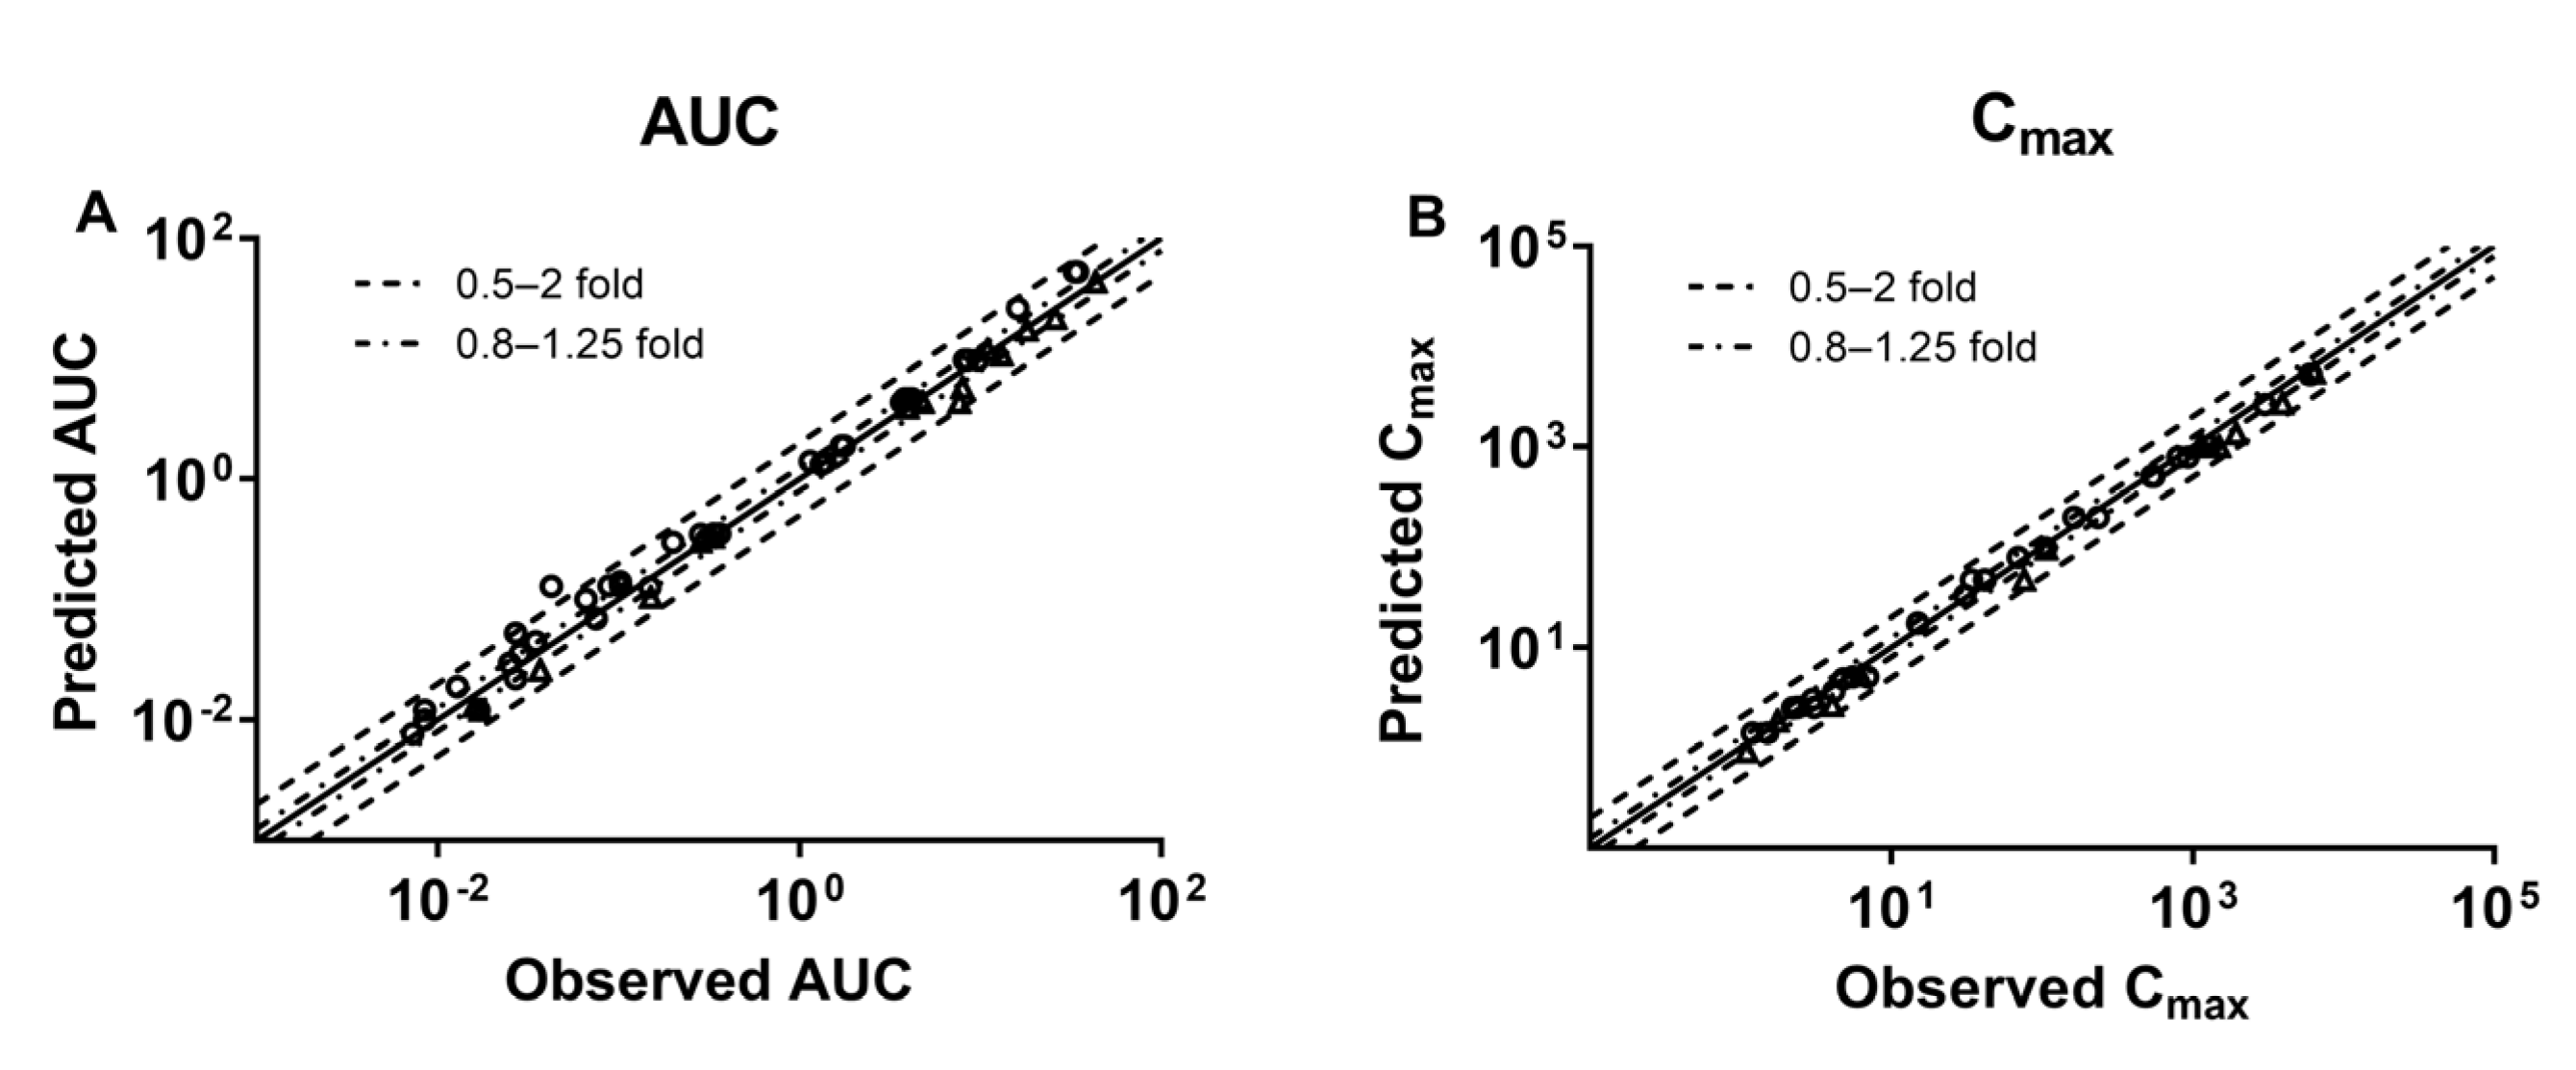
Plasma concentration–time profiles of the eight tested drugs following intravenous injection or oral administration to healthy subjects were simulated using the developed PBPK model and compared with clinical observations (Figure 3). The information of drugs and healthy subjects is shown in Table S3. The results show that most of the observed data of the tested agents fell within the 5th–95th percentiles of the simulated data. Plasma concentrations were estimated using the simulated data derived from 1000 virtual individuals and compared with clinical observations. Except for overestimation in AUC of midazolam, almost 70/71 of simulated pharmacokinetic parameters (AUC and Cmax) values for the eight tested drugs were within 0.5~2.0-fold range relative to observations (Table S4 and Figure 5). All of the results demonstrate that the PBPK model was successfully developed.

3.3. Development of PBPK Model and Validation in HF Patients

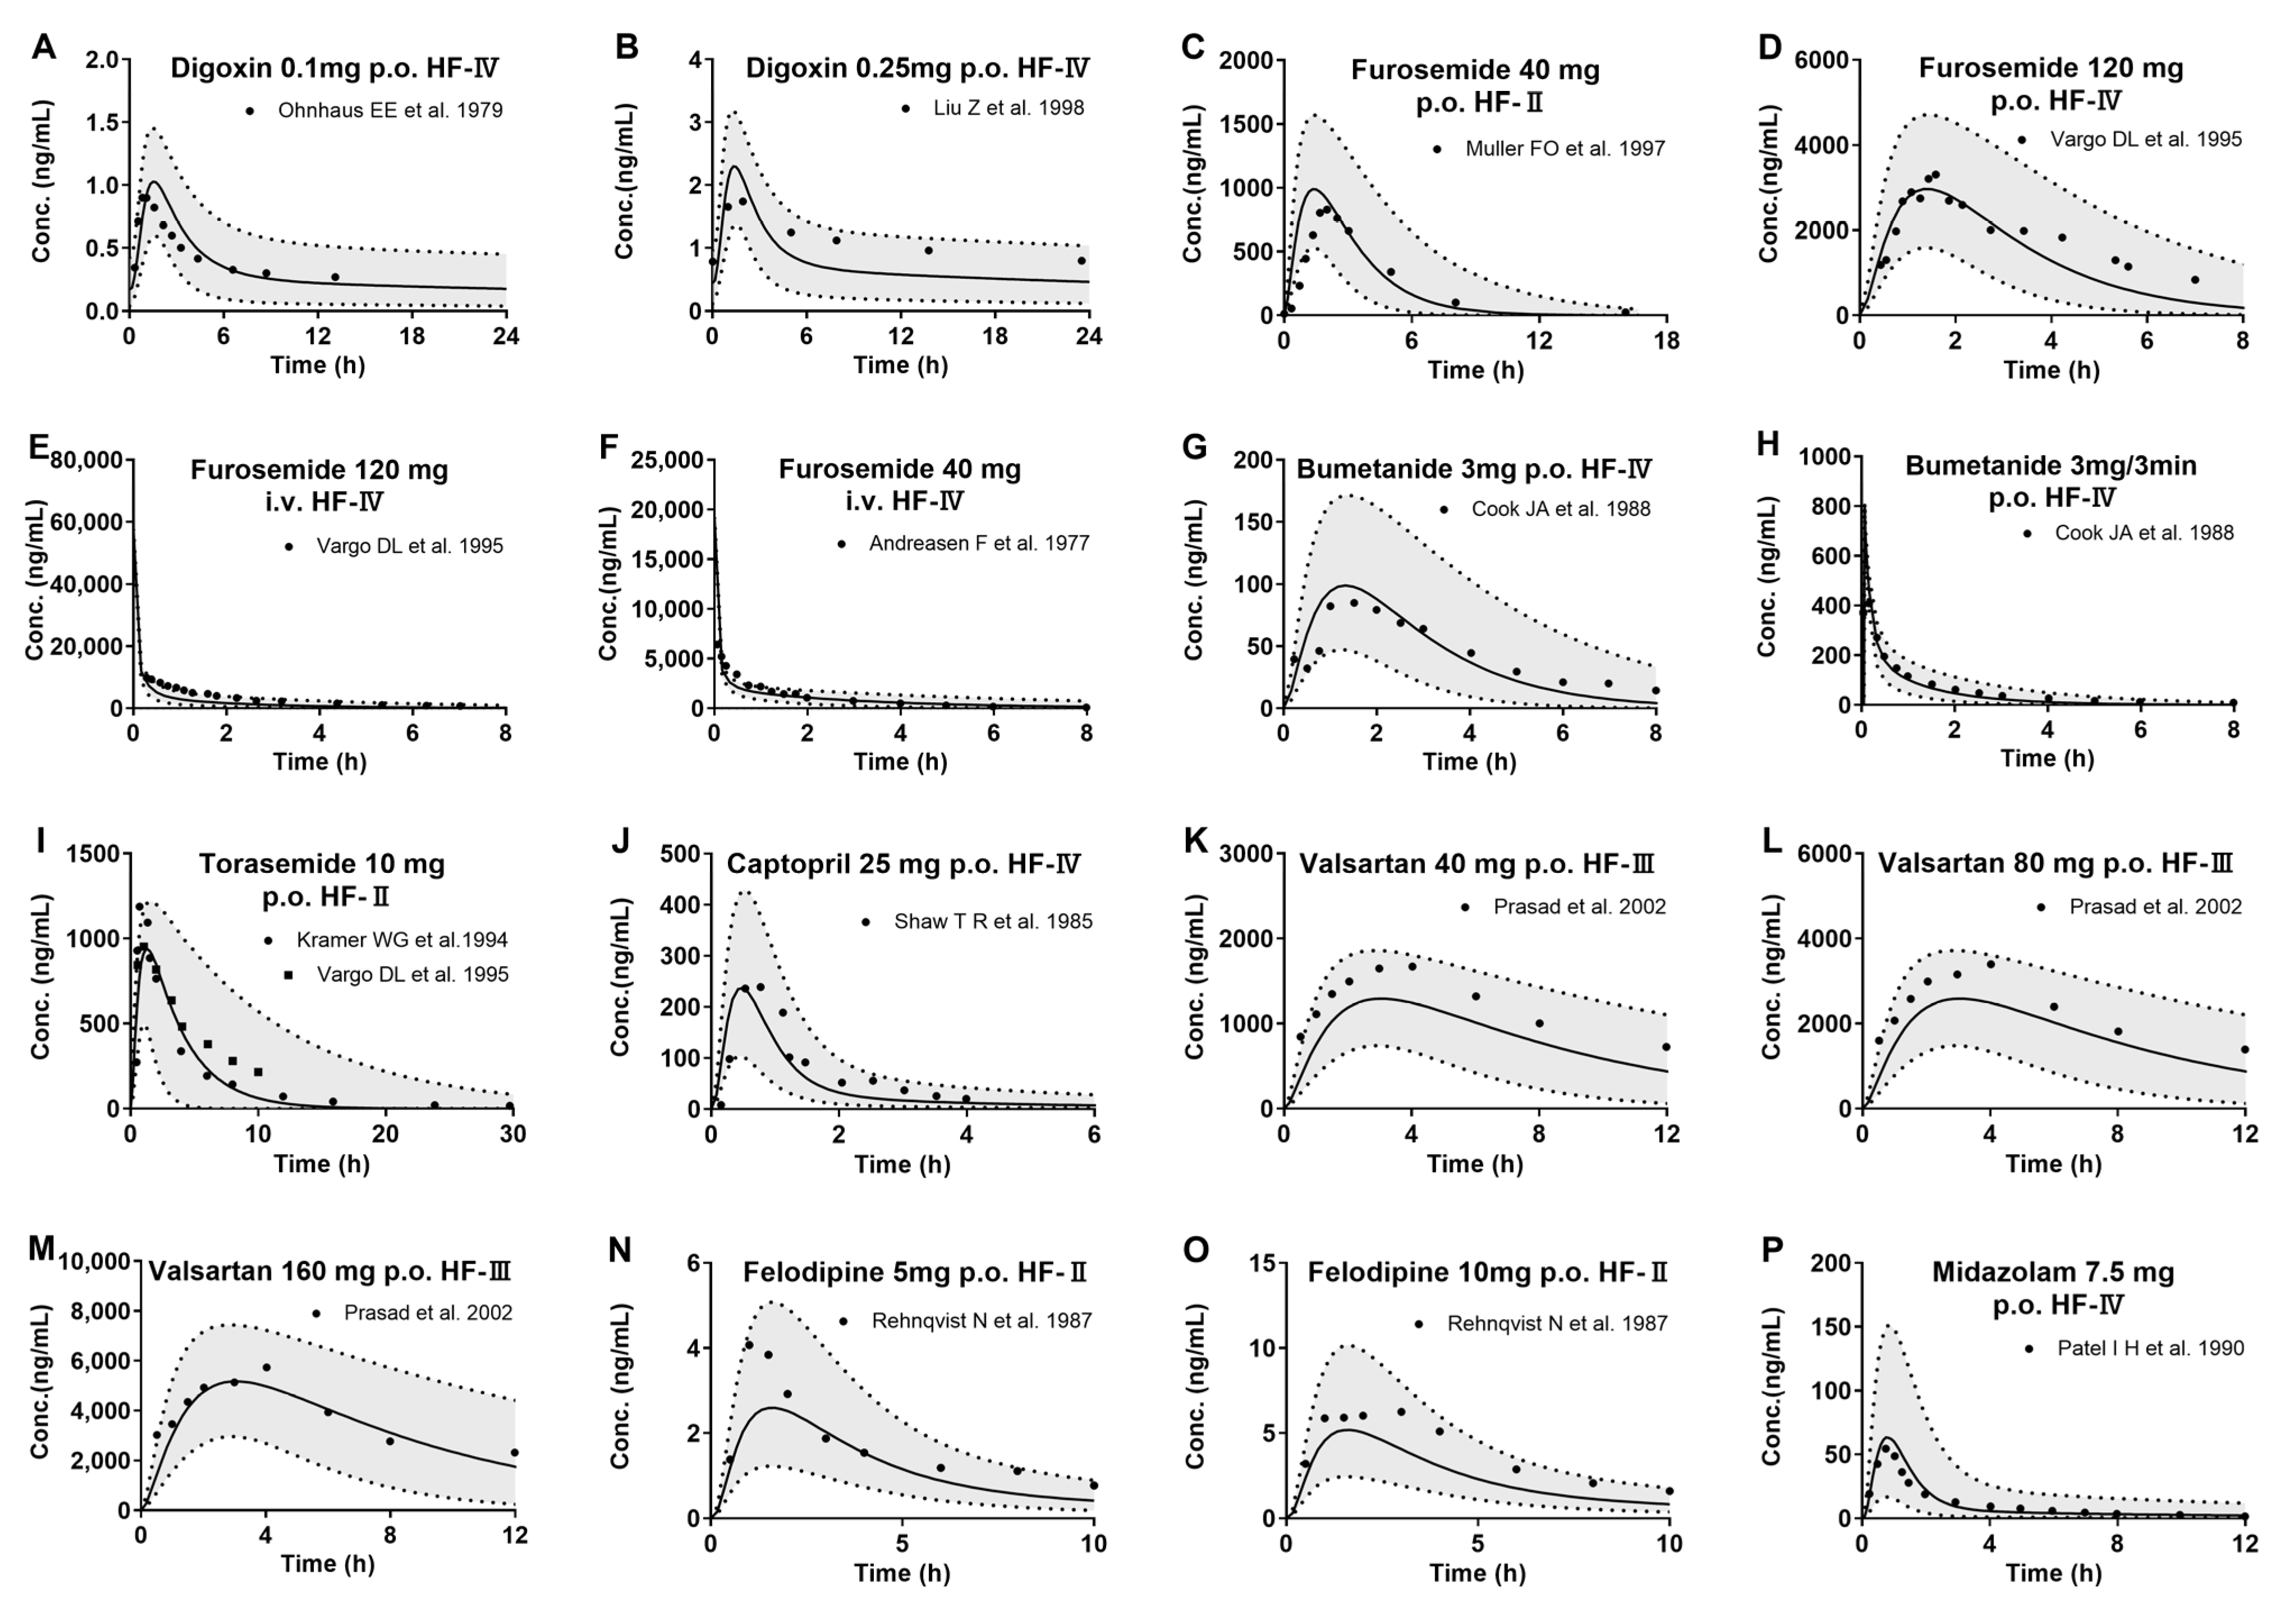
The developed PBPK model, following validation in healthy subjects, was used to predict the plasma concentrations of the eight tested drugs following intravenous or oral administration to 1000 virtual HF patients (Figure 4). According to corresponding clinical scenarios, plasma concentration profiles of drugs were simulated and pharmacokinetic parameters (AUC and Cmax) were estimated. The results show that the observed drug concentrations of the eight tested drugs in HF patients were within the 5th–95th percentiles of pharmacokinetic profiles derived from 1000 virtual HF patients. All of the estimated AUC and Cmax values were also within 0.5~2.0-fold of clinical observations, and most were within the 0.8–1.25-fold range (Figure 5 and Table 2).
Extents of alterations in pharmacokinetic parameters under HF, AUCR, and CmaxR were also predicted using the estimated pharmacokinetic parameters (Figure 6) and compared with clinical observations. AUC or Cmax values originated from different clinical reports or different doses; thus, the AUC or Cmax values were normalized by dose. The results show that the vast majority of the predicted AUCR and CmaxR were close to clinical observations. These results collectively demonstrate that the pharmacokinetic profiles of the eight tested drugs in HF patients were successfully predicted using the developed PBPK model.

3.4. Sensitivity Analysis of Model Parameters

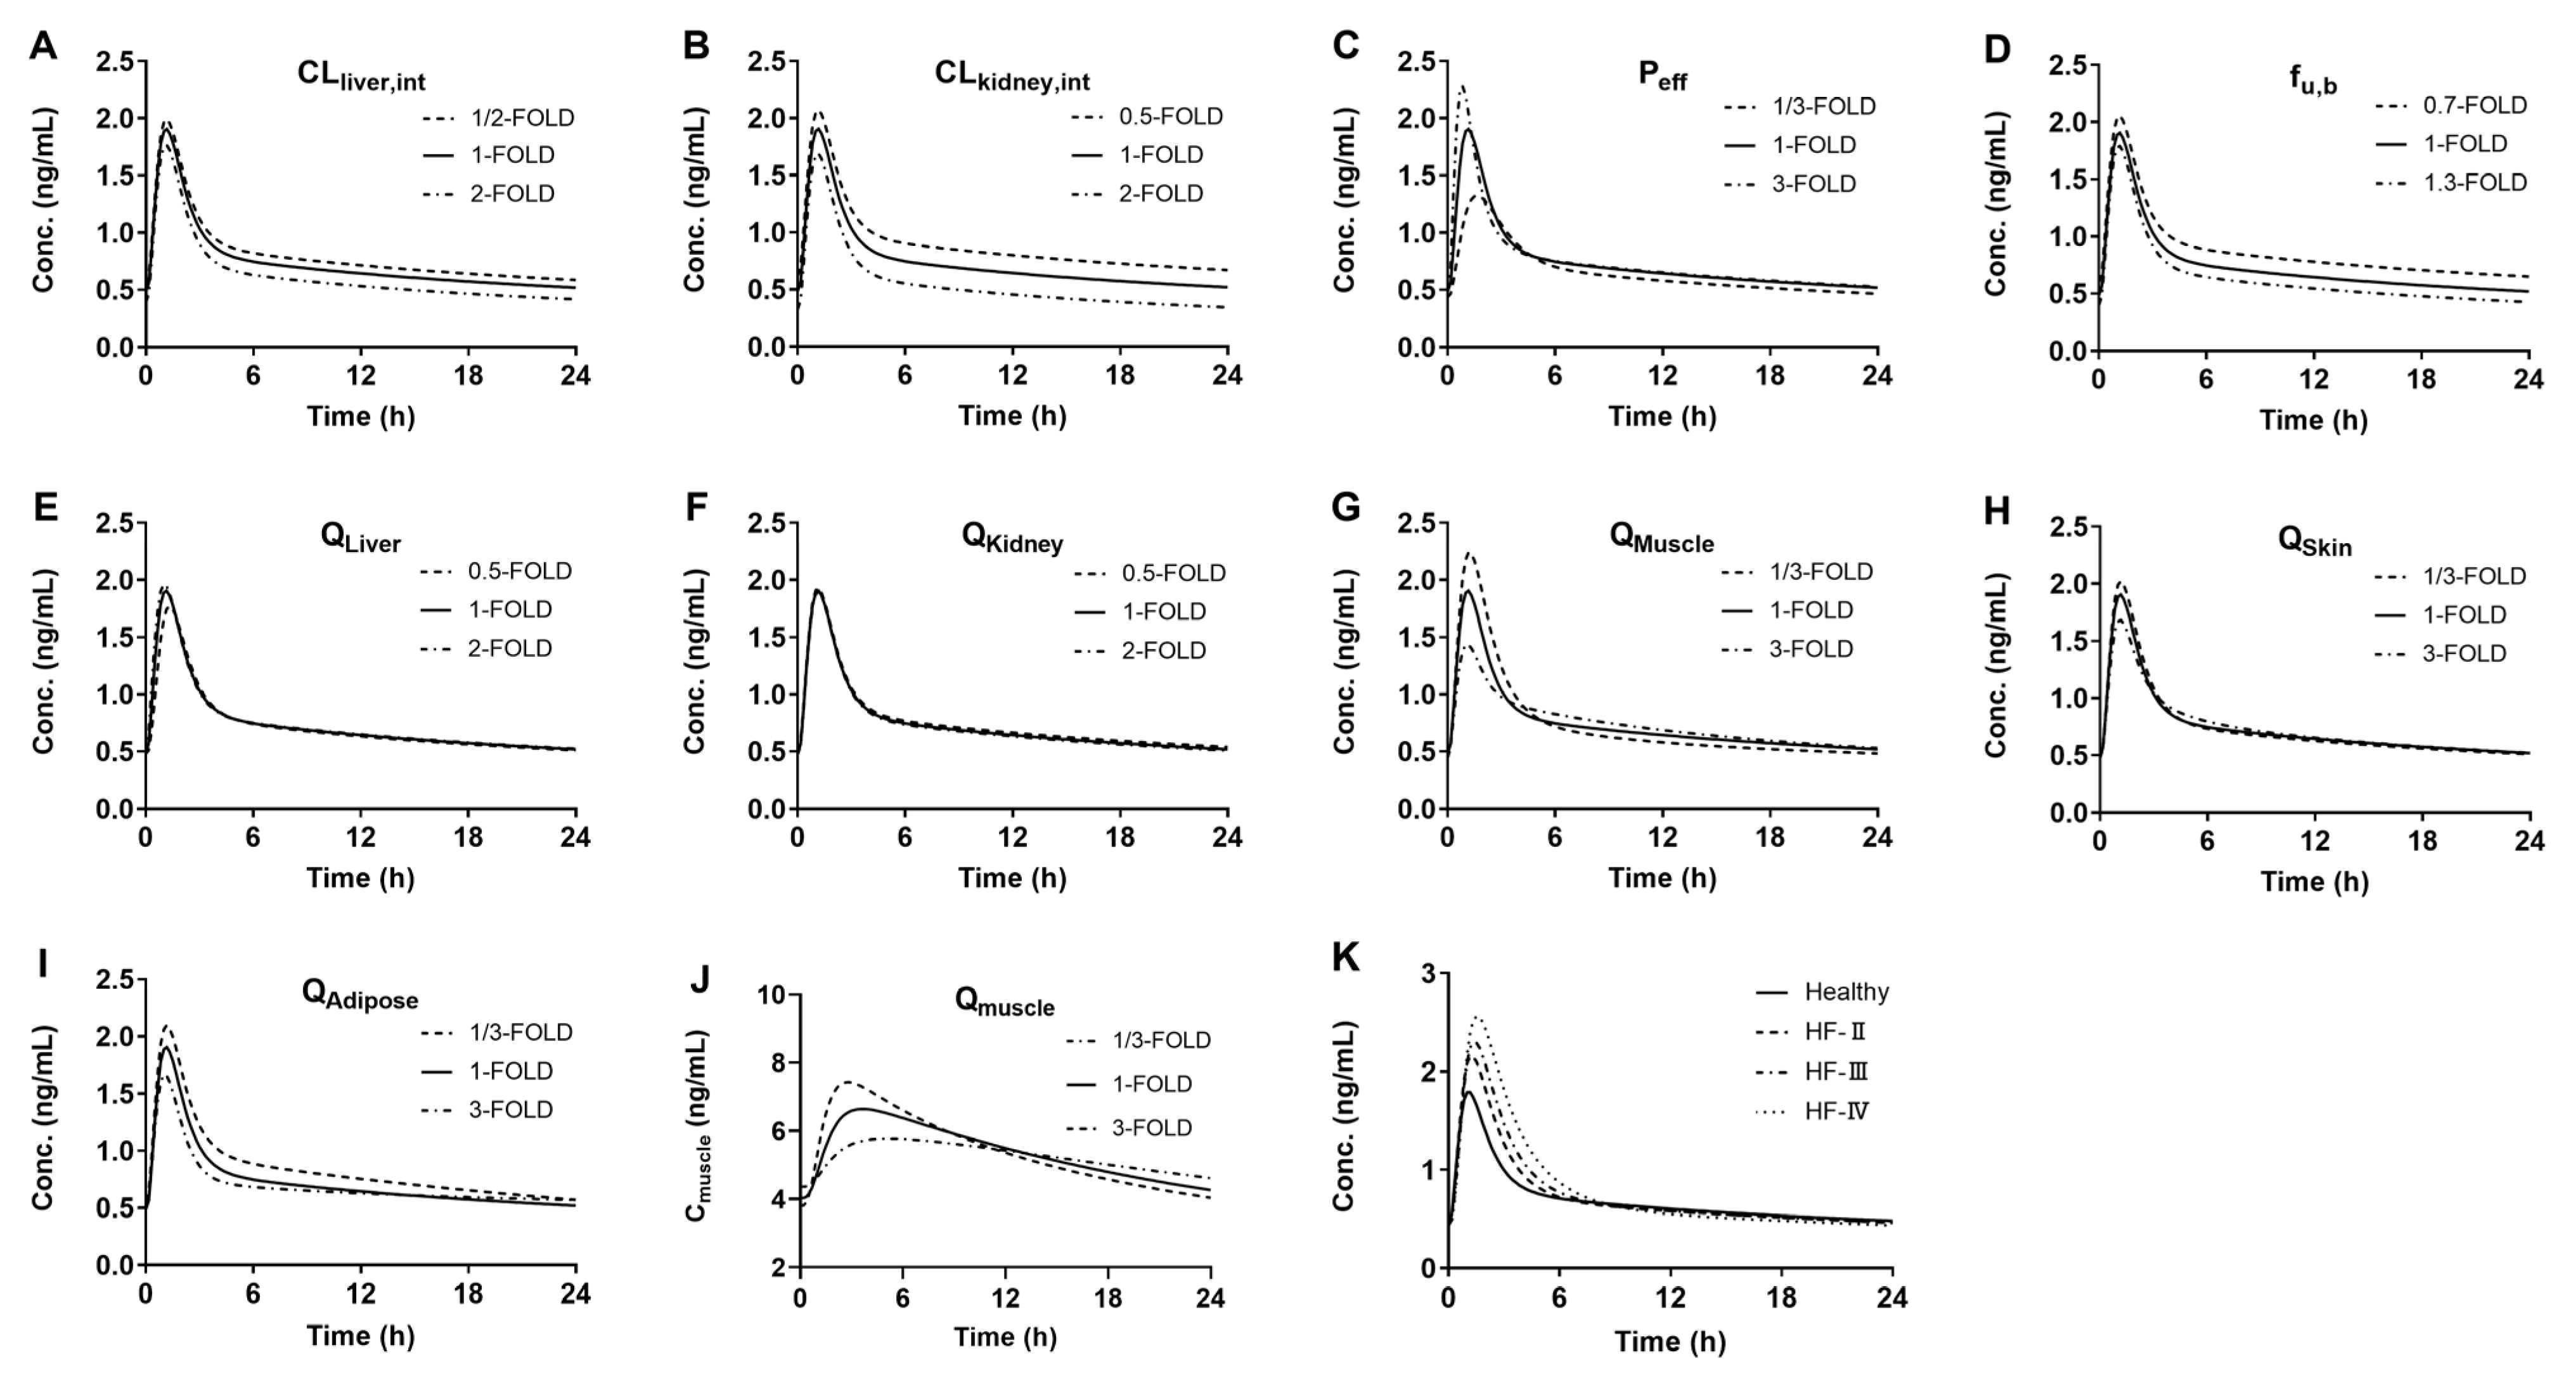
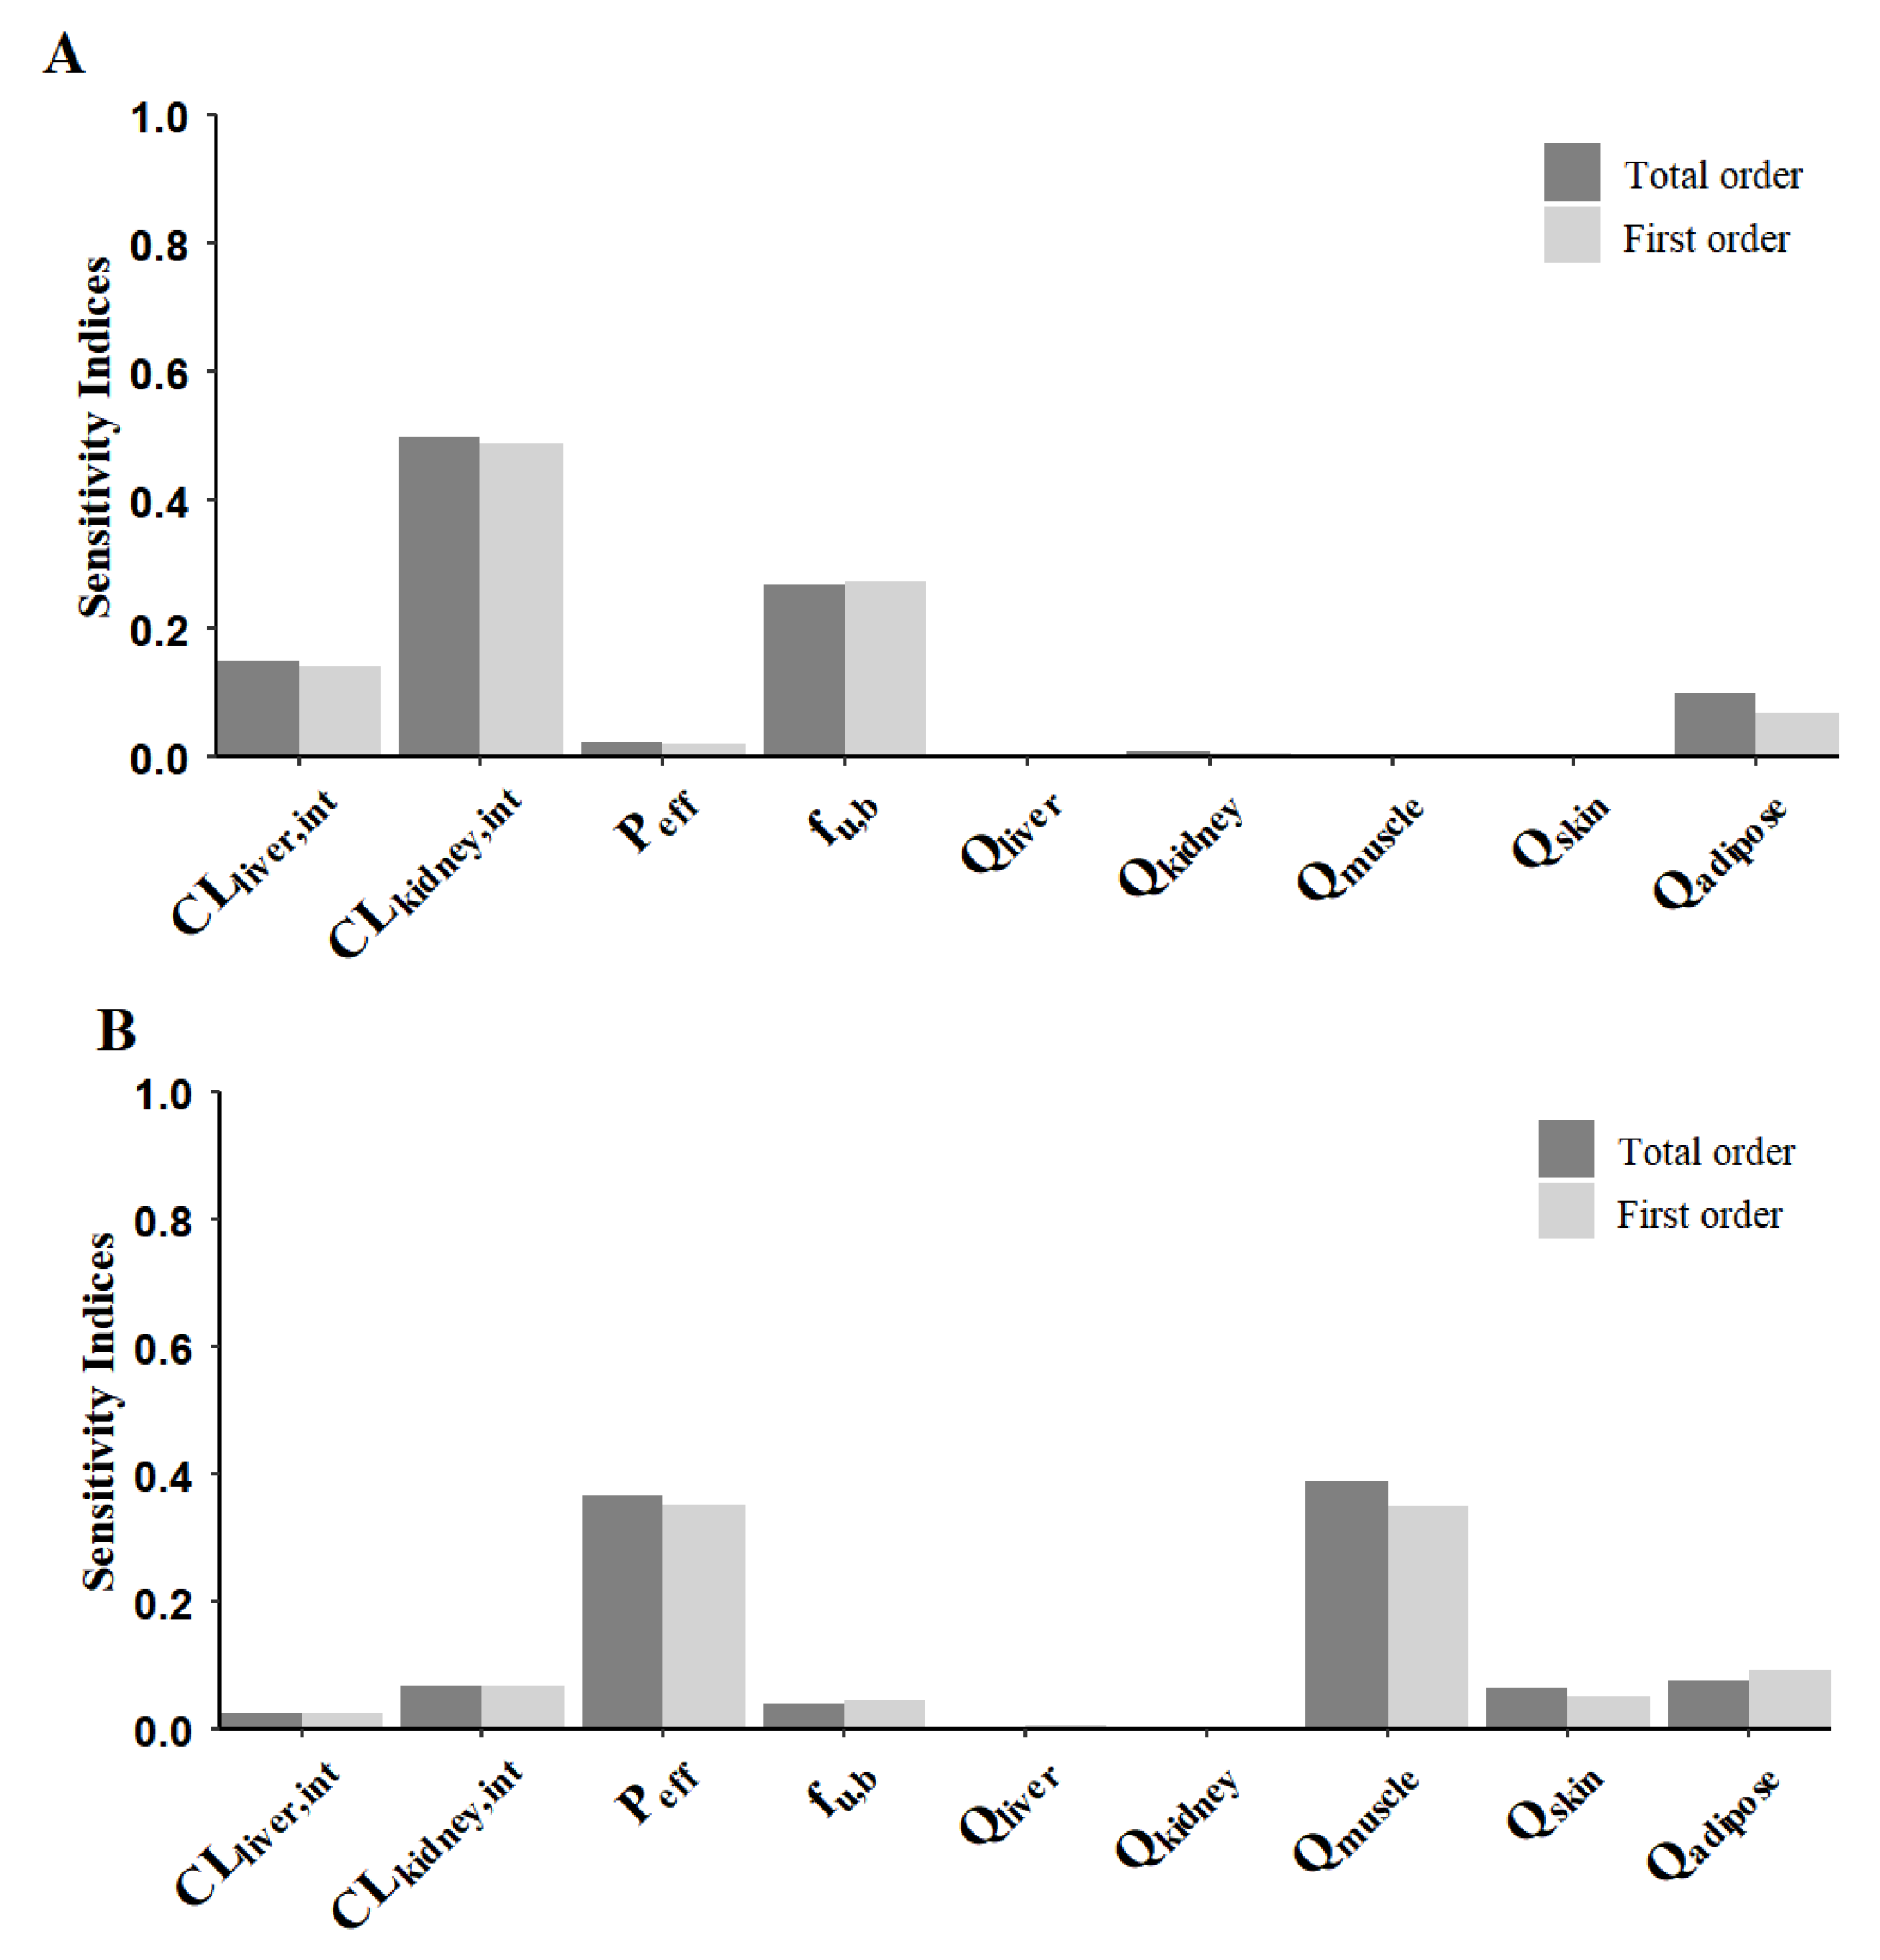
The plasma concentration–time curve of digoxin at steady-state following oral administration of a multidose of digoxin (0.25 mg) was used as an example for pharmacokinetic sensitivity. Local sensitivity analysis was conducted among the parameters potentially influencing drug pharmacokinetics, including CLliver,int, CLkidney,int, Peff, fu,b, QL, QK, QS, QM and QA. Digoxin shows high affinities to skin, muscle, and adipose tissue. A previous study showed that alterations in muscular blood flow remarkably affect disposition [54]. Thus QS, QM, and QA were also selected for sensitivity analysis. Based on the corresponding parameter changes listed in Table 2, the values of QS, QM, and QA were varied by one-/three-fold and three-fold, and the variations of QL and QK were varied by one-/two-fold and two-fold. According to the parameters reported in the literature (CLL and CLK), the calculated variations of CLliver,int and CLkidney,int were mostly within a two-fold range. Therefore, the variation ranges of CLliver,int and CLkidney,int were set to one-/two-fold and two-fold of their original values [55,56]. The reported values of Peff for digoxin in the literature varied widely. Therefore, the Peff value was set to one-/three-fold and three-fold of its original value [55]. The reported fu,p values for digoxin in the literature included 0.61, 0.71, and 0.95, so the variation range of fu,b was set between 0.7-fold and 1.3-fold [9,55,57]. The results show that these measured parameters affected the pharmacokinetic characteristics of the drug to varying degrees (Figure 7). Their contributions to the AUC of digoxin were CLkidney,int > fu,b > CLliver,int > QA > Peff > QM > QS > QL > QK. The sensitivity analysis identified that QM, which is a parameter notably altered in HF, was among the most sensitive parameters governing systemic exposure. Its contribution to the Cmax of digoxin was significant. To elucidate the mechanism underlying this sensitivity, the digoxin concentrations in muscle tissue were further simulated (Figure 7J). The results show that the increase in QM elevated peak digoxin concentration in muscle (Cmuscle), inferring the increases in muscle distribution. On the contrary, reductions in QM decreased peak digoxin concentration in muscle (Cmuscle), inferring the decreases in muscle distribution. These findings may explain why systemic Cmax is negatively related to QM. The effects of HF severity (II, III, and IV) on pharmacokinetic profiles of digoxin at steady-state following multidose of digoxin (0.25 mg) were also analyzed. It was consistent with our expectation that plasma exposure to digoxin increased along with HF severity (Figure 7K).
For further systematic evaluation of the sensitivity of various parameters in the PBPK model on output results, we employed the Sobol global sensitivity analysis (GSA) method to quantitatively calculate first-order sensitivity indices and total order sensitivity indices. This approach utilized variance decomposition techniques, not only enabling the identification of individual parameter effects, but also the revelation of comprehensive contributions from nonlinear interactions between parameters to model outputs. Compared to local sensitivity analysis, this method proved more suitable for parameter prioritization in complex models. The technical implementation was developed within the R language ecosystem (version 4.4.3), utilizing RStudio (version 2024.12.1+563) as the integrated development environment for code development and visualization analysis, with compilation environment configuration completed using RTools 4.4. An efficient sampling strategy was adopted to generate multidimensional parameter combination sample sets. These sampled parameters were subsequently incorporated into the PBPK model for batch simulations, during which core pharmacokinetic metrics (AUC) under different parameter combinations were systematically recorded. Based on the simulation data set, variance decomposition techniques were applied to quantify both types of sensitivity indices. Visualization tools were employed to present parameter sensitivity rankings, and bivariate bar charts were generated to comparatively analyze the independent and synergistic influences of each parameter.
GSA based on the Sobol method demonstrated significant variations in model output sensitivity to specific physiological and pharmacokinetic parameters. As shown in Figure 8, using AUC (A) as a pharmacokinetic parameter, the SI and ST analysis results reveal that CLkidney,int, fu,b, CLliver,int, and QA exerted the most substantial influence on model outputs. CLkidney,int exhibited the highest sensitivity in both SI and ST indices, indicating its dominant role in both independent effects and parameter interaction contributions. Meanwhile Peff, QM, fu,b, QL, and QK displayed relatively low sensitivity. When Cmax (B) was used as the pharmacokinetic parameter, QM and Peff predominated, while the contributions of other parameters were comparable.

3.5. Virtual Simulation for Dose Optimization

The developed PBPK model was further applied to quantify the impact of HF on drug exposure and optimize the individualized dosing regimens. Digoxin was exemplified. It is generally accepted that the plasma toxic threshold level of digoxin is (2.0 ng/mL) [58,59]. The steady-state plasma concentration of digoxin following the recommended dose of digoxin (0.25 mg, qd) was simulated using the developed PBPK model (Figure 9A–C) and Box-Whisker analysis was also documented (Figure 9D,E). The results show that the steady-state Cmax of digoxin increased with HF severity. Further study showed that, according to the recommended dosing regimens (qd, 0.25 mg), the steady-state Cmax of digoxin in over 50% of HF II, III, and IV patients exceeded its toxic threshold (2.0 ng/mL), especially in HF IV patients. The time that concentration of digoxin in HF II, III, and IV patients above 2.0 ng/mL was 0.7 h, 1 h, and 1.7 h, respectively. Clinical practice guidelines for digoxin suggest that serum digoxin levels 0.5–0.9 ng/mL are therapeutic for HF [60]. Moreover, only 43.8% of HF II patients, 44% of HF III patients, and 40.6% of HF IV patients showed concentrations (Cmin) of digoxin over 0.5 ng/mL. These results demonstrate the necessity of dose optimization. To ensure the steady-state Cmax of digoxin in HF patients below the toxicity threshold (2.0 ng/mL) and the steady-state Cmin over the minimum effective concentration (0.5 ng/mL), daily oral doses of digoxin were adjusted to 0.13 mg (bid) for HF II patients, 0.12 mg (bid) for HF III patients, and 0.105 mg (bid) for HF IV patients, respectively. Plasma concentrations of digoxin at steady-state following the adjusted dose regimen were simulated (Figure 9F–H), and Box-Whisker analysis was also documented (Figure 9I,J). Data from Box-Whisker analysis showed that the simulated steady-state Cmax values in all of HF II, III, and IV patients were below 2.0 ng/mL (Figure 9I) and that the simulated steady-state Cmin values in 51.7% of HF II patients, 47.2% of HF III patients, and 36.7% of HF IV patients were over 0.5 ng/mL (Figure 9J) following the adjusted dosing regimen.

4. Discussion

HF, the terminal phase of cardiac disease progression, is characterized by systemic physiological alterations, including reduced cardiac output and compromised tissue perfusion. These pathophysiological changes significantly impact drug pharmacokinetics and clinical efficacy, creating substantial challenges in therapeutic decision-making to balance efficacy and adverse effects. The PBPK model integrates human physiological parameters and drug-specific physicochemical properties, enabling the prediction of drug disposition in HF patients. This approach facilitates optimized dosing strategies to minimize toxicity while maintaining therapeutic effectiveness.
A whole-body PBPK model was developed to simulate drug pharmacokinetics in healthy subjects and HF patients stratified by disease severity. Digoxin, furosemide, bumetanide, torasemide, captopril, valsartan, felodipine, and midazolam served as model drugs. Simulation results demonstrate that most clinical pharmacokinetic observations in healthy and HF patients fell within the 5th–95th percentile ranges derived from 1000 virtual subject simulations. Additionally, most of the predicted AUC and Cmax values exhibited 0.5~2.0-fold deviations from clinical data. These findings demonstrate the successful development of the PBPK model for predicting the pharmacokinetics of the investigated drugs across both healthy and HF populations.
Digoxin, a narrow therapeutic index drug, served as the subject for sensitivity analysis. Sensitivity analysis revealed that intrinsic renal clearance was the dominant parameter governing variability in steady-state digoxin exposure, followed by the unbound fraction in blood. Notably, although renal elimination and biliary elimination are the primary routes for digoxin clearance, alterations in renal or hepatic blood flow slightly affected plasma exposure of digoxin, which is in line with the fact that digoxin has a low renal extraction and a low hepatic extraction. Alterations in muscle blood flow remarkably affect the plasma exposure of digoxin, which may be attributed to digoxin’s high binding affinity for muscle tissue and the extensive volume distribution of muscle.
An important problem for patients with HF is that some drugs (such as digoxin) for the treatment of HF have a relatively low therapeutic index and narrow safety range. Clinical practice guidelines for digoxin suggest that serum digoxin levels of 0.5–0.9 ng/mL are therapeutic for HF, and that higher levels might be harmful [60]. When the serum digoxin level in patients was ≥2.0 ng/mL, the patients often showed high rates of emergency department visits [58]. The mortality rate of HF patients treated with digoxin is related to the concentration of digoxin. The mortality rates of patients with digoxin levels of less than 1.0 ng/mL, 1.1–2.0 ng/mL, 2.1–4.0 ng/mL, and 4.1–6.0 ng/mL, and more than 6.0 ng/mL were reported to be, respectively, 2.0%, 5.0%, 8.6%, 7.9%, and 50% for a four-week period [59]. Simulations show that, according to the clinically recommended regimen of digoxin (0.25 mg, qd), the steady-state Cmax of digoxin in over 50% of HF patients exceeds toxic levels (2 ng/mL) and the steady-state Cmin of digoxin in over 55% of HF patients was below 0.5 ng/mL, demonstrating the necessity of dose regimen adjustment in HF patients. To ensure both a steady-state Cmax below 2 ng/mL and steady-state Cmin over 0.5 ng/mL, the dosage regimens of digoxin for Class II, III, and IV HF patients were optimized using the validated PBPK model. The simulation that it was impossible to ensure both steady-state Cmax below 2 ng/mL and steady-state Cmin over 0.5 ng/mL based on the dose regimen once a day; thus, medication frequency was set to be twice a day. The results show that, according to the adjusted dose regimen of digoxin, steady-state Cmax in all of HF patients were below 2.0 ng/mL. The incidence of subtherapeutic steady-state through concentrations (Cmin < 0.5 ng/mL) were 48.3% in class II, 52.8% in class III, and 63.3% in class IV HF patients under the optimized regimen. These values align with the corresponding incidence rates under the standard clinical regimen (0.25 mg once daily): 56.6% (class II), 56.0% (class III), and 59.4% (class IV). This study uses digoxin, a drug with a narrow therapeutic window, as an example. Its significant pharmacokinetic variability makes precise dosing crucial. Therefore, the optimization strategies and conclusions presented here are primarily applicable to digoxin and other drugs with similarly narrow therapeutic windows. For drugs with wider therapeutic windows, the primary focus of dose adjustment is typically on efficacy maximization rather than avoiding concentration-dependent toxicity; consequently, the reliance on precise dosing is relatively lower.
Unlike previous PBPK models of digoxin, which were primarily established in healthy populations and focused on predicting drug–drug interactions (such as those by Neuhoff et al. (2013) [55] and Moj et al. (2017) [61]), the present study develops a whole-body PBPK model for heart failure patients. Using digoxin as an example, we demonstrate the model’s utility in identifying optimal dosing strategies. This focus on HF pathophysiology reveals that the standard digoxin dose frequently results in subtherapeutic or toxic concentrations in these patients—a critical finding that could not be derived from previous models based on healthy physiology.
However, there are some limitations in the study. While the current model focuses on cardiac output, we acknowledge that it does not capture the full spectrum of inter patient heterogeneity in severe heart failure. Importantly, several critical patient characteristics were crucially omitted from the simulations, including age, gender, body weight, and drug–drug interactions. Furthermore, the absorption model employed in this study did not explicitly incorporate Biopharmaceutics Classification System parameters such as solubility; therefore, it may have limitations in predicting the absorption of poorly soluble drugs. In general, HF often occurs in elderly populations. Elderly populations are often associated with alterations in some physiological parameters, such as reductions in splanchnic blood flow, gastrointestinal motility, lean body mass, total body water, hepatic blood flow, hepatic mass, renal blood flow, and glomerular filtration rate, but also with increases in gastric pH, body fat, and 1-acid glycoprotein levels [62]. These alterations, in turn, influence pharmacokinetics of drugs in older populations. For example, elderly women often showed lower clearances of midazolam, triazolam, and verapamil than young women [63]. Gender also affects the pharmacokinetics of some drugs [63,64], as evidenced by reports that, women were reported to exhibit a higher clearance of midazolam than men [63,65]. In addition, it was assumed that HF only affected alterations in tissue blood flow and cardiac output without affecting other physiological parameters. A report [66] showed that patients with acute heart failure are associated with the thickening of the gastrointestinal wall and decreases in gastrointestinal motility, which may affect intestinal absorption. HF patients are often co-administered with many drugs, which leads to drug interactions.

5. Conclusions

A whole-body PBPK model was developed to predict drug disposition in HF patients across a range of disease severity. The model was applied to optimize the dosing regimen of digoxin as a case study.

Supplementary Materials

The following supporting information can be downloaded at: https://www.mdpi.com/article/10.3390/pharmaceutics17111394/s1. Mass equations [67,68,69]; Description of the tested drugs [6,11,55,70,71,72,73,74,75,76,77,78,79]; Table S1: Physiological parameters used in the PBPK model in healthy subjects (70 kg) [80,81]; Table S2: Physicochemical parameters of drugs used for the PBPK model [5,9,10,29,31,55,56,57,74,75,79,81,82,83,84,85,86,87,88,89,90,91]; Table S3: Clinical information of drugs in the model [5,6,13,14,15,16,17,18,19,20,21,22,23,24,25,26,27,28,29,30,31,32,33,34,35,36,37,38,39,40,41,42,43,44,45,46,47]; Table S4: Observed and predicted values of AUC0-t and Cmax of model drugs in healthy subjects [5,6,21,29,32,48,49,50,51,52,53].

Author Contributions

Conceptualization, W.G.; methodology, W.G.; validation, W.G. and Q.S.; formal analysis, W.G.; investigation, W.G. and Q.S.; resources, W.G.; data curation, W.G.; writing—original draft preparation, W.G.; writing—review and editing, W.G., Q.S. and L.J.; supervision, L.J.; project administration, L.J. All authors have read and agreed to the published version of the manuscript.

Funding

This research received no external funding.

Institutional Review Board Statement

Not applicable.

Informed Consent Statement

Not applicable.

Data Availability Statement

Data is contained within the article.

Acknowledgments

The authors wish to thank Xiaodong Liu and Yanlin Zhao for their helpful advice in writing the English manuscript.

Conflicts of Interest

The authors declare no conflicts of interest.

Abbreviations

The following abbreviations are used in this manuscript:
HFHeart failure
PBPKPhysiologically based pharmacokinetic
AUCArea under the concentration-time curve
CmaxMaximum plasma concentration
GSAGlobal sensitivity analysis
NYHANew York Heart Association
AUCRThe ratio of AUC in HF patients to that in healthy subjects
CmaxRThe ratio of Cmax in HF patients to that in healthy subjects

References

  1. New York Heart Association. Nomenclature and Criteria for Diagnosis of Diseases of the Heart and Great Vessels; Little, Brown: Boston, MA, USA, 1994. [Google Scholar]
  2. Leithe, M.E.; Margorien, R.D.; Hermiller, J.B.; Unverferth, D.V.; Leier, C.V. Relationship between central hemodynamics and regional blood flow in normal subjects and in patients with congestive heart failure. Circulation 1984, 69, 57–64. [Google Scholar] [CrossRef] [PubMed]
  3. Moe, G.W.; Armstrong, P.W. Congestive heart failure. Cmaj 1988, 138, 689–694. [Google Scholar] [PubMed]
  4. Sandek, A.; Bauditz, J.; Swidsinski, A.; Buhner, S.; Weber-Eibel, J.; von Haehling, S.; Schroedl, W.; Karhausen, T.; Doehner, W.; Rauchhaus, M.; et al. Altered intestinal function in patients with chronic heart failure. J. Am. Coll. Cardiol. 2007, 50, 1561–1569. [Google Scholar] [CrossRef] [PubMed]
  5. Patel, I.H.; Soni, P.P.; Fukuda, E.K.; Smith, D.F.; Leier, C.V.; Boudoulas, H. The pharmacokinetics of midazolam in patients with congestive heart failure. Br. J. Clin. Pharmacol. 1990, 29, 565–569. [Google Scholar] [CrossRef]
  6. Kramer, W.G. Pharmacokinetics and pharmacodynamics of torasemide in congestive heart failure. Cardiology 1994, 84 (Suppl. S2), 108–114. [Google Scholar] [CrossRef]
  7. Sager, J.E.; Yu, J.; Ragueneau-Majlessi, I.; Isoherranen, N. Physiologically Based Pharmacokinetic (PBPK) Modeling and Simulation Approaches: A Systematic Review of Published Models, Applications, and Model Verification. Drug Metab. Dispos. 2015, 43, 1823–1837. [Google Scholar] [CrossRef]
  8. Zhuang, X.; Lu, C. PBPK modeling and simulation in drug research and development. Acta Pharm. Sin. B 2016, 6, 430–440. [Google Scholar] [CrossRef]
  9. Rodgers, T.; Rowland, M. Physiologically based pharmacokinetic modelling 2: Predicting the tissue distribution of acids, very weak bases, neutrals and zwitterions. J. Pharm. Sci. 2006, 95, 1238–1257. [Google Scholar] [CrossRef]
  10. Ruark, C.D.; Hack, C.E.; Robinson, P.J.; Mahle, D.A.; Gearhart, J.M. Predicting passive and active tissue:plasma partition coefficients: Interindividual and interspecies variability. J. Pharm. Sci. 2014, 103, 2189–2198. [Google Scholar] [CrossRef]
  11. Rasool, M.F.; Ali, S.; Khalid, S.; Khalid, R.; Majeed, A.; Imran, I.; Saeed, H.; Usman, M.; Ali, M.; Alali, A.S.; et al. Development and evaluation of physiologically based pharmacokinetic drug-disease models for predicting captopril pharmacokinetics in chronic diseases. Sci. Rep. 2021, 11, 8589. [Google Scholar] [CrossRef]
  12. Rasool, M.F.; Khalil, F.; Laer, S. Predicting Stereoselective Disposition of Carvedilol in Adult and Pediatric Chronic Heart Failure Patients by Incorporating Pathophysiological Changes in Organ Blood Flows-A Physiologically Based Pharmacokinetic Approach. Drug Metab. Dispos. 2016, 44, 1103–1115. [Google Scholar] [CrossRef]
  13. Eckermann, G.; Lahu, G.; Nassr, N.; Bethke, T.D. Absence of pharmacokinetic interaction between roflumilast and digoxin in healthy adults. J. Clin. Pharmacol. 2012, 52, 251–257. [Google Scholar] [CrossRef]
  14. Gurley, B.J.; Swain, A.; Williams, D.K.; Barone, G.; Battu, S.K. Gauging the clinical significance of P-glycoprotein-mediated herb-drug interactions: Comparative effects of St. John’s wort, Echinacea, clarithromycin, and rifampin on digoxin pharmacokinetics. Mol. Nutr. Food Res. 2008, 52, 772–779. [Google Scholar] [CrossRef] [PubMed]
  15. Martin, P.D.; Kemp, J.; Dane, A.L.; Warwick, M.J.; Schneck, D.W. No effect of rosuvastatin on the pharmacokinetics of digoxin in healthy volunteers. J. Clin. Pharmacol. 2002, 42, 1352–1357. [Google Scholar] [CrossRef] [PubMed]
  16. Verstuyft, C.; Strabach, S.; El-Morabet, H.; Kerb, R.; Brinkmann, U.; Dubert, L.; Jaillon, P.; Funck-Brentano, C.; Trugnan, G.; Becquemont, L. Dipyridamole enhances digoxin bioavailability via P-glycoprotein inhibition. Clin. Pharmacol. Ther. 2003, 73, 51–60. [Google Scholar] [CrossRef]
  17. Tarral, A.; Francheteau, P.; Guerret, M. Effects of terbinafine on the pharmacokinetics of digoxin in healthy volunteers. Pharmacotherapy 1997, 17, 791–795. [Google Scholar] [CrossRef] [PubMed]
  18. Zhou, H.; Horowitz, A.; Ledford, P.C.; Hubert, M.; Appel-Dingemanse, S.; Osborne, S.; McLeod, J.F. The effects of tegaserod (HTF 919) on the pharmacokinetics and pharmacodynamics of digoxin in healthy subjects. J. Clin. Pharmacol. 2001, 41, 1131–1139. [Google Scholar] [CrossRef]
  19. Hayward, R.P.; Greenwood, H.; Hamer, J. Comparison of digoxin and medigoxin in normal subjects. Br. J. Clin. Pharmacol. 1978, 6, 81–86. [Google Scholar] [CrossRef]
  20. Smith, D.E.; Gee, W.L.; Brater, D.C.; Lin, E.T.; Benet, L.Z. Preliminary evaluation of furosemide-probenecid interaction in humans. J. Pharm. Sci. 1980, 69, 571–575. [Google Scholar] [CrossRef]
  21. Andreasen, F.; Mikkelsen, E. Distribution, elimination and effect of furosemide in normal subjects and in patients with heart failure. Eur. J. Clin. Pharmacol. 1977, 12, 15–22. [Google Scholar] [CrossRef]
  22. Keller, E.; Hoppe-Seyler, G.; Mumm, R.; Schollmeyer, P. Influence of hepatic cirrhosis and end-stage renal disease on pharmacokinetics and pharmacodynamics of furosemide. Eur. J. Clin. Pharmacol. 1981, 20, 27–33. [Google Scholar] [CrossRef]
  23. Hammarlund, M.M.; Paalzow, L.K.; Odlind, B. Pharmacokinetics of furosemide in man after intravenous and oral administration. Application of moment analysis. Eur. J. Clin. Pharmacol. 1984, 26, 197–207. [Google Scholar] [CrossRef]
  24. Andreasen, F.; Christensen, C.K.; Jacobsen, F.K.; Jansen, J.; Mogensen, C.E.; Pedersen, O.L. The individual variation in pharmacokinetics and pharmacodynamics of furosemide in young normal male subjects. Eur. J. Clin. Investig. 1982, 12, 247–255. [Google Scholar] [CrossRef] [PubMed]
  25. Verbeeck, R.K.; Patwardhan, R.V.; Villeneuve, J.P.; Wilkinson, G.R.; Branch, R.A. Furosemide disposition in cirrhosis. Clin. Pharmacol. Ther. 1982, 31, 719–725. [Google Scholar] [CrossRef] [PubMed]
  26. Kelly, M.R.; Cutler, R.E.; Forrey, A.W.; Kimpel, B.M. Pharmacokinetics of orally administered furosemide. Clin. Pharmacol. Ther. 1974, 15, 178–186. [Google Scholar] [CrossRef] [PubMed]
  27. Britz, H.; Hanke, N.; Taub, M.E.; Wang, T.; Prasad, B.; Fernandez, É.; Stopfer, P.; Nock, V.; Lehr, T. Physiologically Based Pharmacokinetic Models of Probenecid and Furosemide to Predict Transporter Mediated Drug-Drug Interactions. Pharm. Res. 2020, 37, 250. [Google Scholar] [CrossRef]
  28. Holazo, A.A.; Colburn, W.A.; Gustafson, J.H.; Young, R.L.; Parsonnet, M. Pharmacokinetics of bumetanide following intravenous, intramuscular, and oral administrations to normal subjects. J. Pharm. Sci. 1984, 73, 1108–1113. [Google Scholar] [CrossRef]
  29. Cook, J.A.; Smith, D.E.; Cornish, L.A.; Tankanow, R.M.; Nicklas, J.M.; Hyneck, M.L. Kinetics, dynamics, and bioavailability of bumetanide in healthy subjects and patients with congestive heart failure. Clin. Pharmacol. Ther. 1988, 44, 487–500. [Google Scholar] [CrossRef]
  30. Lau, H.S.; Hyneck, M.L.; Berardi, R.R.; Swartz, R.D.; Smith, D.E. Kinetics, dynamics, and bioavailability of bumetanide in healthy subjects and patients with chronic renal failure. Clin. Pharmacol. Ther. 1986, 39, 635–645. [Google Scholar] [CrossRef]
  31. Knauf, H.; Mutschler, E. Clinical pharmacokinetics and pharmacodynamics of torasemide. Clin. Pharmacokinet. 1998, 34, 1–24. [Google Scholar] [CrossRef]
  32. Vargo, D.L.; Kramer, W.G.; Black, P.K.; Smith, W.B.; Serpas, T.; Brater, D.C. Bioavailability, pharmacokinetics, and pharmacodynamics of torsemide and furosemide in patients with congestive heart failure. Clin. Pharmacol. Ther. 1995, 57, 601–609. [Google Scholar] [CrossRef]
  33. Duchin, K.L.; Singhvi, S.M.; Willard, D.A.; Migdalof, B.H.; McKinstry, D.N. Captopril kinetics. Clin. Pharmacol. Ther. 1982, 31, 452–458. [Google Scholar] [CrossRef] [PubMed]
  34. Chik, Z.; Basu, R.C.; Pendek, R.; Lee, T.C.; Mohamed, Z. A bioequivalence comparison of two formulations of rifampicin (300- vs 150-mg capsules): An open-label, randomized, two-treatment, two-way crossover study in healthy volunteers. Clin. Ther. 2010, 32, 1822–1831. [Google Scholar] [CrossRef] [PubMed]
  35. Jankowski, A.; Skorek, A.; Krzyśko, K.; Zarzycki, P.K.; Ochocka, R.J.; Lamparczyk, H. Captopril: Determination in blood and pharmacokinetics after single oral dose. J. Pharm. Biomed. Anal. 1995, 13, 655–660. [Google Scholar] [CrossRef] [PubMed]
  36. Kripalani, K.J.; McKinstry, D.N.; Singhvi, S.M.; Willard, D.A.; Vukovich, R.A.; Migdalof, B.H. Disposition of captopril in normal subjects. Clin. Pharmacol. Ther. 1980, 27, 636–641. [Google Scholar] [CrossRef]
  37. Singhvi, S.M.; McKinstry, D.N.; Shaw, J.M.; Willard, D.A.; Migdalof, B.H. Effect of food on the bioavailability of captopril in healthy subjects. J. Clin. Pharmacol. 1982, 22, 135–140. [Google Scholar] [CrossRef]
  38. Creasey, W.A.; Funke, P.T.; McKinstry, D.N.; Sugerman, A.A. Pharmacokinetics of captopril in elderly healthy male volunteers. J. Clin. Pharmacol. 1986, 26, 264–268. [Google Scholar] [CrossRef]
  39. Sioufi, A.; Marfil, F.; Jaouen, A.; Cardot, J.M.; Godbillon, J.; Ezzet, F.; Lloyd, P. The effect of age on the pharmacokinetics of valsartan. Biopharm. Drug Dispos. 1998, 19, 237–244. [Google Scholar] [CrossRef]
  40. Iqbal, M.; Khuroo, A.; Batolar, L.S.; Tandon, M.; Monif, T.; Sharma, P.L. Pharmacokinetics and bioequivalence study of three oral formulations of valsartan 160 mg: A single-dose, randomized, open-label, three-period crossover comparison in healthy Indian male volunteers. Clin. Ther. 2010, 32, 588–596. [Google Scholar] [CrossRef]
  41. Landahl, S.; Edgar, B.; Gabrielsson, M.; Larsson, M.; Lernfelt, B.; Lundborg, P.; Regårdh, C.G. Pharmacokinetics and blood pressure effects of felodipine in elderly hypertensive patients. A comparison with young healthy subjects. Clin. Pharmacokinet. 1988, 14, 374–383. [Google Scholar] [CrossRef]
  42. Bailey, D.G.; Arnold, J.M.; Munoz, C.; Spence, J.D. Grapefruit juice--felodipine interaction: Mechanism, predictability, and effect of naringin. Clin. Pharmacol. Ther. 1993, 53, 637–642. [Google Scholar] [CrossRef]
  43. Larsson, R.; Karlberg, B.E.; Gelin, A.; Aberg, J.; Regårdh, C.G. Acute and steady-state pharmacokinetics and antihypertensive effects of felodipine in patients with normal and impaired renal function. J. Clin. Pharmacol. 1990, 30, 1020–1030. [Google Scholar] [CrossRef]
  44. Hardy, B.G.; Bartle, W.R.; Myers, M.; Bailey, D.G.; Edgar, B. Effect of indomethacin on the pharmacokinetics and pharmacodynamics of felodipine. Br. J. Clin. Pharmacol. 1988, 26, 557–562. [Google Scholar] [CrossRef] [PubMed]
  45. Kharasch, E.D.; Francis, A.; London, A.; Frey, K.; Kim, T.; Blood, J. Sensitivity of intravenous and oral alfentanil and pupillary miosis as minimal and noninvasive probes for hepatic and first-pass CYP3A induction. Clin. Pharmacol. Ther. 2011, 90, 100–108. [Google Scholar] [CrossRef] [PubMed]
  46. Ahonen, J.; Olkkola, K.T.; Neuvonen, P.J. Effect of itraconazole and terbinafine on the pharmacokinetics and pharmacodynamics of midazolam in healthy volunteers. Br. J. Clin. Pharmacol. 1995, 40, 270–272. [Google Scholar] [CrossRef]
  47. Abdlekawy, K.S.; Donia, A.M.; Elbarbry, F. Effects of Grapefruit and Pomegranate Juices on the Pharmacokinetic Properties of Dapoxetine and Midazolam in Healthy Subjects. Eur. J. Drug Metab. Pharmacokinet. 2017, 42, 397–405. [Google Scholar] [CrossRef]
  48. Ohnhaus, E.E.; Vozeh, S.; Nuesch, E. Absorption of digoxin in severe right heart failure. Eur. J. Clin. Pharmacol. 1979, 15, 115–120. [Google Scholar] [CrossRef]
  49. Liu, Z.; Fang, S.; Wang, L.; Zhu, T.; Yang, H.; Yu, S. Clinical study on chronopharmacokinetics of digoxin in patients with congestive heart failure. Curr. Med. Sci. 1998, 18, 21–24. [Google Scholar] [CrossRef]
  50. Müller, F.O.; Middle, M.V.; Schall, R.; Terblanché, J.; Hundt, H.K.; Groenewoud, G. An evaluation of the interaction of meloxicam with frusemide in patients with compensated chronic cardiac failure. Br. J. Clin. Pharmacol. 1997, 44, 393–398. [Google Scholar] [CrossRef]
  51. Shaw, T.R.; Duncan, F.M.; Williams, B.C.; Crichton, E.; Thomson, S.A.; Davis, J.R.; Rademaker, M.; Edwards, C.R. Plasma free captopril concentrations during short and long term treatment with oral captopril for heart failure. Br. Heart J. 1985, 54, 160–165. [Google Scholar] [CrossRef]
  52. Prasad, P.P.; Yeh, C.M.; Gurrieri, P.; Glazer, R.; McLeod, J. Pharmacokinetics of multiple doses of valsartan in patients with heart failure. J. Cardiovasc. Pharmacol. 2002, 40, 801–807. [Google Scholar] [CrossRef] [PubMed]
  53. Rehnqvist, N.; Billing, E.; Moberg, L.; Lundman, T.; Olsson, G. Pharmacokinetics of felodipine and effect on digoxin plasma levels in patients with heart failure. Drugs 1987, 34 (Suppl. S3), 33–42. [Google Scholar] [CrossRef] [PubMed]
  54. Guo, Z.; Gao, J.; Liu, L.; Liu, X. Quantitatively Predicting Effects of Exercise on Pharmacokinetics of Drugs Using a Physiologically Based Pharmacokinetic Model. Drug Metab. Dispos. 2024, 52, 1271–1287. [Google Scholar] [CrossRef] [PubMed]
  55. Neuhoff, S.; Yeo, K.R.; Barter, Z.; Jamei, M.; Turner, D.B.; Rostami-Hodjegan, A. Application of permeability-limited physiologically-based pharmacokinetic models: Part I-digoxin pharmacokinetics incorporating P-glycoprotein-mediated efflux. J. Pharm. Sci. 2013, 102, 3145–3160. [Google Scholar] [CrossRef]
  56. Tsutsumi, K.; Kotegawa, T.; Kuranari, M.; Otani, Y.; Morimoto, T.; Matsuki, S.; Nakano, S. The effect of erythromycin and clarithromycin on the pharmacokinetics of intravenous digoxin in healthy volunteers. J. Clin. Pharmacol. 2002, 42, 1159–1164. [Google Scholar] [CrossRef]
  57. Qian, C.Q.; Zhao, K.J.; Chen, Y.; Liu, L.; Liu, X.D. Simultaneously predict pharmacokinetic interaction of rifampicin with oral versus intravenous substrates of cytochrome P450 3A/P-glycoprotein to healthy human using a semi-physiologically based pharmacokinetic model involving both enzyme and transporter turnover. Eur. J. Pharm. Sci. 2019, 134, 194–204. [Google Scholar] [CrossRef]
  58. See, I.; Shehab, N.; Kegler, S.R.; Laskar, S.R.; Budnitz, D.S. Emergency department visits and hospitalizations for digoxin toxicity: United States, 2005 to 2010. Circ. Heart Fail. 2014, 7, 28–34. [Google Scholar] [CrossRef]
  59. Ordog, G.J.; Benaron, S.; Bhasin, V.; Wasserberger, J.; Balasubramanium, S. Serum digoxin levels and mortality in 5,100 patients. Ann. Emerg. Med. 1987, 16, 32–39. [Google Scholar] [CrossRef]
  60. Yancy, C.W.; Jessup, M.; Bozkurt, B.; Butler, J.; Casey, D.E., Jr.; Drazner, M.H.; Fonarow, G.C.; Geraci, S.A.; Horwich, T.; Januzzi, J.L.; et al. 2013 ACCF/AHA guideline for the management of heart failure: A report of the American College of Cardiology Foundation/American Heart Association Task Force on practice guidelines. Circulation 2013, 128, e240–e327. [Google Scholar] [CrossRef]
  61. Moj, D.; Hanke, N.; Britz, H.; Frechen, S.; Kanacher, T.; Wendl, T.; Haefeli, W.E.; Lehr, T. Clarithromycin, Midazolam, and Digoxin: Application of PBPK Modeling to Gain New Insights into Drug-Drug Interactions and Co-medication Regimens. AAPS J. 2017, 19, 298–312. [Google Scholar] [CrossRef]
  62. Klotz, U. Pharmacokinetics and drug metabolism in the elderly. Drug Metab. Rev. 2009, 41, 67–76. [Google Scholar] [CrossRef]
  63. Cotreau, M.M.; von Moltke, L.L.; Greenblatt, D.J. The influence of age and sex on the clearance of cytochrome P450 3A substrates. Clin. Pharmacokinet. 2005, 44, 33–60. [Google Scholar] [CrossRef]
  64. Wilson, K. Sex-related differences in drug disposition in man. Clin. Pharmacokinet. 1984, 9, 189–202. [Google Scholar] [CrossRef]
  65. Hu, Z.Y.; Zhao, Y.S. Sex-dependent differences in cytochrome P450 3A activity as assessed by midazolam disposition in humans: A meta-analysis. Drug Metab. Dispos. 2010, 38, 817–823. [Google Scholar] [CrossRef] [PubMed]
  66. Hao, R.; Zheng, Y.; Zhao, Q.; Chen, J.; Fan, R.; Chen, P.; Yin, N.; Qin, H. Evaluation value of ultrasound on gastrointestinal function in patients with acute heart failure. Front. Cardiovasc. Med. 2024, 11, 1475920. [Google Scholar] [CrossRef] [PubMed]
  67. Edginton, A.N.; Willmann, S. Physiology-based simulations of a pathological condition: Prediction of pharmacokinetics in patients with liver cirrhosis. Clin. Pharmacokinet. 2008, 47, 743–752. [Google Scholar] [CrossRef] [PubMed]
  68. Yu, L.X.; Amidon, G.L. A compartmental absorption and transit model for estimating oral drug absorption. Int. J. Pharm. 1999, 186, 119–125. [Google Scholar] [CrossRef]
  69. Gertz, M.; Houston, J.B.; Galetin, A. Physiologically based pharmacokinetic modeling of intestinal first-pass metabolism of CYP3A substrates with high intestinal extraction. Drug Metab. Dispos. 2011, 39, 1633–1642. [Google Scholar] [CrossRef]
  70. Scalese, M.J.; Salvatore, D.J. Role of Digoxin in Atrial Fibrillation. J. Pharm. Pract. 2017, 30, 434–440. [Google Scholar] [CrossRef]
  71. Lainscak, M.; Vitale, C.; Seferovic, P.; Spoletini, I.; Cvan Trobec, K.; Rosano, G.M. Pharmacokinetics and pharmacodynamics of cardiovascular drugs in chronic heart failure. Int. J. Cardiol. 2016, 224, 191–198. [Google Scholar] [CrossRef]
  72. Solanki, D.; Choudhary, S.; Vora, A.; Ghose, T.; Mantri, R.R.; Modi, N.; Sawhney, J.; Singhal, A.; Kumar, A.; Edakutty, R.; et al. Loop Diuretics Unique Mechanism of Action. J. Assoc. Physicians India 2024, 72, 14–15. [Google Scholar] [CrossRef]
  73. Ponto, L.L.; Schoenwald, R.D. Furosemide (frusemide). A pharmacokinetic/pharmacodynamic review (Part I). Clin. Pharmacokinet. 1990, 18, 381–408. [Google Scholar] [CrossRef]
  74. Chapa, R.; Li, C.Y.; Basit, A.; Thakur, A.; Ladumor, M.K.; Sharma, S.; Singh, S.; Selen, A.; Prasad, B. Contribution of Uptake and Efflux Transporters to Oral Pharmacokinetics of Furosemide. ACS Omega 2020, 5, 32939–32950. [Google Scholar] [CrossRef] [PubMed]
  75. Donovan, M.D.; Abduljalil, K.; Cryan, J.F.; Boylan, G.B.; Griffin, B.T. Application of a physiologically-based pharmacokinetic model for the prediction of bumetanide plasma and brain concentrations in the neonate. Biopharm. Drug Dispos. 2018, 39, 125–134. [Google Scholar] [CrossRef] [PubMed]
  76. Brogden, R.N.; Todd, P.A.; Sorkin, E.M. Captopril. An update of its pharmacodynamic and pharmacokinetic properties, and therapeutic use in hypertension and congestive heart failure. Drugs 1988, 36, 540–600. [Google Scholar] [CrossRef] [PubMed]
  77. Michel, M.C.; Foster, C.; Brunner, H.R.; Liu, L. A systematic comparison of the properties of clinically used angiotensin II type 1 receptor antagonists. Pharmacol. Rev. 2013, 65, 809–848. [Google Scholar] [CrossRef]
  78. Yedinak, K.C.; Lopez, L.M. Felodipine: A new dihydropyridine calcium-channel antagonist. Dicp 1991, 25, 1193–1206. [Google Scholar] [CrossRef]
  79. Salem, F.; Nimavardi, A.; Mudunuru, J.; Tompson, D.; Bloomer, J.; Turner, D.B.; Taskar, K.S. Physiologically based pharmacokinetic modeling for development and applications of a virtual celiac disease population using felodipine as a model drug. CPT Pharmacomet. Syst. Pharmacol. 2023, 12, 808–820. [Google Scholar] [CrossRef]
  80. Kong, W.M.; Sun, B.B.; Wang, Z.J.; Zheng, X.K.; Zhao, K.J.; Chen, Y.; Zhang, J.X.; Liu, P.H.; Zhu, L.; Xu, R.J.; et al. Physiologically based pharmacokinetic-pharmacodynamic modeling for prediction of vonoprazan pharmacokinetics and its inhibition on gastric acid secretion following intravenous/oral administration to rats, dogs and humans. Acta Pharmacol. Sin. 2020, 41, 852–865. [Google Scholar] [CrossRef]
  81. Yang, Y.; Li, P.; Zhang, Z.; Wang, Z.; Liu, L.; Liu, X. Prediction of Cyclosporin-Mediated Drug Interaction Using Physiologically Based Pharmacokinetic Model Characterizing Interplay of Drug Transporters and Enzymes. Int. J. Mol. Sci. 2020, 21, 7023. [Google Scholar] [CrossRef]
  82. Jeong, S.H.; Jang, J.H.; Lee, Y.B. Torsemide Pharmacometrics in Healthy Adult Populations Including CYP2C9 Genetic Polymorphisms and Various Patient Groups through Physiologically Based Pharmacokinetic-Pharmacodynamic Modeling. Pharmaceutics 2022, 14, 2720. [Google Scholar] [CrossRef]
  83. McPherson, S.; Perrier, J.; Dunn, C.; Khadra, I.; Davidson, S.; Ainousah, B.; Wilson, C.G.; Halbert, G. Small scale design of experiment investigation of equilibrium solubility in simulated fasted and fed intestinal fluid. Eur. J. Pharm. Biopharm. 2020, 150, 14–23. [Google Scholar] [CrossRef]
  84. Fuhr, L.M.; Marok, F.Z.; Mees, M.; Mahfoud, F.; Selzer, D.; Lehr, T. A Physiologically Based Pharmacokinetic and Pharmacodynamic Model of the CYP3A4 Substrate Felodipine for Drug-Drug Interaction Modeling. Pharmaceutics 2022, 14, 1474. [Google Scholar] [CrossRef] [PubMed]
  85. Schlender, J.F.; Meyer, M.; Thelen, K.; Krauss, M.; Willmann, S.; Eissing, T.; Jaehde, U. Development of a Whole-Body Physiologically Based Pharmacokinetic Approach to Assess the Pharmacokinetics of Drugs in Elderly Individuals. Clin. Pharmacokinet. 2016, 55, 1573–1589. [Google Scholar] [CrossRef] [PubMed]
  86. Poirier, A.; Cascais, A.C.; Funk, C.; Lavé, T. Prediction of pharmacokinetic profile of valsartan in human based on in vitro uptake transport data. J. Pharmacokinet. Pharmacodyn. 2009, 36, 585–611. [Google Scholar] [CrossRef] [PubMed]
  87. Pandey, M.M.; Jaipal, A.; Kumar, A.; Malik, R.; Charde, S.Y. Determination of pK(a) of felodipine using UV-Visible spectroscopy. Spectrochim. Acta A Mol. Biomol. Spectrosc. 2013, 115, 887–890. [Google Scholar] [CrossRef] [PubMed]
  88. Hanke, N.; Frechen, S.; Moj, D.; Britz, H.; Eissing, T.; Wendl, T.; Lehr, T. PBPK Models for CYP3A4 and P-gp DDI Prediction: A Modeling Network of Rifampicin, Itraconazole, Clarithromycin, Midazolam, Alfentanil, and Digoxin. CPT Pharmacomet. Syst. Pharmacol. 2018, 7, 647–659. [Google Scholar] [CrossRef]
  89. Schwartz, S.; Brater, D.C.; Pound, D.; Green, P.K.; Kramer, W.G.; Rudy, D. Bioavailability, pharmacokinetics, and pharmacodynamics of torsemide in patients with cirrhosis. Clin. Pharmacol. Ther. 1993, 54, 90–97. [Google Scholar] [CrossRef]
  90. Flesch, G.; Müller, P.; Lloyd, P. Absolute bioavailability and pharmacokinetics of valsartan, an angiotensin II receptor antagonist, in man. Eur. J. Clin. Pharmacol. 1997, 52, 115–120. [Google Scholar] [CrossRef]
  91. Rowland Yeo, K.; Walsky, R.L.; Jamei, M.; Rostami-Hodjegan, A.; Tucker, G.T. Prediction of time-dependent CYP3A4 drug-drug interactions by physiologically based pharmacokinetic modelling: Impact of inactivation parameters and enzyme turnover. Eur. J. Pharm. Sci. 2011, 43, 160–173. [Google Scholar] [CrossRef]
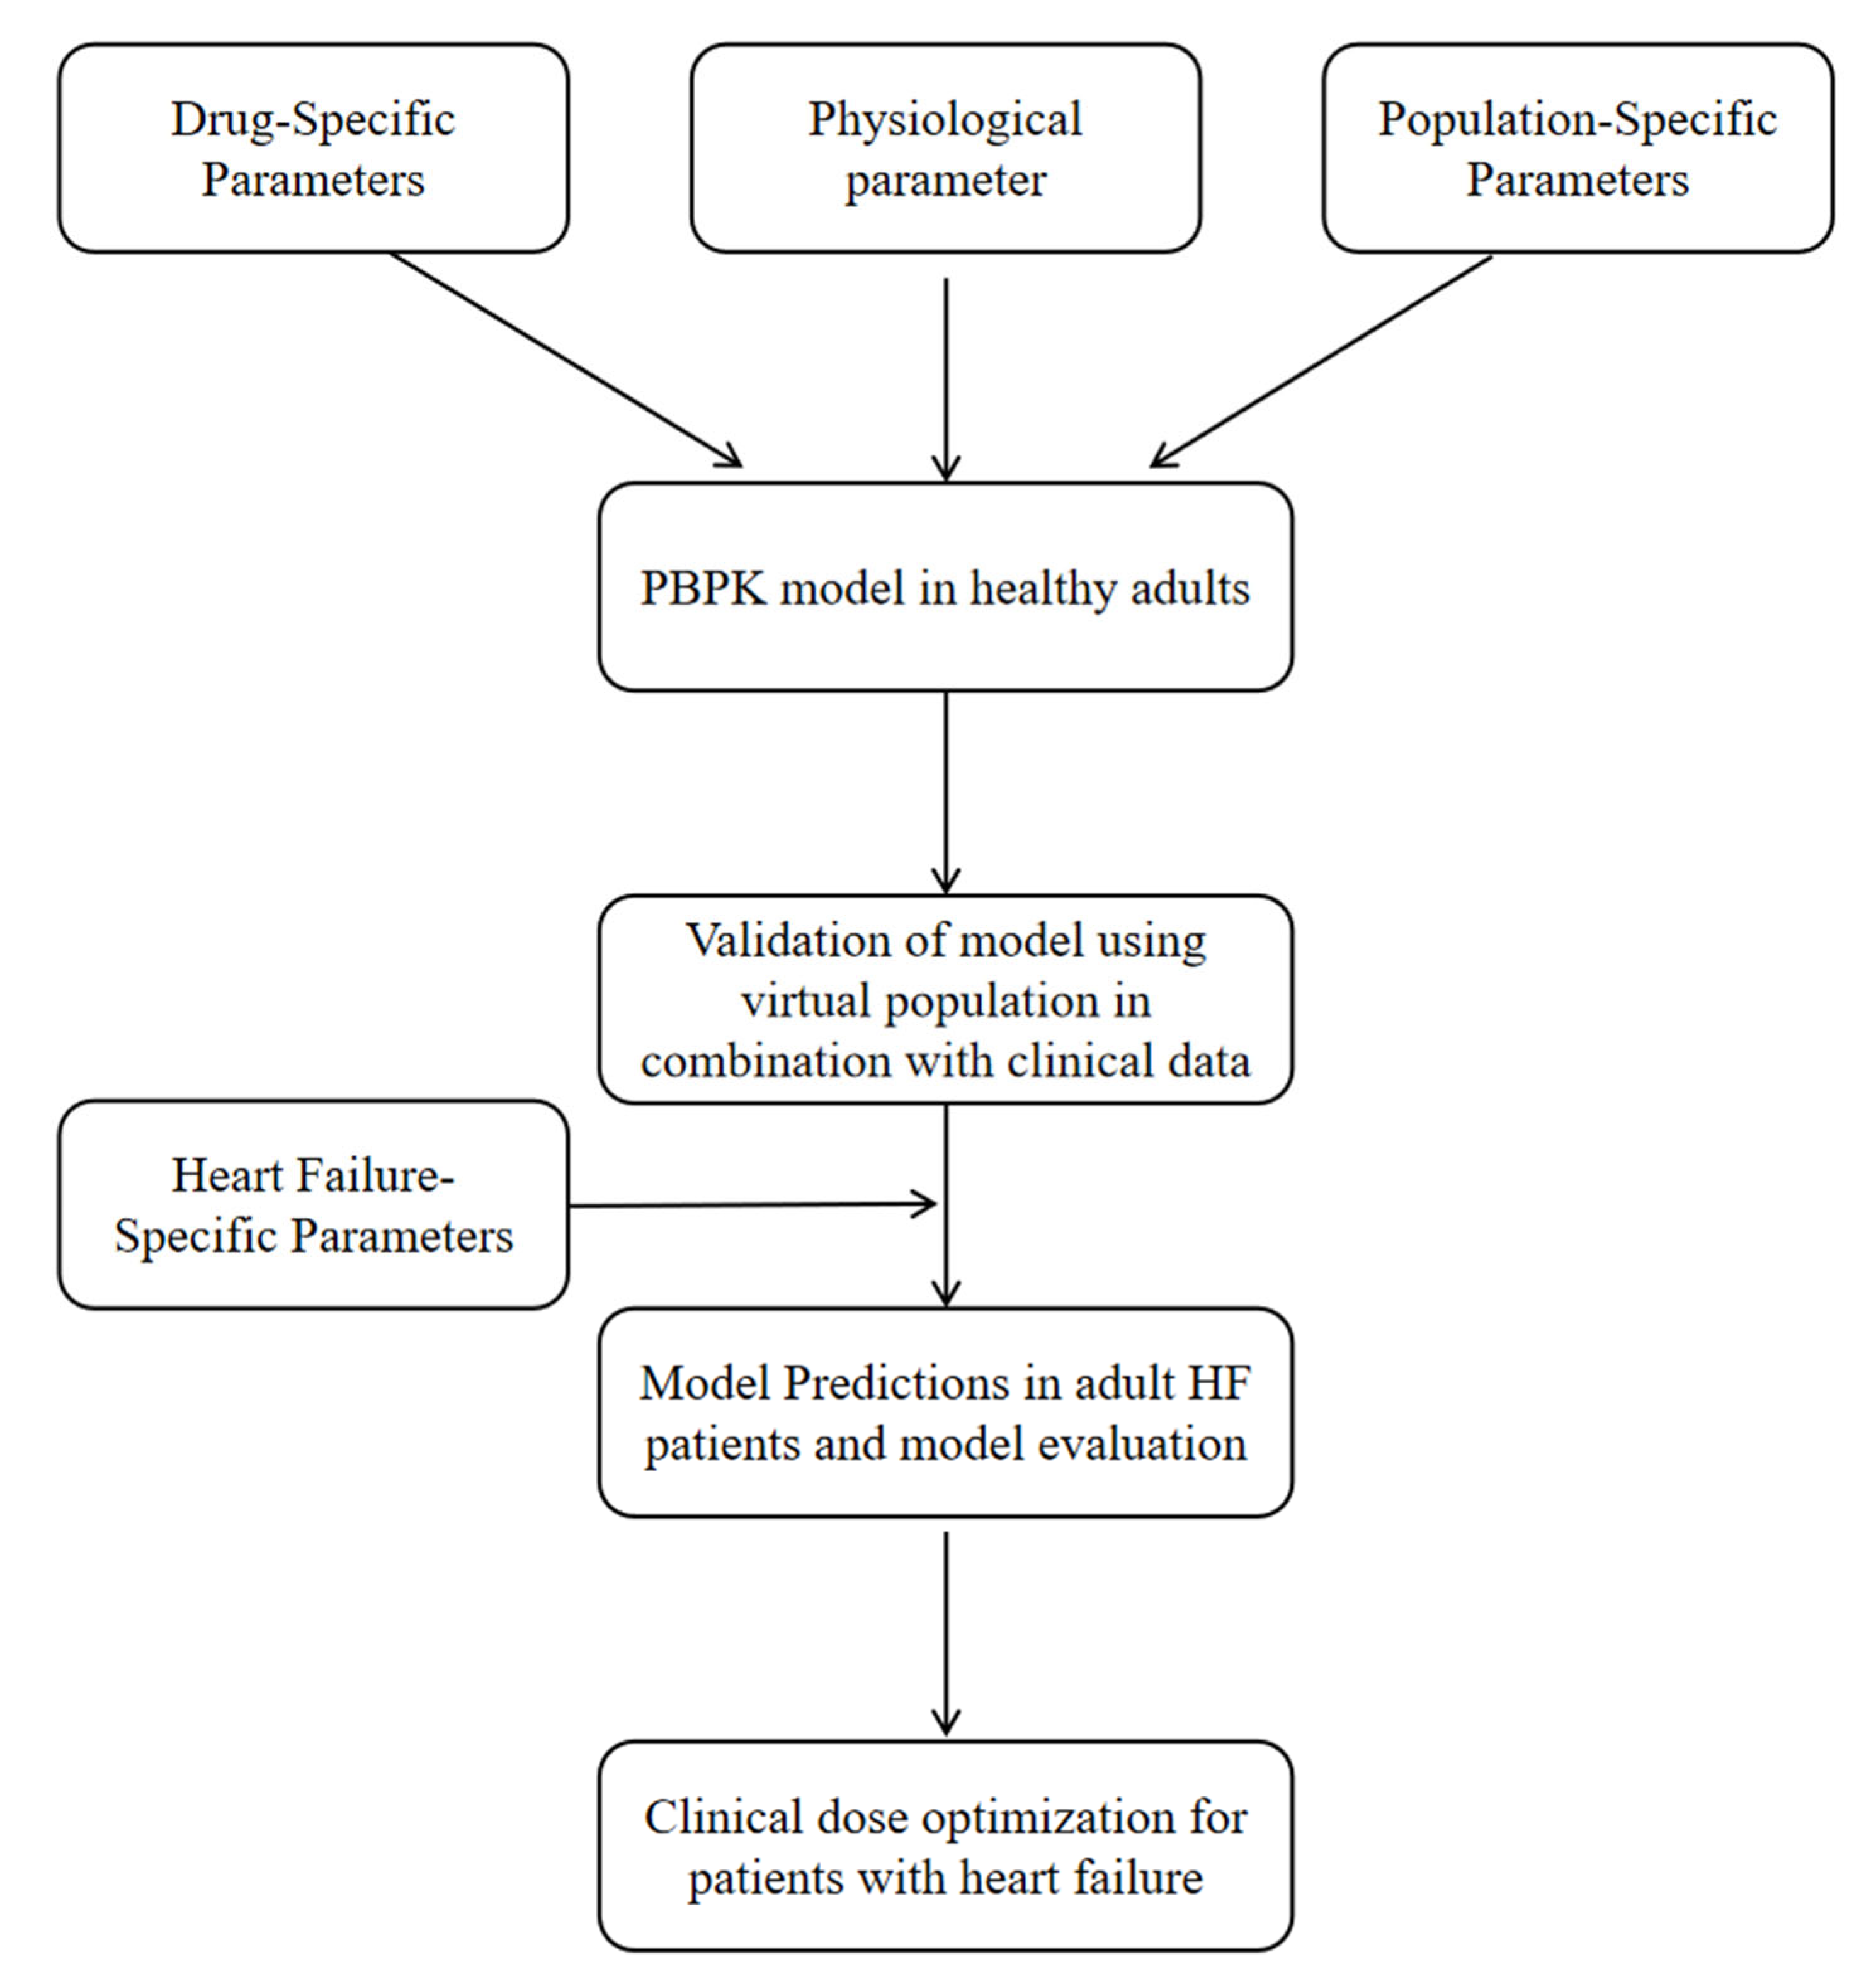
Figure 1. Workflow for PBPK model development and application. A PBPK model was developed and validated using clinical pharmacokinetic data from healthy subjects. The model was then adapted to HF patients by incorporating disease-specific physiological parameters, and was validated against pharmacokinetic data from HF patients. Finally, the validated model was employed to optimize dosing regimens in HF patients.
Pharmaceutics 17 01394 g001
Figure 2. Structure of the PBPK model. Q, blood flow; kai, constant of absorption rate; Kt,0, constant of gastric emptying rate; Kt,i, constant of intestinal transit rate; CLli, hepatic clearance; CLK, renal clearance; CLGwi, intestinal clearance (duodenum, jejunum and ileum). The gray-shaded areas indicate the tissues and organs that demonstrate blood-flow alterations in HF patients.
Pharmaceutics 17 01394 g002
Figure 3. The observed (points) and predicted (lines) plasma concentrations of the tested drugs following intravenous or oral administration to healthy subjects. Digoxin following oral 0.25 mg (A) [13,14], 0.5 mg (B) [15,16], 0.75 mg (C) [17], and 1 mg (D) [18,19]; furosemide following intravenous 40 mg (E) [20,21,22,23], 80 mg (F) [24,25,26], and oral 20 mg (G) [27]; bumetanide following oral 1 mg (H) [28], 3 mg (I) [29], and 5 mg (J) [30], and intravenous 1 mg (K) [28], 3 mg/3 min (L) [29], and 5 mg/3 min (M) [30]; torasemide following oral 5 mg (N) [31] and 10 mg (O) [6,32]; captopril following oral 10 mg (P) [33], 25 mg (Q) [34,35], and 100 mg (R) [36,37,38]; valsartan following oral 80 mg (S) [39] and 160 mg (T) [40]; felodipine following oral 5 mg (U) [41,42] and 10 mg (V) [43,44]; midazolam following oral 3 mg (W) [45] and 7.5 mg (X) [5,46,47]. Solid line: 50th percentile of simulated plasma concentrations; Shadow: 5th–95th interval of the simulated plasma concentrations.
Pharmaceutics 17 01394 g003
Figure 4. The observed (points) and predicted (lines) plasma concentrations of the tested drugs following intravenous or oral administration to HF patients. Digoxin following oral 0.1 mg (A) [48], 0.25 mg (B) [49]; furosemide following oral 40 mg (C) [50] and 120 mg (D) [32], and intravenous 120 mg (E) [32] and 40 mg (F) [21]; bumetanide following oral 3 mg (G) [29] and intravenous 3 mg/3 min (H) [29]; torasemide following oral 10 mg (I) [6,32]; captopril following oral 25 mg (J) [51]; valsartan following oral 40 mg (K) [52], 80 mg (L) [52], and 160 mg (M) [52]; felodipine following oral 5 mg and (N) [53] 10 mg (O) [53]; midazolam following oral 7.5 mg (P) [5]. Solid line: 50th percentile of simulated plasma concentrations; Shadow: 5th–95th interval of the simulated plasma concentrations.
Pharmaceutics 17 01394 g004
Figure 5. Comparison of the predicted AUC (A) and Cmax (B) with observations in healthy subjects (hollow circle) and HF patients (hollow triangle). Solid and dotted lines, respectively, represent unity; the predicted values are within 0.5~2.0-fold range of the observed data, and most are within the more stringent 0.8~1.25-fold range.
Pharmaceutics 17 01394 g005
Figure 6. The predicted AUCR/observed AUCR (AF) and the predicted CmaxR/observed CmaxR (GK) for the tested 8 drugs in HF patients. AUCR of (A) Digoxin; (B) furosemide; (C) bumetanide; (D) torasemide; (E) valsartan; (F) felodipine; (G) midazolam. CmaxR of (H) Digoxin; (I) bumetanide; (J) torasemide; (K) valsartan; (L) felodipine; (M) midazolam. The solid and hollow squares correspond to the observed and predicted values, respectively.
Pharmaceutics 17 01394 g006
Figure 7. Local sensitivity analysis (AI) for corresponding parameters on pharmacokinetic profiles of digoxin at steady-state following oral digoxin (0.25 mg). CLliver,int (A), CLkidney,int (B), Peff (C), fu,b (D), QL (E), QK (F), QM (G), QS (H), QA (I), intramuscular drug concentration (J), HF severity (K).
Pharmaceutics 17 01394 g007
Figure 8. Sobol global sensitivity analysis on AUC (A) and Cmax (B).
Pharmaceutics 17 01394 g008
Figure 9. The simulated steady-state plasma concentrations of digoxin following multidose of digoxin to HF II, HF III, and HF IV patients using the developed PBPK model. Plasma concentrations of digoxin following the recommended dosing regimens (qd, 0.25 mg) to (A) HF II, (B) HF III, and (C) HF IV patients; Box-Whisker analysis of digoxin steady-state (D) Cmax and (E) Cmin. Plasma concentrations of digoxin according to the adjusted dosage regimens in (F) HF II (0.13 mg, Bid), (G) HF III (0.12 mg, Bid), and (H) HF IV patients (0.105 mg, Bid); Box–Whisker analysis of digoxin steady-state (I) Cmax and (J) Cmin. Shadow: 5th–95th interval of the simulated plasma concentrations.
Pharmaceutics 17 01394 g009
Table 1. Blood-flow rates of different tissues and organs in different degrees of HF (70 kg).
Heart Failure Class
Blood Flow
(mL/min)
II GradeIII GradeIV Grade
Lung4399.583610.123378.28
Muscle427.5330210
Adipose148.2114.472.8
Skin17113284
Kidney967.2682781.2
Liver228162138
Spleen60.843.236.8
Stomach28.8820.5217.48
Duodenum89.6863.7254.28
Jejunum313.88223.02189.98
Ileum185.44131.76112.24
Cecum33.4423.7620.24
Colon213.56151.74129.26
Heart a240240240
Brain a700700700
ROB a592592592
a With unchanged blood-flow velocity.
Table 2. Observed and predicted values of AUC0-t and Cmax of model drugs in HF patients.
DrugDoseSubjectsAUC0-t (μg × h/mL)Cmax (ng/mL)
ObsPreObs/PreObsPreObs/Pre
digoxin0.1 mg a [48]HF-IVNR0.0067/1.100.931.18
0.25 mg b [49]HF-III0.0240.0201.21.722.460.70
furosemide40 mg a, i.v [32]HF-III7.985.781.38///
120 mg a, i.v [21]HF-IV18.0217.361.04///
40 mg a [50]HF-II3.963.921.0111241057.701.06
120 mg a [32]HF-IV10.9911.780.93NR3173.23/
bumetanide3 mg a [29]HF-IV0.280.300.8510796.361.11
3 mg,3 min a, i.v [29]HF-IV0.330.331///
torasemide10 mg b [6]HF-II7.694.351.7711591008.501.15
10 mg c [32]HF-II4.804.351.115001008.501.49
captopril25 mg [51]HF-IVNR0.32/NR248.68/
valsartan40 mg d [52]HF-III13.1210.861.2119401359.911.43
80 mg d [52]HF-III25.9421.721.1939502719.871.45
160 mg d [52]HF-III43.5443.45164005439.701.18
felodipine5 mg d [53]HF-II0.0160.0131.234.072.651.54
10 mg d [53]HF-II0.0370.0261.426.265.291.18
midazolam7.5 mg a [5]HF-IV0.150.101.507646.921.62
Specific time of AUC0-t: a: AUC0-∞; b: 24 h; c: 36 h; d: 12 h.
Disclaimer/Publisher’s Note: The statements, opinions and data contained in all publications are solely those of the individual author(s) and contributor(s) and not of MDPI and/or the editor(s). MDPI and/or the editor(s) disclaim responsibility for any injury to people or property resulting from any ideas, methods, instructions or products referred to in the content.